1. Introduction
Agricultural aviation plays an important role in promoting the modernization of agriculture [
1,
2]. In recent years, China’s agricultural aviation industry has developed rapidly, the technology of UAVs used for plant protection has been continuously improved, and their applications in low-altitude and low-volume plant protection have continued to increase [
3,
4,
5,
6,
7]. UAV technology provides high operation efficiency, low operation cost, fast response to diseases and insect pests, and broad applicability that is unrestricted by geographical area and crop growth and is harmless to crops [
8,
9,
10]. It is gradually becoming the first choice for plant-protection operations [
11,
12,
13,
14,
15].
With the widespread application of multirotor UAVs to plant protection in China, the efficient application of UAVs has become increasingly important. To improve the pesticide application efficiency of UAVs, the characteristics of rotary-wing plant-protection UAVs have been investigated [
16,
17,
18,
19,
20,
21,
22,
23,
24]. Li et al. pointed out that the existence of rotor airflow is a typical feature of the field operation of multirotor UAVs used for plant protection and that the current field operation of multirotor UAVs must be urgently studied in terms of operation system and mechanism [
25]. Yang et al. established a three-dimensional mathematical model of the downwash airflow and studied the spray width range of droplets with different particle sizes and the movement law in the wind field [
23]. Yang et al. studied the influence of the downwash airflow of a UAV on the spray width, and the results showed that the flow velocity difference of the downwash air from the center to the outside can increase the spray width, which is an important parameter for the design of the UAV spray system and the aviation plant-protection operation parameters [
24]. When drones are spraying pesticides, the deposition position of pesticides is inconsistent with the location of drones. Fan Gangao et al. conducted a study on the airflow characteristics of UAV operations, showing that when the rotor airflow reaches the crop surface, the area of action of the airflow is behind the UAV, which makes it difficult to apply pesticides to the accurate area when UAV spraying [
26]. Li Longlong et al. conducted research on the influence of flight speed on droplet deposition and distribution, showing that there is obvious agricultural drift in pesticide application by drones, which leads to the diffusion and loss of pesticides [
27]. Therefore, in order to improve the utilization rate of agriculture and precisely control the spraying, it is necessary to control the flight state of the UAV.
During UAV operation, the movement of pesticide droplets is affected by the downwash airflow of the rotor, and the droplets follow the airflow and act on the stems and leaves of the crops. The interaction between the rotor airflow and crop stems and leaves forms a wind vortex, and the wind-vortex area is the deposition area of fog droplets on the crop. Guo et al. studied the relationship between the wind-vortex characteristics formed under the flight parameters of the multirotor UAV and droplet deposition [
17]. The results showed that the wind-vortex characteristics have a significant impact on droplet deposition. The wind-vortex shape improves the deposition amount, uniformity, and penetration of spraying. Furthermore, exploring the relationship between the wind vortex and UAV-flight parameters can help to achieve precise control of droplet deposition and improve spraying efficiency. Tian et al. studied the action law of plant-protection UAV downwash on crop canopy, obtained the linear relationship between the wind-vortex lag distance and flight velocity at an altitude of 2 m, and found that a certain velocity can effectively promote the flight penetration of droplets [
28]. This study shows that the UAV-flight parameters can significantly affect the wind-vortex parameters, and also affect the distribution effect of pesticides. These research results prove that the “wind vortex” has a significant effect on the deposition effect of pesticides, and the flight parameters of the UAV can affect the “wind-vortex” parameters. However, these studies have not proposed a clear relationship between flight parameters and rice–wind vortices, and there is still a lack of effective methods to control wind vortices. Therefore, this paper designed UAV field-operation experiments, obtained the corresponding relationship between wind-vortex and UAV-flight parameters, and established the control model of wind-vortex parameters.
The research work performed in this study can be outlined as follows: 1. We designed field experiments, photographed wind-vortex images, and obtained wind-vortex parameters from the images. 2. According to the operation scenario, the interaction between wind-vortex parameters and flight parameters was analyzed, and a wind-vortex control model was established. 3. The relation functions of each wind-eddy parameter in the model were obtained by fitting the wind-vortex parameters and flight parameters. 4. Finally, the accuracy of the control model and the model relation functions was verified.
2. Materials and Methods
2.1. Experimental Site
In order to collect the wind-vortex parameters during the application of UAVs, a field experiment of UAVs was carried out in this study. The field experiment was conducted on 7 October 2021, at the Baiyun Experimental Base of Guangdong Academy of Agricultural Sciences (113°44.43′ N, 23°39.32′ E). During the experiment, the weather was sunny, the average natural wind velocity was 1.4 m/s, the average temperature was 32.3 °C, and the average relative humidity was 63.1%. The meteorological environment was stable and met the operational requirements.
2.2. Materials and Devices
A UAV with a wheelbase of 1200 mm (Hefei Yifeite Electronic Technology Co., Ltd. Hefei, China) was used to generate airflow to form wind vortices in this experiment, as shown in
Figure 1. The Mavic 2 aerial photography UAV (Shenzhen DJI Innovation Technology Co., Ltd. Shenzhen China) was used to record wind-vortex image data. The UAV configuration is shown in
Table 1. The ambient wind velocity and direction were measured using a Kestrel 5500 pocket weather meter (Nielsen-Kellerman Company, Delaware County, PA, USA).
2.3. Experimental Method
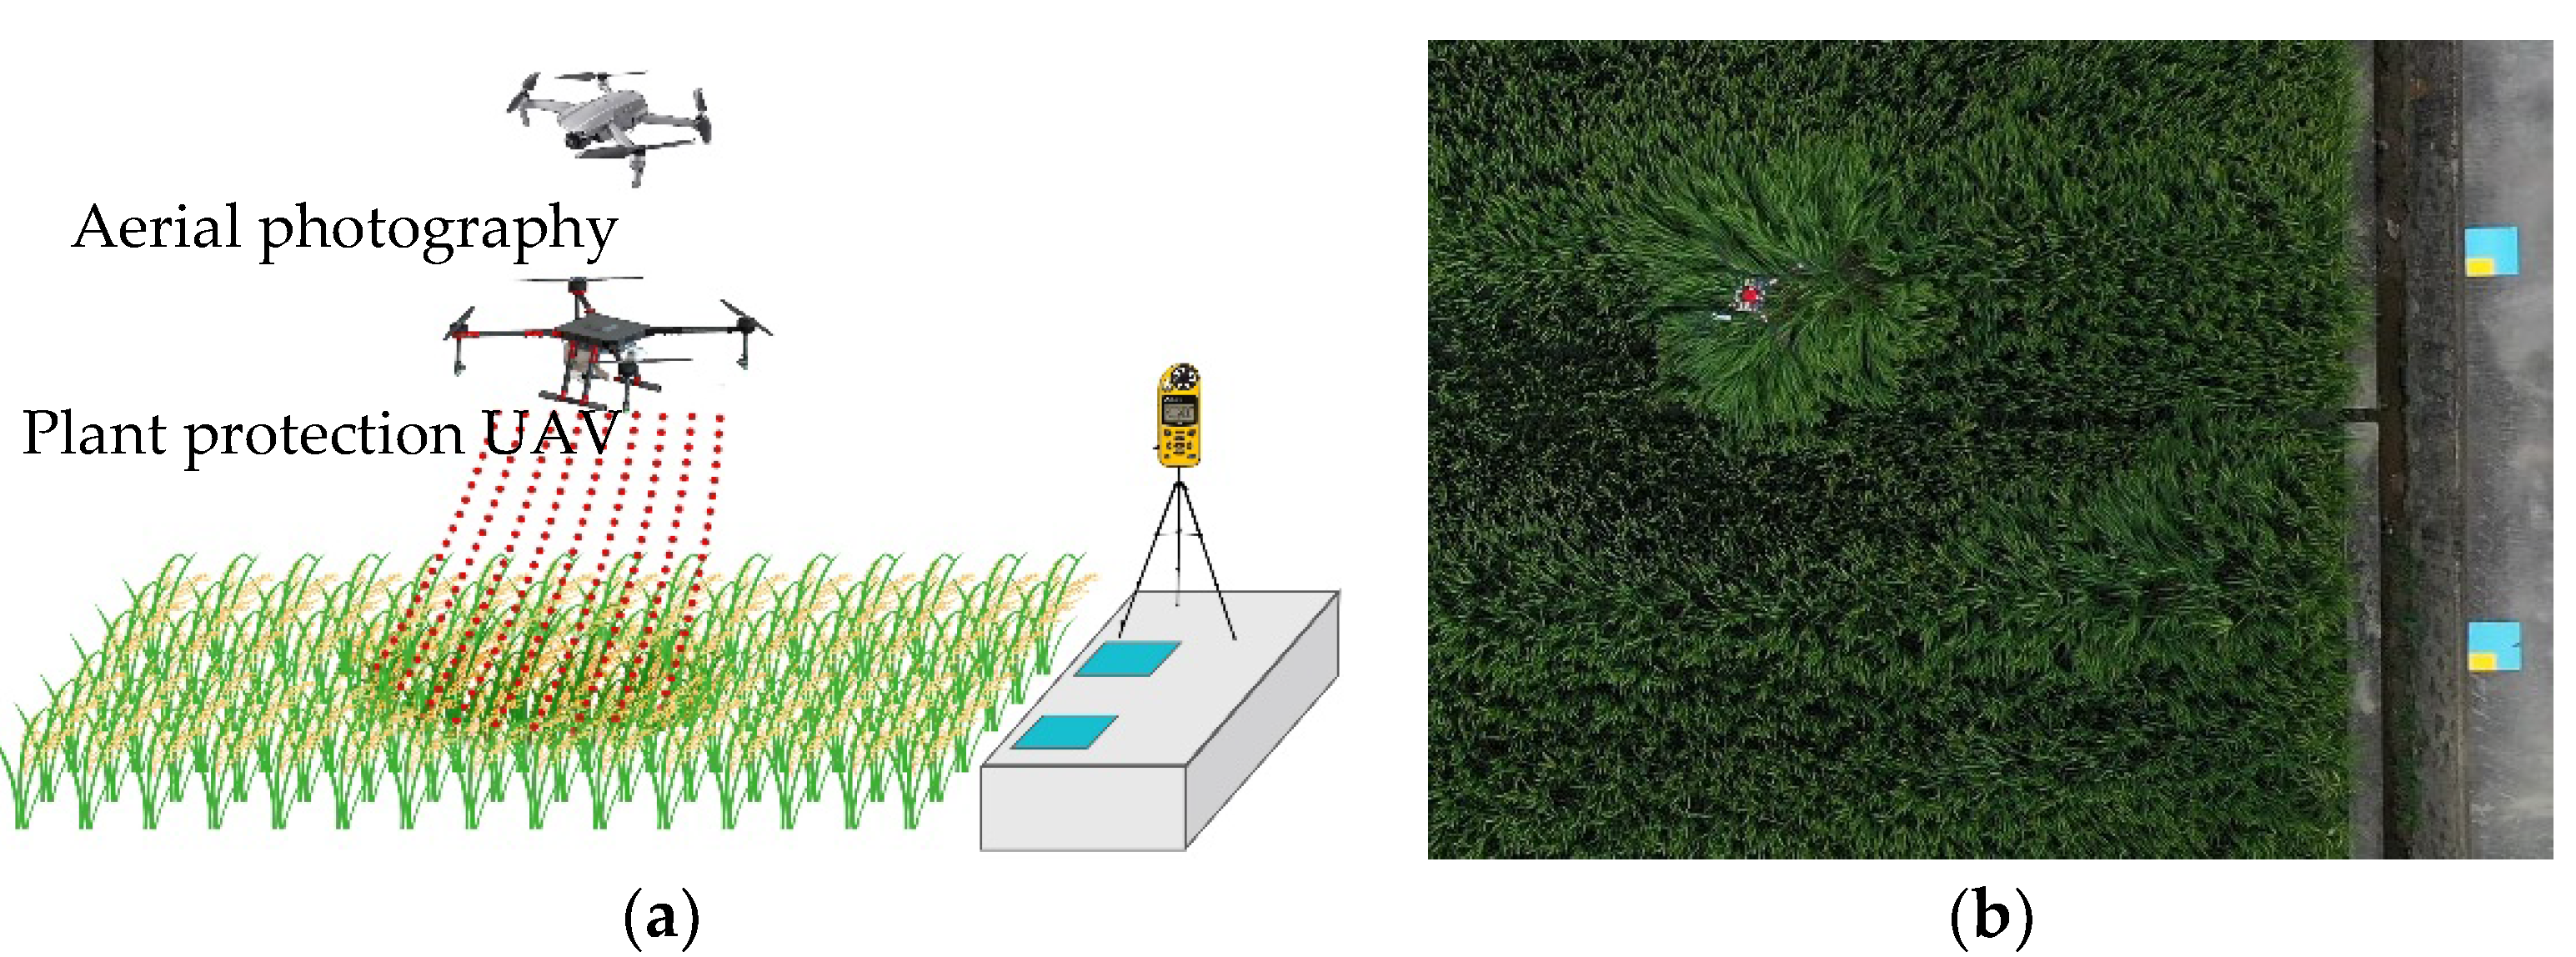
The experimental method is shown in
Figure 2. In
Figure 2a, the plant-protection UAV flies at a constant velocity above the rice and the interaction between the downwash airflow and the rice will form an obvious “wind vortex”. Aerial photography UAVs vertically overhead between 10–15 m above the rice were used to shoot video of wind vortices, as shown in
Figure 2b. In
Figure 2b, two cyan marker plates are placed on the edge of the field on the right side of the image at an interval of 5000 mm. The two marking plates are used to assist the computer program to solve the wind-vortex parameters.
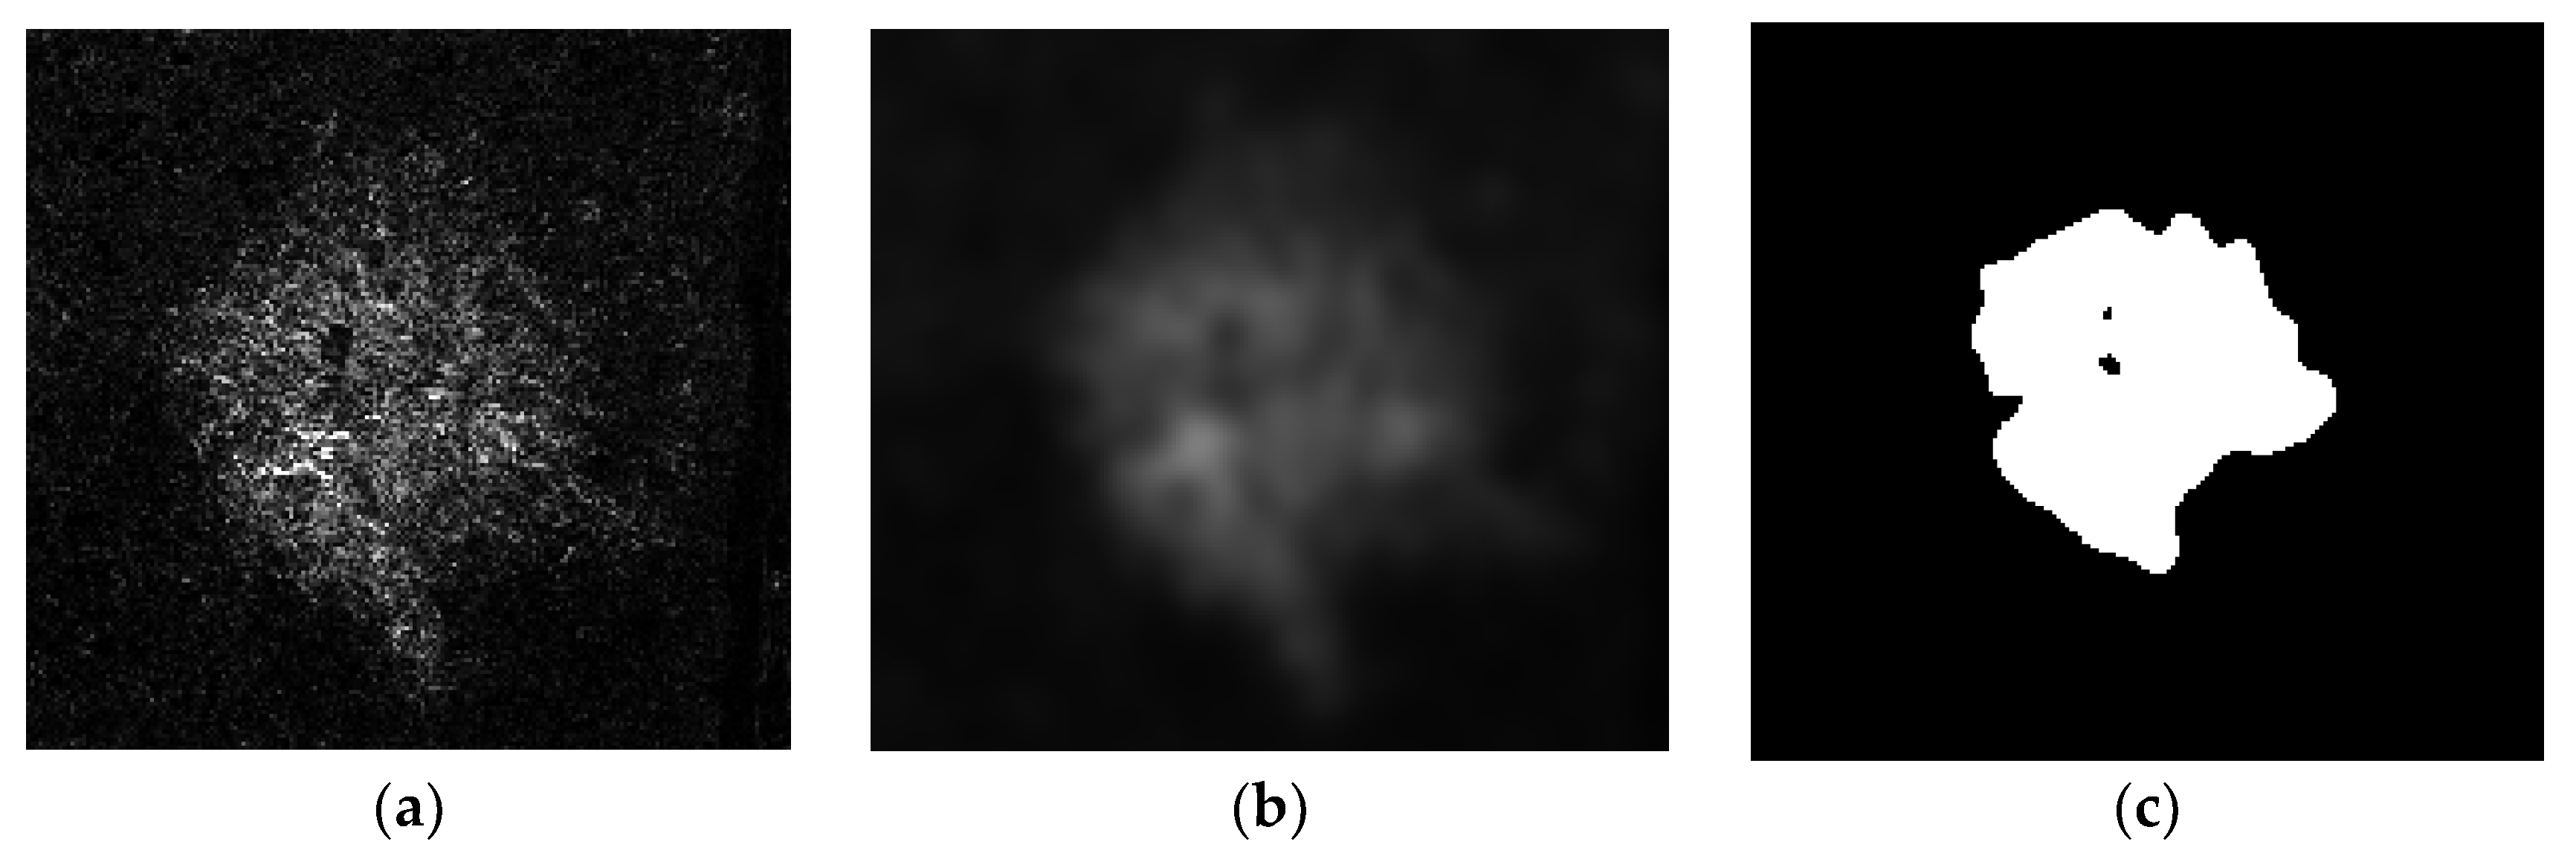
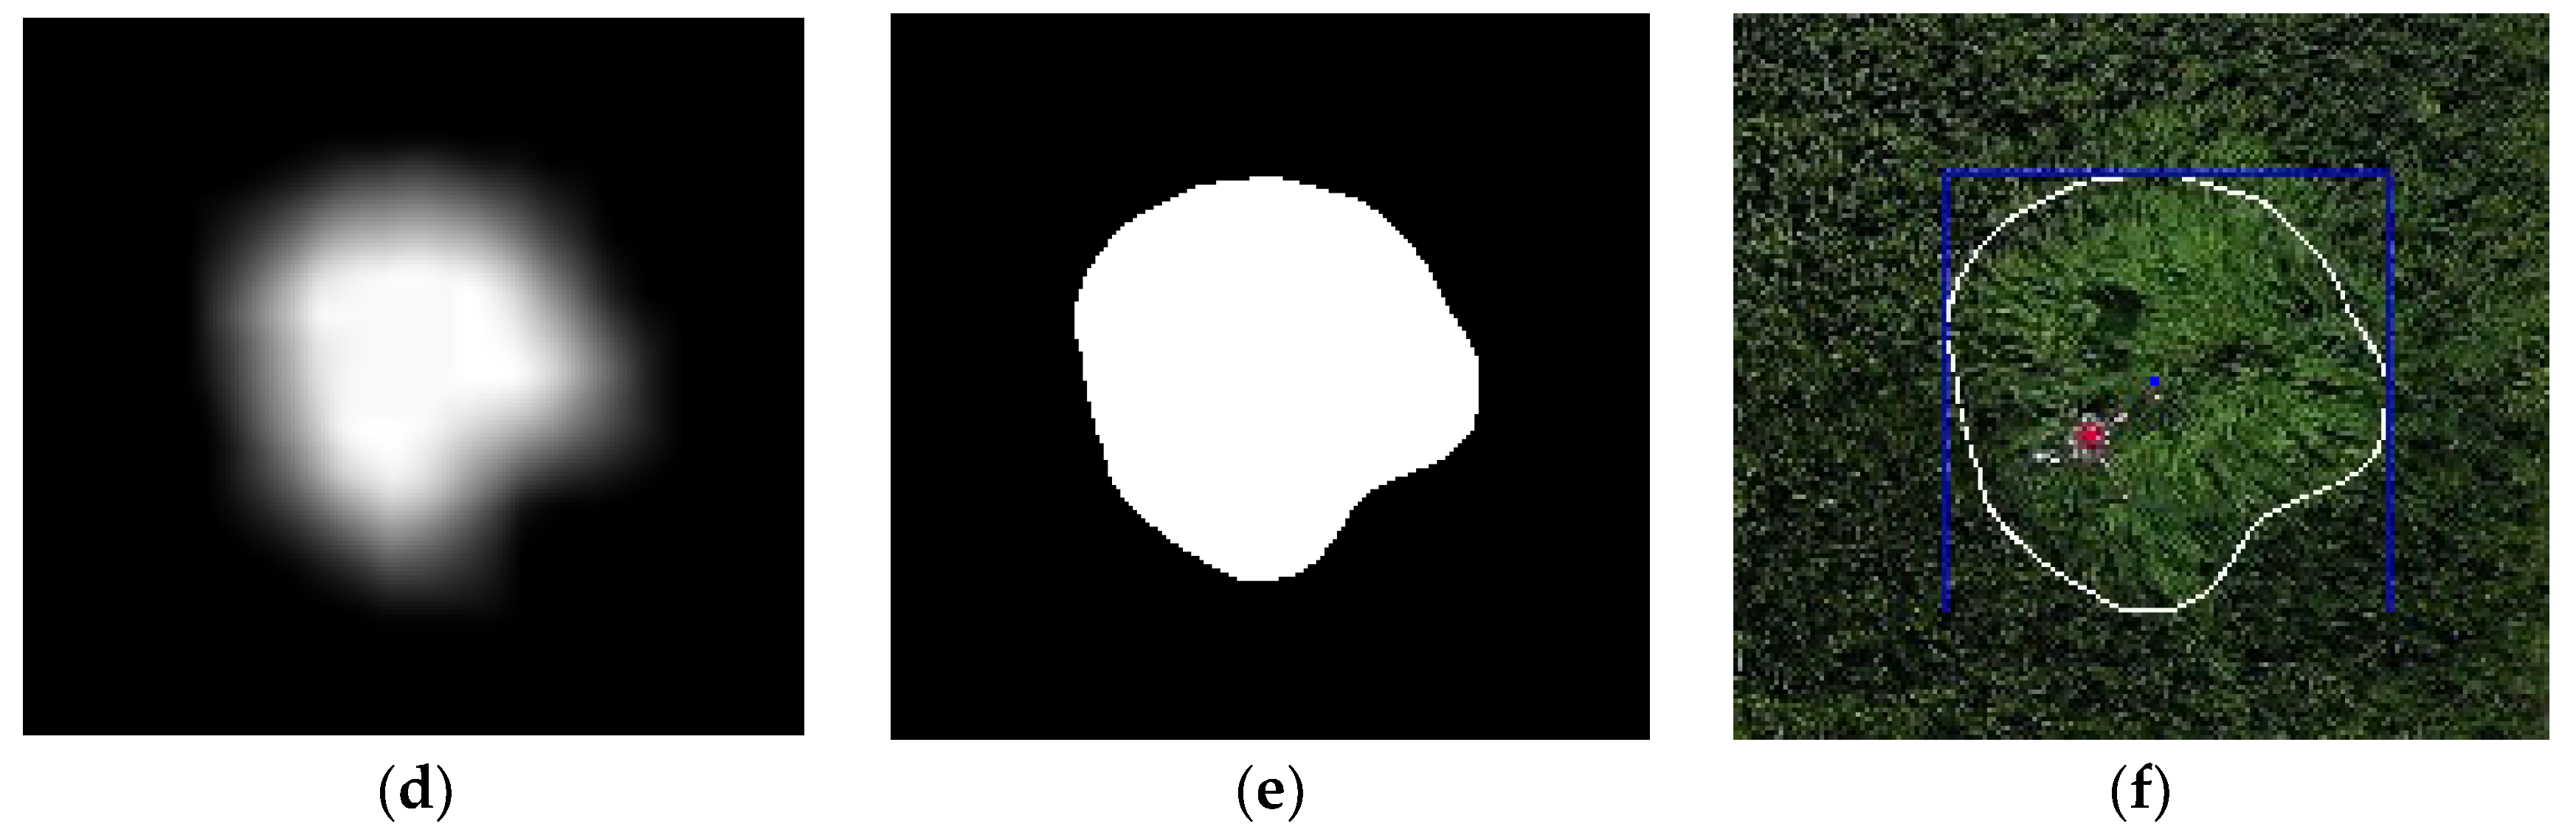
We used C++ programming language and OpenCV3 computer vision library for image processing to obtain wind-vortex information. The rice stems and leaves in the wind-vortex area swung violently under the interaction of airflow and rice, which was used as an image feature. The region of rice oscillating violently in the field was obtained by using the interframe difference method, namely, the region of the wind vortex. The specific process involved (i) using the interframe difference method to identify the disturbance of rice in the image, (ii) obtaining the wind vortex in the form of scattered points, and (iii) performing the Gaussian blur, binarization, mean blur, and binarization again on the scattered points to obtain the wind-vortex outline, as shown in
Figure 3. The boundary of the identified wind vortex can be changed by adjusting the threshold of fuzzification and binarization algorithms. The threshold of the algorithm is adjusted according to the wind vortices visible to the human eye, so that the shape and size of the wind vortices output by the algorithm are consistent with the effect observed by the human eye. The colors of the plant-protection UAV and the marker board were red and cyan, respectively, and their positions were obtained through image-color recognition, as shown in
Figure 4. According to the spacing of the marker plate and the number of pixels corresponding to the spacing in the image, the actual distance represented by a single pixel was obtained, and the actual parameters of the wind vortex were calculated.
In order to collect wind-vortex information under different flight parameters comprehensively, a wide range of flight parameters should be set as far as possible during the experiment. Previous experiment results show that when the flight speed reaches 3.5 m/s or the flight altitude reaches 3.5 m, the downwash airflow can hardly generate a wind vortex. Therefore, the maximum flight speed and altitude set in this paper are 3.5 m/s and 3.5 m, respectively. In the test, 36 groups of flight parameters were set according to the flight altitude and speed. Each group of parameters was accomplished under downwind and upwind conditions, respectively. The parameter settings are shown in
Table 2.
3. Wind-Vortex Control Model
3.1. Wind-Vortex Characteristic Parameters
The parameters that reflect the shape of the wind vortex mainly include four parameters: the area of the wind vortex, the protruding degree of the wind vortex, the protruding direction, and the distance between the wind vortex and the UAV.
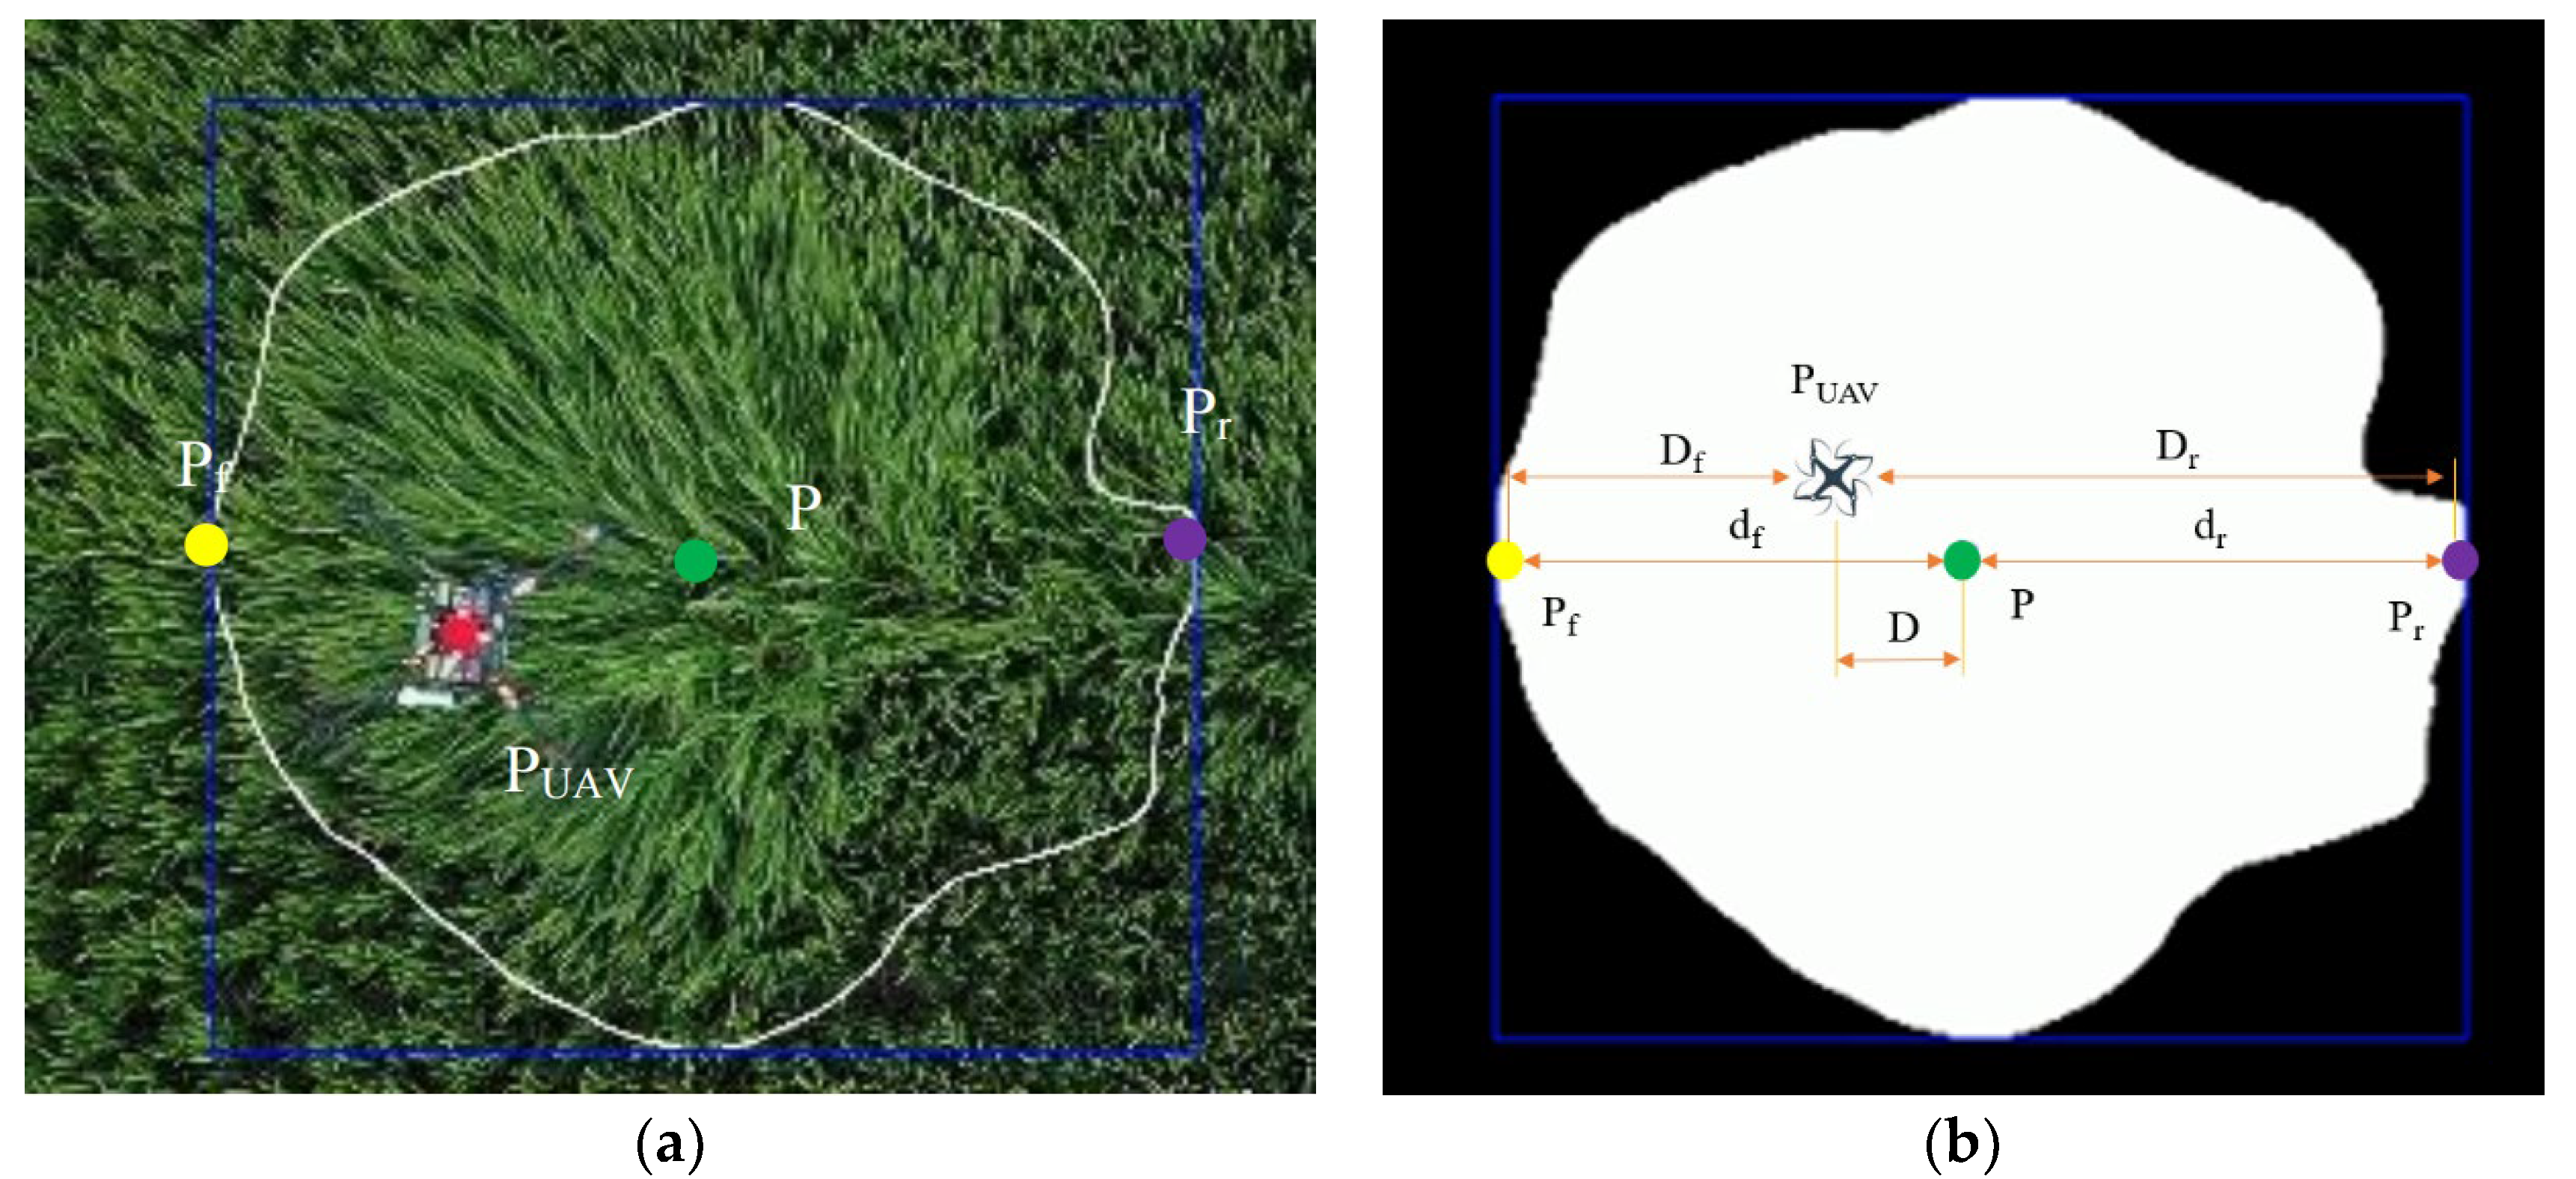
Wind-vortex distance refers to the horizontal relative distance between the wind vortex and the UAV. The wind-vortex distance represents the relative positional relationship between the wind vortex and the UAV along the advancing direction of the UAV. Normally, one would expect the application area to be directly under the drone. In fact, due to the hysteresis of the downwash airflow, the wind vortex will form a certain distance with respect to the UAV, which is crucial for the accuracy of the UAV for target spraying. In order to establish the model, this paper defines multiple feature points for the wind-vortex region, as shown in
Figure 5.
The wind-vortex area is also an important parameter of the wind vortex. Wind-vortex area refers to the size of the area where the downwash airflow causes the obvious swing of the rice canopy and represents the size of the action range of the droplets that follow the airflow on the rice. The white area in
Figure 5b represents the wind-vortex area.
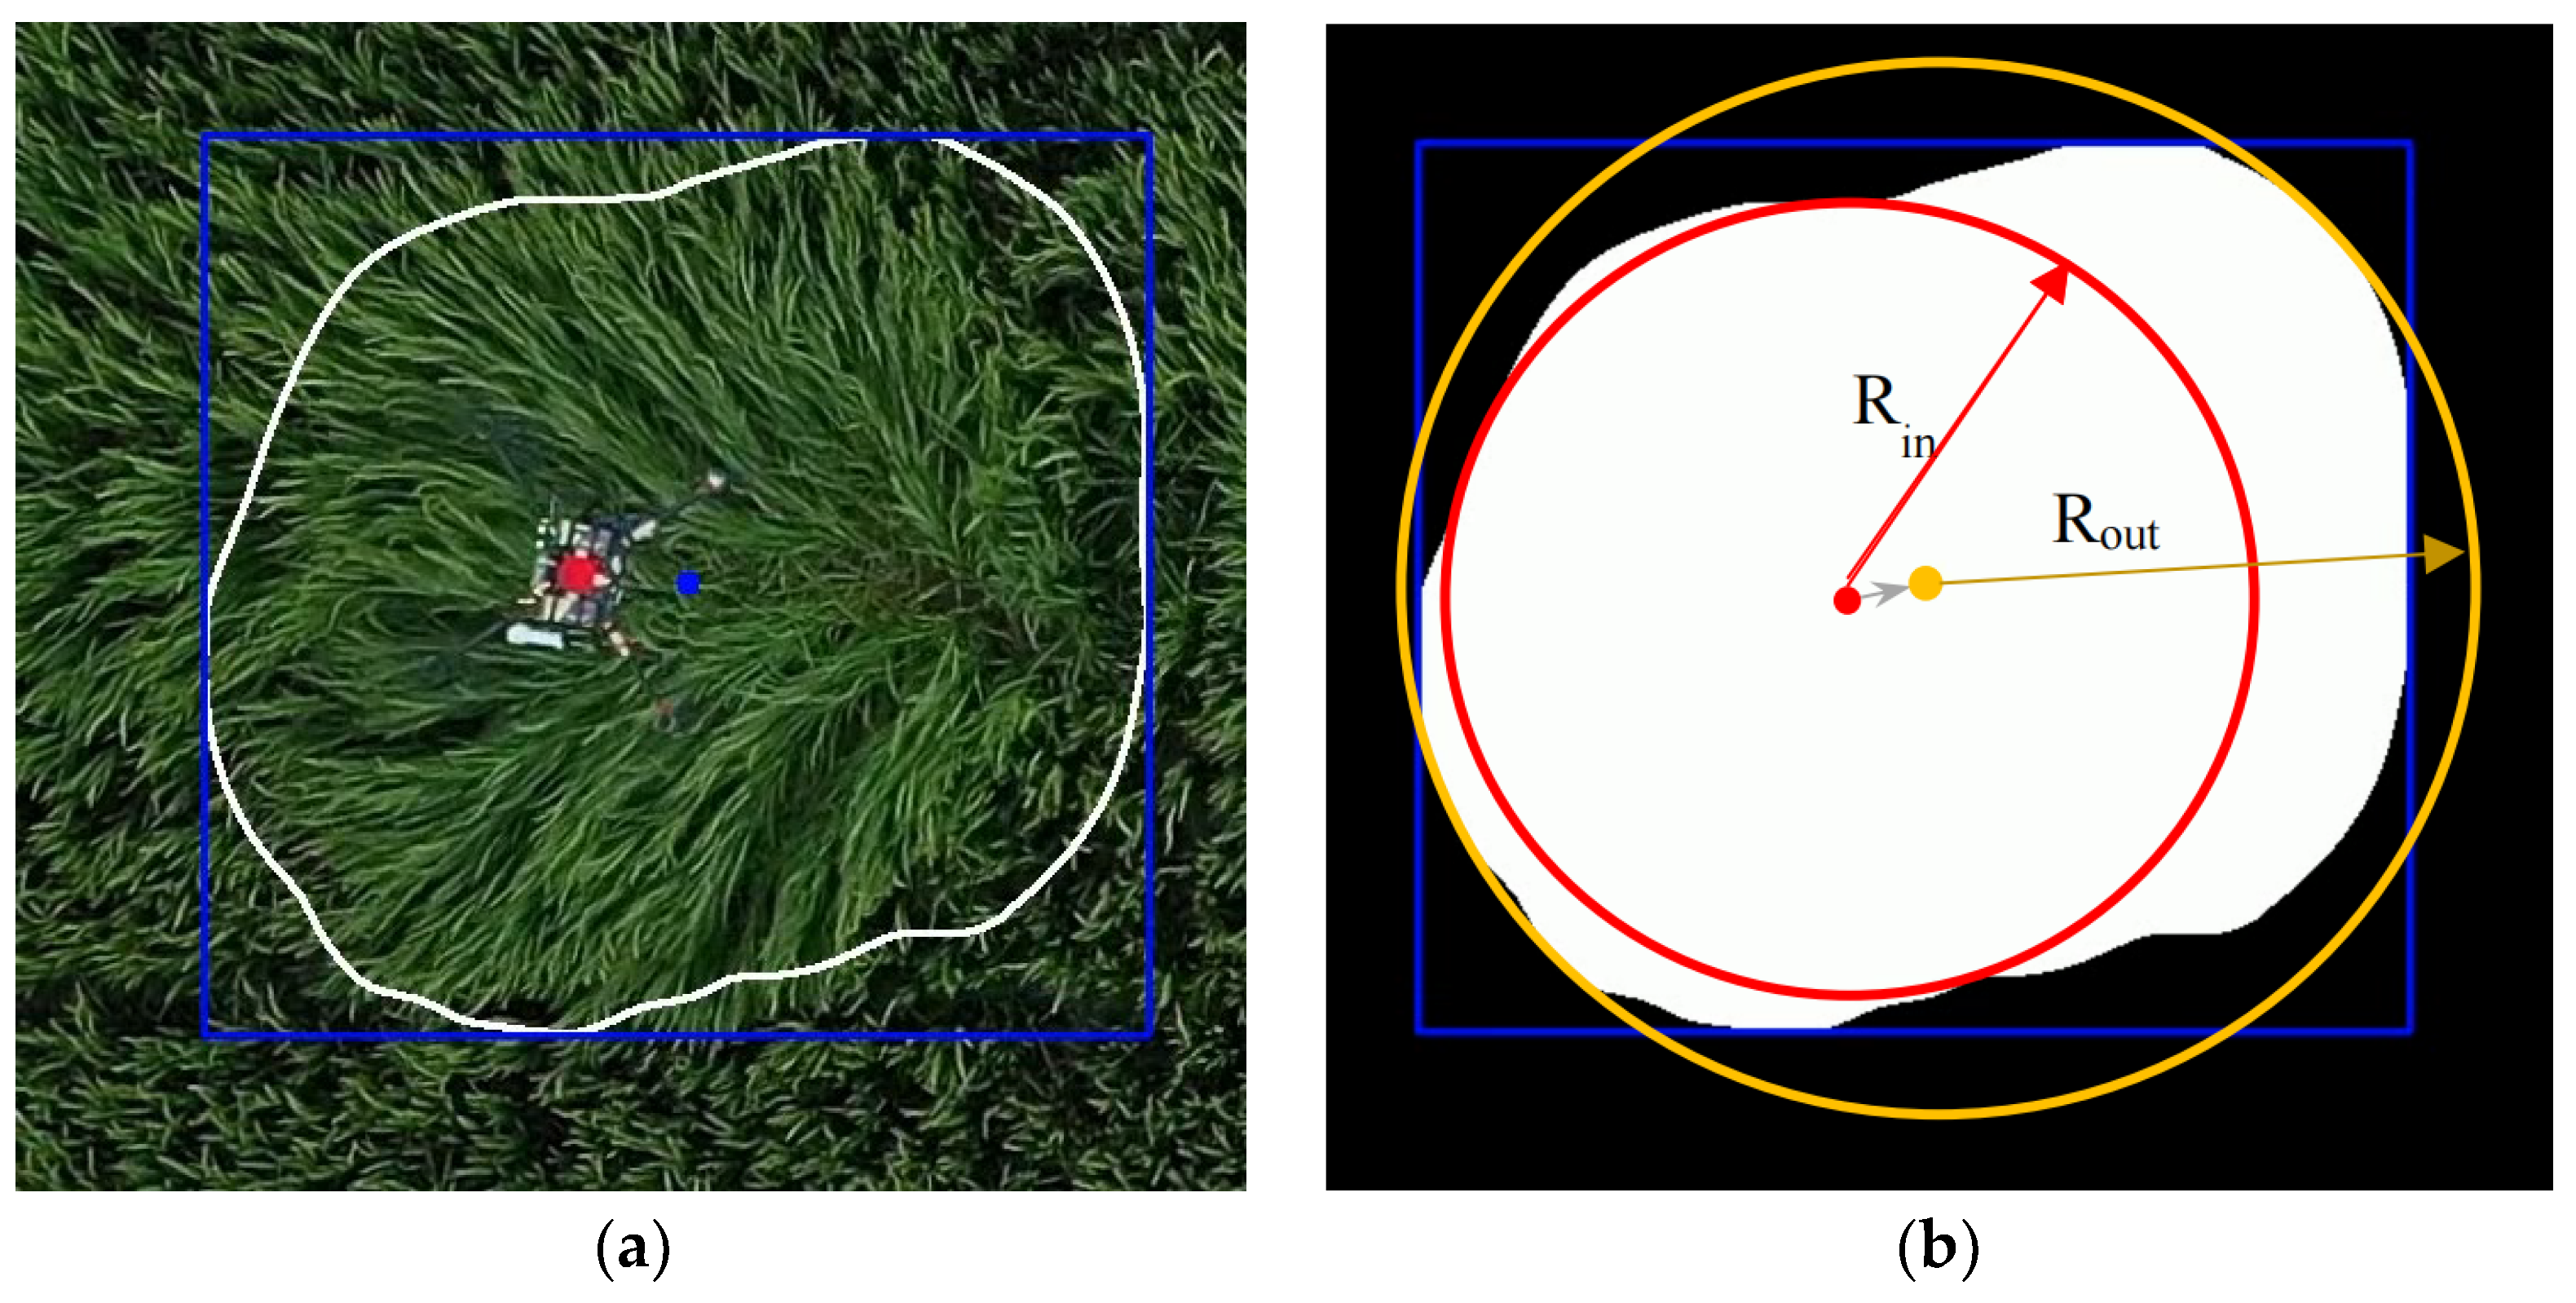
The bulge degree and direction of the wind vortex represent the shape of the wind vortex, which reflects the stability and concentration of the spraying effect of the UAV. The closer the wind-vortex shape is to a circle, the more concentrated the rotor airflow, the more stable the airflow intensity, and the more uniform the droplet deposition range. If the boundary of the wind vortex is seriously protruding, it means that the airflow is dispersed, the airflow intensity becomes smaller, and the pesticide droplets drift outward. In this paper, the maximum inscribed circle and the minimum circumscribed circle are drawn for the outline of the wind vortex, and the relative position of the two circle centers was used to represent the bulge degree and direction of the wind vortex, as shown in
Figure 6. The inscribed circle is included in the contour, while the circumscribed circle includes the contour. When the wind-vortex contour protrudes outward, the centers of the two circles are displaced, and the relative position of the center of the circle reflects the protrusion of the wind-vortex contour and the severity of the bulge.
3.2. Wind-Vortex Control Model Relation Functions
3.2.1. Wind-Vortex Parameter Data Preprocessing
During the experiment, 3699 frames of data were obtained, and each frame of data contained information such as time, flight altitude, velocity, wind-vortex distance, wind-vortex area, and wind-vortex shape. To ensure that the wind-eddy data of the model establishment and the evaluation model are independent of each other, the wind-eddy data must be divided into two groups before the relation function is established. The experimental results of each voyage were numbered in chronological order (the first frame was numbered “1”, the second frame, “2”, and so on). The numbered data were grouped (every five frames of data were a group); the first four frames of the data of each group were merged into group A, the fifth frame of the data of each group was merged into group B, the data of group A were used to establish a relationship function, group B data were used for the final validation function. The total data set, group A data, and group B data comparison are shown in
Table 3.
It can be seen from
Table 3 that the average, maximum, and minimum values of the total data, group A data, and group B data are all close to each other, which is in line with the establishment and verification requirements of the function.
3.2.2. Wind-Vortex Distance Relation Function of the Model
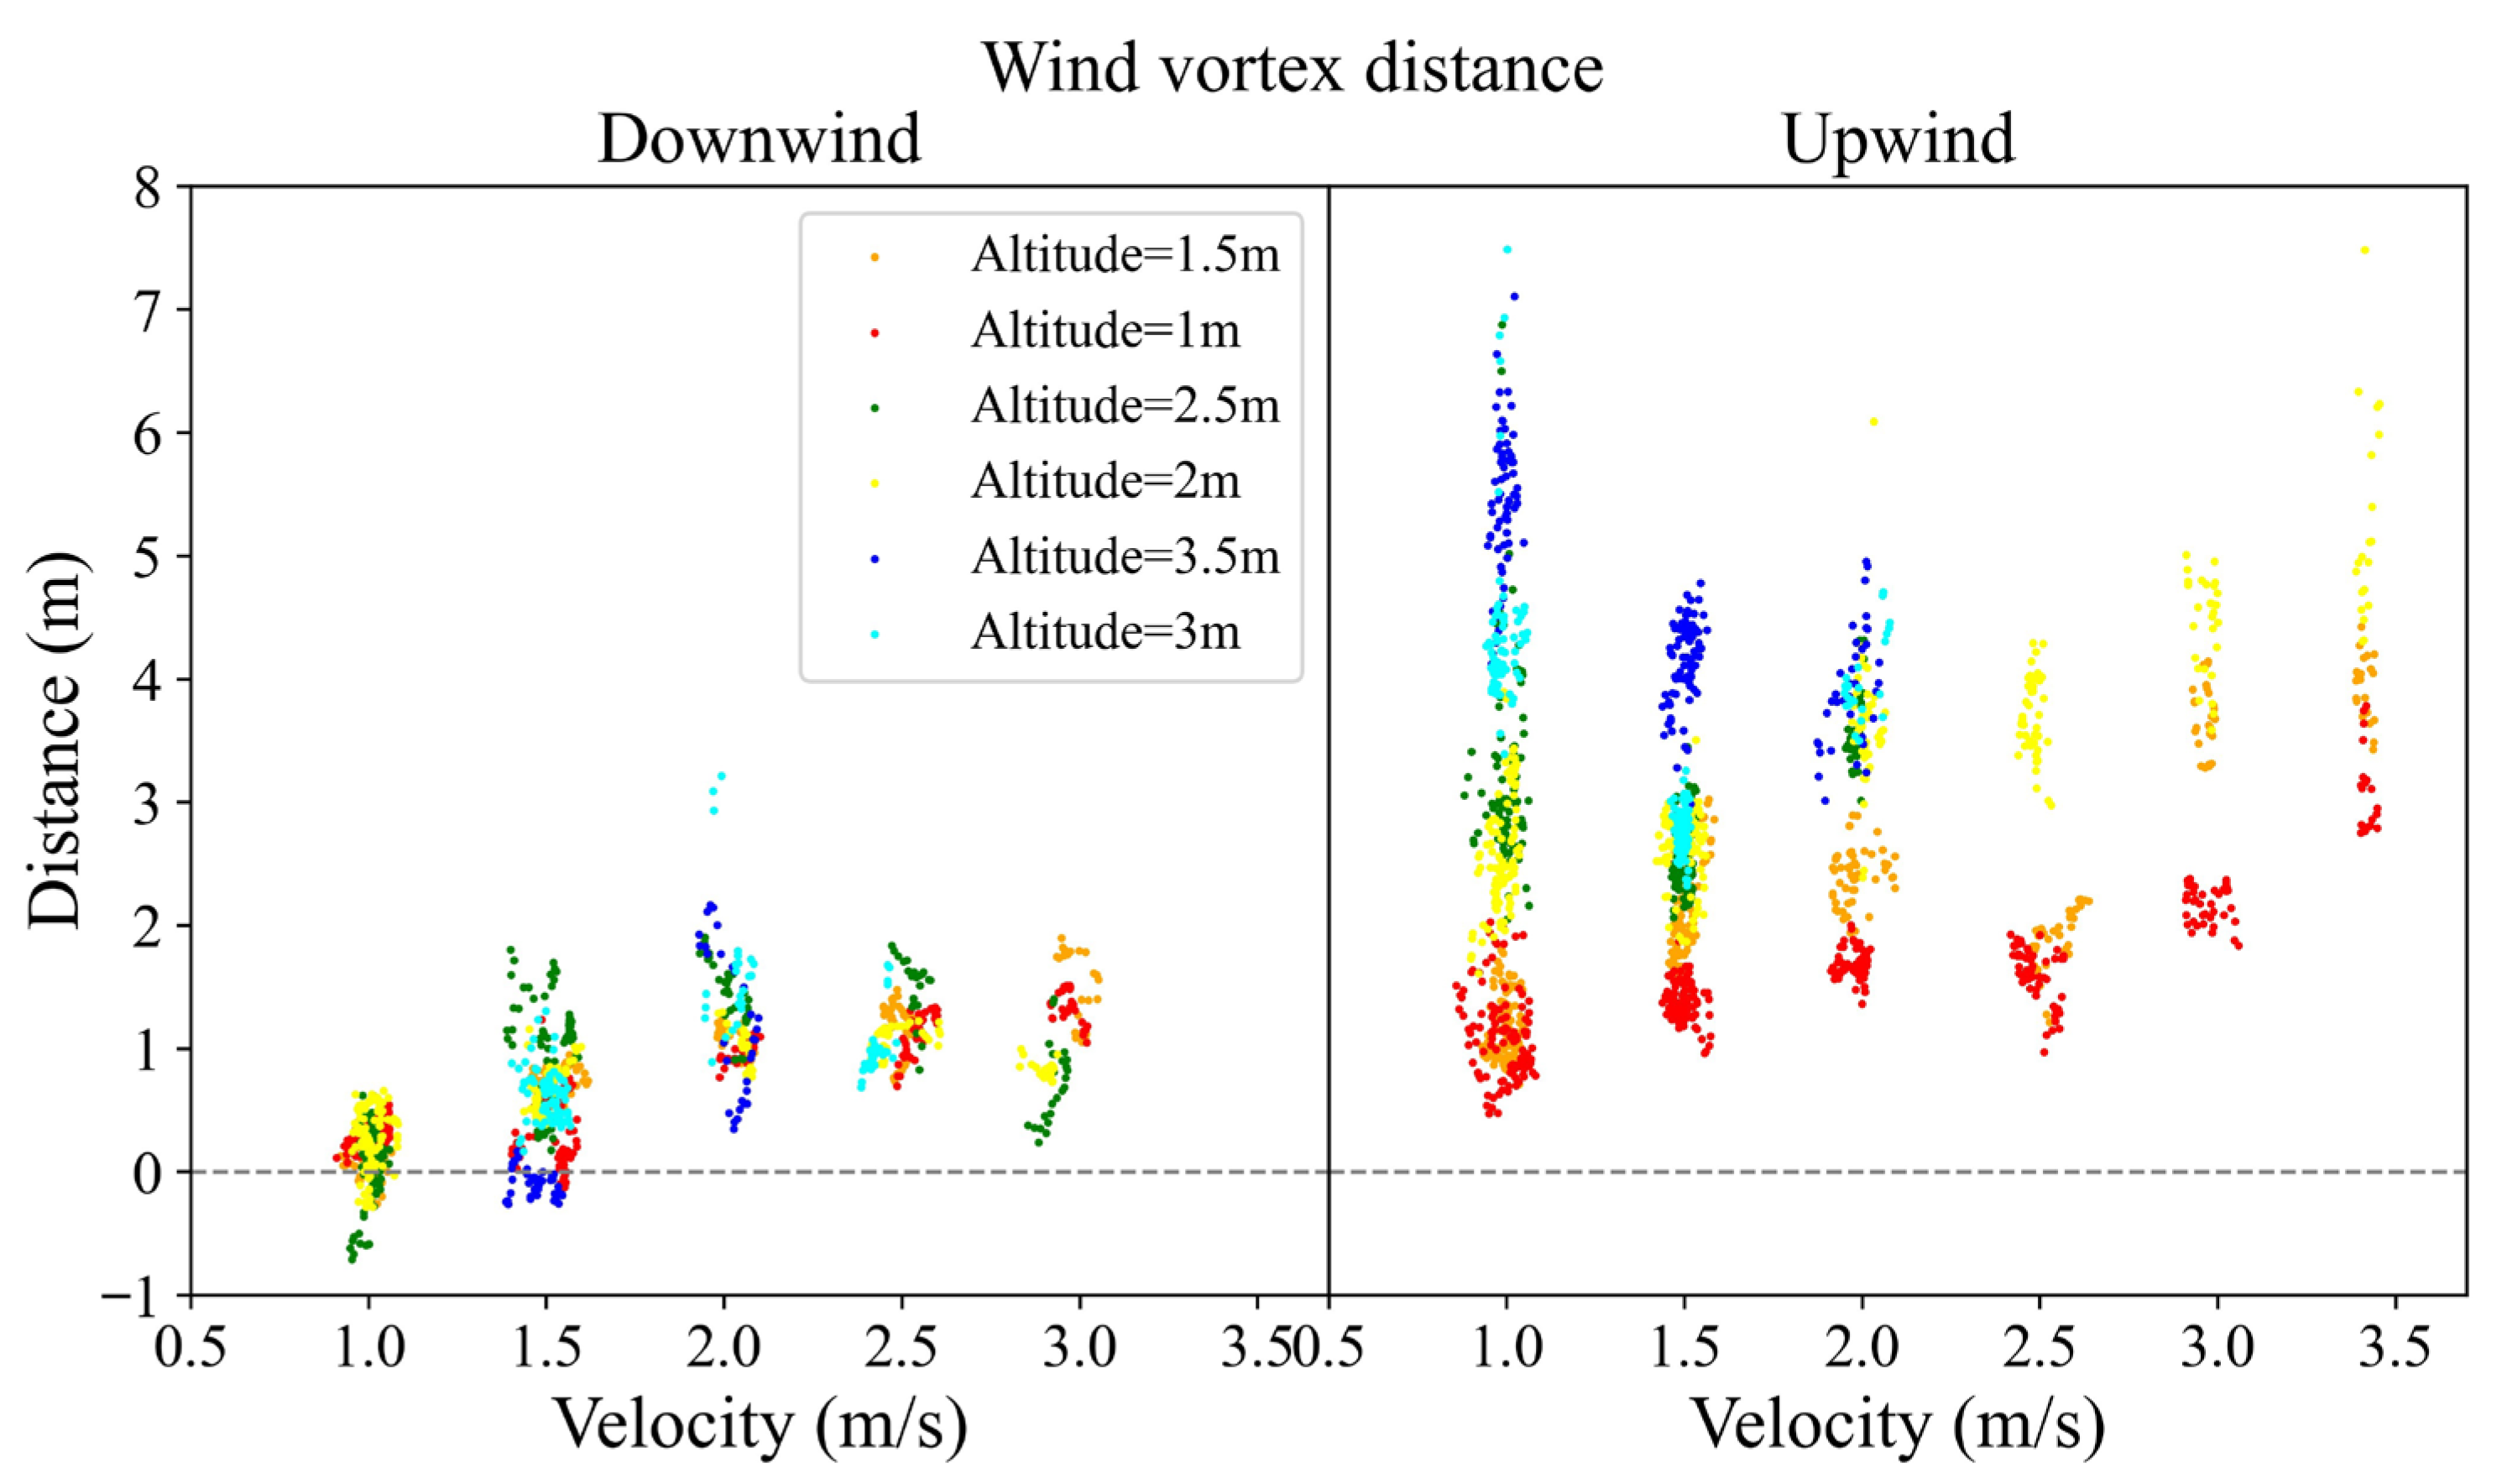
In this paper, the relation between wind-vortex parameters and flight parameters is obtained by polynomial fitting. To establish the wind-vortex distance relation function, the position of the centroid point P of the wind-vortex profile was used to represent the position of the wind vortex. Using the altitude h, velocity v, and distance D of the centroid point P relative to the UAV in the data of group A, a scatter diagram composed of each frame of data is obtained, as shown in
Figure 7.
It can be seen from
Figure 7 that when the altitude h and the velocity v are constant, the distance D between the centroid and the UAV fluctuates up and down within a certain range. Since the fluctuation range of vortex distance D is large in different flight parameters, this paper calculates the approximate distribution range of vortex distance D in various flight parameters by using the probability statistics method. It can be seen from
Figure 7 that under the same flight parameters, the middle part of the data points is denser, and the two ends are sparser, which is similar to the normal distribution. The normal distribution was used to calculate the range of each downwind-vortex parameter D within the 95% confidence interval. The normal distribution density function is shown in Equation (1):
where
is the mean, and
is the standard deviation, which is calculated and obtained from the data of group A. According to the data in
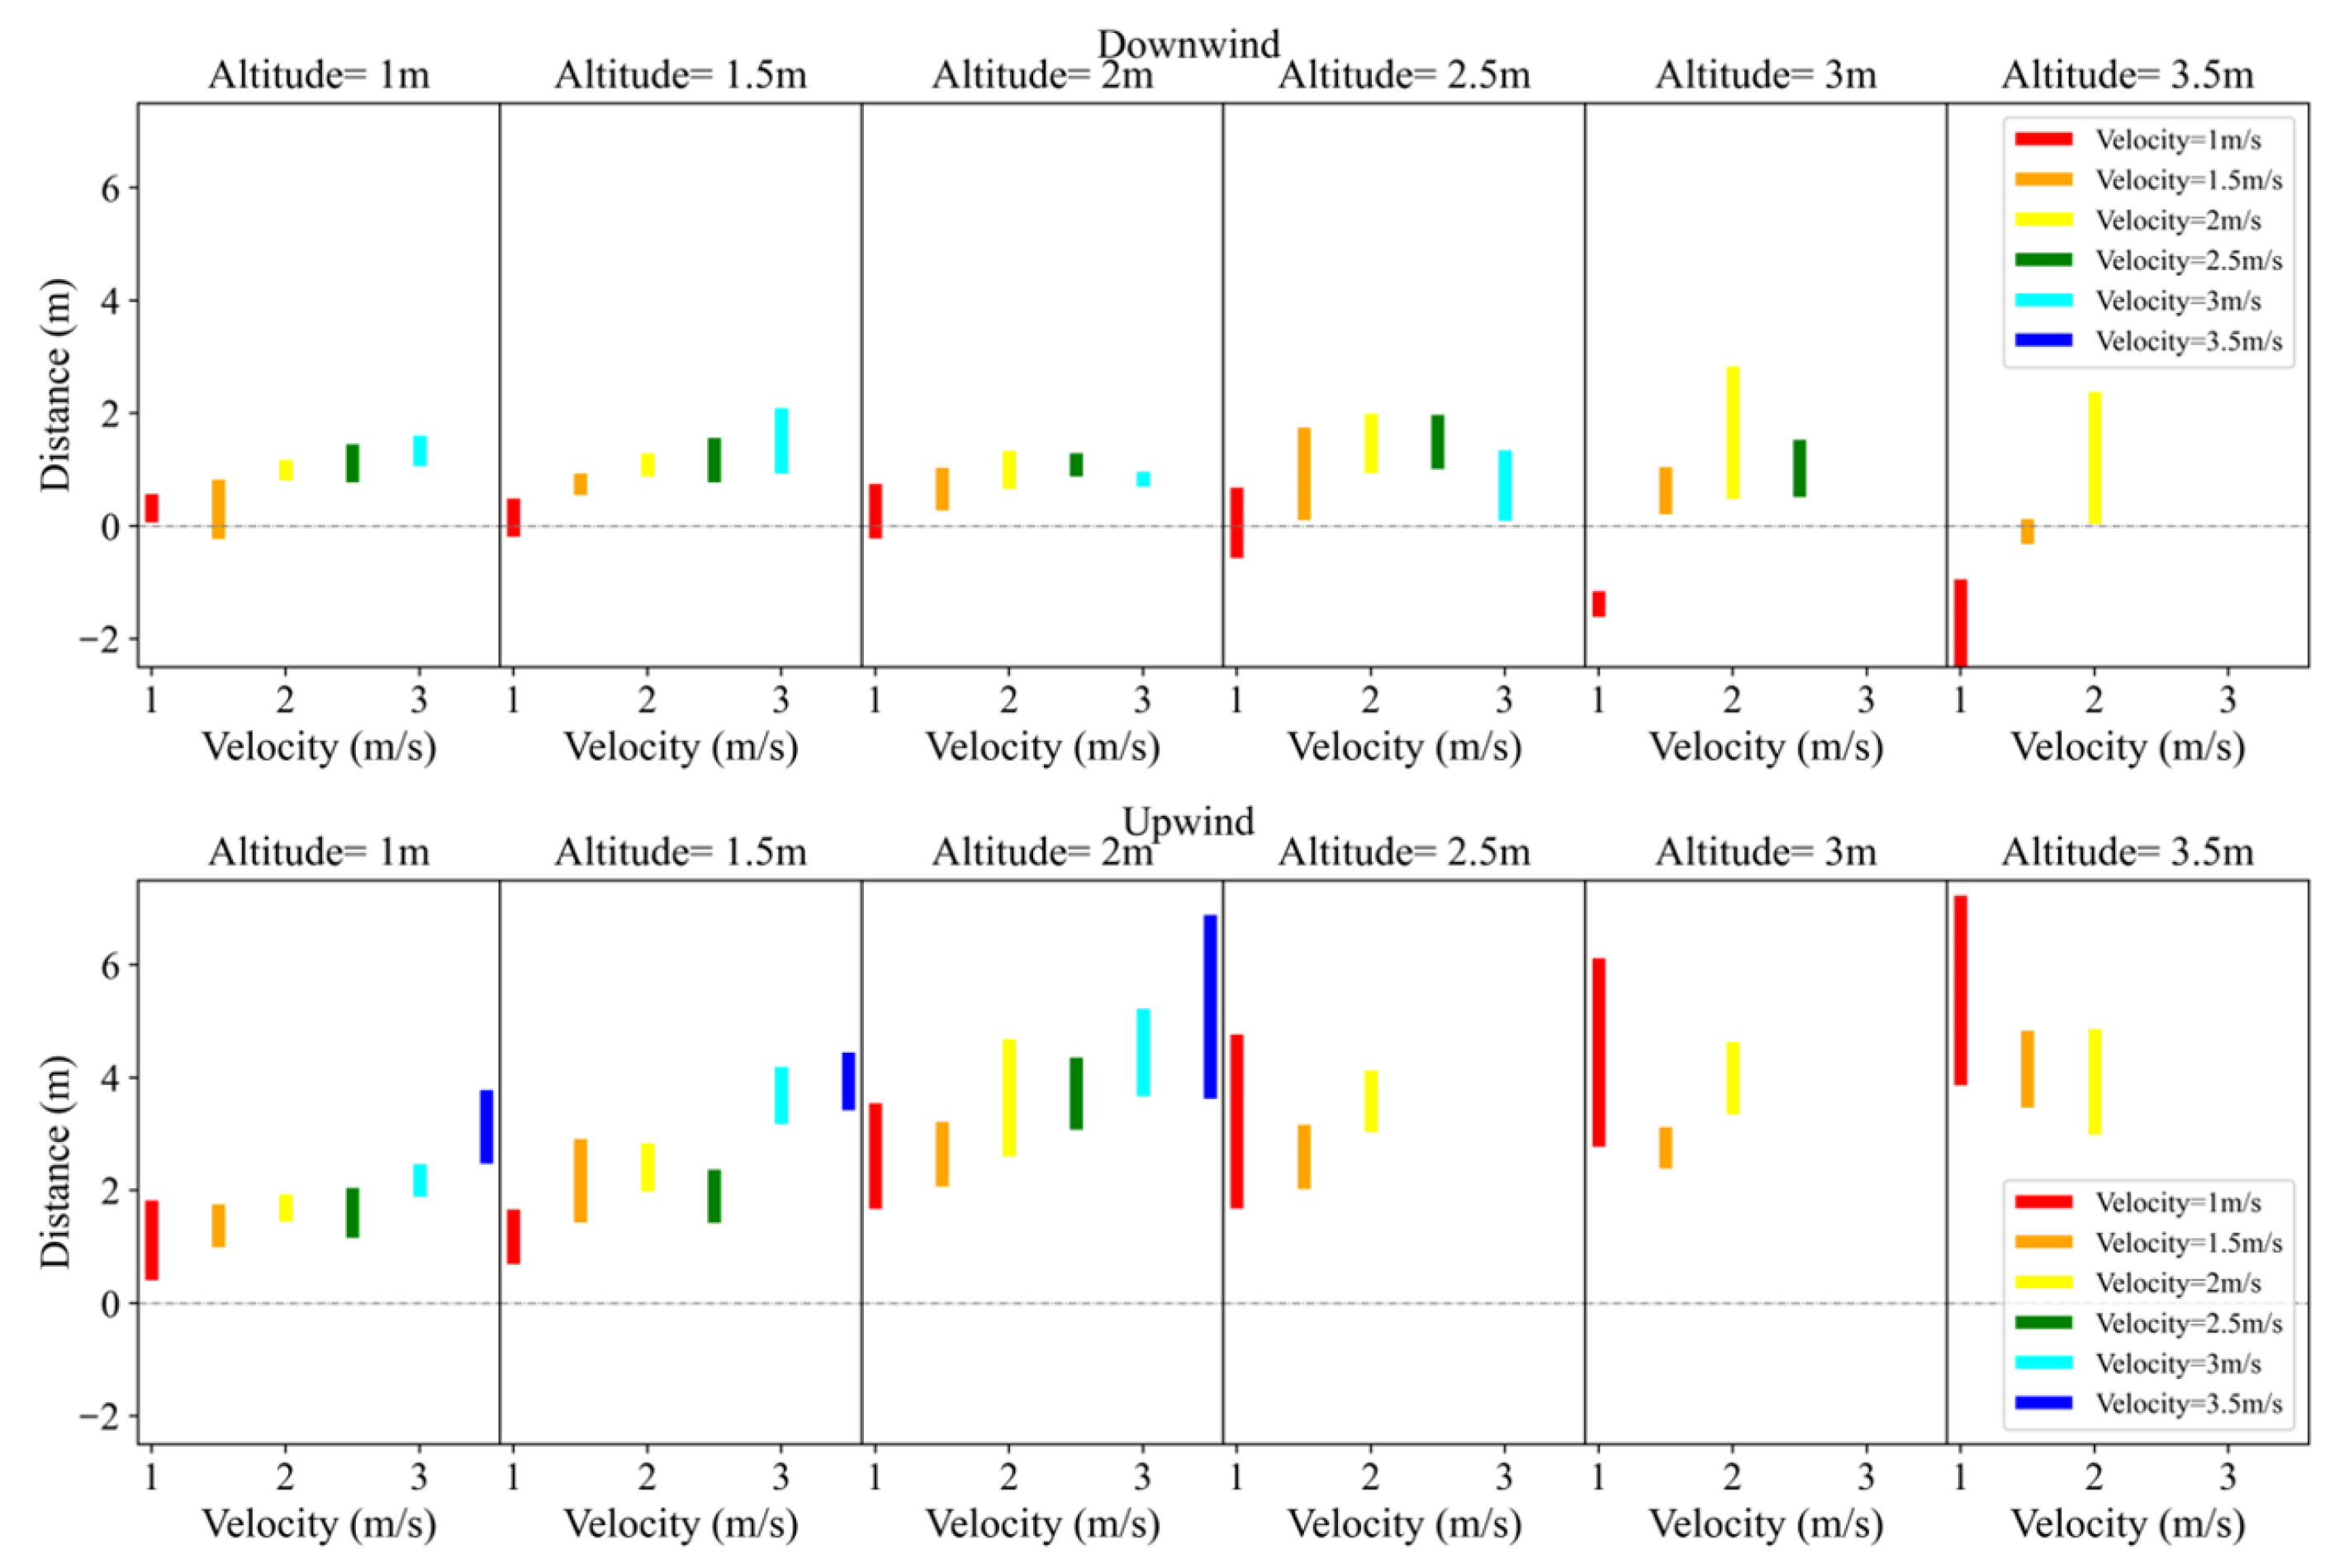
Figure 7 and the density function, the range of the 95% confidence interval for the wind-vortex parameter D under different flight parameters was obtained, as shown in
Figure 8.
The bar area in
Figure 8 represents the 95% confidence interval of the wind-vortex distance, indicating that there is a 95% probability of the wind-vortex distance falling in this area under the flight parameter. The highest and lowest points of the bar graph represent the maximum and minimum wind-vortex distances within the 95% confidence interval under the corresponding flight parameters, respectively. The flight altitude and velocity were used as the inputs, and the maximum and minimum wind-vortex distance as the outputs to perform polynomial fitting and obtain the relationship function between the parameter D and the flight parameter. The downwind and upwind maximum and minimum functions are named as
,
,
and
.
The parameter D only represents the distance from the centroid of the wind vortex, but in fact, the wind vortex is a flat area. To obtain the relationship between the wind-vortex distance and the flight parameters more completely, we also studied the distance between the front and rear extreme points of the wind vortex and the UAV. The overall position of the wind vortex is included between the front and rear extreme points, that is, between P
f and P
r, and the distances between the two extreme points and the UAV are
Df and
Dr, respectively. According to
Figure 5, the points are related as follows:
The distances df and dr were fitted between the extreme point and the centroid, and the relationship functions were obtained between the distances, df and dr, and altitude h and velocity v as follows: the distance functions between the front extreme point and the centroid and between the back extreme point and the centroid under downwind conditions, and between the front extreme point and the centroid and between the back extreme point and the centroid under upwind conditions.
According to the relationship between the extreme point and the centroid point in
Figure 5, each function should satisfy:
In the formula,
and
represent the functions of the front extreme point with the smallest wind-vortex distance, that is, the function of the distance of the front point of the wind vortex, and
and
represent the functions of the back extreme point with the largest wind-vortex distance, that is, the function of the distance of the last point of the wind vortex. Finally, the expression of the wind-vortex distance relation function of the model is given by
In the formula, “ ”is the coefficient matrix, which is composed of the coefficients in the polynomial function. The function is obtained by polynomial fitting of wind-vortex data and flight data. Among them, when “” takes different values, it represents the coefficient matrix of different wind-vortex relationship functions, and the specific values have been given in the formula.
3.2.3. Model’s Wind-Vortex Area Relation Function
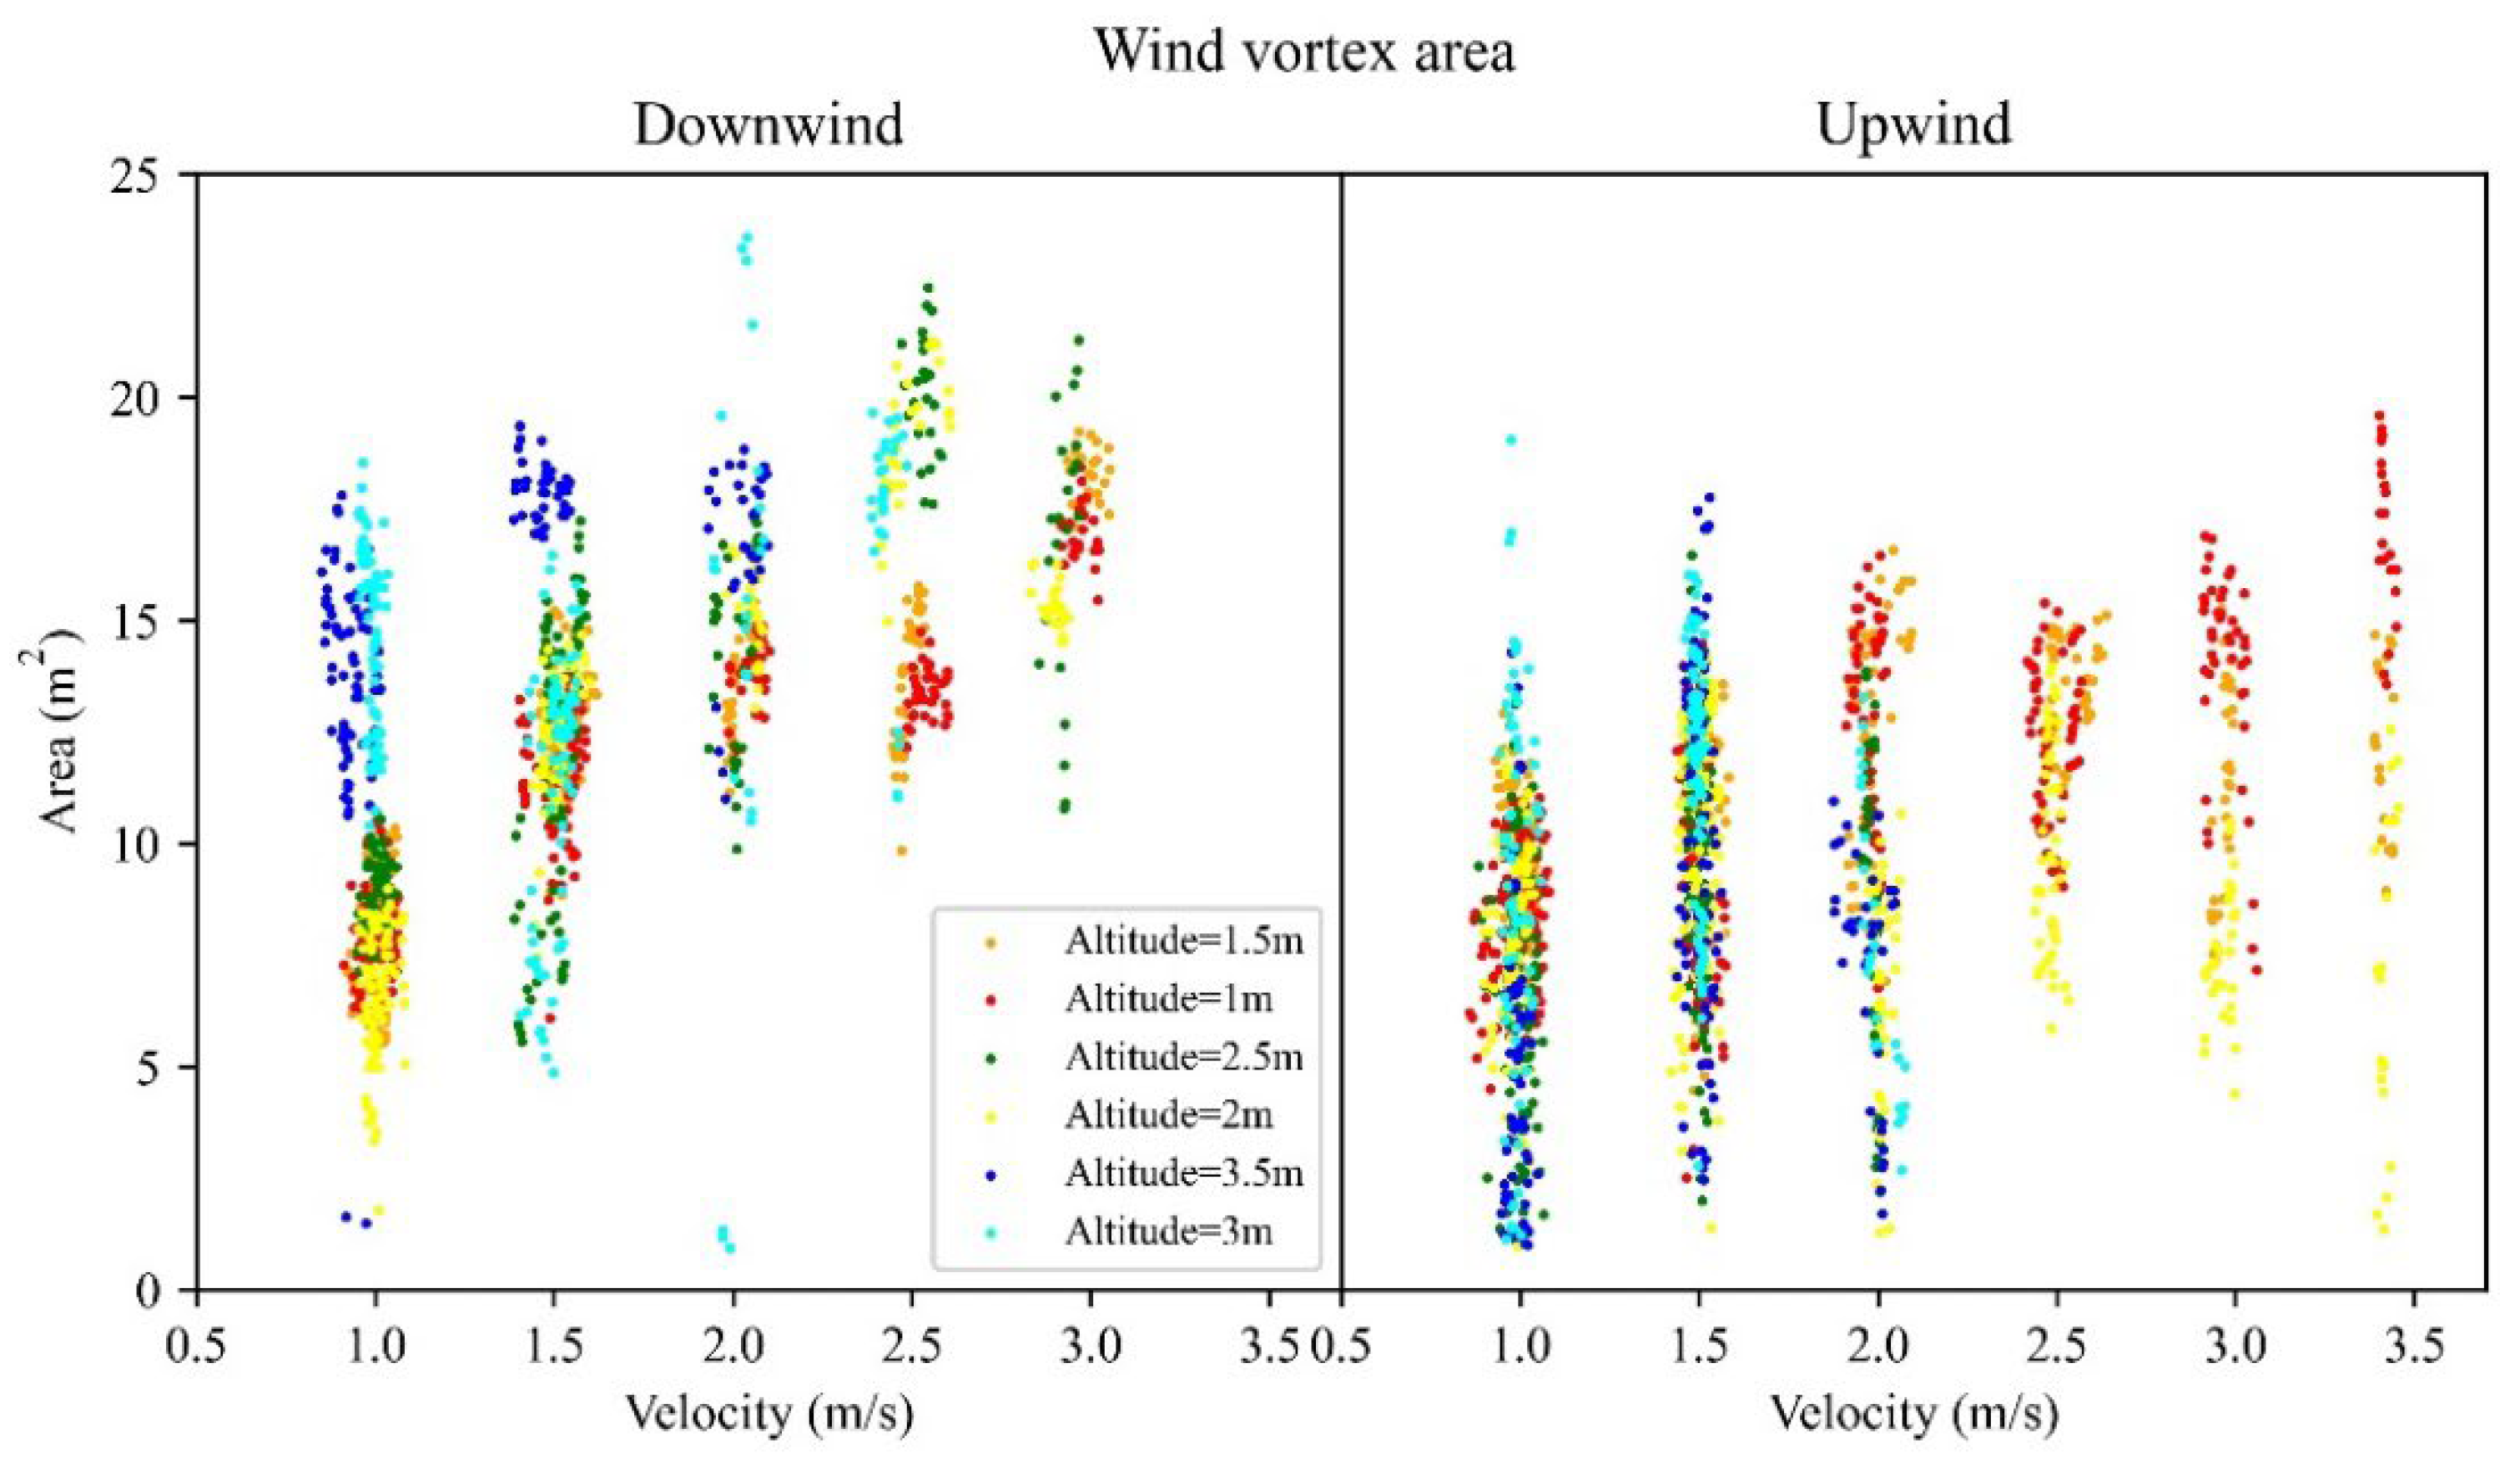
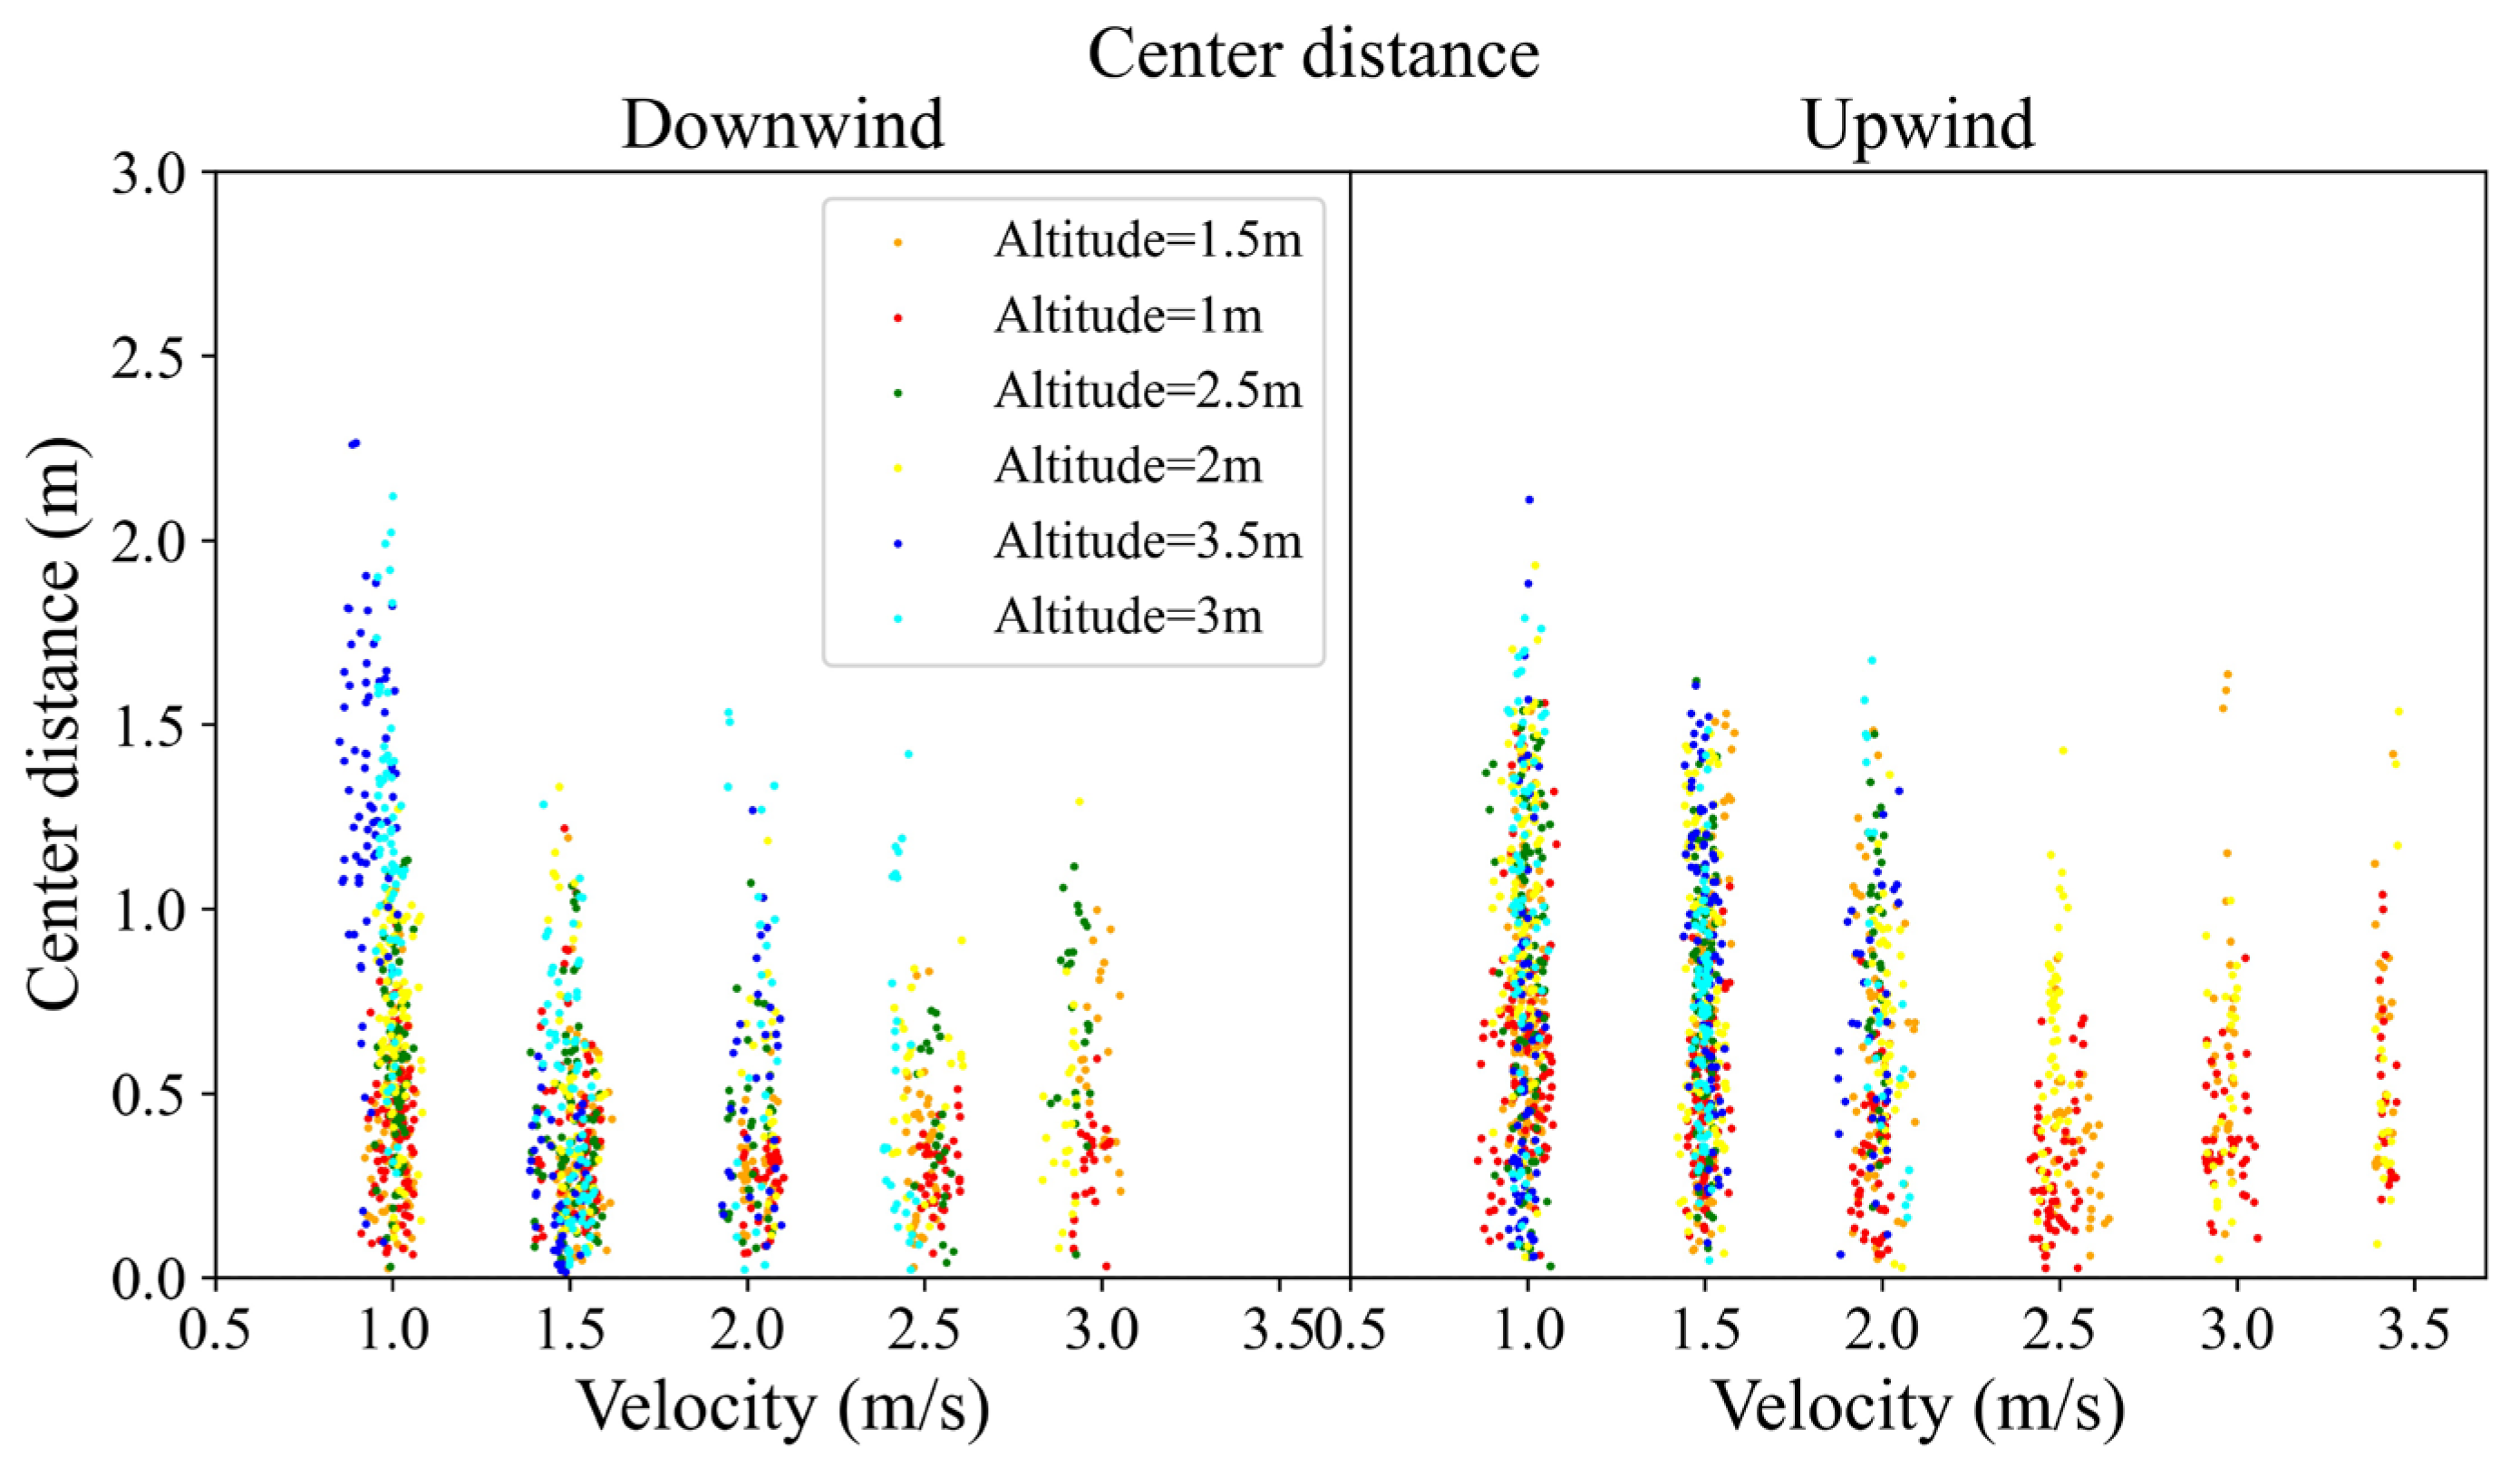
To establish the wind-vortex area relation function of the model, the area parameters in the data of group A were analyzed. Using the altitude h, velocity v, and area S in the data of group A, a scattergram composed of each frame of data was obtained, as shown in
Figure 9.
It can be seen from
Figure 9 that the wind-vortex area S is similar to the wind-vortex distance parameter D and fluctuates within a certain range. The functional relationship was calculated between the area and flight parameters according to the same method described in
Section 3.2.2 and parameter D.
and
were used to represent the maximum and minimum functions of the area under downwind conditions, and
and
were used to represent the maximum and minimum areas under upwind conditions. The wind-vortex area relation function of the model is described by
3.2.4. Wind-Vortex Bulge Degree and Bulge Direction Relation Functions
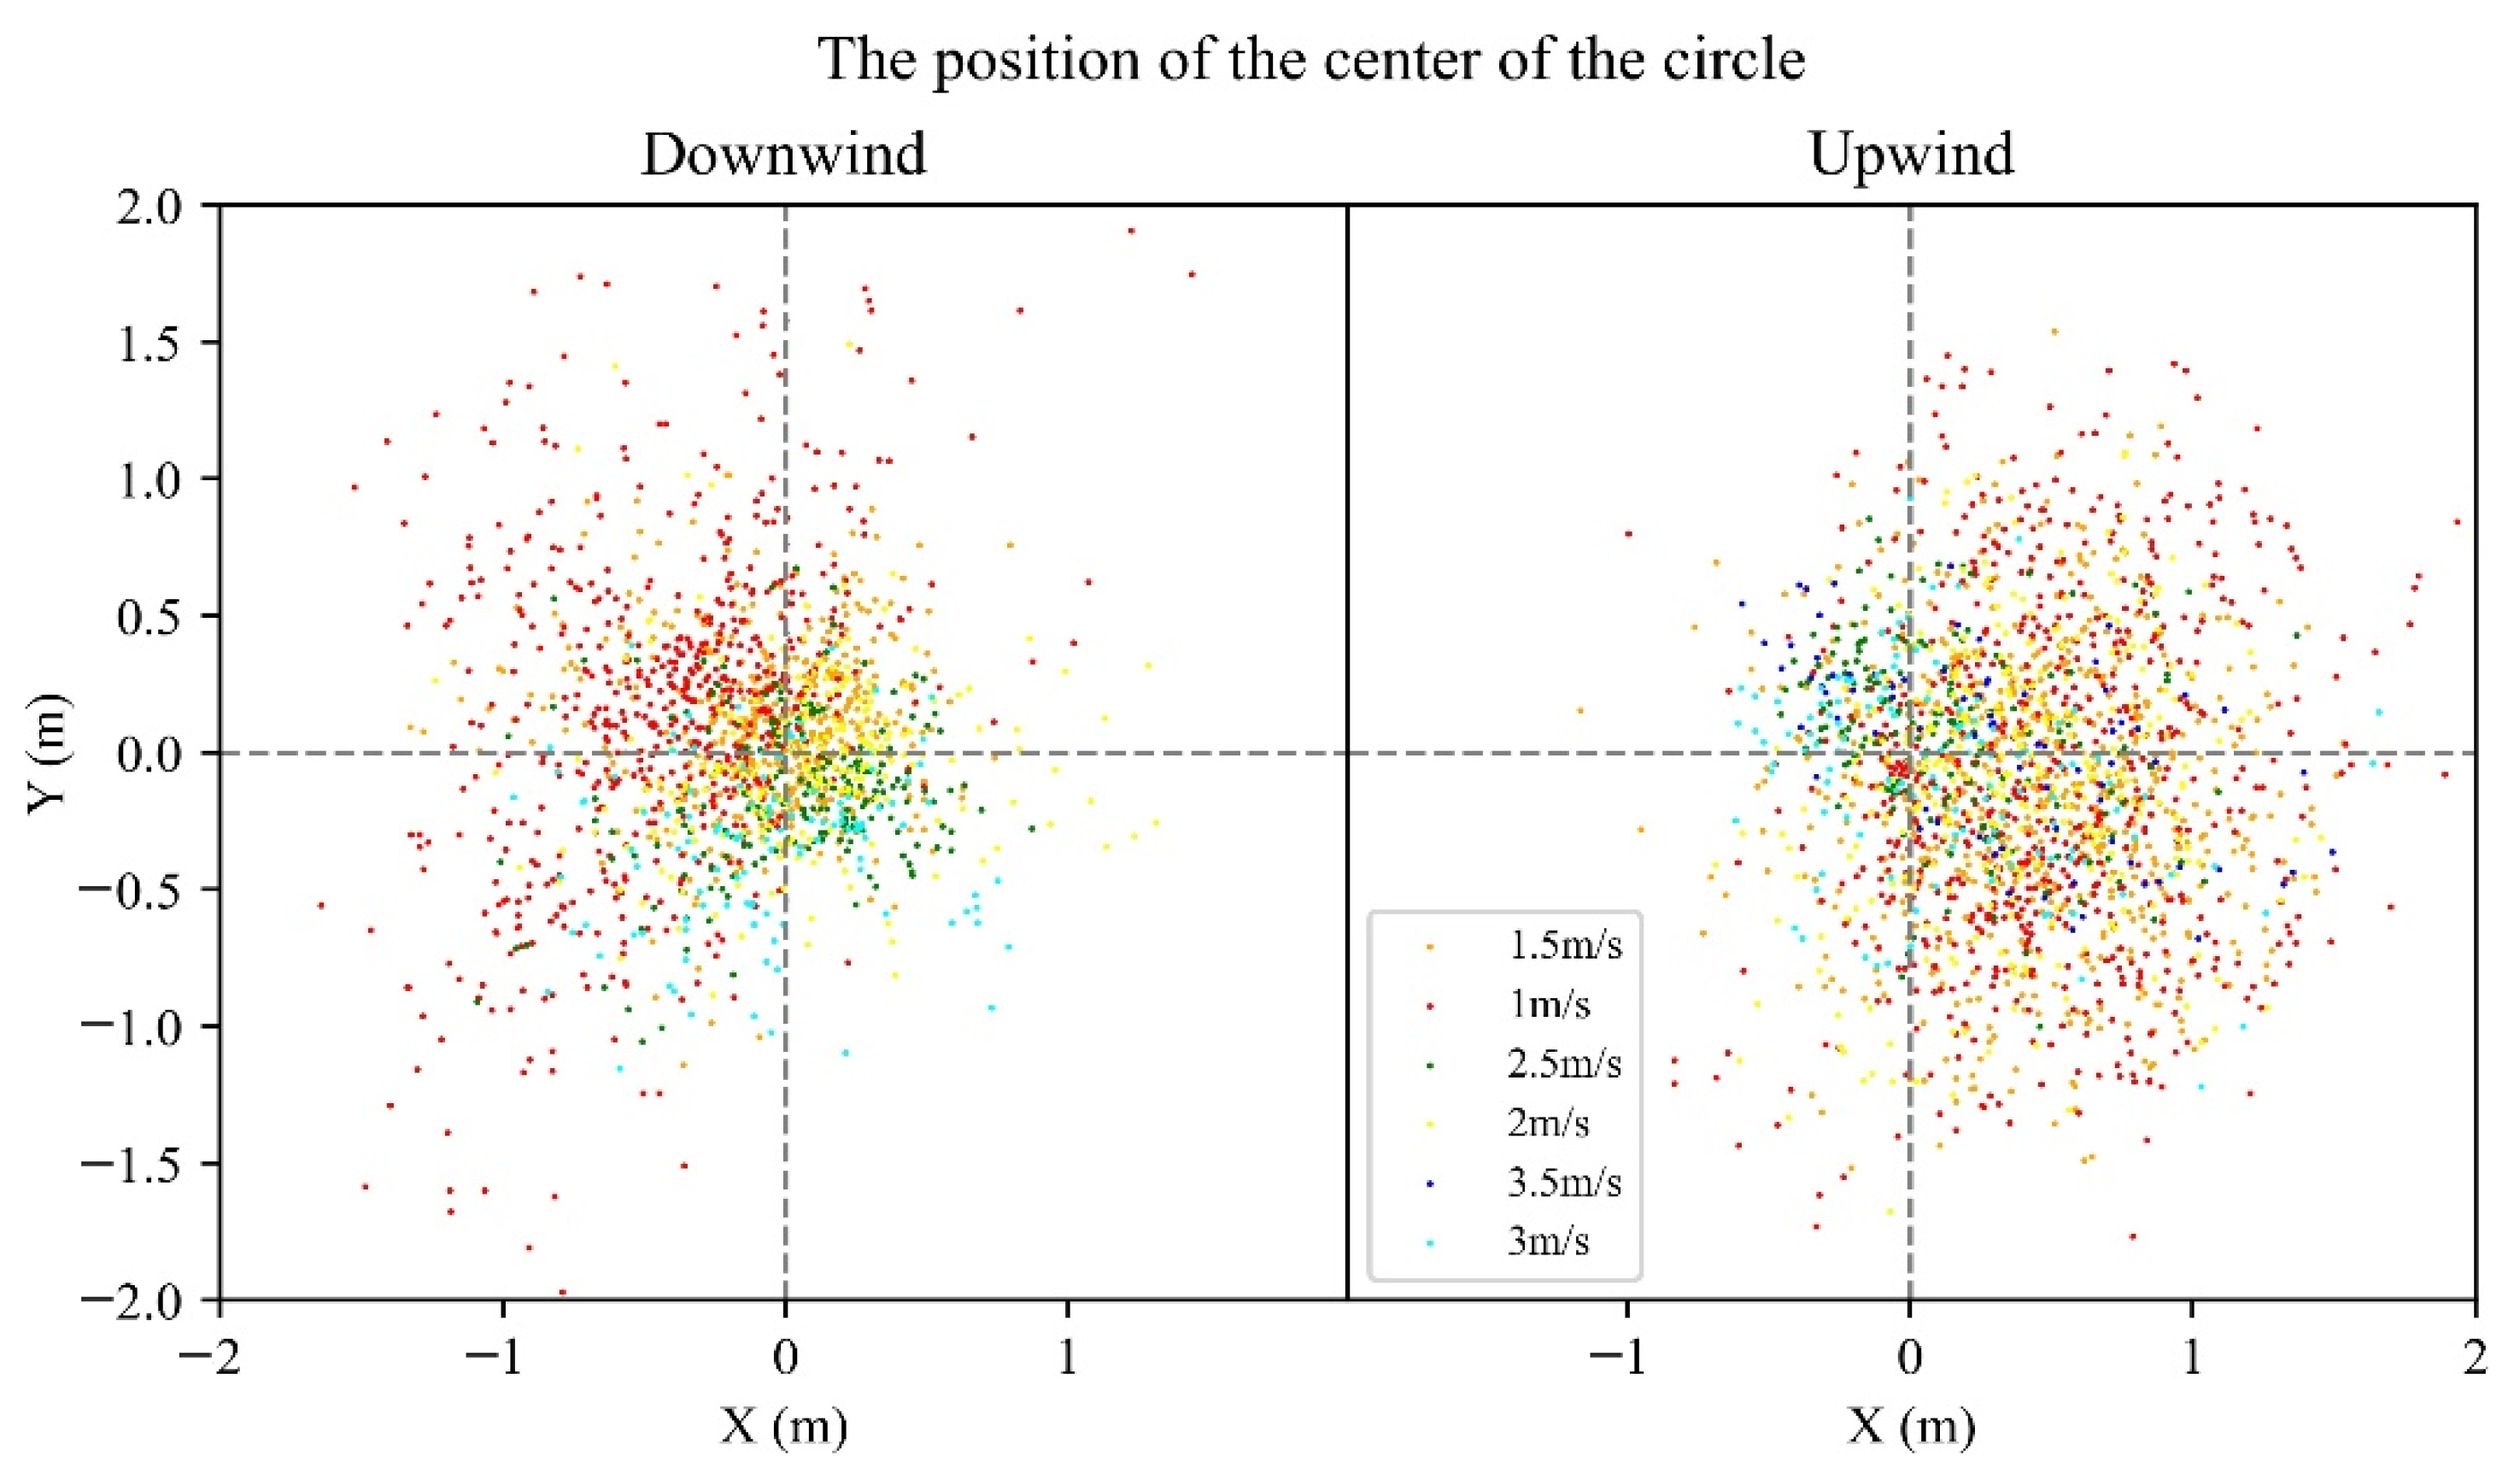
The relative positions of the circumcircle and the inscribed circle of the altitude h, velocity v, and the wind-vortex profile in the data of group A were analyzed. The formula for calculating the relative position was described as follows:
where (
,
) are the coordinates of the center of the circumscribed circle, (
,
) are the coordinates of the center of the inscribed circle, (
,
) is the position of the center of the circumscribed circle relative to the center of the inscribed circle. The relative position of the two centers can effectively reflect the protrusion of the wind-vortex profile. The position of the center of the circle described below both refer to (
,
). The distribution of the position of the center of the circle was obtained, as shown in
Figure 10.
It can be seen from
Figure 10 that the natural wind direction and the flying velocity of the UAV change the relative position of the center of the circle. The results show that both the wind direction and the UAV speed have obvious influence on the shape of the wind vortex. The distance D
c from the center of the circle was used to represent the degree of convexity of the wind vortex:
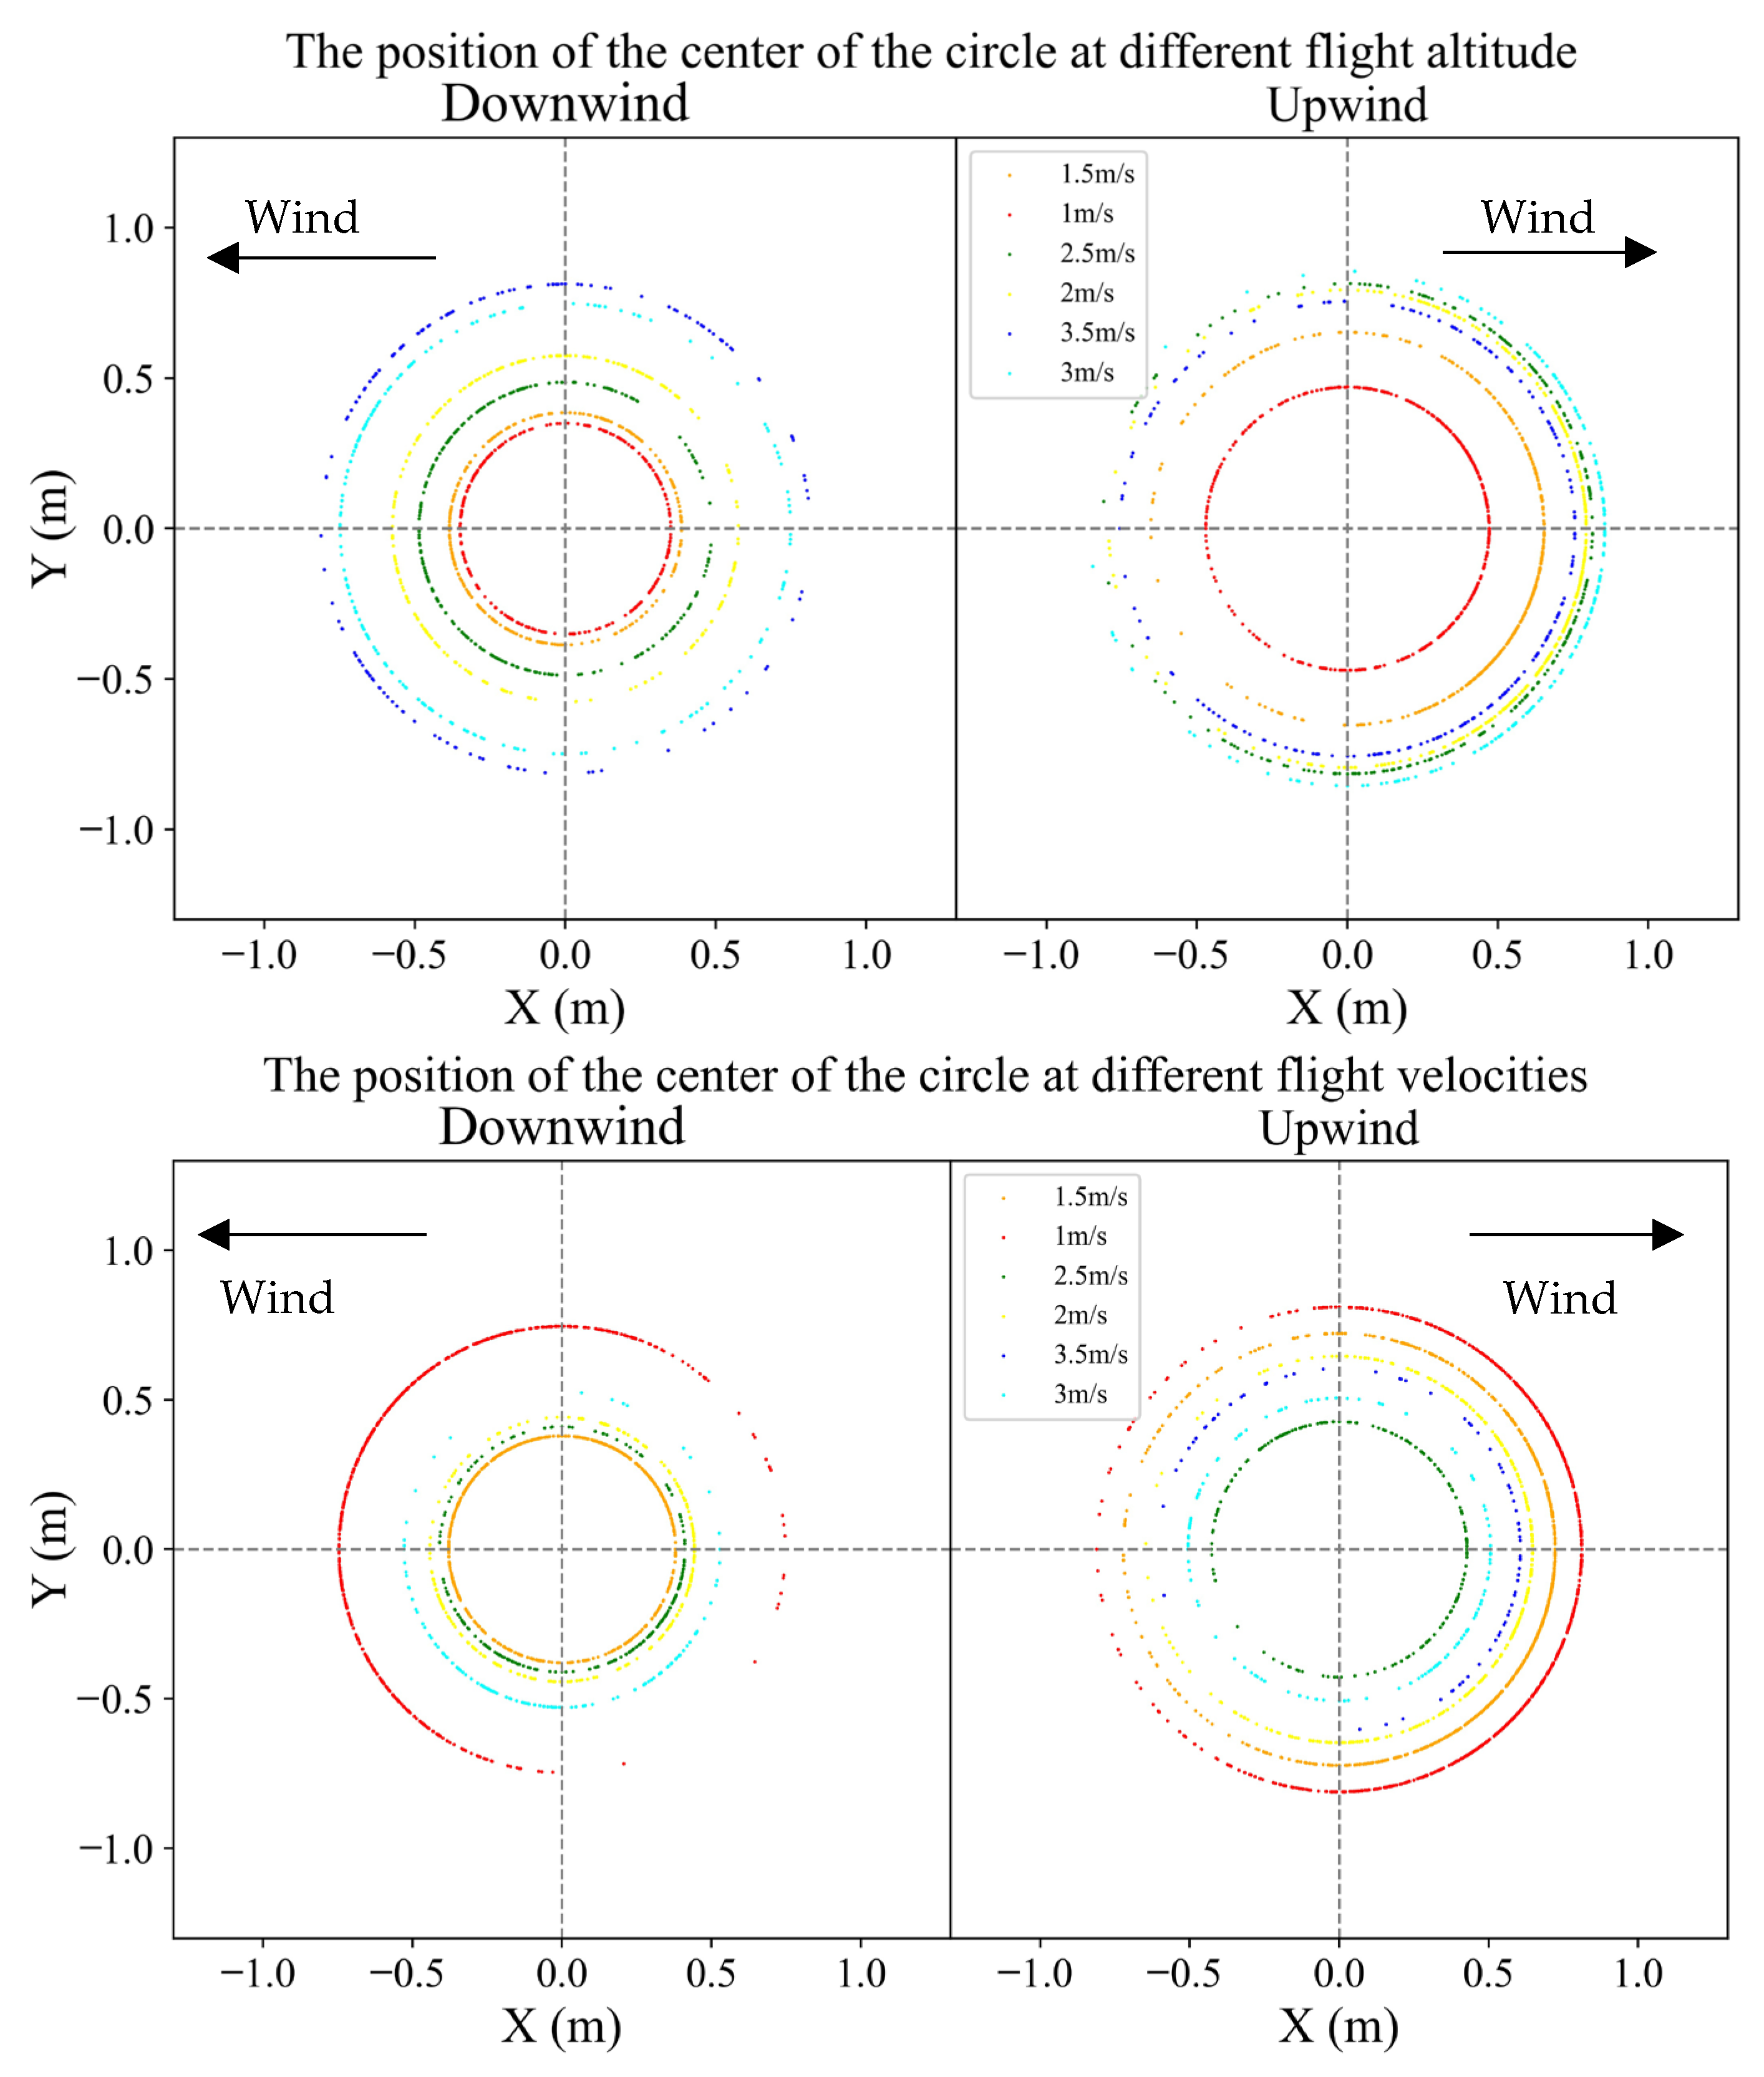
The azimuth angle α of the center of the circle was used to represent the bulging direction of the wind vortex:
The distance
from the center of the circle and the azimuth angle α of the center are shown in
Figure 11 and
Figure 12, respectively.
It can be seen from
Figure 11 that the data points of different colors almost overlap, indicating that flight parameters have no obvious influence on the degree of wind-vortex bulge, and the corresponding relationship between them is unclear. Therefore, this paper can only calculate the bulge degree of wind vortex with the approximate variation trend of flight parameters based on the distance from the center of the circle. Using the data in
Figure 11, the distance from the center of the circle under each group of flight parameters was averaged and the function of the distance from the center of the circle was fitted. F
9 and F
10 represent the trend function under downwind and upwind conditions, respectively, that is, the relation function of the degree of protrusion of the model:
For the data in
Figure 12, the same method used for the distance from the center of the circle was used to obtain the trend function of the azimuth angle of the center of the circle. F
11 and F
12 are the trend functions under downwind and upwind conditions, respectively, that is, the convex direction relation function of the model:
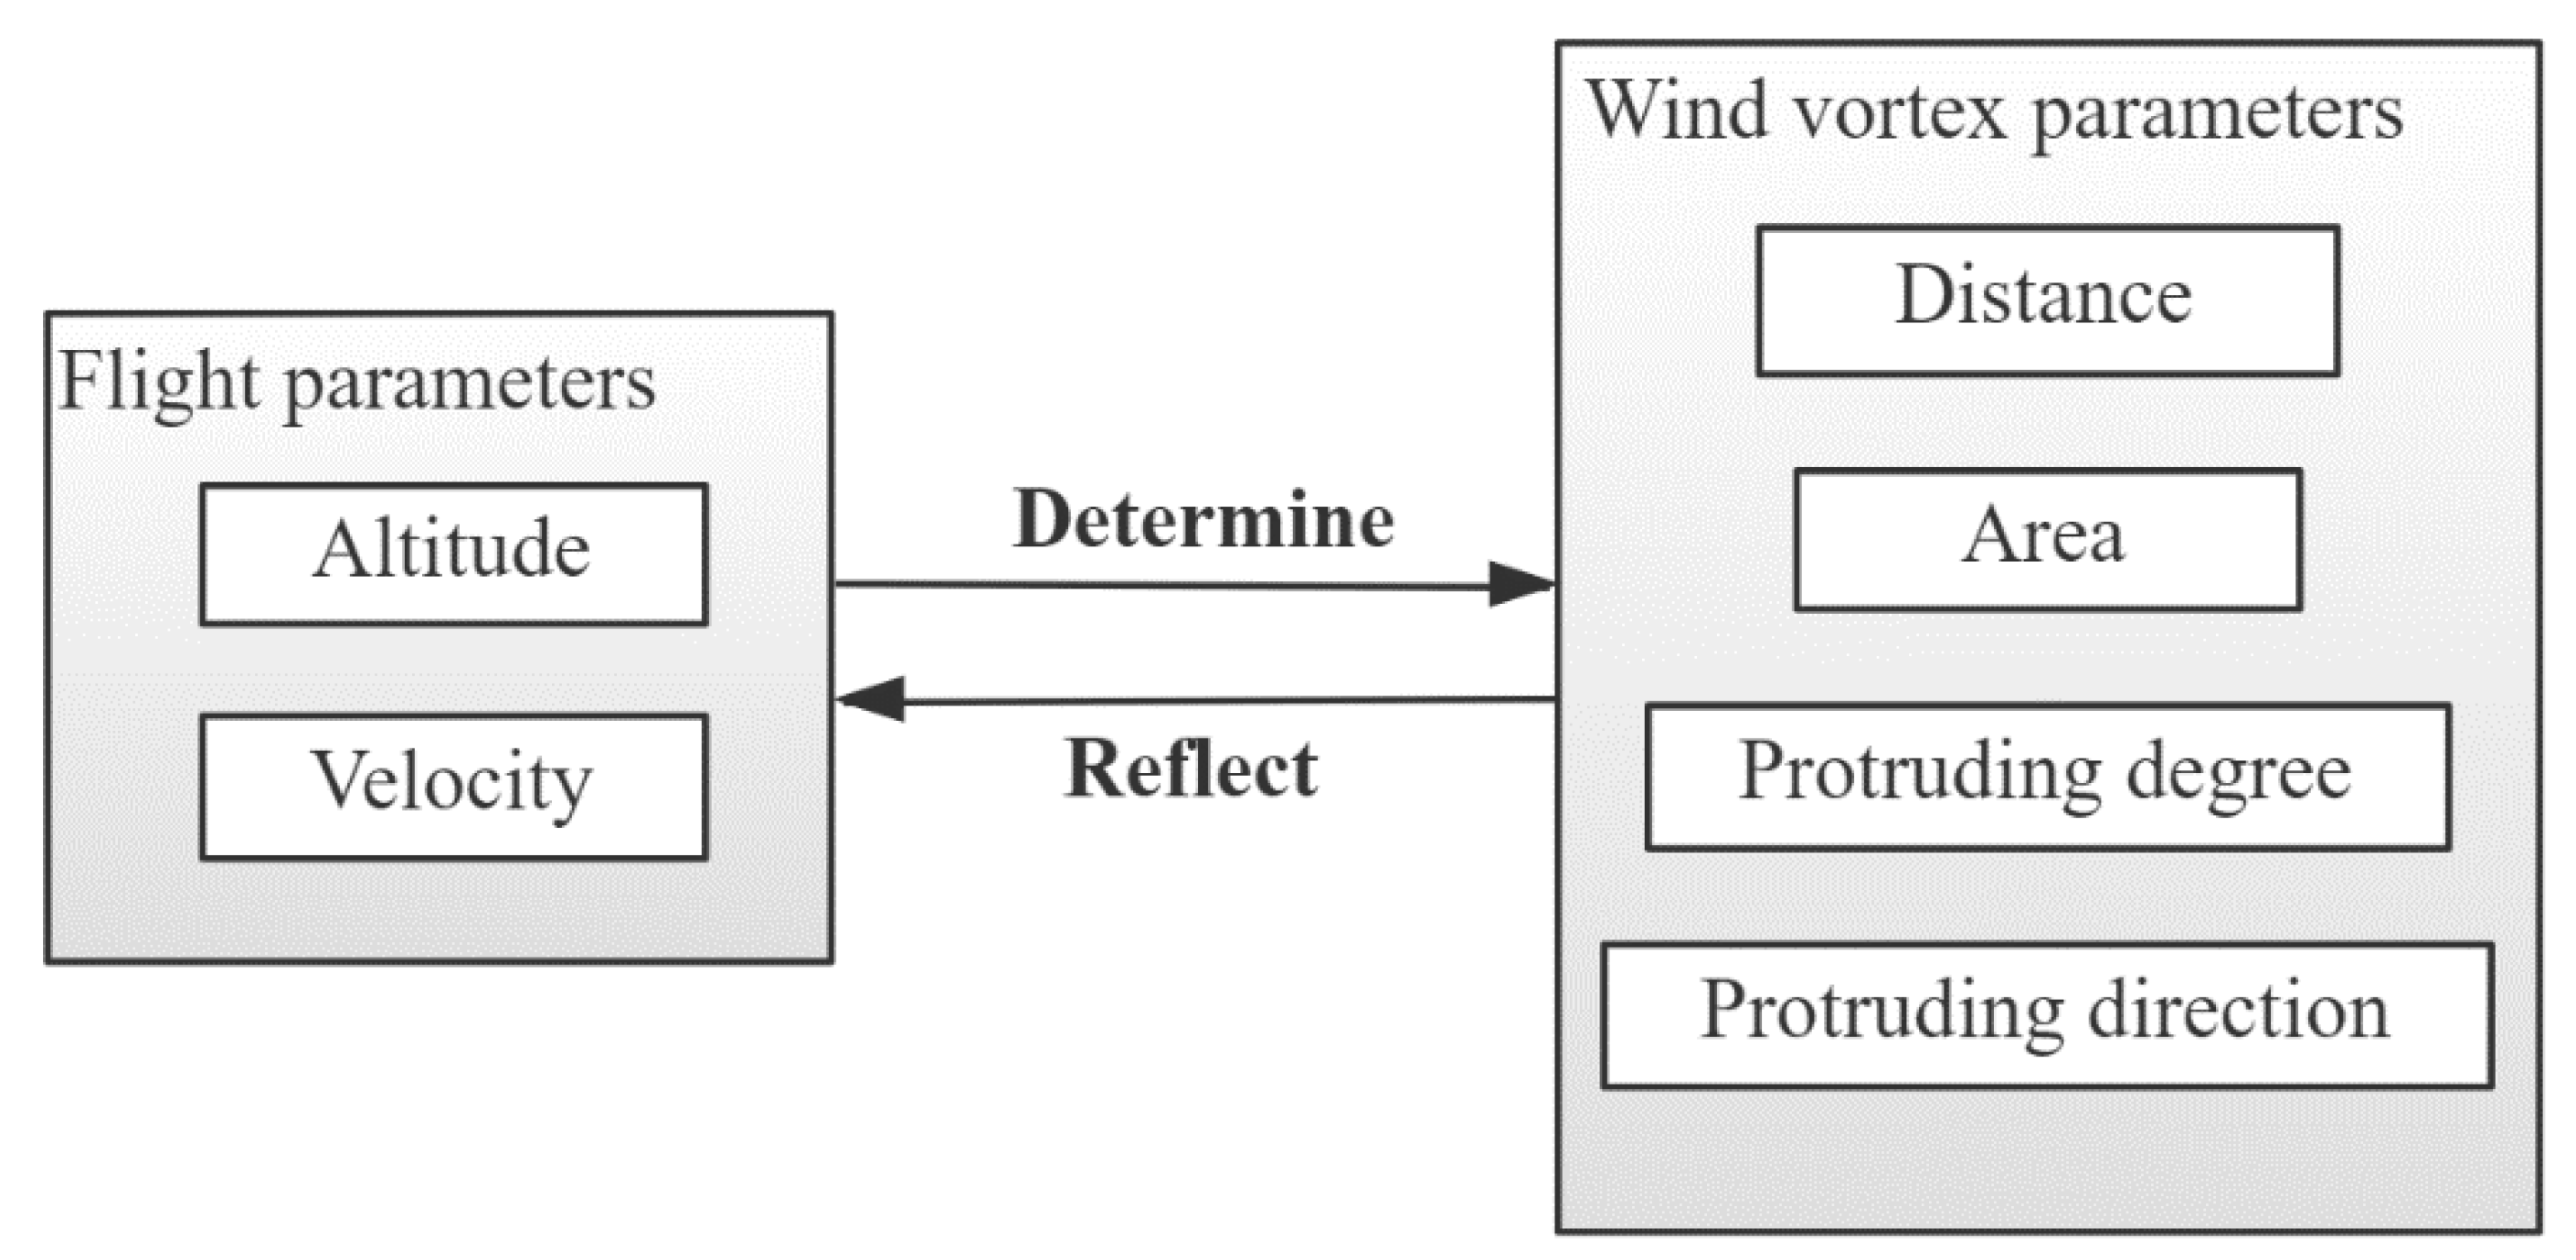
3.3. Interrelationship of Model Parameters and Control Model
The relationship between wind-vortex parameters and flight parameters is shown in
Figure 13.
As shown in
Figure 13, when the UAV sprays pesticides, the flight parameters (altitude, velocity) of the UAV determine the airflow state of the UAV, and the airflow state of the UAV determines the wind-vortex parameters (distance, area, protruding degree, protruding direction). According to this transfer process, the corresponding relationship between flight parameters and wind-vortex parameters was established. The altitude and velocity of the UAV determine the distance between the wind vortex and the UAV and the area, protruding degree, and protruding direction of the wind vortex. Correspondingly, the parameters of the wind vortex can reflect the corresponding flight altitude and velocity. When predicting flight parameters, the function value is set for the relation function, and the function value is the value of the target wind-vortex parameter; then the equation and equations of wind-vortex parameters can be obtained, and the predicted flight parameters can be obtained by solving the equations.
According to the number of wind-vortex parameters, there are three situations in the equation or equation system:
When the control objective is only distance
, the equation is described as
There are two variables in the equation. The relationship between the altitude and the velocity can be expressed as an implicit function:
The flight altitude and velocity are not unique, and the relationship between the two can be represented by an implicit function. When one parameter is determined, the other parameter is calculated by the implicit function.
When the control target parameters are the distance
and the area
, the equation system can be established according to the control target parameters:
At this time, the number of equations and the number of variables is the same, and the determined flight altitude and velocity can be obtained.
When the control target parameters are the area
, distance
, and protruding degree BS, the equation system becomes:
The number of equations is greater than the number of variables, and the system of equations has no solution. It shows that when the wind-vortex parameters are greater than two, the flight altitude and velocity cannot be predicted.
The above derivation uses the distance, area, and protruding degree of the wind vortex as examples and analyzes equations of the predicted flight parameters when the number of wind-vortex parameters is different. The above conclusions are not limited to the above three parameters, and are applicable to any wind-vortex parameters in this paper.
To sum up, assuming that
and
are two different wind-vortex parameters when the control target parameter is one, the control model form is described as
When the target parameters are 2, the form of the control model becomes
3.4. Control Model Relation Function Test
3.4.1. Distance and Area Relation Function Tests
The accuracy of the distance relation functions was tested using the data in Group B. Ideally, the interval formed by the distance between the front and rear extreme points of the wind vortex and the UAV must be included in the interval formed by the maximum and minimum functions:
In the actual data interval
, some intervals are outside the relation function interval, and the calculation interval
is the same as the relation function:
In downwind and upwind conditions, the coincidence ratios were found to be 97.1% and 97%, respectively, indicating that the relation function has good accuracy and can better reflect the relationship between the flight parameters and the wind-vortex distance.
The accuracy of the area relation function was tested using the data in Group B. Ideally, the wind-vortex area in group B data should be within the interval of the maximum and minimum functions:
For downwind and upwind conditions, 92.3% and 78.4% of the data were in the range, respectively. It shows that the accuracy of the relation function is better when the wind is down, and the relation function is poor when the wind is up. It can still reflect the relationship between the flight parameters and the wind-vortex area.
3.4.2. Wind-Vortex Bulge Degree and Bulge Direction Relation Function Test
The accuracy of the wind-vortex bulge degree and bulge direction relation function in this paper can be calculated by the coefficient of determination (
) as follows:
The functions
, and
were verified by the data of group A and group B, and the R
2 value was obtained, as shown in
Table 4.
From the R
2 value in
Table 4, the reliability of the function is verified. The shape of the wind vortex itself has a large fluctuation; thus, the relation functions of the degree and direction of the wind vortex can explain the changing trend of the wind-vortex shape.
3.4.3. Effect Test of Control Model
The control model was validated using group B data. The bulge degree and bulge direction of the wind vortex fluctuate greatly, and they do not show a stable relationship with the flight parameters. In this work, we only tested the area and distance of the wind vortex. In this paper, the maximum and minimum relation functions of wind-vortex area and distance about UAV parameters (altitude and velocity) are established. Before verification, the maximum and minimum relation functions are converted into a function representing the average value of wind-vortex parameters. The method is as follows:
and
represent the maximum and minimum functions of the wind-vortex parameters, and
represents the mean function, that is, the function used to verify the control model. According to the function, a system of equations is established:
represents the distance average function, which can be obtained from F
1–F
4, and Fs represents the area average function, which can be obtained from F
5–F
8. To reduce the influence of data fluctuation on the verification results, the model verification was conducted after averaging the parameters (wind-vortex area and distance) of each voyage in the B group data. Using the wind-vortex distance and area to establish an equation system, after solving the equation system, the predicted flight altitude and velocity were obtained, as shown in
Table 5.
The altitude difference and velocity difference in
Table 5 were obtained by subtracting the actual value from the predicted value of the model, which can reflect the direction of deviation between the flight parameters obtained by the model and the actual parameters. The absolute velocity difference or the absolute altitude difference refers to the absolute value of the altitude difference. It reflects the error size of the predicted value of the control model.
Table 5 shows that the predicted value of the altitude is too large, whereas the predicted value of the velocity is relatively small in the downwind condition. The average absolute altitude difference was 0.67 and 0.43 m and the average absolute velocity difference was 0.29 and 0.35 m/s for the downwind and the upwind conditions, respectively. The error of velocity prediction is smaller than that of altitude prediction.
4. Conclusions
The characteristics of wind vortices represent the spraying effect of pesticides, but there is no method to control wind-vortex parameters. Aiming at the above problems, this paper studies a wind-vortex characteristic control model, and proposes a wind-vortex control method based on flight parameters.
The control model of wind-vortex parameters was established. Through this model, at most two wind-vortex parameters can be converted into the flight parameters that generate the wind vortex, and the wind vortex can be controlled by setting flight altitude and velocity, which is a new way to control the wind vortex. This model provides a clear basis for the control of a wind vortex and a reference theory for the control of the spraying effect of multirotor UAVs.
The relation function of the model was established. Under stable flight parameters, the parameters of wind vortices fluctuate greatly. How to control the fluctuation of wind vortices to improve the effect of UAV application is an important research direction. The relation functions of the model established in this paper represent the correspondence between flight parameters and individual wind-vortex parameters, which provides specific data for the calculation of the control model.
The relation functions of the model were tested. The accuracy of the relation functions of distance, area, bulge degree, and bulge direction of the wind vortex are 97.1%, 92.3%, 69% and 58%, respectively, under downwind condition, and 97%, 78.4%, 62% and 57%, respectively, under upwind condition. From the verification results, it can be found that there is an obvious functional relationship between flight parameters and wind-vortex parameters. The distance and area relation functions of wind vortices have high accuracy and obvious relationships with flight parameters. The accuracy of the protrusion degree and protrusion direction relation functions is relatively low and needs to be improved in subsequent studies.
The control model was tested. Under tailwind and headwind conditions, the absolute height errors are 0.67 and 0.43 m, and the absolute speed errors are 0.29 and 0.35 m/s. The results show that the control model can convert the parameters of the wind vortex into the corresponding UAV altitude and velocity. When the UAV is spraying pesticides, the wind-vortex parameters can be controlled indirectly by controlling the flight parameters so as to control the pesticide spraying effect. However, there are still obvious errors between the calculated flight parameters and the actual flight parameters. In order to make the model have greater practical value, the accuracy of the model needs to be improved.
5. Prospect
Limited by equipment conditions and personal level, this paper has some shortcomings, which need to be improved in the follow-up research. For experimental equipment, higher frequency satellite positioning systems can be used to collect more flight parameters. The use of a new generation of aerial cameras, such as the Mavic 3, allows sharper images of wind vortices to be captured, more accurate wind-vortex parameters to be obtained, and improved model accuracy. In terms of model optimization, real-time environmental wind information, UAV quality, and other parameters can be added to the model to reduce the calculation error of the model and enhance the practicality of the model. These will be the focus of the team’s follow-up work.
Author Contributions
Conceptualization: Z.L. and J.L.; Resources: J.L., H.L., H.C. and L.W.; Data curation: Z.L.; Software: Z.L. and G.F.; Formal Analysis: Z.L.; Supervision: J.L. and H.L.; Validation: Z.L.; Funding acquisition: J.L.; Investigation: Z.L., J. L., G.F., S.Y., Z.Z., H.W. and B.L.; Visualization: Z.L. and J. L.; Methodology: J.L., G.F. and Z.L.; Writing—original draft: Z.L.; Project administration: J.L.; Writing—review and editing: J.L. and Z.L. All authors have read and agreed to the published version of the manuscript.
Funding
This research was funded by the Guangzhou Key Research And Development Project (Grant No. 202206010164) and the Natural Science Foundation of Guangdong, China (Grant No. 2023A1515011932) and the 2022 “Innovation Dream Factory” Student Innovation Leading Program of South China Agricultural University.
Institutional Review Board Statement
Not applicable.
Data Availability Statement
Not applicable.
Acknowledgments
Thanks to the “Guangzhou Key Research And Development Project, Natural Science Foundation of Guangdong, China, 2022 ‘Innovation Dream Factory’ Student Innovation Leading Program of South China Agricultural University” for the financing of this research.
Conflicts of Interest
The authors declare no conflict of interest.
References
- Li, J.; Hu, X.; Lan, Y.; Deng, X. Research advance on worldwide agricultural UAVs in 2001-2020 based on bibliometrics. Trans. Chin. Soc. Agric. Eng. 2021, 37, 328–339. [Google Scholar]
- Zhang, Y.; Huang, X.; Lan, Y.; Wang, L.; Lu, X.; Yan, K.; Deng, J.; Zeng, W. Development and Prospect of UAV-Based Aerial Electrostatic Spray Technology in China. Appl. Sci. 2021, 11, 4071. [Google Scholar] [CrossRef]
- Zhang, H.; Wang, L.; Tian, T.; Yin, J. A Review of Unmanned Aerial Vehicle Low-Altitude Remote Sensing (UAV-LARS) Use in Agricultural Monitoring in China. Remote Sens. 2021, 13, 1221. [Google Scholar] [CrossRef]
- Zhou, Z.; Ming, R.; Zang, Y.; He, X.; Luo, X.; Lan, Y. Development status and countermeasures of agricultural aviation in China. Trans. Chin. Soc. Agric. Eng. 2017, 33, 1–13. [Google Scholar]
- Wang, L.; Lan, Y.; Zhang, Y.; Zhang, H.; Tahir, M.N.; Ou, S.; Liu, X.; Chen, P. Applications and Prospects of Agricultural Unmanned Aerial Vehicle Obstacle Avoidance Technology in China. Sensors 2019, 19, 642. [Google Scholar] [CrossRef]
- Yin, X.; Lan, Y.; Wen, S.; Zhang, J.; Wu, S. Natural UAV tele-operation for agricultural application by using Kinect sensor. Int. J. Agric. Biol. Eng. 2018, 11, 173–178. [Google Scholar] [CrossRef]
- Zhang, P.; Wang, K.; Lyu, Q.; He, S.; Yi, S.; Xie, R.; Zheng, Y.; Ma, Y.; Deng, L. Droplet distribution and control against citrus leafminer with UAV spraying. Int. J. Robot. Autom. 2017, 32, 299–307. [Google Scholar] [CrossRef]
- Wang, C.L.; Liu, Y.; Zhang, Z.H.; Han, L.; Li, Y.F.; Zhang, H.; Wongsuk, S.; Li, Y.Y.; Wu, X.M.; He, X.K. Spray performance evaluation of a six-rotor unmanned aerial vehicle sprayer for pesticide application using an orchard operation mode in apple orchards. Pest Manag. Sci. 2022, 78, 2449–2466. [Google Scholar] [CrossRef]
- Wang, G.B.; Lan, Y.B.; Qi, H.X.; Chen, P.C.; Hewitt, A.; Han, Y.X. Field evaluation of an unmanned aerial vehicle (UAV) sprayer: Effect of spray volume on deposition and the control of pests and disease in wheat. Pest Manag. Sci. 2019, 75, 1546–1555. [Google Scholar] [CrossRef]
- Li, X.; Giles, D.K.; Niederholzer, F.J.; Andaloro, J.T.; Lang, E.B.; Watson, L.J. Evaluation of an unmanned aerial vehicle as a new method of pesticide application for almond crop protection. Pest Manag. Sci. 2021, 77, 527–537. [Google Scholar] [CrossRef]
- Lan, Y.; Chen, S.; Deng, J.; Zhou, Z.; Ou, Y. Development situation and problem analysis of plant protection unmanned aerial vehicle in China. J. South China Agric. Univ. 2019, 40, 217–225. [Google Scholar]
- Lou, S.; Xue, X.; Gu, W.; Cui, L.; Zhou, Q.; Wang, X. Current Status and Trends of Agricultural Plant Protection Unmanned Aerial Vehicle. J. Agric. Mech. Res. 2017, 39, 1–6. [Google Scholar]
- Meng, Y.; Lan, Y.; Mei, G.; Guo, Y.; Song, J.; Wang, Z. Effect of aerial spray adjuvant applying on the efficiency of small unmanned aerial vehicle for wheat aphids control. Int. J. Agric. Biol. Eng. 2018, 11, 46–53. [Google Scholar] [CrossRef]
- Mukherjee, A.; Misra, S.; Raghuwanshi, N.S. A survey of unmanned aerial sensing solutions in precision agriculture. J. Netw. Comput. Appl. 2019, 148, 102461. [Google Scholar] [CrossRef]
- Tian, Z.; Xue, X.; Li, L.; Cui, L.; Wang, G.; Li, Z. Research status and prospects of spraying technology of plant-protection unmanned aerial vehicle. J. Agric. Mech. Res. 2019, 40, 37–45. [Google Scholar] [CrossRef]
- Chen, S.; Lan, Y.; Zhou, Z.; Liao, J.; Zhu, Q. Effects of spraying parameters of small plant protection UAV on droplets deposition distribution in citrus canopy. J. South China Agric. Univ. 2017, 38, 97–102. [Google Scholar]
- Guo, S.; Li, J.; Yao, W.; Zhan, Y.; Li, Y.; Shi, Y. Distribution characteristics on droplet deposition of wind field vortex formed by multi-rotor UAV. PLoS ONE 2019, 14, e0220024. [Google Scholar] [CrossRef]
- He, Y.; Wu, J.; Fang, H.; Zheng, Q.; Xiao, S.; Cen, H. Research on deposition effect of droplets based on plant protection unmanned aerial vehicle. J. Zhejiang Univ. (Agric. Life Sci.) 2018, 44, 392–398. [Google Scholar]
- He, Y.; Xiao, S.; Fang, H.; Dong, T.; Tang, Y.; Nie, P.; Wu, J.; Luo, S. Development situation and spraying decision of spray nozzle for plant protection UAV. Trans. Chin. Soc. Agric. Eng. 2018, 34, 113–124. [Google Scholar]
- Li, J.; Guo, S.; Yao, W.; Zhan, Y.; Li, Y. Distribution Characteristics of Droplet Size in Rice Field and Wind Tunnel Simulation Test under Airflow Operation. Trans. Chin. Soc. Agric. Mach. 2019, 50, 148–156. [Google Scholar]
- Wang, C.; Song, J.; He, X.; Wang, Z.; Wang, S.; Meng, Y. Effect of flight parameters on distribution characteristics of pesticide spraying droplets deposition of plant-protection unmanned aerial vehicle. Trans. Chin. Soc. Agric. Eng. 2017, 33, 109–116. [Google Scholar]
- Wei, X.; Li, J.; Long, B.; Hu, X.; Wu, H.; Li, H. Method for Vortex Shape Retrieval and Area Calculation Based on Convex Hull Algorithm. IEEE Access 2021, 9, 2706–2714. [Google Scholar] [CrossRef]
- Yang, F.; Xue, X.; Cai, C.; Zhou, Q. Effect of down wash airflow in hover on droplet motion law for multi-rotor unmanned plant protection machine. Trans. Chin. Soc. Agric. Eng. 2018, 34, 64–73. [Google Scholar]
- Yang, Z.; Ge, L.; Qi, L.; Cheng, Y.; Wu, Y. Influence of UAV Rotor Down-wash Airflow on Spray Width. Trans. Chin. Soc. Agric. Mach. 2018, 49, 116–122. [Google Scholar]
- Li, J.; Lan, Y.; Shi, Y. Research progress on airflow characteristics and field pesticide application system of rotary-wing UAV. Trans. Chin. Soc. Agric. Eng. 2018, 34, 104–118. [Google Scholar]
- Gangao, F.; Zhijie, L.; Yijuan, Q.; Bo, L.; Huifen, L.; Jiyu, L. Airflow characteristics of rotorcraft plant protection UAV operating in rice fields. Biosyst. Eng. 2023, 226, 209–222. [Google Scholar]
- Li, L.; Hu, Z.; Liu, Q.; Yi, T.; Han, P.; Zhang, R.; Pan, L. Effect of flight velocity on droplet deposition and drift of combined pesticides sprayed using an unmanned aerial vehicle sprayer in a peach orchard. Front. Plant Sci. 2022, 13. [Google Scholar] [CrossRef]
- Tian, Z.; Xue, X.; Xu, Y.; Yang, F.; Sun, Z. Effect of Plant Protection UAVs Downwash on Crop Canopy. Trans. Chin. Soc. Agric. Mach. 2021, 52, 40–48. [Google Scholar]
Figure 1.
UAV used in this study for plant protection.
Figure 1.
UAV used in this study for plant protection.
Figure 2.
Experimental process and method of recording wind-vortex image. (a) Experimental method. (b) Aerial imagery.
Figure 2.
Experimental process and method of recording wind-vortex image. (a) Experimental method. (b) Aerial imagery.
Figure 3.
Identification of wind-vortex parameters. (a) Interframe difference. (b) Gaussian blur. (c) Binarization. (d) Mean blur. (e) Binarization. (f) Wind-vortex outline. Note: The identification steps of the wind vortex include (a) Interframe difference, (b) Gaussian blur, (c) Binarization, (d) Mean blur, (e) Binarization, and (f) generation of the wind-vortex contour.
Figure 4.
Identification of colors in images. (a) Original image. (b) Recognition result.
Figure 4.
Identification of colors in images. (a) Original image. (b) Recognition result.
Figure 5.
Wind-vortex parameters. (a) Original image of the wind vortex. (b) Binary image of the wind vortex. Note: The binary image (b) of the wind vortex is obtained by identifying the original wind-vortex image (a). The white outline in image (a) is the wind-vortex boundary, P is the wind-vortex centroid, PUAV is the center of the UAV, and D is the distance between the UAV and the centroid of the wind vortex. Pf and Pr are the front and rear extreme points of the wind vortex, respectively, Df and Dr are the distances between the front and rear extreme points and the UAV, respectively, and df and dr are the distance between the front and rear extreme points and the centroid of the wind vortex, respectively.
Figure 6.
Inscribed and circumscribed circles of the wind-vortex profile. (a) Wind-vortex image. (b) Circumscribed circle and inscribed circle. Note: The minimum circumscribed circle and the maximum inscribed circle in (b) are obtained from (a) the wind-vortex profile. The orange and red circles represent the circumscribed circle and the inscribed circle, respectively, and the orange and red dots represent the circumscribed circle and the inscribed circle, respectively. In the center of the inscribed circle, the gray arrow represents the relative position of the two circles, that is, the convex direction of the wind vortex.
Figure 7.
Scatter plot of the wind-vortex distance.
Figure 7.
Scatter plot of the wind-vortex distance.
Figure 8.
95% confidence interval of wind-vortex distance at each flight, altitude, and speed.
Figure 8.
95% confidence interval of wind-vortex distance at each flight, altitude, and speed.
Figure 9.
Scatter plot of wind-vortex area.
Figure 9.
Scatter plot of wind-vortex area.
Figure 10.
Relative positions of the inscribed circle and the circumscribed circle. Note: The flight direction of the drone is parallel to the x-axis, and it flies in the negative direction of the x-axis; the center of the inscribed circle in the coordinate system is the origin, and the data points in the coordinate system are the position of the center of the circumscribed circle relative to the center of the inscribed circle.
Figure 11.
Distance between the center of the inscribed circle and the center of the circumcircle.
Figure 11.
Distance between the center of the inscribed circle and the center of the circumcircle.
Figure 12.
Orientation of the circumscribed circle relative to the inscribed circle. Note: Data points of different velocities or altitudes are distributed on circles with different radii. The radius of the circle represents the average distance between the two circle centers at the velocity or altitude, and the direction of the points on the circle relative to the origin of the coordinates represents the relative distance between the centers of the circumscribed circles. The direction of the center of the circumscribed circle relative to the center of the inscribed circle represents the protruding direction of the wind vortex.
Figure 13.
Relationship between flight parameters and wind-vortex parameters.
Figure 13.
Relationship between flight parameters and wind-vortex parameters.
Table 1.
Specifications of the UAV.
Table 1.
Specifications of the UAV.
| | Main Parameter | Norms and Numerical |
|---|
| UAV used for plant protection | Type | E410 Quad-Multirotor UAV |
| Wheelbase (mm) | 1200 |
| Blade size (inch) | 30 |
| Flight control | Pixhawk-Orange |
| Weight (kg) | 14.2 |
| Power battery | 22,000 mAh 6 S × 2 |
| Positioning system | K705(RTK) |
| UAV used for aerial photography | Type | Mavic 2 |
| Battery life (min) | 31 |
| Pixel (megapixel) | 20 |
| Angle (deg) | 77 |
| Resolution (pi) | 2688 × 1512 |
| Frame rate (FPS) | 60 |
Table 2.
Flight parameters of the UAV used for plant protection.
Table 2.
Flight parameters of the UAV used for plant protection.
| Altitude Range (m) | Velocity Range (m/s) | Altitude Gradient (m) | Velocity Gradient (m/s) |
|---|
| 1–3.5 | 1–3.5 | 0.5 | 0.5 |
Table 3.
Data differences.
Table 3.
Data differences.
| | | Wind-Vortex Area (m2) | Wind-Vortex Distance (m) |
|---|
| | | Downwind | Upwind | Downwind | Upwind |
|---|
| Mean | Total | 12.63 | 9.73 | 0.44 | 2.77 |
| Group A | 12.63 | 9.71 | 0.44 | 2.77 |
| Group B | 12.66 | 9.83 | 0.41 | 2.75 |
| Max | Total | 23.95 | 20.27 | 3.21 | 9.43 |
| Group A | 23.95 | 19.60 | 3.21 | 9.43 |
| Group B | 21.26 | 20.27 | 2.48 | 7.11 |
| Min | Total | 0.94 | 0.91 | −4.37 | 0.47 |
| Group A | 0.94 | 0.97 | −4.37 | 0.47 |
| Group B | 3.50 | 0.91 | −2.16 | 0.50 |
Table 4.
Test results of the wind-vortex bulge degree and the bulge direction relation function.
Table 4.
Test results of the wind-vortex bulge degree and the bulge direction relation function.
| R2 | | | | |
|---|
| Group A | 0.72 | 0.81 | 0.77 | 0.67 |
| Group B | 0.69 | 0.62 | 0.58 | 0.57 |
Table 5.
Model predictions compared to actual values.
Table 5.
Model predictions compared to actual values.
| | Average Altitude Difference (m) | Average Absolute Altitude Difference (m) | Average Velocity Difference (m/s) | Average Absolute Velocity Difference (m/s) |
|---|
| Downwind | 0.42 | 0.67 | −0.12 | 0.29 |
| Upwind | −0.14 | 0.43 | 0.27 | 0.35 |
| Disclaimer/Publisher’s Note: The statements, opinions and data contained in all publications are solely those of the individual author(s) and contributor(s) and not of MDPI and/or the editor(s). MDPI and/or the editor(s) disclaim responsibility for any injury to people or property resulting from any ideas, methods, instructions or products referred to in the content. |
© 2023 by the authors. Licensee MDPI, Basel, Switzerland. This article is an open access article distributed under the terms and conditions of the Creative Commons Attribution (CC BY) license (https://creativecommons.org/licenses/by/4.0/).


