Article

Alteration of Carbohydrate Metabolism in Fusarium Infected Wheat Kernels Treated with Fungicides and Its Relation to Baking Technological Parameters and Deoxynivalenol Contamination

1
Cereal Quality and Food Innovation Research Group, Cereal Research Nonprofit Ltd., 6726 Szeged, Hungary
2
Department of Microbiology, Faculty of Science and Informatics, University of Szeged, 6726 Szeged, Hungary
3
Department of Applied Biotechnology and Food Science, Budapest University of Technology and Economics, 1111 Budapest, Hungary
4
FBFD PTY Ltd., Beecroft, NSW 2119, Australia
*
Author to whom correspondence should be addressed.
Agriculture 2023, 13(4), 868; https://doi.org/10.3390/agriculture13040868
Submission received: 10 March 2023 / Revised: 6 April 2023 / Accepted: 11 April 2023 / Published: 14 April 2023
(This article belongs to the Topic Crop Ecophysiology: From Lab to Field)

Abstract

:
Changes of water-soluble carbohydrate (WSC) content such as fructose, glucose, sucrose, maltose, nystose, raffinose, stachyose and fructan were analyzed in wheat kernels in Fusarium epidemic and non-epidemic seasons. In both season types, eight commercial fungicides were applied and three wheat varieties with differing Fusarium resistance were tested. In the epidemic year, the average total amount of WSC was above 1.6% which was 2 times higher than in the non-epidemic year (0.7%). Sucrose, maltose, raffinose and fructan components determined the increased WSC value, but the most substantial change was observed in maltose content where its average amount was 28 times higher in the epidemic year. Fungicide application also significantly increased all the carbohydrate components except maltose, where significant reduction was observed. WSC components had strong correlation with several farinograph or extensograph parameters, but only the maltose content showed positive strong correlation (r = 0.9) with deoxynivalenol (DON) toxin that was highly affected by the applied fungicide. The changes of WSC indicate altered carbohydrate synthesis along with abnormal degradation processes and thus have impaction on the baking features. It seems that the sugar metabolism interacts with DON synthesis and the results give important additional information to the altered metabolism of the attacked plant.

1. Introduction

Water-soluble carbohydrates are minor components in wheat endosperm with total values of 1–2% [1,2]. The most abundant soluble carbohydrates in wheat are glucose, fructose, galactose as monosaccharides, sucrose, maltose as disaccharides, and raffinose as trisaccharide [3,4]. Fructans, the oligosaccharides of fructose with the degree of polymerization 2–10, are also present in remarkable amounts in wheat grain [5].
Simple carbohydrates play nonstructural roles in plant life involving nutrients, hormone-like signaling molecules or regulators of metabolism, stress responses, and growth and development [6]. The content levels of soluble carbohydrates and their compositions in grain change during wheat kernel development from anthesis until maturity. This carbohydrate content level is negatively correlated with storage compounds such as starch and protein. Studies showed [7,8] that fructan is the major carbohydrate with a maximum value of 35% in the early developing grain, but the monosaccharides (glucose, fructose) and sucrose also reach their highest concentration in this period (3% and 7%, respectively). Once grain filling started, these compounds were consumed while large amounts of starch, protein and fiber components were deposited simultaneously.
Partially due to climate change, plant survival under environmental stresses and the role of WSC in abiotic stress has been extensively investigated. Many studies, including [9,10], have shown that abiotic stress such as salt, drought, or freezing causes increased water soluble carbohydrate concentration. Stress tolerant varieties in those studies accumulated higher carbohydrate content than that of the intolerant ones. In most of the previous studies, the main goal was to characterize the role of carbohydrates in the stress responses. That goal has resulted in a focus on the vegetative parts of plants (leaves and seedlings), and only a few studies have investigated changes of sugar metabolism in grains. Those few with grain observations have shown interactions between environmental conditions and sugar concentration in cereal grain too, even the tendencies are the same. For example, ref. [11] reported an increase of sucrose and reducing other sugars in heat-stressed wheat grain during grain filling, and another [12] supported this finding.
Fusarium head blight (FHB) FGB also influence the carbohydrate metabolism in wheat, but only a limited number of research papers was found on this topic. Fusarium infection can cause direct damage to kernels, resulting in yield loss and poor flour quality varying for resistance level and protective capacity of the fungicides [13]. Fusarium infection also leads an increased carbohydrate content in both wheat shoots and kernels similar to the effects described for abiotic stresses [14,15,16], but in leaf diseases we do not have toxin problems.
Simple carbohydrates occurring in the wheat endosperm do not play a significant part in technological quality of wheat flour, especially not in rheological properties. The only exception could be maltose, as it supposedly forms mostly from the degradation of starch by the activity of α-amylase and β-amylase [1]. In this way the amount of maltose is in negative correlation with Hagberg falling number (HFN) [1,17,18]. We should add that for Fusarium the higher rate of soluble carbohydrates may originate from the inhibition of starch synthesis, therefore, the water soluble sugars cannot be used and remain soluble form. In the bread making procedure, simple carbohydrates act as a substrate for yeast during fermentation and can be involved in caramelization and Maillard reactions [19].
In earlier studies, significant differences were found in technological parameters between treated and untreated wheat samples when severe Fusarium infection occurred [13,20]. Among the quality traits, HFN values depended significantly on the applied fungicide and thus it was correlated to the extent of infection.
The purpose of this study was to investigate the background of these changes from the point of view of water-soluble carbohydrate content. Aside from carbohydrate changes, the correlation between technological parameters, DON content and carbohydrate content was also followed to identify possible connections between soluble sugar content and DON contamination.

2. Materials and Methods

2.1. Field Experiments

Flour samples were collected from farm-scale fungicide trials as published in [20]. Three wheat varieties with differing Fusarium resistance were examined: the Fusarium sensitive (GK Kalasz, S), a moderately susceptible (GK Bekes, MS), and a moderately resistant (GK Feny, MR) cultivar. The wheat varieties were tested for 2 years (2010–2011) at Kiszombor, the test site of the Cereal Research Non-Profit Company (46°10 N, 20°25 E, altitude 83 m). In May and June of 2010 there were nearly 300 mm rain measured at high temperatures, and a severe Fusarium Head Blight (FHB) epidemic developed. The next year, 2011, was a dry year with 100 mm of precipitation in the same period. The epidemic level was low, only sporadic infections developed.
Natural Fusarium contamination was enhanced by maize as previous crop. Fungicide treatments were carried out at full flowering. Eight commercial fungicides were selected for testing (Table 1) that were chosen from the suggested fungicides against FHB by the fungicide producers and earlier experiences. The control plots (or UTC as untreated control), designated as treatment 9, were not treated by chemicals. The experiments were carried out in triplicate.
3 kg grain was separated from each subplot after harvest, which served as experimental material for the quality analysis. White flour was ground by Brabender Senior Laboratory Mill (four break and four reduction rolls, sieve size < 195 µm) after conditioning wheat samples. DON analyses were made within 3–4 months after harvest. The same happened with the flour quality data published in 2017 [13] at internet edition. Flour samples for sugar analyses were kept in a dry, cool environment until usage at 4 °C and were analyzed within one year after harvest. We had this storage in refrigerator and dry to keep the original physiological status as far as possible. This was applied in both years.

2.2. Determination of Simple Carbohydrates

The extraction of the carbohydrates was carried out according to [21] with minor modification. Finely ground, 50 mg white flour samples were extracted with 3 mL of methanol/water (80/20, v/v) for 2 h with a vertical shaker at 20 °C to prevent the effect of the endogenous enzymes. After centrifugation (11,200× g, 10 min) the supernatants were filtered through a 0.22 µm PTFE membrane filter (Phenomenex, Bologna, Italy). Ribitol (10 µL, 0.5 mg/mL) as internal standard was added to 1 mL of the filtrates, and 5 μL of the final solution was injected into the LC-MS system. LC-MS/MS analyses were carried out on a Shimadzu Nexera XR HPLC system (Duisburg, Germany) coupled to a TSQ Quantum Access triple quadrupole mass spectrometer (Thermo Fisher Scientific, San Jose, CA, USA) equipped with an H-ESI probe. Liquid chromatographic separation was performed using a SeQuant (Merck, Darmstadt, Germany) ZIC-HILIC column (3.5 μm, 150 × 2.1 mm) column equipped with a SeQuant (Merck, Darmstadt, Germany) ZIC-HILIC guard column (20 × 2.1 mm) thermostated at 25 °C. Mobile phase A consisted of 5 mM ammonium-acetate containing 0.1% formic acid, while acetonitrile containing 0.1% formic acid served as mobile phase B, adapted from [22]. The gradient elution was performed as follows: 0 min, 80% B; 0.5 min, 80% B; 8.5 min, 40% B; 10.5 min, 40% B; 11 min, 80% B; 20.0 min, 80% B. The mobile phase flow rate was maintained at 0.2 mL/min and the injection volume was 5 µL. The general MS conditions were set as follows: spray voltage, 4500 V; vaporizer temperature, 250 °C; sheath gas (nitrogen) pressure, 50 psi; auxiliary gas (nitrogen) flow, 10 arbitrary units; ion transfer capillary temperature, 200 °C; collision gas (argon) pressure, 1.5 mTorr. Electrospray ionization was operated at negative mode. The carbohydrates were detected as formylated molecules [M + HCOO]. Mass spectrometric detection of the carbohydrates was carried out in multiple reaction monitoring (MRM) mode. MRM transitions were 197 > 151, 225 > 180, 387 > 180, 549 > 180, and 711 > 383 for ribitol, mono-, di-, tri- and tetra saccharides, respectively. The acquired data were processed using Xcalibur™ version 2.2.1 and Trace Finder version 3.3 (Thermo Fisher Scientific, Budapest, Hungary). All carbohydrate standards, ammonium-acetate and formic acid were purchased from Sigma (Darmstadt, Germany). Water and acetonitrile (HPLC-grade) were obtained from VWR International, Debrecen, Hungary.

2.3. Determination of Fructan Content

Total fructan content was determined with the enzymatic/spectrophotometric AOAC method 999.03 [23] using commercially available enzymatic kits (Fructan HK Assay kit, Megazyme, Bray Business Park, Bray, Co., Wicklow, Ireland) in accordance with the manufacturer’s instructions. 1.0 g of flour with 40 mL hot distilled water (~80 °C) was cooked on a hot-plate, magnetic stirrer for 15 min. After cooling to room temperature, the solution was quantitatively transferred to 50 mL volumetric flask and was adjusted to volume with distilled water. Aliquot was filtered through Whatman No. I filter and analyze immediately. 0.2 mL aliquot was dispensed into glass test-tubes and 0.2 mL sucrose/maltase mixture (prepared according to Megazyme (Wicklow, Ireland) instruction) was added. The mixture was incubated at 40 °C for 30 min. 0.5 mL 100 mM sodium acetate buffer (pH 4.5) was added to each solution. After mixing, 0.2 mL aliquot was dispensed to two plastic spectrophotometer cuvettes (2.5 mL). 0.1 mL fructanase solution was added to one of the cuvettes, 0.1 mL 100 mM sodium acetate was added to the second cuvette. After mixing, the covered cuvettes were incubated at 40 °C for 30 min in a dry hot-block heater. 2.0 mL distilled water, 0.2 mL buffer pH 7.6 and 0.1 mL NADP+/ATP solution were added to each cuvette, mixed, and after 3 min. absorbances were read at 340 nm. Finally, 0.02 mL of HK/PGI/G-6-PDH suspension was added to the cuvettes and after the reaction stopped, absorbances were read again at 340 nm. Fructan was calculated according to the instruction handbook. All enzyme solutions, buffer pH 7.6, NADP+/ATP solution and HK/PGI/G-6-PDH suspension were provided by the Fructan HK Kit (Megazyme, Wicklow, Ireland).

2.4. Wheat Quality Analysis Methods

The physical properties of wheat kernels such as wheat hardness, moisture content and 1000 kernel weight were determined by Perten Single Kernel Characterization System 4100 (Perten Instruments AB—Segeltorp, Sweden). Wet gluten was determined according to the ICC method 106/2. The dough rheological properties were examined by Brabender Farinograph according to ICC method 115/1. Farinograph quality number, dough development time, water absorption were assessed. Extensograph parameters (extensograph energy at 135 min, extensograph extensibility, maximum resistance to extensibility) were measured by Brabender Extensograph (Brabender GmbH & Co., Duisburg, Germany) according to ICC 114/1 method using 300 g of flour. Sedimentation values were obtained by using the Zeleny ICC method 116/1. Falling number “Hagberg” was measured according to the ICC method 107/1 using falling number apparatus (Perten Instruments, Segeltorp, Sweden).

2.5. DON Analyses

6 g of grain samples were milled with Laboratory Mill 3310 (Perten Instruments, Segeltorp, Sweden). 1 g flour was used for DON extraction with 4 mL of acetonitrile/water (84/16, v/v) mixture for 2.5 h with a vertical shaker. Following centrifugation (10,000 rpm, 10 min), 2.5 mL of the extract was passed through an activated charcoal/neutral alumina SPE column at a flow rate of 1 mL/min. Thereafter, 1.5 mL of the clear extract was transferred to a vial and evaporated to dryness at 40 °C under vacuum. The residue was dissolved in 500 µL of acetonitrile/water solution (20/80, v/v). HPLC analyses was performed on Agilent Infinity 1260 (Agilent Technologies, Santa Clara, CA, USA). DON was separated on a Zorbax SB-Aq (4.6 × 50 × 3.5 µm) column (Agilent, Santa Clara, CA, USA) equipped with a Zorbax (Agilent, Santa Clara, CA, USA) SB-Aq guard column (4.6 × 12.5 × 5 µm) thermostated at 40 °C. The mobile phase A was water, while mobile phase B was acetonitrile. The gradient elution was performed as follows: 0 min, 5% B; 5 min, 15% B; 8 min, 15% B; 10 min, 5% B; 12 min, 5% B. The flow rate was set to 1 mL/min. The injection volume was 5 µL. DON was monitored at 219 nm. The method of DON analysis is given in details in [24].

2.6. Statistical Analysis

The analysis of variance (ANOVA) and PCA (Principal Component Analysis) was calculated by STATISTICA 12 (developed by StatSoft Inc., 2013, Tulsa, OK, USA) software. The treatment means were compared using Fischer’s protected LSD test at p < 0.05. The Pearson’s correlations were made according to the built-in functions of Analysis ToolPak of Microsoft Excel version 1997–2003.

3. Results

The two experimental seasons covered varied Fusarium infection severities due to differing precipitation and environmental conditions. In 2010, Fusarium infection was severe in the experimental field, the average rate of Fusarium damaged kernel (FDK) was 8.5%, while in the next year it was only 0.4%, while the naturally infected control in the susceptible cultivar showed 22.50%, this was reduced by the best fungicide 7.38%. The most resistant variety gave 7.75% in the untreated, and only 0.32% for the best fungicide [13]. The results of WSC contents were significantly different between the two seasons.

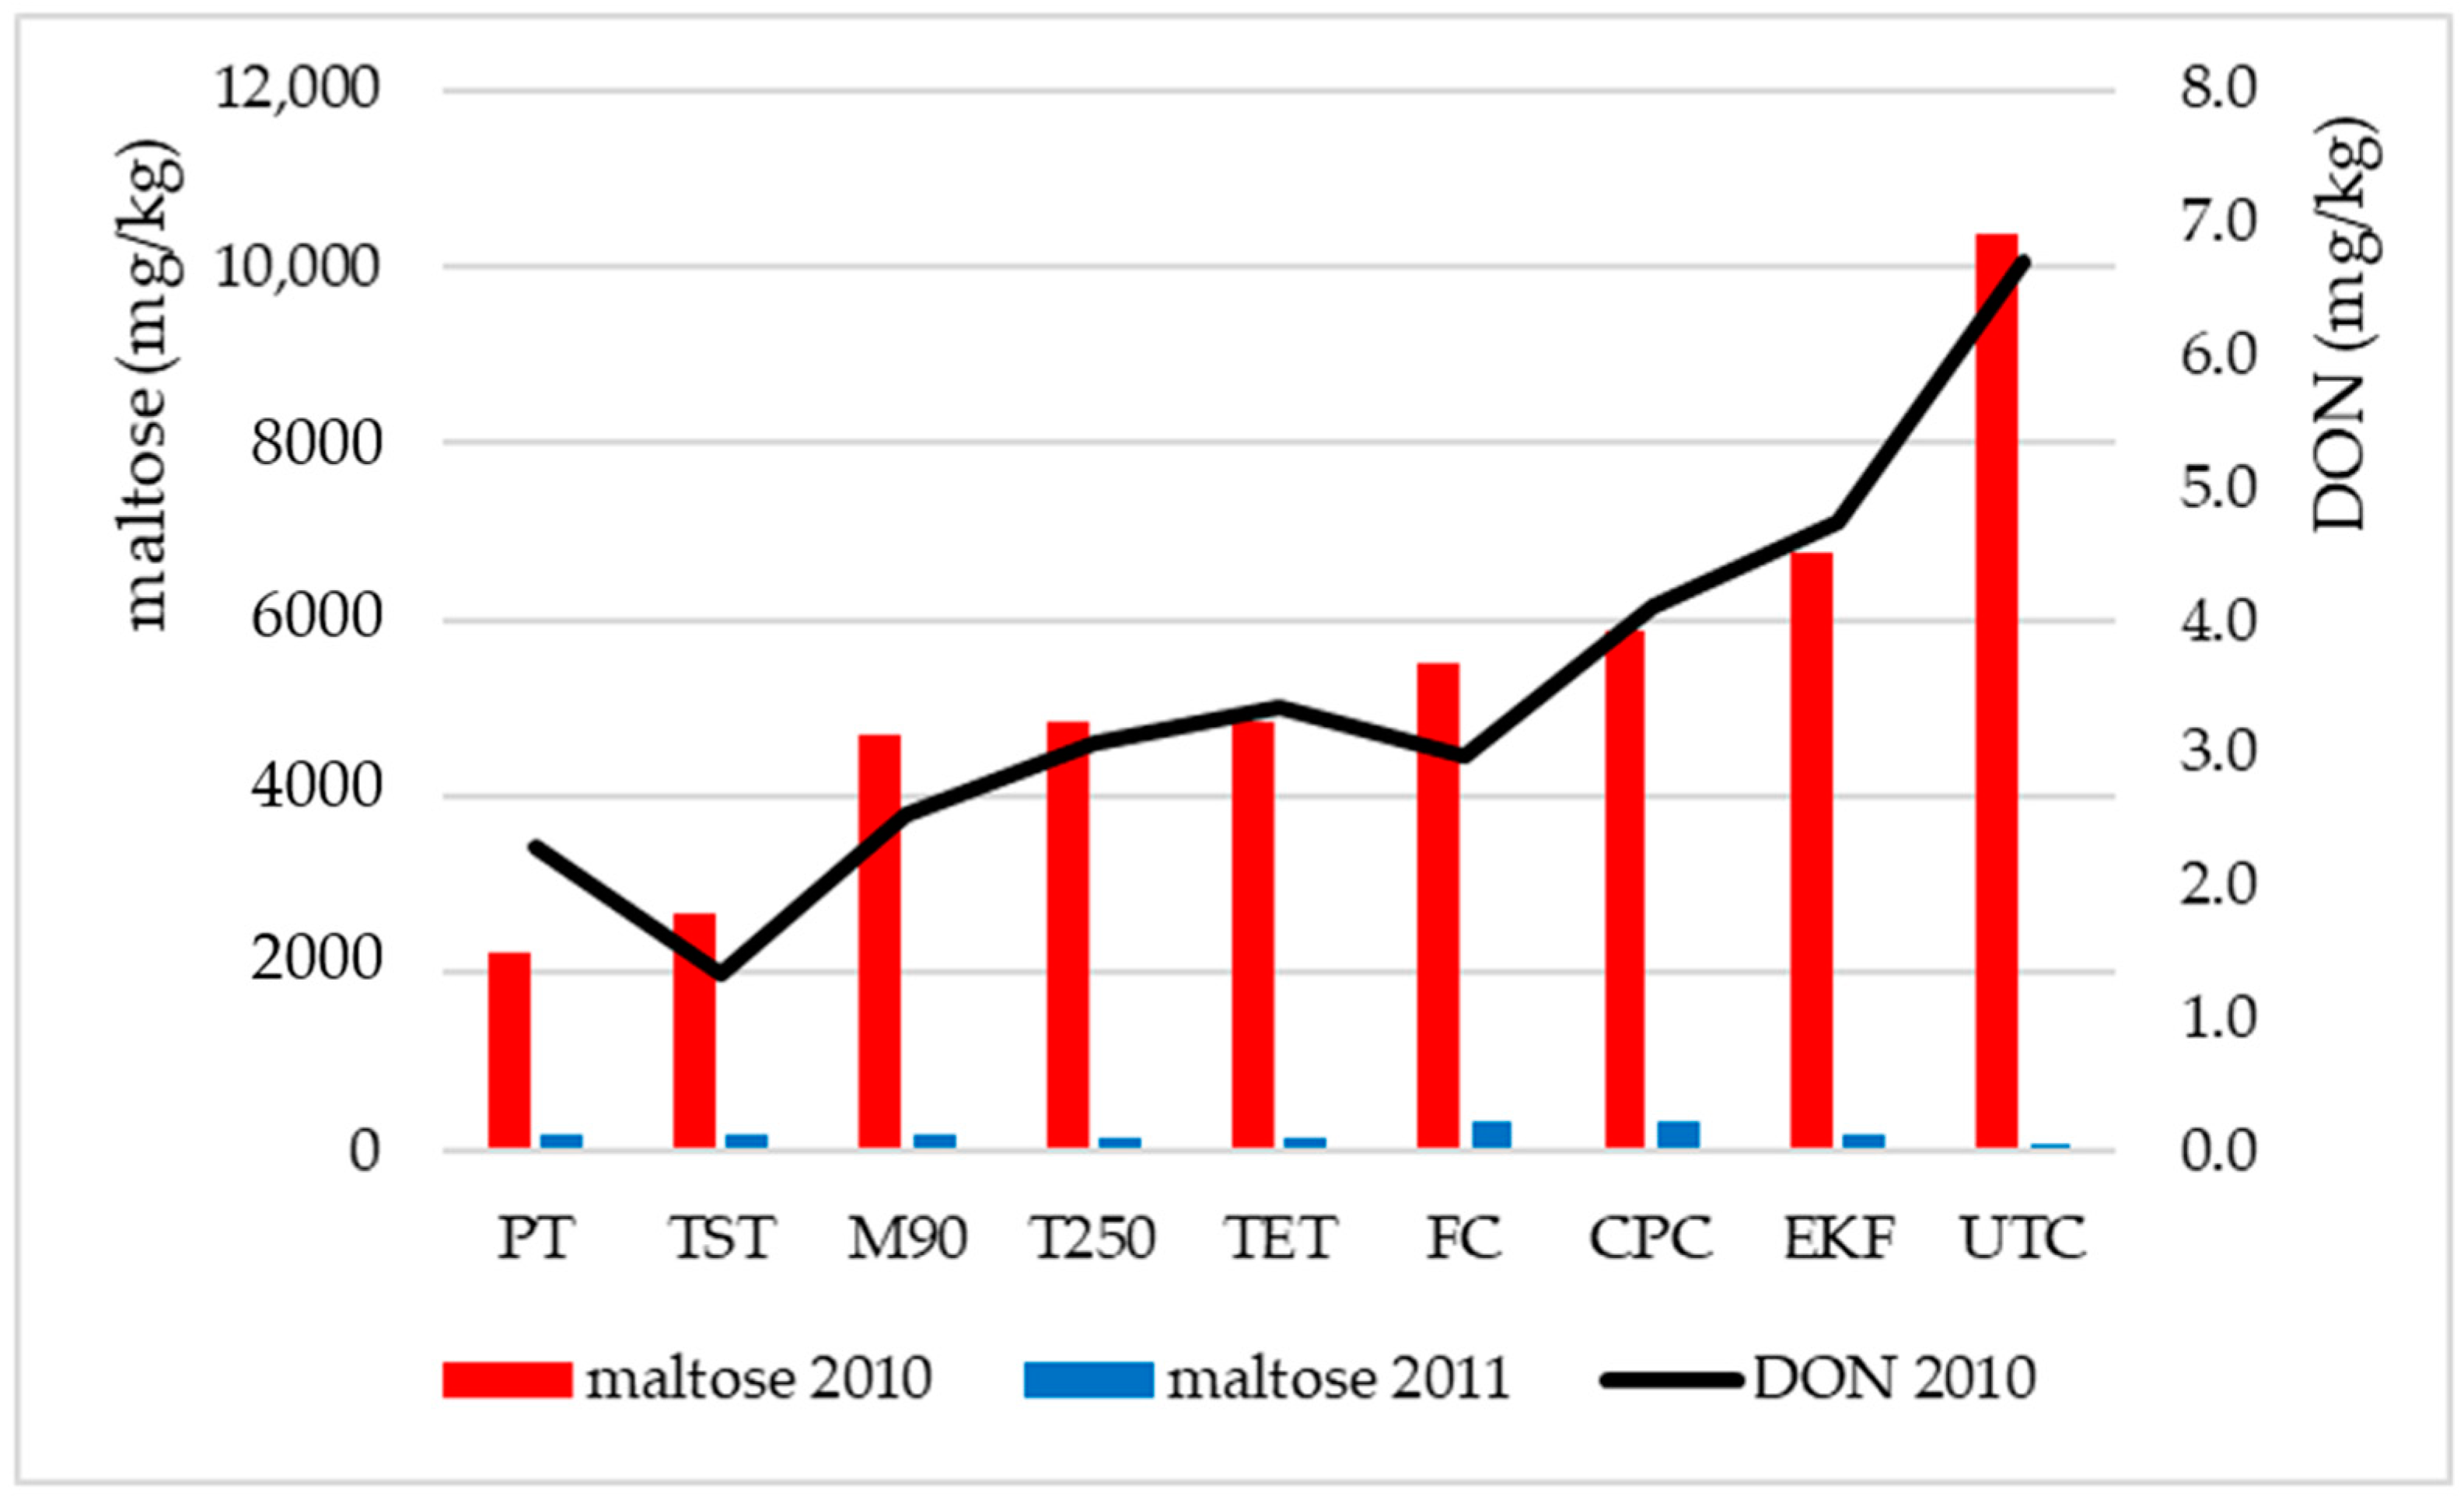
3.1. Concentrations of Water-Soluble Carbohydrate Components

The WSC content was significantly higher in 2010 than in 2011, and there were also significant changes between the fungicide treatments (Table 2 and Table 3). Comparing the average content of the various WSC components of the epidemic year to the non-epidemic, significant increase was experienced in sucrose, maltose, raffinose and fructan content. The average total WSC content in 2010 was 1.6%, while it was below 0.8% in 2011, which means double difference between the epidemic and non-epidemic season.
In the epidemic year (2010), there were significant differences between the UTC and the fungicide treated samples, except in two cases (sucrose, stachyose). The fungicide treated samples contained increased fructose, glucose, nystose, raffinose and fructan content compared to the UTC. In the cases of fructose and fructan, their content was significantly higher in all treated samples (117–152 mg/kg and 7583–9433 mg/kg, respectively) than in UTC (92 mg/kg and 7283 mg/kg), and samples treated with PT and TST had the highest fructose (152 mg/kg, 143 mg/kg) and fructan (9433 mg/kg, 8933 mg/kg) content.
There were significantly higher nystose contents in 5 treated samples (TST, PT, T250, CPC and FC) in 2010 with 37–50 mg/kg values compared to UTC (32 mg/kg). The highest values were measured in PT and TST treated samples (50 and 42 mg/kg, respectively). Similar results could be observed in the raffinose content: TST, M90, PT and T250 treated samples had significantly higher raffinose content (348–655 mg/kg) than the naturally infected control (UTC: 257 mg/kg), and the highest values were again measured in the PT and TST treated samples with 655 mg/kg and 577 mg/kg. In glucose measurements there were not any significant differences between the treated and untreated samples, except in two fungicides (TET, CPC) where the amount of glucose was significantly higher (384 and 396 mg/kg) than in the UTC sample (279 mg/kg). Other fungicides also resulted in increased glucose values (332–368 mg/kg). Reduced glucose content was however measured in PT (271 mg/kg) and TST (262 mg/kg) treated samples, though the reduction was not significant. The highest change was observed in maltose content. In 2010, the average value of maltose was above 0.5% (5314 mg/kg), which was more than 28 times higher than in the non-epidemic year. The maltose content of the UTC samples was the highest (above 1%) (Table 4), and all the treated samples showed significantly lower maltose content (2235–6746 mg/kg). The biggest change comparing to UTC was observed with PT and TST treatments across all three varieties. The sensitive (S) variety contained the highest maltose content (avg. 9290 mg/kg), the moderately sensitive (MS) variety and the moderately resistant (MS) had significantly lower (avg. 3906 mg/kg and 2745 mg/kg, respectively). It is important that even though the reduction of the very high UTC values were highly significant, the maltose content still remained many folds higher compared to the practically healthy experiment in 2011. It is remarkable that at heavy epidemic all fungicides significantly reduced the maltose content, while at sporadic epidemic no changes or in two cases (CPC, FC fungicide) increase was observed.
In the non-epidemic year (2011), the differences in WSC content were minor between the fungicide treatments (Table 3), and no trends can be observed in these changes (Table A1, Appendix A). Also, in this year the maltose content varied between 101 and 578 mg/kg and it was significantly lower (avg. 191 mg/kg) then in the epidemic year (5314 mg/kg). In case of CPC and FC treatment, higher maltose content was measured but in general, there were no significant differences between fungicide treatments or varieties.

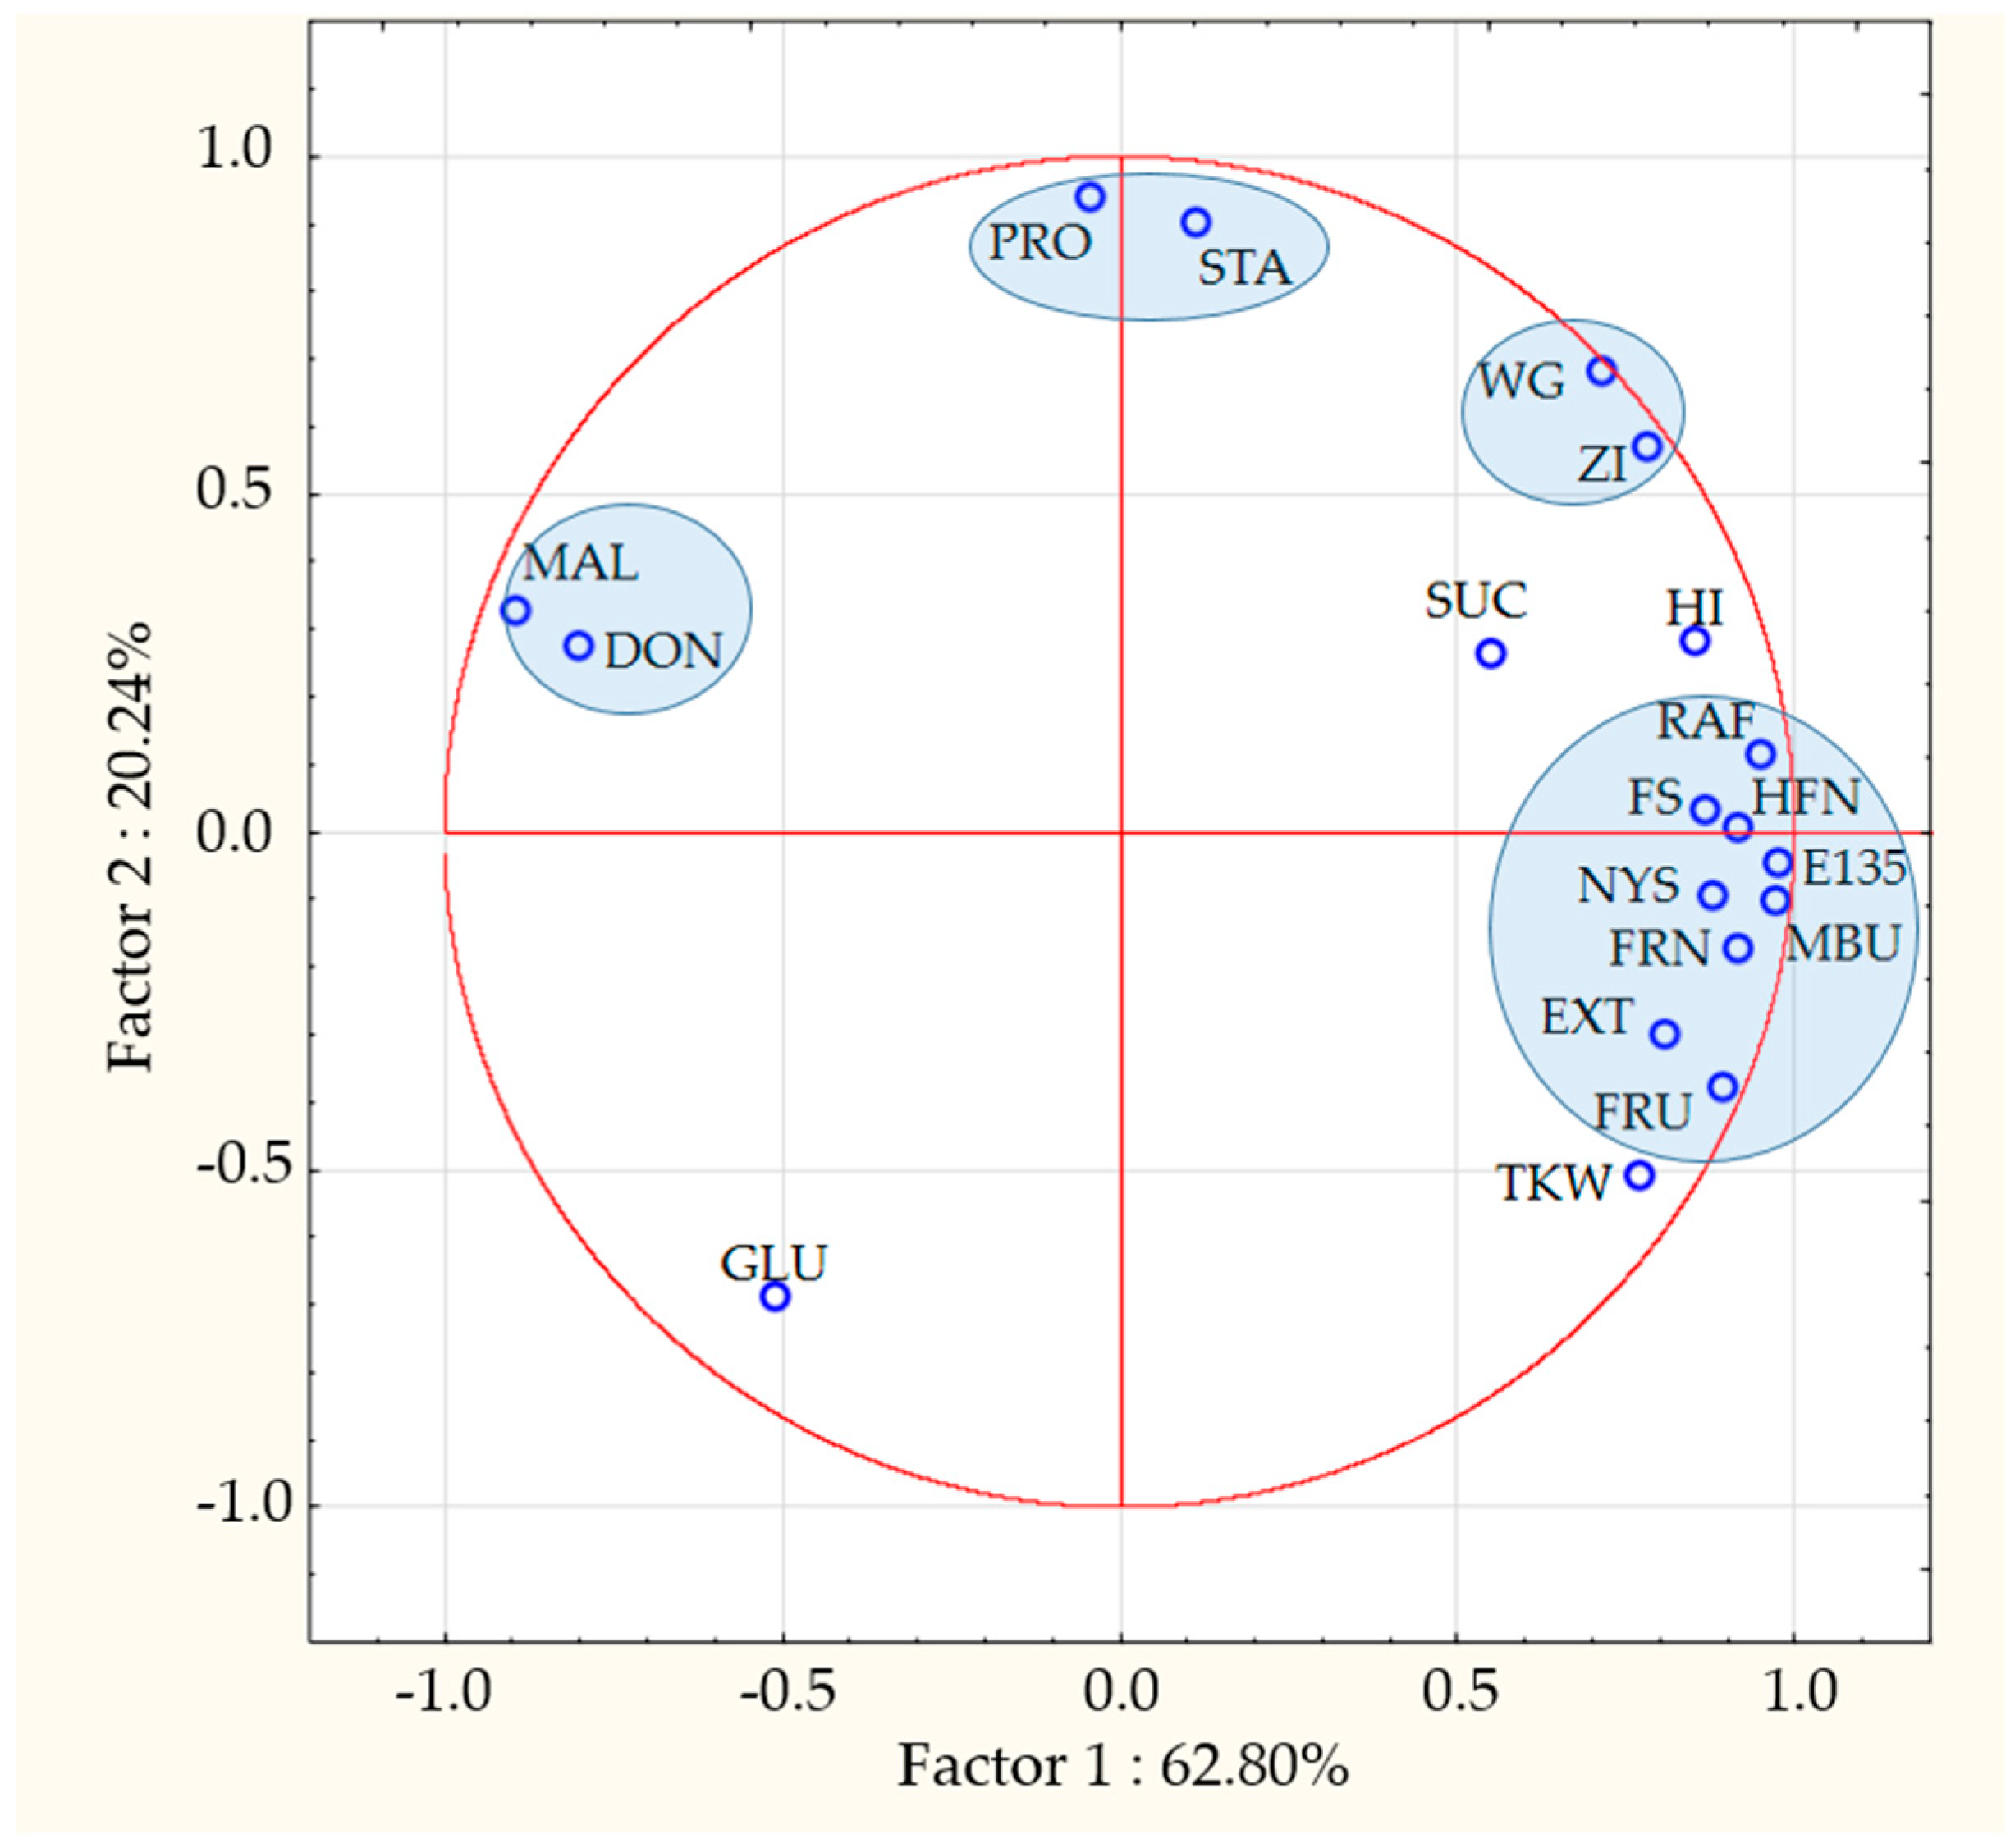
3.2. Results of Correlation Analyses between Carbohydrate Content, Technological Properties and DON Contamination

The relationship between quality traits such as wet gluten (WG), farinograph stability (FS), Hagberg Falling number (HFN), hardness index (HI), thousand kernel weight (TKW), protein (PRO), Zeleny index (ZI), extensograph energy (E135), extensograph extensibility (EXT), maximum resistance to extensibility (RMAX) [13], the DON and the total mass of simple carbohydrates was evaluated with correlation analyses referring to the epidemic year 2010 (Table A2). There were several strong correlations between the content of WSC components and other parameters. The changes in fructose, nystose, raffinose and fructan content showed strong (r = 0.7–0.9) or very strong (r > 0.9) positive relationships to technological parameters such as FS, HFN, E135, RMAX, FS, E135. The change of maltose content has also demonstrated this strong relationship with quality parameters, but in negative correlation. The strongest correlation regarding DON toxin content was measured in the case of maltose content too (Figure 1).
PCA analysis was also performed to get better understanding about the interrelations between the examined 19 quality traits. The first four principal components (PC) exhibited more than 1.00 eigenvalue (Table 5) and showed maximum variability of 95.66%. PC1 had the highest variability (62.8%) followed by PC2 (20.24%), PC3 (6.55%) and PC4 (6.08%). On the basis of the value of factor loads, the first components represent 15 traits out of 19. Only three traits (protein, glucose, stachyose) belong to the second component, and the sucrose alone is related to PC3. In the system of PC1 and PC2 vectors of studied traits are presented in Figure 2. Four groups of strongly correlated variables can be determined from the graph as small distances (angels) between the vectors proves strong correlation between variables. MAL and DON belong to the first group, the second group is the PRO and STA, the third one is WG and ZI, the fourth is RAF, FS, HFN, E135, NYS, RMAX, FRN, EXT and FRU. Four sugar compounds were largely independent from any group they seem to have a neutral role. Surprisingly, the DON contamination did not show significant correlation with any other sugar compounds.

4. Discussion

It is well proven that infections cause changes in carbohydrate, protein, and starch metabolism of the endosperm, but only a few papers investigated the changes of simple carbohydrate content in wheat kernel after Fusarium infection. In most cases, no or slight changes occurred in carbohydrate content [25,26], and one study reported increase in the total sugar content [15]. The present study shows that the severe Fusarium infection significantly affects the composition and rate of soluble carbohydrates of grains, but in different ways. Their concentrations were significantly higher in the epidemic year than the non-epidemic (except nystose), but decisively the maltose content was a determining factor in the increased amount. The question is what cause these changes.
There are several processes that can lead to the altered carbohydrate concentration. On the one part, Fusarium infection can cause impaired synthesis of carbohydrate components. It has been shown that fungal mycelium can cause mechanical blocking of vascular bundles, which can lead to incomplete supply of grain constituents, but the presence of mycotoxin itself such as DON toxin can also cause impaired protein synthesis of grain components [27,28,29]. There is also an assumption that Fusarium spp. secretes enzymes, such as proteases or carbohydrates, which can cause degradation of various grain components [30,31]. Also, as one study reported that powdery mildew suppressed the transformation of sugar into starch, and it can be hypothesized that Fusarium infection has a similar negative influence on grain carbohydrate metabolism [32]. In the case of Fusarium, the change of the sink-source relation may give an idea as the Fusarium attacked grains can build in led sugars in starch production, therefore a part of the sugars remains in the leaves and the young developing grains. We observed that severely infected heads caused a significantly later ripening of leaves showing that the assimilates in leaves could not be translocated and utilized by the developing grains. However, this does not explain the explicit role of the maltose.
On the other hand, environmental circumstances such as rainy weather before harvest could also contribute to the increased maltose level through high α-amylase activity (together with reduced HFN values). Therefore, biotic and abiotic stress along with the genetic background of the plants determine the simple carbohydrate content of the grain in a complex way [32,33].
According to present study, the variation of maltose content gives some explanations about the background. Maltose is mainly derived from hydrolysis of starch, which occurs due to high α-amylase activity and/or the presence of exoenzymes [34]. As 2010 was a wet year, the degradation of the starch could contribute to the increased maltose content, the increased disease severity yielded more DON, but parallel with this the increased a-amylase increased the maltose content on the other side. Therefore, the presence of high maltose content indicates irregular degradation process. Since the correlation analysis showed very strong relationship (r = 0.905) between the maltose and DON content, it shows surely that Fusarium infection is the factor behind these changes. It was a surprising result how strongly the maltose content confirms the severity of Fusarium infection, but the consideration above may give an explanation. In the more susceptible the variety, a much higher amount of maltose was produced, this seems to be a logical consequence of the event. It is clear for us that this finding needs further support and research to draw a more general conclusion.
PCA analysis proves also that there is mutual correlation between WSC, DON and flour quality parameters and Figure 2 shows well the strong correlation between the DON and maltose content. As maltose mostly originates from the starch degradation due to α-amylase activity, and in diseased kernels under humid conditions this process has a higher probability, this can explain the close correlation between the DON contamination and maltose content. In this respect we should test, how far the high falling number can influence the resistance to toxin accumulation. Therefore, we will check the data sets of the past two decades and new tests will be started. As all the technological quality traits belong to one principal component (PC1) along with most of the WSC and the DON content, it can be assumed that PCA1 factor is mainly responsible for all the correlation between the traits. As the DON and maltose content are closest among the tested sugars to DON, it seems that maltose content can be a biomarker signalizing the presence of DON.
For the fungicides we can conclude that all significantly decreased the amount of free sugars, but even the best fungicide could not restore the original free sugar level identified in the non-epidemic year 2011. The finding that the most effective fungicide could reduce the DON level close to zero in the most resistant variety GK Feny that is close to full success, but the higher maltose content signalizes that the quality could not be restored at this efficacy. In this respect the maltose metabolism needs further research. As fungicide reduced the rate of infection, the WSC content as well as rheological parameters changed significantly compared to untreated samples closer to the normality [13]. On the other side, the fungicide treatments without epidemic caused only slight but significant increase in maltose content at six fungicides, in two cases no change was recorded. We suppose that maltose can be a biomarker also for marking the quality problems. As this is variety and environment depending, further research is needed to have a better understanding this complex process. This Janus face of the maltose problem (DON and quality) seems to be an important research task for the future.

5. Conclusions

Biotic stressors such as Fusarium infection cause significant changes to the soluble carbohydrate content in wheat kernel. The total WSC content was significantly (twofold) higher in the epidemic year than in non-epidemic year, with maltose content as the main determinant. Maltose content was more than 28 times higher in the naturally infected control kernels and was highly affected by the applied fungicide and also with the Fusarium susceptibility of wheat varieties. DON toxin, WSC content and technological quality traits correlate strongly in case of severe Fusarium infection. The changes indicate altered carbohydrate metabolism where one side the produced WS carbohydrates couldn’t be translocated to starch and so accumulated in the grain (double concentration), and on the other side with abnormal (starch) degradation processes. The two processes may go at the same time with different intensity in time. It seems therefore, that maltose can be a biomarker for DON a quality characterization of the given wheat lot. So, the results can have also practical significance beyond scientific findings of the paper and serve as outgoing position for further research.

Author Contributions

Conceptualization, A.M. and K.A.; methodology, A.S. (Andras Szekeres), M.V. and F.B.; software, K.A.; validation, J.P., C.L. and F.B.; formal analysis, A.S. (Andras Salgo); investigation, K.A., A.S. (Andras Szekeres) and M.V.; resources, C.L.; data curation, K.A.; writing—original draft preparation, K.A.; writing—review and editing, A.M.; visualization, A.S. (Andras Salgo); supervision, A.M.; project administration, C.L.; funding acquisition, J.P. All authors have read and agreed to the published version of the manuscript.

Funding

The experiments were supported by the National Development Agency (GOP-1.1.1-11-2012-015) and the National Research, Development and Innovation Office (OTKA-K_21-K138416, TUDFO/51757/2019-ITM and TKP2020-NKA-21).

Institutional Review Board Statement

Not applicable.

Data Availability Statement

Not applicable.

Conflicts of Interest

The authors declare no conflict of interest.

Appendix A

Table A1. Pearson’s correlations between simple carbohydrate content, wheat quality parameters and DON toxin after responses of fungicide treatments, 2011.
WGFSHFNHITKWPROZIE135EXTMBUDONFRUGLUSUCMALRAFNYSSTA
FS0.010
HFN−0.296−0.071
HI0.195−0.123−0.822 ***
TKW0.214−0.4100.628 *−0.575
PRO0.869 ***−0.235−0.2850.2600.383
ZI0.582−0.277−0.0060.1680.4480.826 ***
E1350.181−0.0020.179−0.2060.634 *0.4690.628 *
EXT0.630 *0.103−0.676 **0.402−0.2120.5760.2890.218
MBU−0.3150.0740.668 **−0.5290.666 *−0.1690.1000.599 *−0.576
DON−0.328−0.0850.329−0.3330.218−0.523−0.654 *−0.173−0.2860.338
FRU−0.2440.709 **−0.106−0.193−0.298−0.460−0.495−0.088−0.1600.2470.190
GLU0.5230.3210.192−0.028−0.0330.1980.086−0.359−0.097−0.124−0.050−0.026
SUC−0.3420.4350.182−0.602 *0.071−0.287−0.2260.339−0.0140.296−0.0330.568−0.480
MAL0.4430.3880.159−0.113−0.2140.0550.052−0.3840.106−0.317−0.1230.0230.830 ***−0.256
RAF−0.3110.2440.347−0.5630.169−0.377−0.4810.1880.0860.2280.5800.103−0.2720.512−0.133
NYS−0.4330.454−0.029−0.361−0.317−0.413−0.3230.008−0.010−0.033−0.2290.570−0.4440.895 ***−0.1370.2941.000
STA−0.3810.606 *0.018−0.383−0.087−0.383−0.3290.271−0.1060.3920.0450.846 ***−0.3970.889 ***−0.2840.3300.807 ***
FRN−0.843 ***0.2950.304−0.327−0.362−0.832 ***−0.587 *−0.359−0.650 *0.1690.0580.460−0.2240.501−0.1150.1690.680 **0.529
Correlations *** p ≤ 0.01, ** p ≤ 0.05, * p ≤ 0.10; Abbreviations are the following: WG: wet gluten, FS: Farinograph stability, HFN: Hagberg Falling number, HI: Hardness index, TKW: thousand kernel weight, PRO: protein, ZI: Zeleny index, E135: Extensograph energy at 135min, EXT: Extensograph stability, MBU: Extensograph maximum resistance to extensibility, DON: deoxynivalenol, FRU: fructan, GLU: glucose, SUC: sucrose, MAL: maltose, RAF: raffinose, NYS: nystose, STA: stachyose, FRN: fructan.
Table A2. Pearson’s correlations between simple carbohydrate content, wheat quality parameters and DON toxin after responses of fungicide treatments, 2010.
WGFSHFNHITKWPROZIE135EXTMBUDONFRUGLUSUCMALRAFNYSSTA
FS0.650 *
HFN0.638 *0.814 ***
HI0.796 **0.862 ***0.899 ***
TKW0.2290.604 *0.652 *0.450
PRO0.599 *0.119−0.0270.320−0.588 *
ZI0.962 ***0.746 **0.640 *0.811 ***0.3330.536
E1350.684 **0.796 **0.838 ***0.752 **0.826 ***−0.1370.755 **
EXT0.4160.705 **0.630 *0.609 *0.723 **−0.2660.5360.841 ***
MBU0.639 *0.781 **0.850 ***0.734 **0.858 ***−0.2000.709 **0.996 ***0.825 ***
DON−0.406−0.699 **−0.696 **−0.711 **−0.687 **0.203−0.526−0.792 **−0.949 ***−0.781 **
FRU0.3660.814 ***0.804 ***0.655 *0.841 ***−0.3400.5020.867 ***0.829 ***0.881 ***−0.821 ***
GLU−0.820 ***−0.380−0.623 *−0.640 *−0.079−0.528−0.676 **−0.444−0.006−0.4330.048−0.153
SUC0.589 *0.1620.3490.2630.3980.0070.5780.664 *0.4470.649 *−0.3320.310−0.460
MAL−0.391−0.747 **−0.784 **−0.672 **−0.787 **0.300−0.535−0.876 ***−0.890 ***−0.884 ***0.905 ***−0.957 ***0.130−0.428
RAF0.736 **0.819 ***0.916 ***0.815 ***0.680 **0.0480.771 **0.900 ***0.611 *0.904 ***−0.613 *0.836 ***−0.6610.513−0.783 **
NYS0.5490.795 **0.859 ***0.659 *0.742 **−0.1870.5790.855 ***0.5740.875 ***−0.4980.821 ***−0.5240.441−0.726 **0.913 ***
STA0.693 **0.057−0.0240.255−0.3450.829 ***0.671 **0.119−0.0690.0580.075−0.231−0.5270.5020.1100.155−0.085
FRN0.4890.747 **0.903 ***0.714 **0.785 **−0.2250.5690.873 ***0.643 *0.898 ***−0.672 **0.914 ***−0.4510.447−0.886 ***0.935 ***0.898 ***−0.079
Correlations *** p ≤ 0.01, ** p ≤ 0.05, * p ≤ 0.10; Abbreviations are the following: WG: wet gluten, FS: Farinograph stability, HFN: Hagberg Falling number, HI: Hardness index, TKW: thousand kernel weight, PRO: protein, ZI: Zeleny index, E135: Extensograph energy at 135min, EXT: Extensograph stability, MBU: Extensograph maximum resistance to extensibility, DON: deoxynivalenol, FRU: fructan, GLU: glucose, SUC: sucrose, MAL: maltose, RAF: raffinose, NYS: nystose, STA: stachyose, FRN: fructan.

References

  1. D’Apollonia, B.L.; Rayas-Duarte, P. Wheat carbohydrates: Structure and functionality. In Wheat Production, Properties and Quality, 1st ed.; Bushuk, W., Rasper, V.F., Eds.; Springer: Boston, MA, USA, 1994; pp. 109–130. [Google Scholar] [CrossRef]
  2. Shelton, D.R.; Lee, W.J. Cereal Carbohydrates. In Handbook of Cereal Science and Technology, 2nd ed.; Kulp, K., Ponte, J.G., Eds.; CRC Press: Boca Raton, FL, USA, 2000; pp. 385–416. [Google Scholar] [CrossRef]
  3. Ruuska, S.A.; Rebetzke, G.J.; Herwaarden, A.F.; Richards, R.A.; Fettel, N.A.; Tabe, L.; Jenkins, C.L.D. Genotypic variation in water-soluble carbohydrate accumulation in wheat. Funct. Plant Biol. 2006, 33, 799–809. [Google Scholar] [CrossRef]
  4. Macarthur, L.A.; Dappolonia, B.L. Comparison of oat and wheat carbohydrates I. Sugars. Cereal Chem. 1979, 56, 455–457. [Google Scholar]
  5. Fretzdorff, B.; Welge, N. Fructan and the raffinose contents in cereals and pseudocereal grains. Getreide Mehl. Brot. 2003, 57, 3–8. (In German) [Google Scholar]
  6. Sami, F.; Yusuf, M.; Faizan, M.; Faraz, A.; Hayat, S. Role of sugars under abiotic stress. Plant Physiol. Biochem. 2016, 109, 54–61. [Google Scholar] [CrossRef] [PubMed]
  7. Verspreet, J.; Hemdane, S.; Dornez, E.; Cuyvers, S.; Pollet, A.; Delcour, J.A. Analysis of storage and structural carbohydrates in developing wheat (Triticum aestivum L.) grains using quantitative analysis and microscopy. J. Agric. Food Chem. 2013, 61, 9251–9259. [Google Scholar] [CrossRef]
  8. Call, L.; Haider, E.; D’Amico, S.; Reiter, E.; Grausguber, H. Synthesis and accumulation of amylase-trypsin inhibitors and changes in carbohydrate profile during grain development of bread wheat (Triticum aestivum L.). BMC Plant Biol. 2021, 21, 113. [Google Scholar] [CrossRef] [PubMed]
  9. Halford, N.G.; Curtis, T.Y.; Chen, Z.; Huang, J. Effects of abiotic stress and crop management on cereal grain composition: Implication for food quality and safety. J. Exp. Bot. 2014, 66, 1145–1156. [Google Scholar] [CrossRef] [Green Version]
  10. Halford, N.G.; Curtis, T.Y.; Muttucumaru, N.; Postles, J.; Mottram, D.S. Sugars in crop plants. Ann. Appl. Biol. 2011, 158, 1–25. [Google Scholar] [CrossRef]
  11. Jenner, C.F. Effects of exposure of wheat ears to high-temperature on dry matter accumulation and carbohydrate-metabolism in the grain of 2 cultivars. II. Carry-over effects. Aust. J. Plant Physiol. 1991, 18, 179–190. [Google Scholar] [CrossRef]
  12. Shah, N.H.; Paulsen, G.M. Interaction of drought and high temperature on photosynthesis and grain-filling of wheat. Plant Soil 2003, 257, 219–226. [Google Scholar] [CrossRef]
  13. Ács, K.; Lehoczki-Krsjak, S.; Varga, M.; Kótai, C.; Ács, E.; Salgó, A.; Mesterházy, Á. Reduction of deoxynivalenol (DON) contamination by improved fungicide use in wheat. Part 3. Reduction of Fusarium head blight and influence on quality traits in cultivars with different resistance levels. Eur. J. Plant Pathol. 2018, 151, 21–38. [Google Scholar] [CrossRef]
  14. Bishop, D.L.; Chatterton, N.J.; Harrison, P.A.; Hatfield, R.D. Changes in carbohydrate coordinated partitioning and cell wall remodeling with stress-induced pathogenesis in wheat sheaths. Physiol. Mol. Plant P. 2002, 61, 53–63. [Google Scholar] [CrossRef]
  15. Boyacioglu, D.; Hettiarachchy, N.S. Changes in some biochemical components of wheat grain that was infected with Fusarium graminearum. J. Cereal Sci. 1995, 21, 57–62. [Google Scholar] [CrossRef]
  16. Gherbawy, Y.A.; El-tayeb, M.A.; Maghraby, T.A.; Shebany, Y.M.; El-deeb, B.A. Response of antioxidant enzymes and some metabolic activities in wheat to Fusarium spp. infections. Acta Agron. Hung. 2012, 60, 319–333. [Google Scholar] [CrossRef]
  17. Bewley, J.D.; Bradford, K.; Hilhorst, H.; Nonogaki, H. Seeds: Physiology of Development, Germination and Dormancy, 3rd ed.; Springer: New York, NY, USA, 2013; pp. 183–246. [Google Scholar]
  18. Perten, H. Application of the falling number method for evaluating alpha-amylase activity. Cereal Chem. 1964, 41, 127–140. [Google Scholar]
  19. Nursten, H.E. The Maillard Reaction: Chemistry, Biochemistry and Implications, 1st ed.; Royal Society of Chemistry: London, UK, 2005. [Google Scholar]
  20. Mesterházy, Á.; Varga, M.; Tóth, B.; Kótai, C.; Bartók, T.; Véha, A.; Ács, K.; Vágvölgyi, C.; Lehoczki-Krsjak, S. Reduction of deoxynivalenol (DON) contamination by improved fungicide use in wheat. Part 2. Farm scale tests with different nozzle types and updating the integrated approach. Eur. J. Plant Pathol. 2018, 151, 1–20. [Google Scholar] [CrossRef]
  21. Li, B.W.; Schuhmann, P.J. Gas–liquid chromatographic analysis of sugars in ready-to-eat breakfast cereals. J. Food Sci. 1980, 45, 138–141. [Google Scholar] [CrossRef]
  22. Antonio, C.; Larson, T.; Gilday, A.; Graham, I.; Bergström, E.; Thomas-Oates, J. Hydrophilic interaction chromatography/electrospray mass spectrometry analysis of carbohydrate-related metabolites from Arabidopsis thaliana leaf tissue. Rapid Commun. Mass Spectrom. 2008, 22, 1399–1407. [Google Scholar] [CrossRef]
  23. McCleary, B.V.; Murphy, A.; Mugford, D.C. Determination of oligofructans and fructan polysaccharides in foodstuffs by an enzymatic/spectrophotometric method: Collaborative study. J. AOAC Int. 2000, 83, 356–364. [Google Scholar] [CrossRef] [Green Version]
  24. Mesterházy, Á.; Bartók, T.; Lamper, C. Influence of wheat cultivar, species of Fusarium, and isolate aggressiveness on the efficacy of fungicides for control of Fusarium Head Blight. Plant Dis. 2003, 87, 1107–1115. [Google Scholar] [CrossRef] [Green Version]
  25. Wang, J.; Pawelzi, E.; Weinert, J.; Wolf, G. Impact of Fusarium culmorum on the polysaccharides of wheat flour. J. Agric. Food Chem. 2005, 53, 5818–5823. [Google Scholar] [CrossRef]
  26. Kreuzberger, M.; Limsuwan, S.; Eggert, K.; Karlovsky, P.; Pawelzik, E. Impact of Fusarium spp. infection of bread wheat (Triticum aestivum L.). on composition and quality of flour in association with EU maximum level for deoxynivalenol. J. Appl. Bot. Food Qual. 2015, 88, 177–185. [Google Scholar] [CrossRef]
  27. Goswami, R.; Kistler, H. Heading for disaster: Fusarium graminearum on cereal crops. Mol. Plant Pathol. 2004, 5, 515–525. [Google Scholar] [CrossRef] [PubMed]
  28. Ribichich, K.F.; Lopez, S.E.; Vegetti, A.C. Histopathological spikelet changes produced by Fusarium graminearum in susceptible and resistant wheat cultivars. Plant Dis. 2000, 84, 794–802. [Google Scholar] [CrossRef] [PubMed] [Green Version]
  29. Casale, W.L.; Hart, L.P. Inhibition of 3H-leucine incorporation by trichothecene mycotoxins in maize and wheat tissue. Phytopathology 1988, 78, 1673–1677. [Google Scholar] [CrossRef] [Green Version]
  30. Bechtel, D.B.; Kaleikai, L.A.; Gaines, R.L.; Seitz, L.M. The effect of Fusarium graminearum infection on wheat kernels. Cereal Chem. 1985, 62, 191–197. [Google Scholar]
  31. Eggert, K.; Rawel, H.M.; Pawelzik, E. In vitro degradation of wheat gluten fractions by Fusarium graminearum proteases. Eur. Food Res. Technol. 2011, 233, 697–705. [Google Scholar] [CrossRef] [Green Version]
  32. Hongyun, G.; Jishan, N.; Xiwen, Y.; Dexian, H.; Wang, C. Impacts of powdery mildew on wheat grain sugar metabolism and starch accumulation in developing grains. Starch 2014, 66, 947–958. [Google Scholar] [CrossRef]
  33. Khatun, S.; Ahmed, J.U. Response of elevated temperature on carbohydrate accumulation and grain yield in different wheat cultivars. Bangladesh J. Agric. Res. 2015, 40, 205–215. [Google Scholar] [CrossRef] [Green Version]
  34. Singletary, G.W. Starch synthesis and grain filling in wheat. In Carbohydrate Reserves in Plants–Synthesis and Regulation, 1st ed.; Gupta, A.K., Kaur, N., Eds.; Elsevier Science: Amsterdam, The Netherlands, 2000; pp. 79–105. [Google Scholar] [CrossRef]
Figure 1. The average total amounts of maltose and DON (deoxynivalenol) toxin content across cultivars in fungicide-treated flour samples; 2010–2011. DON content in 2011 was below detection limit in all treatments.
Agriculture 13 00868 g001
Figure 2. PCA graph of factor coordinates, grouping of the variables in two principal components. WG—wet gluten, FS—Farinograph stability, HFN—Hagberg Falling number, HI—hardness index, TKW—thousand kernel weight, PRO—protein, ZI—Zeleny index, E135—extensograph energy, EXT—extensograph extensibility, RMAX—maximum resistance to extensibility (RMAX), DON—deoxynivalenol, FRU—fructose, GLU—glucose, SUC—sucrose, MAL—maltose, RAF—raffinose, NYS—nystose, STA—stachyose, FRN—fructan.
Agriculture 13 00868 g002
Table 1. Active ingredients of the fungicides and their abbreviations.
Commercial Name and
Application Rate (L/ha)
Active Ingredient (g/L)Abbreviation of Active Ingredient
Alert S 1.0fluzilazole 125 + carbendazim 250FC
Cherokee 2.0ciproconazole 50 + propioconazole 62.5 + chloronitrile 375CPC
Prosaro 1.0prothioconazole 125, tebuconazole 125PT
Caramba 1.2metconazole 90M90
Eminent 1.0tetraconazole 125TET
Falcon 0.8tebuconazole 167 + spiroxamine 250 + triadimenol 43TST
Folicur Solo 1.0tebuconazole 250T250
Juwel TT 1.0epoxyconazole 83 + kresoxym-methyl 83 + fenpropimorf 317EKF
Table 2. Water soluble carbohydrate content in wheat flour samples treated with various fungicides in a Fusarium epidemic year (2010); results are the average of three wheat varieties.
FructoseGlucoseSucroseMaltoseNystoseRaffinoseStachyoseFructanTotal
Fungicide(mg/kg)(mg/kg)(mg/kg)(mg/kg)(mg/kg)(mg/kg)(mg/kg)(mg/kg)(mg/kg)
TST *143d262a2101a,b2670a42d577d4a8933f14,732a
PT152e271a,b2340b2235a50e655d4a9433g15,139a
M90125b,c362b,c2225a,b4718b35a–c348b,c5a7817c15,634a,b
TET123b,c384c2007a,b4858b,c33a,b281a–c3a8200e15,888a,b
T250131c,d368b,c2242a,b4837b,c37a–d366c3a8167e16,152a,b
CPC128b,c396c1708a5887b,c39c,d297a–c3a7967d16,425a,b
FC117b332a–c2275a,b5497b,c38b–d305a–c4a7933d16,500a,b
EKF118b,c362b,c1830a,b6746c33a,b270a,b3a7583b16,944a,b
UTC92a279a,b2039a,b10,377d32a257a4a7283a20,363b
Mean12533520855314373734814616,420
LSD 5% **1398577199658821024784
* TST = tebuconazole + spiroxamine + triadimenol; PT = prothioconazole + tebuconazole; M90 = metconazole; TET = tetraconazole; T250 = tebuconazole; CPC = ciproconazole + propioconazole + chloronitrile; FC = fluzilazole + carbendazim; EKF = epoxyconazole + kresoxym-methyl + fenpropimorf; UTC = untreated control); ** between treatments (fungicides and UTC, 9 treatments); Values followed by different letters are significantly different where significance is performed by Fisher LSD test.
Table 3. Simple carbohydrate content in wheat flour samples treated with various fungicides in a non-epidemic year (2011); results are the average of three wheat varieties.
FructoseGlucoseSucroseMaltoseNystoseRaffinoseStachyoseFructanTotal
Fungicide(mg/kg)(mg/kg)(mg/kg)(mg/kg)(mg/kg)(mg/kg)(mg/kg)(mg/kg)(mg/kg)
TST *101a280a681a135a74a37a1a5217b6526a
PT108a,b291a1035a–c168a,b76a65c2a5233b6979a
M90117a–c274a1304c153a110a59b,c3a5033a7053a
TET110a,b373b760a,b326c72a41a,b1a5483d7166a
T250128c,d319a955a–c315b,c90a47a–c2a5367c,d7223a
CPC142d,e296a1224c166a,b97a41a,b4a5383c,d7352a
FC150e300a1202b,c178a–c108a57b,c4a5717e7715a
EKF119b,c275a1281c165a,b115a46a,b3a5733e7737a
UTC119b,c289a913a–c114a76a45a,b2a5317b,c6875a
Mean12230010391919149353877177
LSD 5% **1748456151451831301413
* TST = tebuconazole + spiroxamine + triadimenol; PT = prothioconazole + tebuconazole; M90 = metconazole; TET = tetraconazole; T250 = tebuconazole; CPC = ciproconazole + propioconazole + chloronitrile; FC = fluzilazole + carbendazim; EKF = epoxyconazole + kresoxym-methyl + fenpropimorf; UTC = untreated control); ** between treatments (fungicides and UTC, 9 treatments); Values followed by different letters are significantly different where significance is performed by Fisher LSD test.
Table 4. Effect of fungicide treatments on maltose content in three wheat varieties, with differing levels of Fusarium susceptibility in a severe Fusarium epidemic (2010), Kiszombor-Hungary.
FungicideMaltose Content (mg/kg) 2010Maltose Content (mg/kg) 2011
SMSMRMeanS MS MR Mean
TST *4538a2457a1016a2670184a172a,b178a,b178
M909230b,c2436a2489a4718177a166a,b156a,b166
TET7107a,b3316a4153a,b4858158a142a158a,b153
EKF13,702d,e3398a3139a,b6746125a211a,b168a,b168
PT3893a1953a860a2235156a172a,b168a,b165
T2509967b,c2893a1653a4837139a131a136a,b135
CPC10,817c,d4188a2657a5887365b302b278a,b315
FC9465b,c4695a2332a5497237a163a,b578c326
UTC14,898e9822b6411b10,377113a129a101a114
Mean9290 3906 2745 5314181 176 213 191
LSD 5% variety 1153 50
LSD 5% fungicide 1996 87
Means followed by different letters are significantly different where significance is performed by Fisher LSD test. Wheat varieties: sensitive to Fusarium (S), moderately sensitive (MS), moderately resistant (MR); * TST = tebuconazole + spiroxamine + triadimenol; PT = prothioconazole + tebuconazole; M90 = metconazole; TET = tetraconazole; T250 = tebuconazole; CPC = ciproconazole + propioconazole + chloronitrile; FC = fluzilazole + carbendazim; EKF = epoxyconazole + kresoxym-methyl + fenpropimorf; UTC = untreated control).
Table 5. Results of PCA analysis: Principal components, eigenvalues, percentage of total variations and factor loads of variables in case of twenty traits of wheat samples.
TraitsPC1PC2PC3PC4
WG 0.71470.68050.0454−0.0329
FS0.86940.0325−0.3228−0.2420
HFN0.91730.0074−0.29800.1058
HI0.85210.2814−0.3088−0.2196
TKW0.7709−0.50760.12190.1631
PRO−0.04480.9386−0.1724−0.2755
ZI0.78290.57080.0924−0.1615
E1350.9770−0.04780.18150.0453
EXT0.8082−0.30080.2666−0.3866
RMAX0.9738−0.10270.15860.0979
DON−0.80210.2760−0.12980.4605
FRU0.8950−0.3778−0.0746−0.0697
GLU−0.5093−0.68870.2037−0.4174
SUC0.54980.26230.71790.3147
MAL−0.89290.3271−0.09310.1715
RAF0.95020.1143−0.13330.1996
NYS0.8775−0.0944−0.17560.3503
STA0.11530.90260.3473−0.1227
FRN0.9180−0.1720−0.11690.2197
Eigenvalue11.93163.84631.24361.1543
% of total variance62.8020.246.556.08
Abbreviations: WG—wet gluten, FS—Farinograph stability, HFN—Hagberg Falling number, HI—hardness index, TKW—thousand kernel weight, PRO—protein, ZI—Zeleny index, E135—extensograph energy, EXT—extensograph extensibility, RMAX—maximum resistance to extensibility (RMAX), DON—deoxynivalenol, FRU-fructose, GLU—glucose, SUC—sucrose, MAL—maltose, RAF—raffinose, NYS—nystose, STA—stachyose, FRN—fructan.
Disclaimer/Publisher’s Note: The statements, opinions and data contained in all publications are solely those of the individual author(s) and contributor(s) and not of MDPI and/or the editor(s). MDPI and/or the editor(s) disclaim responsibility for any injury to people or property resulting from any ideas, methods, instructions or products referred to in the content.

