Article

Precision Nutrient Management in Zero-Till Direct-Seeded Rice Influences the Productivity, Profitability, Nutrient, and Water Use Efficiency as Well as the Environmental Footprint in the Indo Gangetic Plain of India

1
ICAR-Indian Agricultural Research Institute, New Delhi 110012, India
2
Department of Natural Resource Management, Multi-Technology Testing Centre & Vocational Training Centre, Selesih, Central Agricultural University, Imphal 795004, India
3
ICAR-IGFRI, Jhansi 284128, India
4
Department of Physical Sport Science, College of Education, Princess Nourah bint Abdulrahman University, P.O. Box 84428, Riyadh 11671, Saudi Arabia
5
Department of Biology, College of Science, Taif University, P.O. Box 11099, Taif 21944, Saudi Arabia
6
Division of Soil Science, Bangladesh Wheat and Maize Research Institute, Dinajpur 5200, Bangladesh
*
Authors to whom correspondence should be addressed.
Agriculture 2023, 13(4), 784; https://doi.org/10.3390/agriculture13040784
Submission received: 17 February 2023 / Revised: 26 March 2023 / Accepted: 27 March 2023 / Published: 29 March 2023
(This article belongs to the Special Issue Sustainable Nutrient Management in Agricultural Production)

Abstract

:
Conventional tillage practices coupled with irrational use of fertilizer in the rice-wheat cropping system (RWCS) often leads to poor productivity, low nutrient use efficiency, and cause environmental pollution. Conservation tillage with surface residue retention in combination with intelligent nutrient management might improve productivity and use efficiency of water as well as nutrients in zero-till direct-seeded rice (ZTDSR). Keeping this in mind, during the kharif season of 2018 and 2019, a trial was carried out at the ICAR-IARI in New Delhi to investigate the varying nutrient management approaches following a precise manner in DSR. The treatments consisted of soil-test-based NPK (STB-NPK) and Nutrient Expert® (+LCCN) based NPK (NE-NPK) applications, Fertilizer applied at the recommended dose (RDF) [120-60-40 kg/ha NPK], the state recommended NPK (110-50-40 kg/ha) and omission plot technique of NPK [i.e., STB (N0PK, NP0K & NPK0); SR (N0PK, NP0K & NPK0) and NE-(N0PK, NP0K & NPK0)]. The results indicated that STB NPK application led to a 12% higher grain yield over RDF. However, NE-NPK resulted in a 7% and 35% increase in N (AEN) agronomic efficiency and P (AEP) over the STB-NPK application respectively. In contrast, AEk was 24% higher in STB-NPK over NE-NPK treatment. The comparison of two years’ results that the first year performed better than the succeeding year in these respect (productivity and AE) except in the case of AEk. The N2O emission in NE-NPK treatment was also significantly reduced (49%) over the control (no N). STB-NPK treatment also improved profitability by 22% over RDF. Precision nutrient management (PNM) increased the crop yield, income, and use efficiency of nutrients and water and reduced greenhouse gas (GHG) emissions of DSR in Southeast Asia.

1. Introduction

Rice (Oryza sativa L.) is the most predominant cereal crop in Southeast Asian countries, particularly India. Rice is grown on approximately 45 million hectares in India, accounting for 32.14% of the total net cultivated area [1]. Milled rice production and productivity in India are 177.65 million tonnes and 2.89 tonnes ha−1, respectively [1]. As the world’s population increased from 3000 to 8000 million between 1960 and 2020, food and nutritional insecurity are significant global challenges for more than 3000 people in developing and under-developing countries [2]. From 1990 (598.67 million tonnes of rice production) to 2020 (756.74 million tonnes of rice), the use of high-yielding rice varieties, management of nutrients and soil, improved efficiency of water use in significant global pest management (including weed management) increased global rice yield by 26.4% [2]. During that time spell, the output of cereal crops grew from 877 to 2932 million tonnes, respectively [3]. To meet global rice demand, there is an urgent need to produce a supplemental 96 million tonnes of milled rice by 2040 compared to 2015 [4]. Thus, the contribution of inorganic fertilizers to cereal cultivation cannot be overlooked for the nutrition of the world’s 8 billion people. The fertilizer nutrient consumption ratio (N:P2O5:K2O) is wide (6.7:2.4:1 in 2018-19) compared to a recommended consumption ratio of 4:2:1 [5]. The consumption ratio of (N:P2O5:K2O) is frequently wider and highly skewed in Southeast Asia’s Indo-Gangetic Plain (IGP), especially towards nitrogen. Fertilizer application in the RWCS varies significantly across the IGP, with average rates (N + P2O5 + K2O) ranging from 258 kg ha−1 in the Lower-Gangetic Plain zone to 444 kg ha−1 in the Trans-Gangetic Plain location (TGPZ) [6]. Sufficient amounts of plant nutrients must be applied to increase rice yield and production [7]. On the other hand, farmers apply fertilizer at a constant rate over large areas rather than adapt to fulfill nutrient demand [8]. All these result in lower use efficiency of nutrients & low net return. Furthermore, irrational and imbalanced fertilizer use, particularly N and P fertilizers application, also leads to the reduced use efficiency of nutrients (NUE) that is also correlated with the aggressive effect on the agricultural system, such as the emission of greenhouse gases [9]. In Southeast Asia, nutrient guidelines are based on the crop response data averaging nearly over the vast regions and fail to consider the spatial variability in terms of the native nutrient capacity of soils [10]. According to the Indo-Gangetic plain survey, farmers frequently apply more N and P than recommended rates and fail to use enough K and other macro and micronutrients [11].
Most scientists have recently emphasized conservation agriculture (CA), which is based on the most negligible soil cultivation, at least 30% residue cover, and sensible crop rotation to discuss many of the pressing concerns of cereal production in North-West India [12]. ZT practices in wheat have been widely adopted by northern Indian farmers, primarily to accelerate early sowing of succeeding crops like wheat in areas where rice harvesting is getting delayed, to increase yield, profitability, and lower production costs [13]. Nonetheless, farmers in India are still not adopting ZT-DSR as most of the farmers trust transplanted rice (TPR) because it has several problems like (a) less weed problem, (b) less problem of nutrient availability, (c) no problem of nematodes and (d) no problem of Fe deficiency. However, in DSR, the water requirement is significantly less. Nevertheless, DSR grown in South Asia has been shown to increase the economic viability and reduce the environmental impact of rice cultivation by reducing labor, irrigation, and fuel costs, significantly reducing the cost of cultivation and increasing net profit; in addition, it reduces greenhouse gas (GHG) emissions [14]. Because of the prevailing intense water table in North-western IGPs, DSR could be a promising alternative to TPR in India. In 2013, rice was grown on 60 million hectares (Mha) and managed to produce slightly upwards continental production of 225 million tonnes, accounting for 37.5 and 32% of global area and production, respectively [15]. However, optimal nutrient management in ZT-DSR in a precise manner is still poorly understood. PNM captured the temporal and spatial variability in soil fertility and prescribed feeding the crop with the essential macro and micronutrients based on crop need to increase crop yield [16]. SSNM (4′R stewardship meaning applying nutrients at the right place, right time, in the right method, and right amount), one of the best management practices (BMPs) are the key factors that give us the proper direction towards more intensified sustainable rice production. The major challenges in fertilizer application of DSR are (a) large variability in soil nutrient supply and (b) yield response to varying nutrients among fields caused by differences in crop growing conditions, soil and crop management, and climate [17]. Many algorithms and methodologies have been developed to investigate nutrient and crop management practices that are widely used worldwide [18]. Adopting best soil management practices based on the SSNM using the Nutrient Expert (NE®) concept has enhanced the economic output of DSR. It is based on crop demand and the inherent nutrient capacity of soil following the target yield concept [19].
With this in mind, science-based, dependable, and cost-effective fertilizer recommendation methods are required to address the lack of knowledge of farmers that often ignore many scientific methods of fertilizer application in India. In India, fragmentation of agricultural land is the major problem in adopting scientific tools to farming communities, as the use of scientific tools incurs higher costs. Still, NE® may help address this constraint. The NE® is a nutrient-based decision support system (DSS) developed by the International Plant Nutrition Institute (IPNI) to help address many limitations. The major objective of this two-year experiment was to optimize nutrient management precisely through DSS tools (NE® and Soil Test-based Equation) for maximizing the crop yield with higher NUE and profitability and the reduced emission of GHGs in DSR in the IGP of Southeast Asia.

2. Materials and Methods

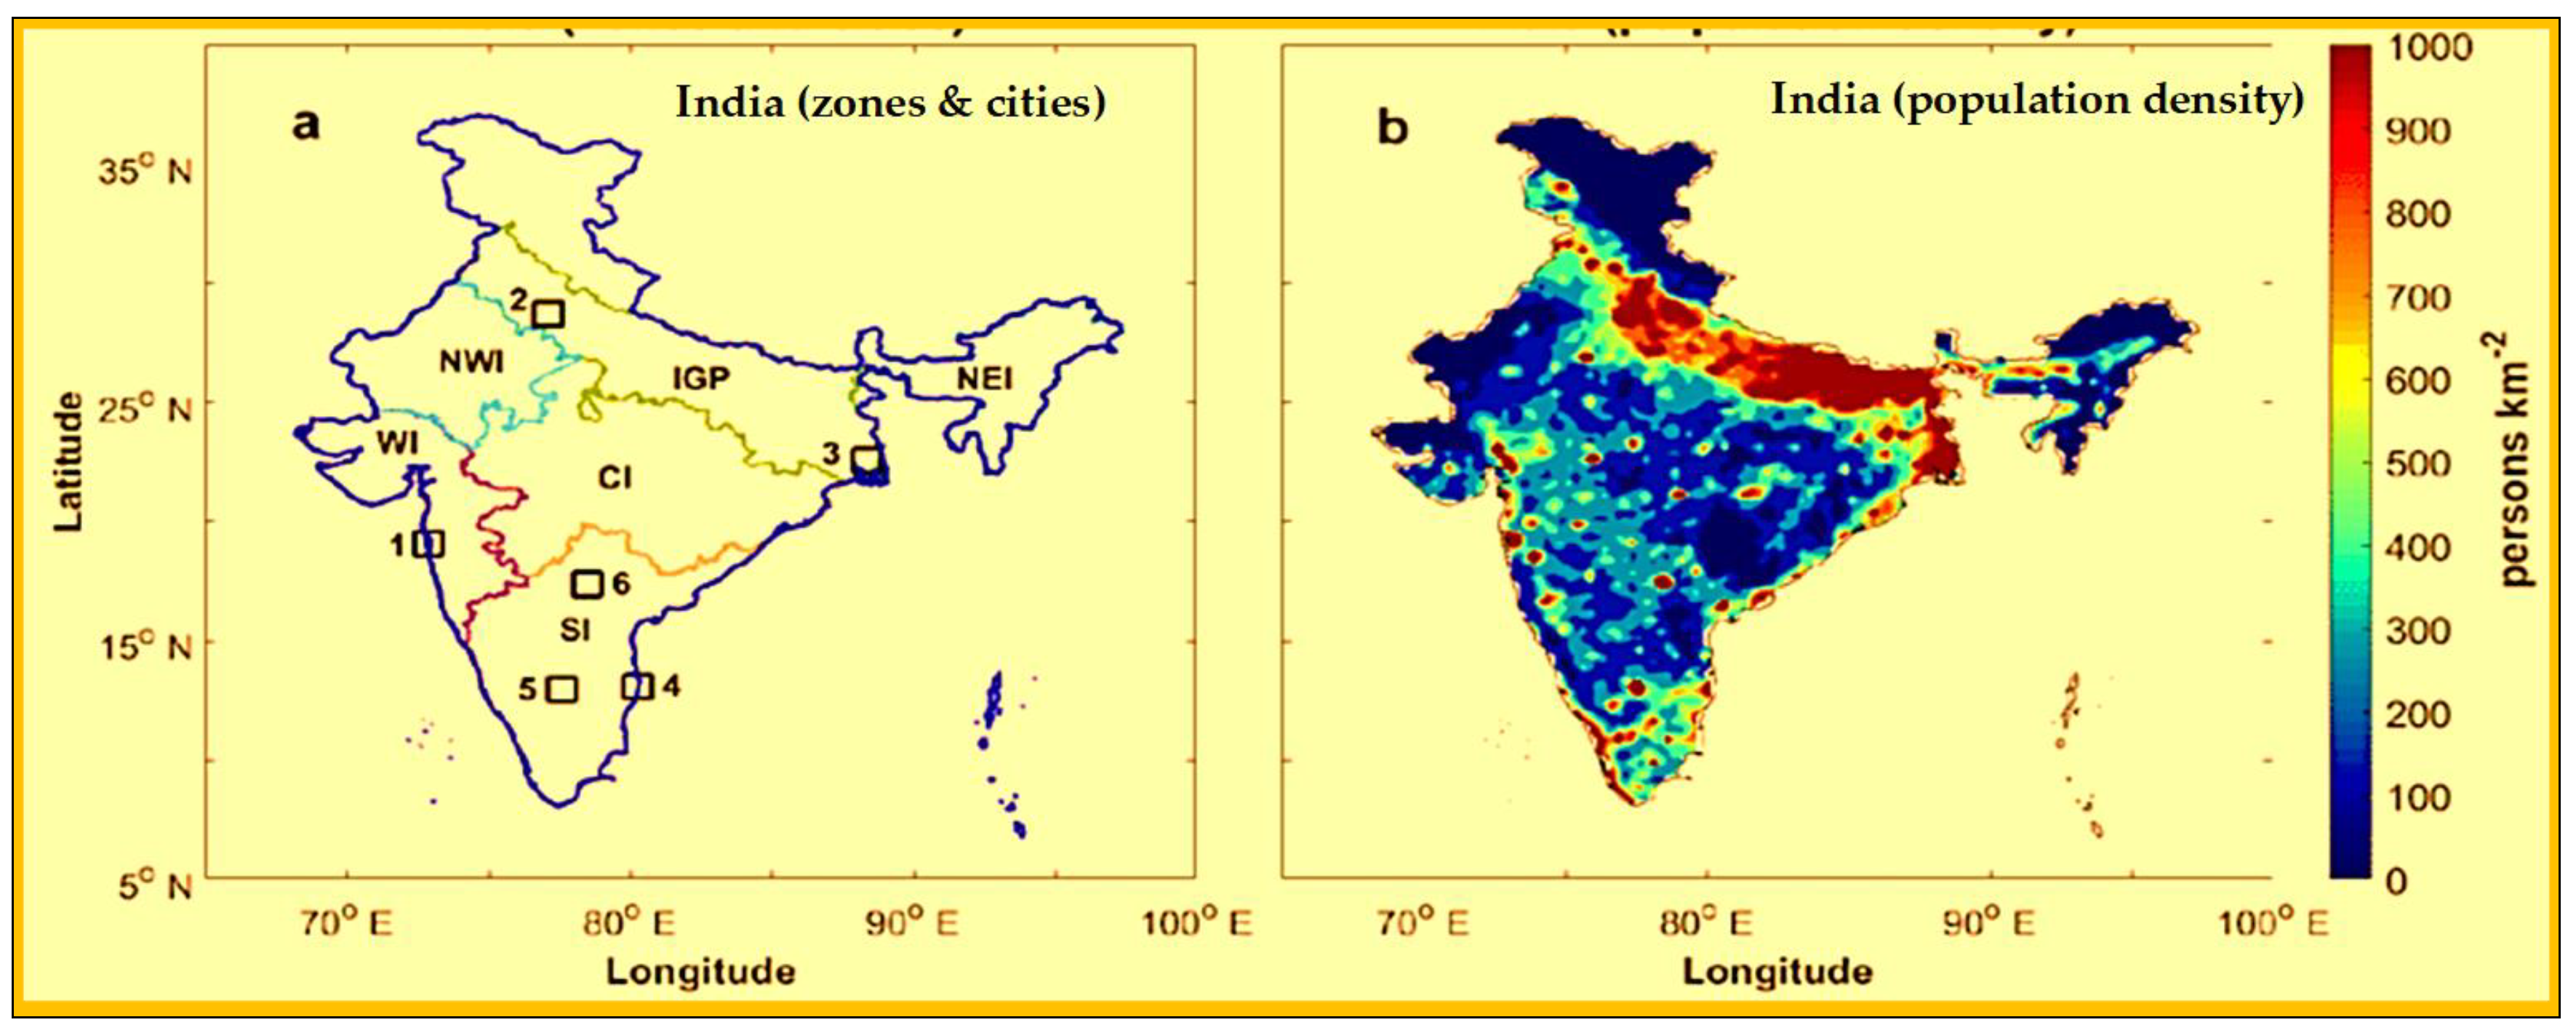
2.1. Site of Research Trial

The study took place at the Farm under the trial of the ICAR-IARI, New Delhi (128°40′ N & 77°12′ E and elevation of 228.6 m above MSL). The experimental field is under a subtropical environment with a semi-arid climate (Figure 1). During the summer, May and June represent the warmest months, with prevailing highest temperatures from 41–46°C, while temperatures begin to fall in September. January is the coldest month of the prevailing winter season, with the lowest temperature from 5–7 °C. The average rainfall is 650 mm annually, with approximately 80% receiving the months of July & August. The mean pan evaporation (Ep) that occurred is approximately 850 mm annually. The soil under the trial falling to the order of Inceptisols also belongs to sandy clay loam in soil texture (30 cm topsoil) and loamy texture below 30 cm depth. Table 1 showed the cropping history and Table 2 presented the initial soil characteristics before the sowing of the research trial for investigation.

2.2. Experimental Details

Rice was established under the method of zero-tillage (ZT) by following 12 levels of precision nutrient management (PNM) strategies: (a) NE-based NPK management with 1/2 of the nitrogen and full phosphate and potash at basal (NE-based full dose: 125-35-50 kg N-P2O5-K2O ha−1) and remaining nitrogen was top-dressed based on Leaf Colour Chart (LCC) value of rice (When LCC: 2 = 30 kg N ha−1: LCC:3 = 25 kg N ha−1 and LCC: 4 = 15 kg Nha−1); (b) NE based NPK0 (-K) where the full dose of phosphate was applied as basal and total nitrogen of 125 kg ha−1was applied in three splits with 38 kg at basal, 44 kg N at first top dressing (30 DAS) and 43 kg N at 45 DAS; (c) NE-based N0PK (-N) where full phosphate and potash (total of 35 kg and 50 kg ha−1 P2O5 and K2O respectively) were placed as basal; (d) NE-based NP0K (-P) application where K2O was placed at sowing time and N was placed in 3 split doses (38 kg at basal, 44 kg at 30 DAS, and 43 kg at second top dressing); (e) Fertilizer applied at Recommended Dose (RDF) [120-60-40 kg NPK/ha] with full P and K at basal and N was given in 3 equal splits (the half at basal, 1/4th at 30 DAS and remaining 1/4th at 45 DAS); (f) Soil test-based NPK application with entire doses of P2O5 and K2O were placed at sowing time and N in 3 equal split doses (half N at basal, 1/4th at first top dressing and remaining 1/4th at second top dressing). All treatments were arranged in a randomized complete block design (RCBD) and repeated three times. The amount of fertilizer applied in various treatments is presented in Table 3.
Different equations (Equations (1)–(3)) were developed for Soil Test Crop Response (STCR) based on the ICAR-Indian Institute of Soil Science, Bhopal.
FN = 4.93 T − 0.47 SN
FP2O5 = 4.48 T − 7.82 SP
FK2O = 2.31 T − 0.21 SK
where T = Targeted yield of rice (5.0 t ha−1) and SN denotes readily accessible nitrogen in the soil, SP denotes readily accessible phosphorus in the soil, and SK denotes readily accessible potassium in the soil.
FN = Fertilizer nitrogen dose (kg ha−1); FP2O5 = Fertilizer phosphorus dose (kgha−1) and FK2O = Fertilizer potash doses (kgha−1).
STB-based N0PK (-N) application; (h) STB-based NP0K (-P) application; (I) Soil test-based NPK0 (-K) application; (j) State-recommended N0PK application; (l) State-recommended NP0K application (-P) application and m) state-recommended NPK0 (-K) application. The each experimental gross plot size was 19.36 sq. metre.

2.3. NE Software

NE is a computer-based nutrient DSS that implements site-specific nutrient management (SSNM) principles and encapsulates experimental data into a simple delivery system that aids growers in attempting to implement the precise and improved application of nutrients in field crops [20]. The International Plant Nutrition Institute (IPNI) Framed and corroborated this software. NE quantifies attainable yields for field crops while keeping growing conditions in mind, calculates nutrient balance in cropping systems using previous crop yields and fertilizer applied, and integrates data with soil properties to predict expected nutrient (N, P, and K) response in the respective fields, generating a SSNM recommendation. Finally, it utilizes data given by farmers or experts/agronomists to advise a location-specific yield goal and develops the fertilizer management strategy needed to achieve that yield goal.

2.4. Crop & Field Management

Wheat crop stubbles were left in the field in zero-till plots for 20 cm. The rice seeds (cv. Pusa Basmati 1509) were then directly seeded at a -row-row spacing of 20 cm. DSR had a seed rate of 35 kg ha−1. Seed cum fertilizer drills were used for sowing, and fertilizers were placed in the furrow openers in 2018 and 2019, respectively. Sowing took place on 23 June 2018, in the first year, and on 20 June 2019, in the second year. Fertilizer recommendations were developed based on the treatments that differed from plot to plot. All fertilizers except nitrogenous fertilizer (half a dose of nitrogen) were applied at the time of seeding. The NPK rates (kg ha−1) for the various treatments under investigation are given in Table 3.

2.5. Information Collected

At each stage of the crop, the data from the experimental plots and the management practices were meticulously recorded. The produce from each plot’s 3.4 × 3.4 m2 area was harvested manually with sickles during harvesting. The rice crop was then exposed to the sun before being threshed to estimate grain as well as bundle yields. The yield was calculated at a grain moisture content of 14%. The seed and straw yield was integrated to get the total above-ground bundle weight considered the total biomass output.

2.6. Efficiency of Nutrient Use (NUE)

Agronomic efficiency (AE), as well as Partial factor productivity (PFP), were assessed for recording the efficiencies of all nutrients (N, P, and K) under PNM strategies. The PFP was assessed as the yield of seed per unit of fertilizer elements used in DSR [21].

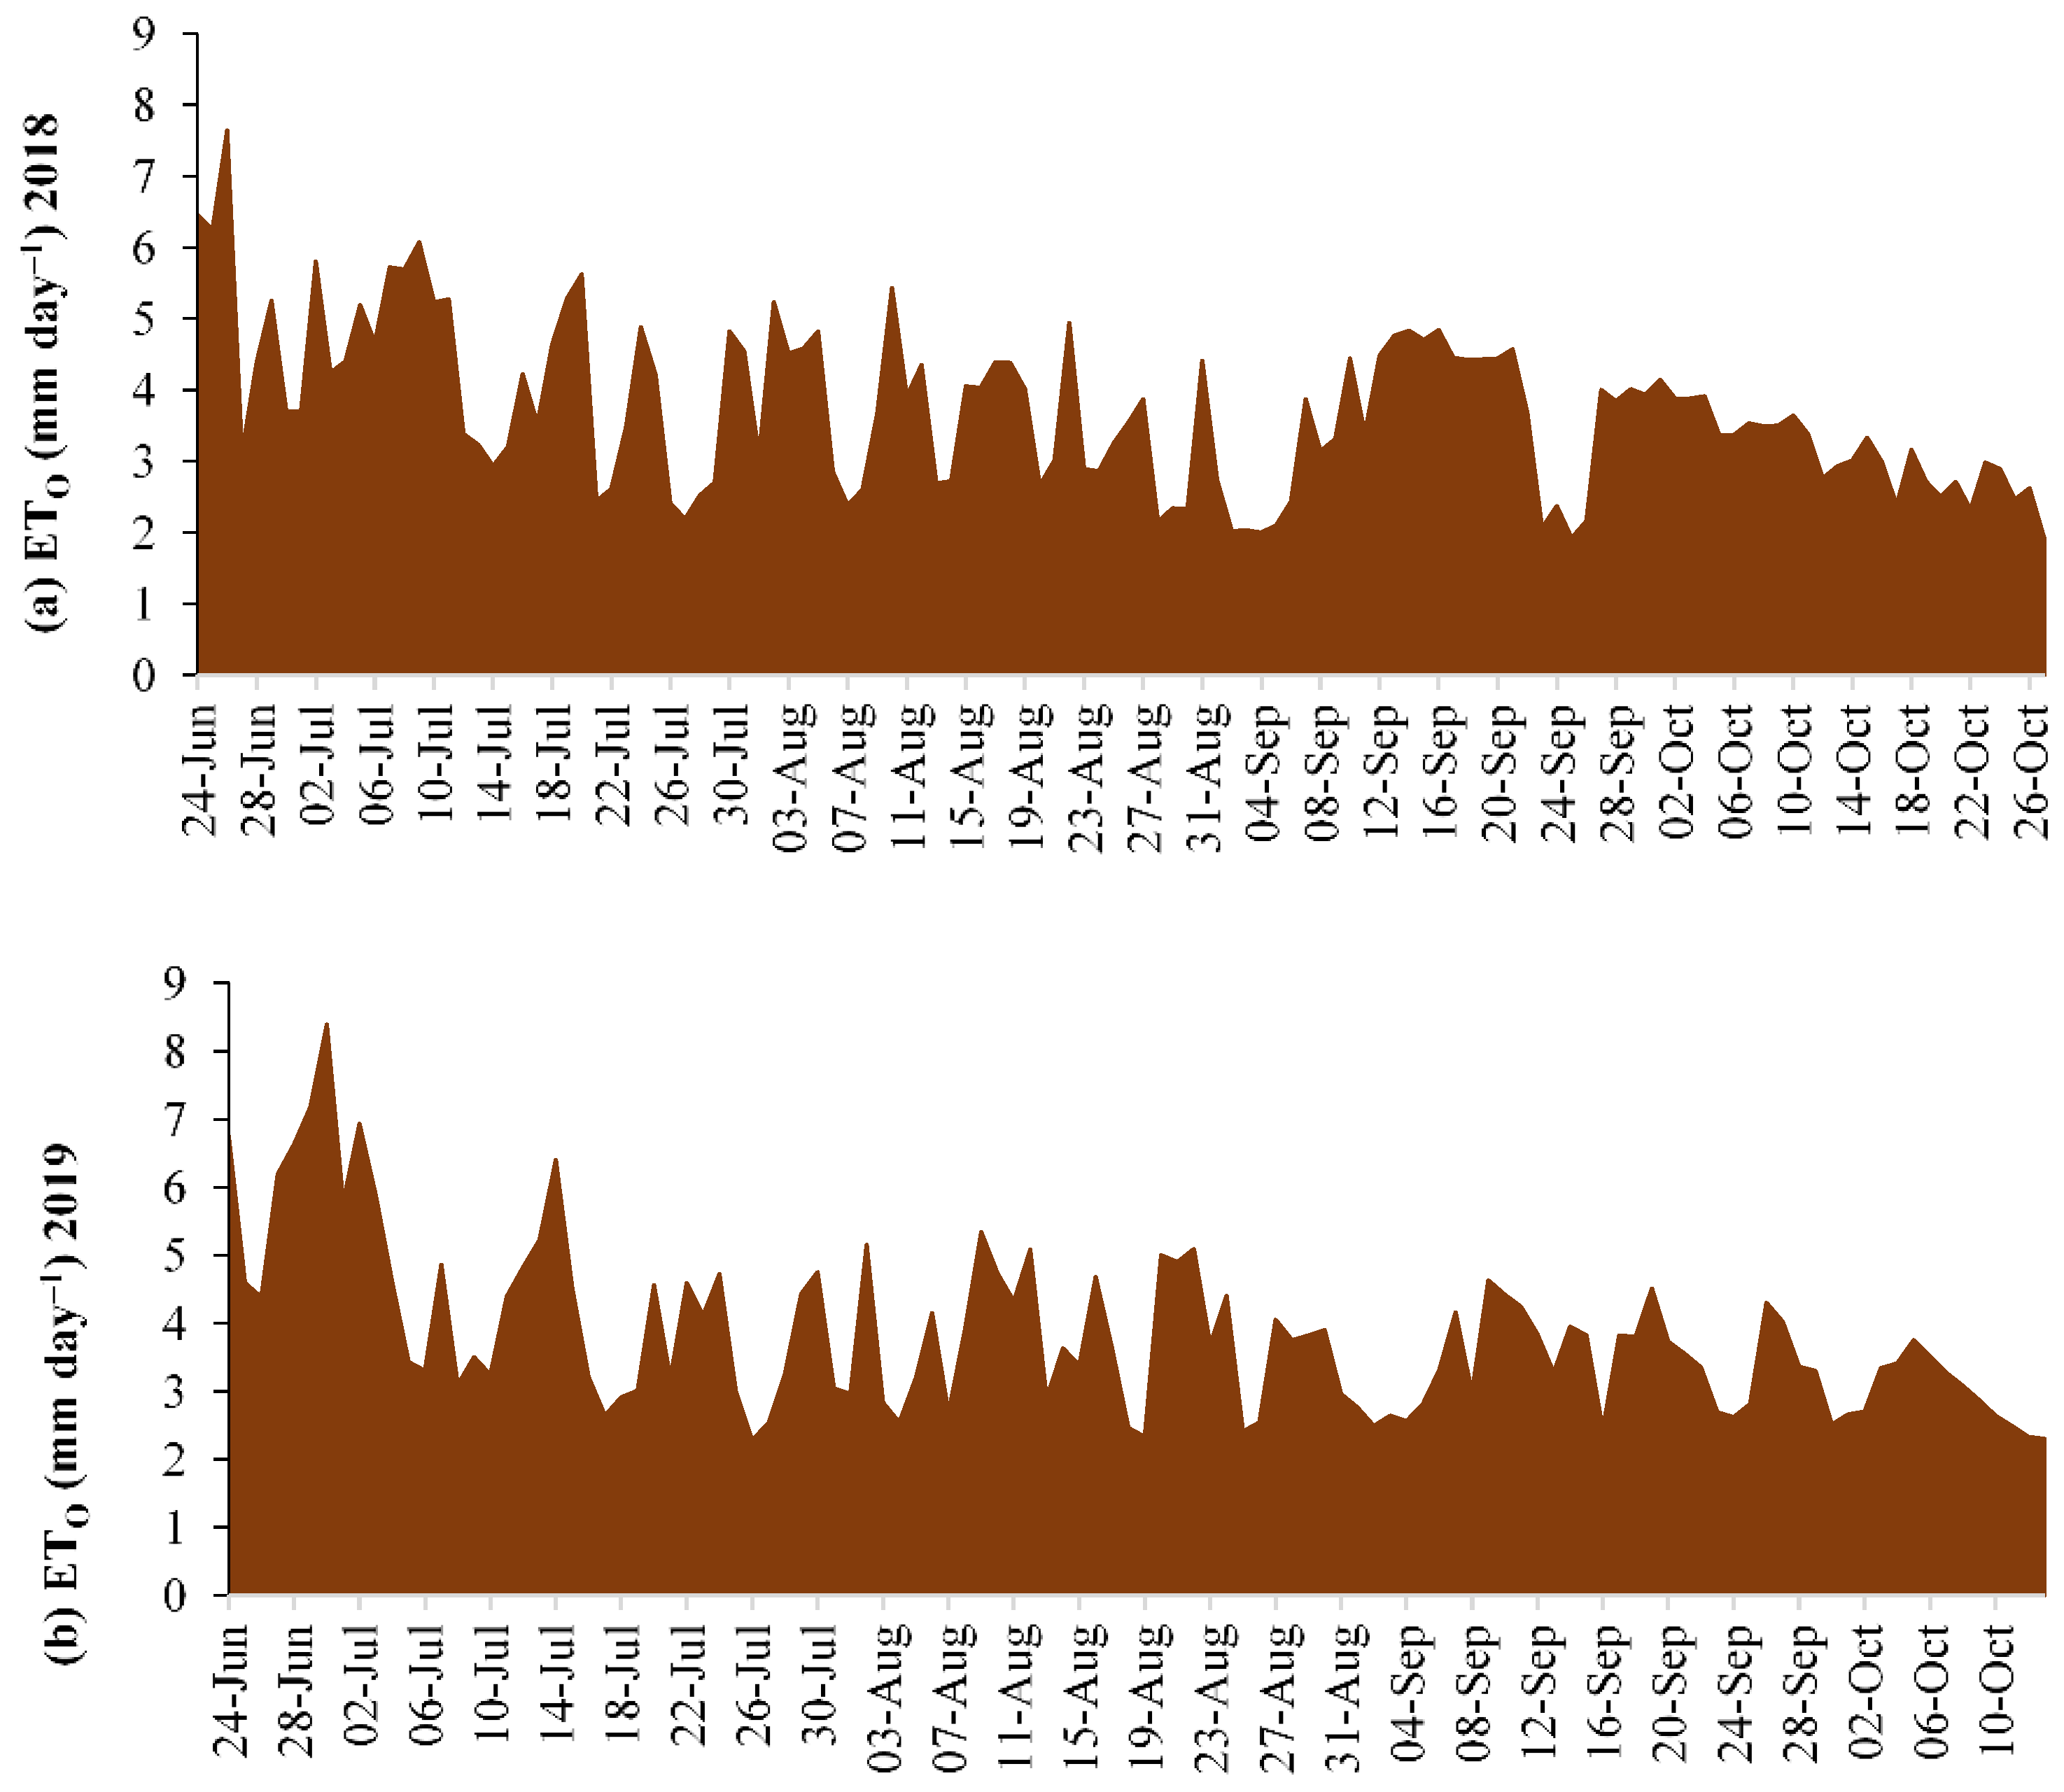
2.7. Water Productivity

To maintain aerobic conditions under DSR, irrigation water (IW) with an average depth of 30 mm was given each time. The total volume of IW (m3) was calculated by adding the irrigation depths and multiplying by its area. The entire vol. of water (m3) given to the field was formed of irrigation water and adequate precipitation (Peff). The Peff was calculated using the USDA soil conservation service method [22], and the daily rainfall (Pdaily) data were recorded at ICAR-IARI, New Delhi.
Peff = Pdaily × (125 − 0.6 × Pdaily)/125, if Pdaily ≤ 250/3 mm
Peff = 125/3 + 0.1 × Pdaily, if Pdaily > 250/3 mm
The estimation of ET precisely is extremely crucial for optimal water resource management. The reference ET was anticipated using CROPWAT, a computer model (ET0). In CROPWAT, daily meteorological data such as Rainfall, Temp, RH & wind speed (km/h), and BSSH were used as input data. ETo is calculated by CROPWAT using the Penman-Monteith equation [23].
By multiplying ETo with the crop coefficient, crop evapotranspiration (ETc) was calculated, which almost equaled the total crop water requirement (Kc). The following equations were used to assess Irrigation Water Productivity (IWP), Total Water Productivity (TWP), and Crop Water Use Efficiency (CWUE) (Equations (6) and (7)).
IWP (kg m−3) = [grain yield (kg ha−1)/irrigation water (m3 ha−1)]
TWP (kg m−3) = [grain yield (kg ha−1)/total water (m3 ha−1)]
CWUE (kg m−3) = [grain yield (kg ha−1)/seasonal crop evapo-transpiration (m3 ha−1)]

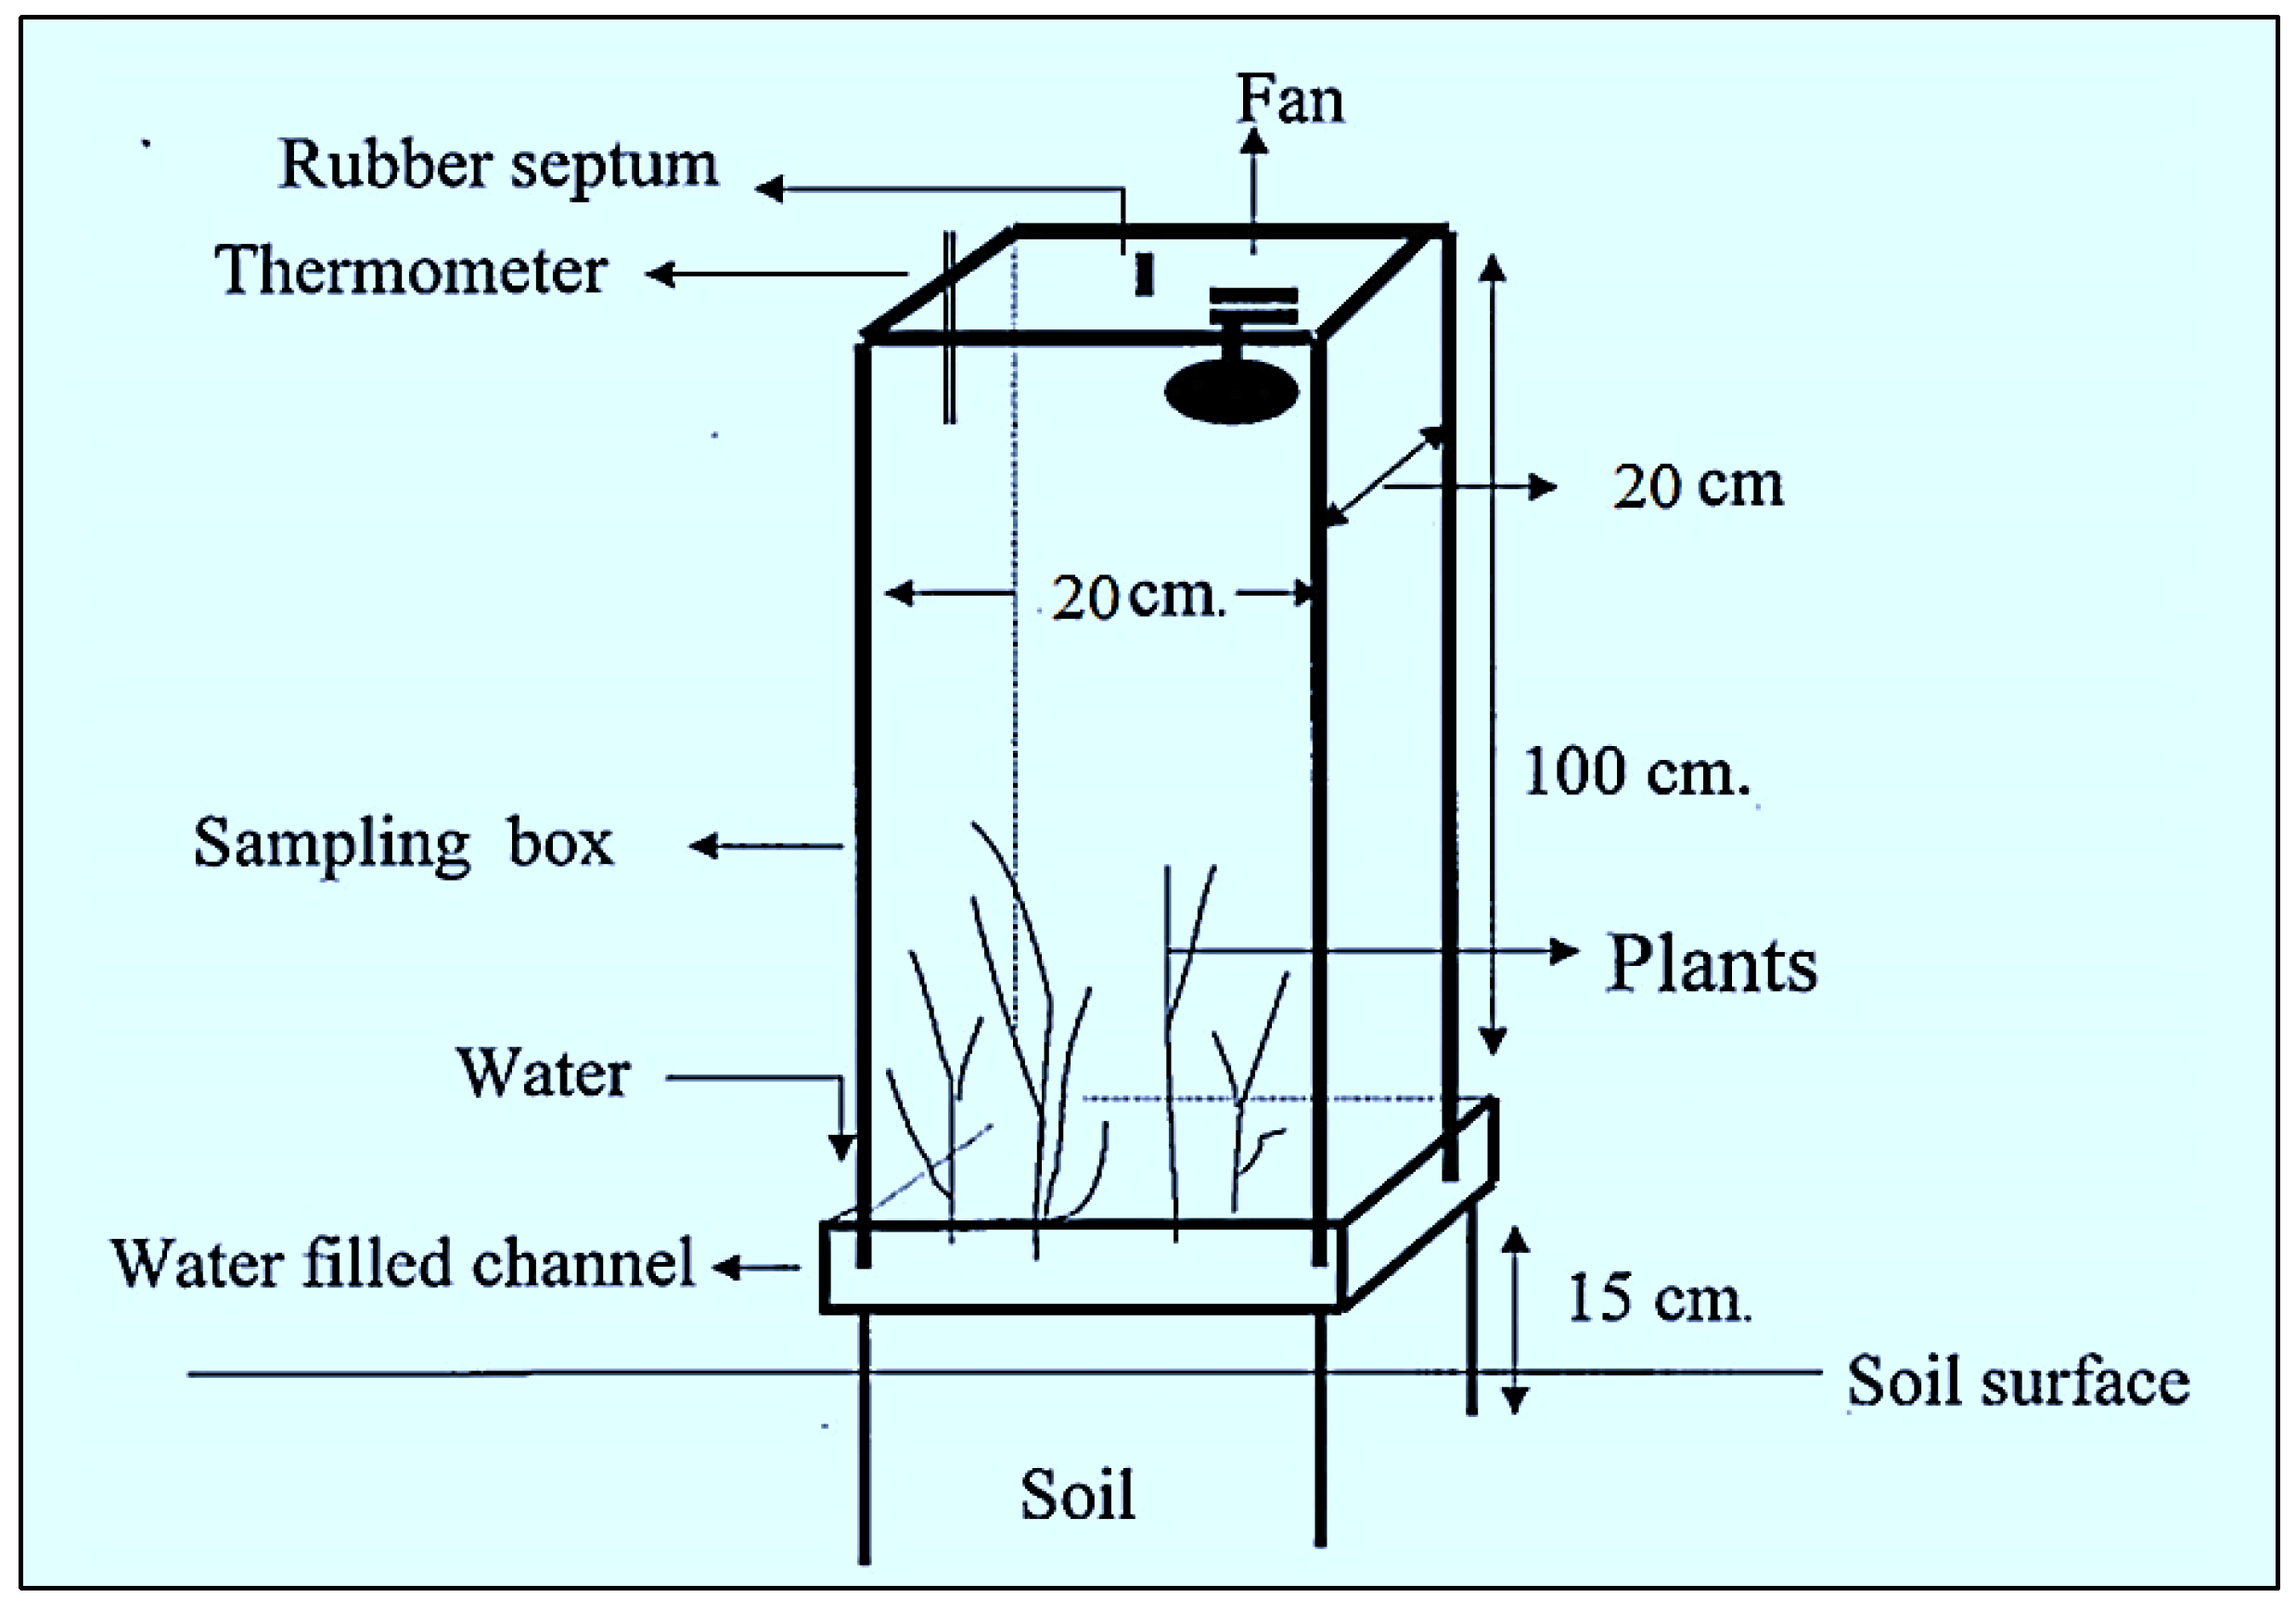
2.8. Estimation of Greenhouse Gas (N2O)

The closed chamber technique was used to collect greenhouse gas samples [24]. The channels were dug about 10 cm into the ground (Figure 2).
An Al channel having 15 cm height (h) and 5 cm diameter (2r) was put in the experimental site for each chamber. To prevent air from passing through, the channel was filled with water. A six mm thick acrylic sheet was used to create chambers 20 cm in length, 20 cm breath, and 100 cm in height.
To prevent air from passing through, the channel was filled with water. After that, a 3-way stopcock was installed at the chamber head for loading mixtures of gases with syringes. A 50 mL gas syringe was used for flushing the chamber thoroughly several times to homogenize gas mixtures. Gas samples were collected at 0 and 1 h by interjecting a hypodermic needle (24 gauge) and air proofing the syringes with a stopcock. The headspace volume inside the box (0.04 m2) was measured to estimate the N2O-N flux (Figure 2) using the formula of [(cumulative seasonal N2O emission) × 28/44] in µg m−2 h−1. Gas samples were collected at 0 and 1 h by interjecting a hypodermic needle (24 gauge) and air proofing the syringes with a stopcock. The headspace volume inside the box (0.04 m2) was measured to estimate the N2O-N flux (Figure 2). Utilizing a gas chromatograph (Hewlett Packard 5890 Series II), the concentration of N2O-N in the gas samples was assessed. The temperature of the injector, column as well as detector was established to 120 °C, 50 °C, and 320 °C, respectively. With a flow rate of 14 mL min−1, N2 was used as a carrier gas. Figure 2 represents the Closed Top Chamber.

2.9. Economic Analysis

The fixed and variable costs were used to calculate the gross and net returns of the production system. Goss returns (GR) were computed by multiplying rice yield by the MSP and straw yield by the current market rate, then adding the results. The formula calculated net returns (NR) and the benefit-cost (B-C) ratio. The total cost (TC) included general costs (including irrigation cost and labor costs) & treatment costs. The B-C ratio was computed by dividing the net return by the total cost of cultivation (Total Cost= summation of the general cost of cultivation and treatment cost of cultivation).
NR (USD) = GR (USD) − TC (USD)
B-C ratio = (NR)/(TC)

2.10. Statistical Analysis

The recorded data were rearranged and analyzed by using WASP 2.0 (ICAR-CIARI) software. Before analysis, the Bartlett Chi-square test was carried out to minimize the error variances for the homogeneity of all recorded data. The model ANOVAs (two-way) of the Factorial Randomized Complete Block Design (RCBD) were presented in Table 4.

3. Results

3.1. Grain and Biomass Yield of DSR Rice as Influenced by Year-Specific Different PNM

The soil test-based (STB) NPK application provided significantly higher grain and total biomass yield than other treatments under study (Table 4, Table 5 and Table S1). However, the grain yield of the first year was markedly higher than the second year under the experiment (Table 4, Table 5 and Table S1). But total biomass yield did not touch the level of significance over the years (Table 4, Table 5 and Table S1). The significant (p ≤ 0.05) improvement in grain yield of DSR in the first year might be due to the easy accessibility of nutrients considering pre-existing soil conditions in the succeeding year. It was also noticeable that grain yield and total biomass yield in STB-based treatment (6% higher grain yield and 10% higher total biomass yield over NE-NPK) were also comparable to NE(+LCC)-NPK treatment owing to the well-adoption of the SSNM strategy. However, the lowest grain and total biomass yield were obtained in the State recommendation based N0PK and STB N0PK application, respectively that can be compared with other treatments with omission plot techniques (Table 4, Table 5 and Table S1). The higher seed yield and biomass yield of DSR under the experimental years in the STB-based NPK and Nutrient Expert(+LCC) NPK were due to adequate N availability and the significant viz-a-viz—positive linear associations between the seed yield and N uptake by the rice.

3.2. Partial Factor Productivity (PFP) of N, P & K in DSR Is Influenced by Year-Specific Different Nutrients Management

The PEP of N was significantly (p ≤ 0.05) increased in the initial year than the succeeding year (Table 4, Table 6 and Table S2). Similarly. PFPP & PFPK were also significantly higher in the first year than in the succeeding year (Table 4, Table 6 and Table S2). Moreover, the PEP of N was significantly (p ≤ 0.05) increased in NE (+LCC)-NPK based treatment over the rest of the treatments under study which was comparable with RDF only (Table 4, Table 6 and Table S2).
Moreover, the lowest PFP of N was found in the STB-based NP0K treatment followed by STB NPK0 treatment. In brief, the experiment of two years showed that NE (+LCC)-NPK treatment performed the highest PFPN followed by RDF & STB-NPK treatment in DSR (Table 4, Table 6 and Table S2). In the case of P, the PFP of P was significantly (p ≤ 0.05) higher in the first year than in the second year (Table 4, Table 6 and Table S2). However, the PFP of P was also significantly (p ≤ 0.05) higher in the NE (+LCC)-NPK based treatment (118.07 kg kg−1) than the rest of the treatments under study during the experimental years. Moreover, the PFP of P was markedly lowest in the STB-based N0PKtreatment than the other treatments during the experimental research period (Table 4, Table 6 and Table S2). Similarly, the PFP of K was significantly (p ≤ 0.05) higher in the RDF-based treatment [97.22 kg kg−1] followed by NE-NPK treatment [82.65 kg kg−1] than the other treatments. However, the PFP of K was lowest in the STB-based N0PK application (Table 4, Table 6 and Table S2).

3.3. Agronomic Efficiency (AE) of DSR Is Influenced by Year-Specific PNM

The AE of DSR in both years was influenced significantly (Table 4, Table 7 and Table S2). However, the first year performed statistically higher AE than the second year with the exception that AEk was markedly higher in the second year than the preceding year (Table 4, Table 7 and Table S2).
However, NE-NPK resulted in a 7% and 35% increase in N (AEN) agronomic efficiency and P (AEP) over the STB-NPK application respectively. In contrast, AEk was 24% higher in STB-NPK over NE-NPK treatment under the study. In fact, the AE of primary mineral nutrients decreased with the increasing rate of direct nutrient application between STB NPK application and NE (+LCC) NPK application, except for fertilizer application at recommended rates (Table 4, Table 7 and Table S2). In brief, it was reported that NE-NPK exhibited significantly highest agronomic efficiency of N and P than other treatments which was statistically at par with STB-NPK treatment with the exception that AE of K was found highest in STB-NPK treatment (Table 4, Table 7 and Table S2).

3.4. Water-Use Efficiency and Water Productivity

The number of irrigations given to the field of DSR in both years was 15 (2018) and 17 (2019), respectively. The irrigation depth (cm) was the same (3 cm) during both years of experimentation. Reference evapotranspiration (ET0) in mm/day during the year of investigation (2018–2019 & 2019–2020) were depicted in Figure 3.
Nutrient management in a precise manner significantly (p ≤ 0.05) influenced the IWP and CWUE as well as TWP of DSR (Table 4, Table 8 and Table S3). However, the first year performed significantly higher IWP than the second year. But, the year effect did not touch the level of significance in the case of TWP as well as CWUE (Table 4, Table 8 and Table S3). IWP were highest in the STB-based NPK application treatment (0.916 kg/m3), which were statistically (p ≤ 0.05) at par with NE (+LCCN) based NPK (0.866 kg/m3) and RDF-based NPK (0.814 kg/m3) treatments during the experiment years (Table 4, Table 8 and Table S3). However, the lowest IWP was found in state-recommended (SR) based N0PK application (0.651 kg/m3) followed by STB-based N0PK application (0.657 kg/m3) (Table 4, Table 8 and Table S3).
In comparison to TWP (Table 4, Table 8 and Table S3), the STB-based NPK application (0.52 kg/m3) had the highest water productivity which was statistically (p ≤ 0.05) equal to the NE (+LCCN)-based NPK application (0.49 kg/m3) and RDF-based NPK application (0.462 kg/m3). However, the lowest total water productivity was found in the SR-based N0PK application (0.36 kg/m3), which was quantitatively equal to all other omission plot treatments under study (Table 4, Table 8 and Table S3).
Regarding the CWUE comparison (Table 4, Table 8 and Table S3), the highest CWUE was found only in STB-based NPK applications (1.15 kg/m3), followed by NE-based NPK & RDF-based NPK than the rest of the treatments during the experimentation. It was also found that crop water productivity performance was relatively better in 2018 rather than in 2019 but did not touch the level of significance. In brief, it was shown that STB-NPK treatment performed significantly higher IWP, TWP, and CWUE than the rest of the treatments (Table 4, Table 8 and Table S3).
Moreover, the year effect did not touch the level of significance in the case of net return (NR). It was also recorded that the Benefit-cost ratio of the second year was markedly higher than the first year (Table 4, Table 9 and Table S1). Furthermore, the lowest net returns were obtained in the STB-based N0PK application ($819.1 ha−1) and the SR-based N0PK application ($853.3 ha−1), NE-NPK ($853.5 ha−1) (Table 4, Table 9 and Table S1). So, Site-specific nutrient management (i.e., STB-based NPK & NE-based NPK application) increased profitability more than conventional (RDF and State recommendation) practices.

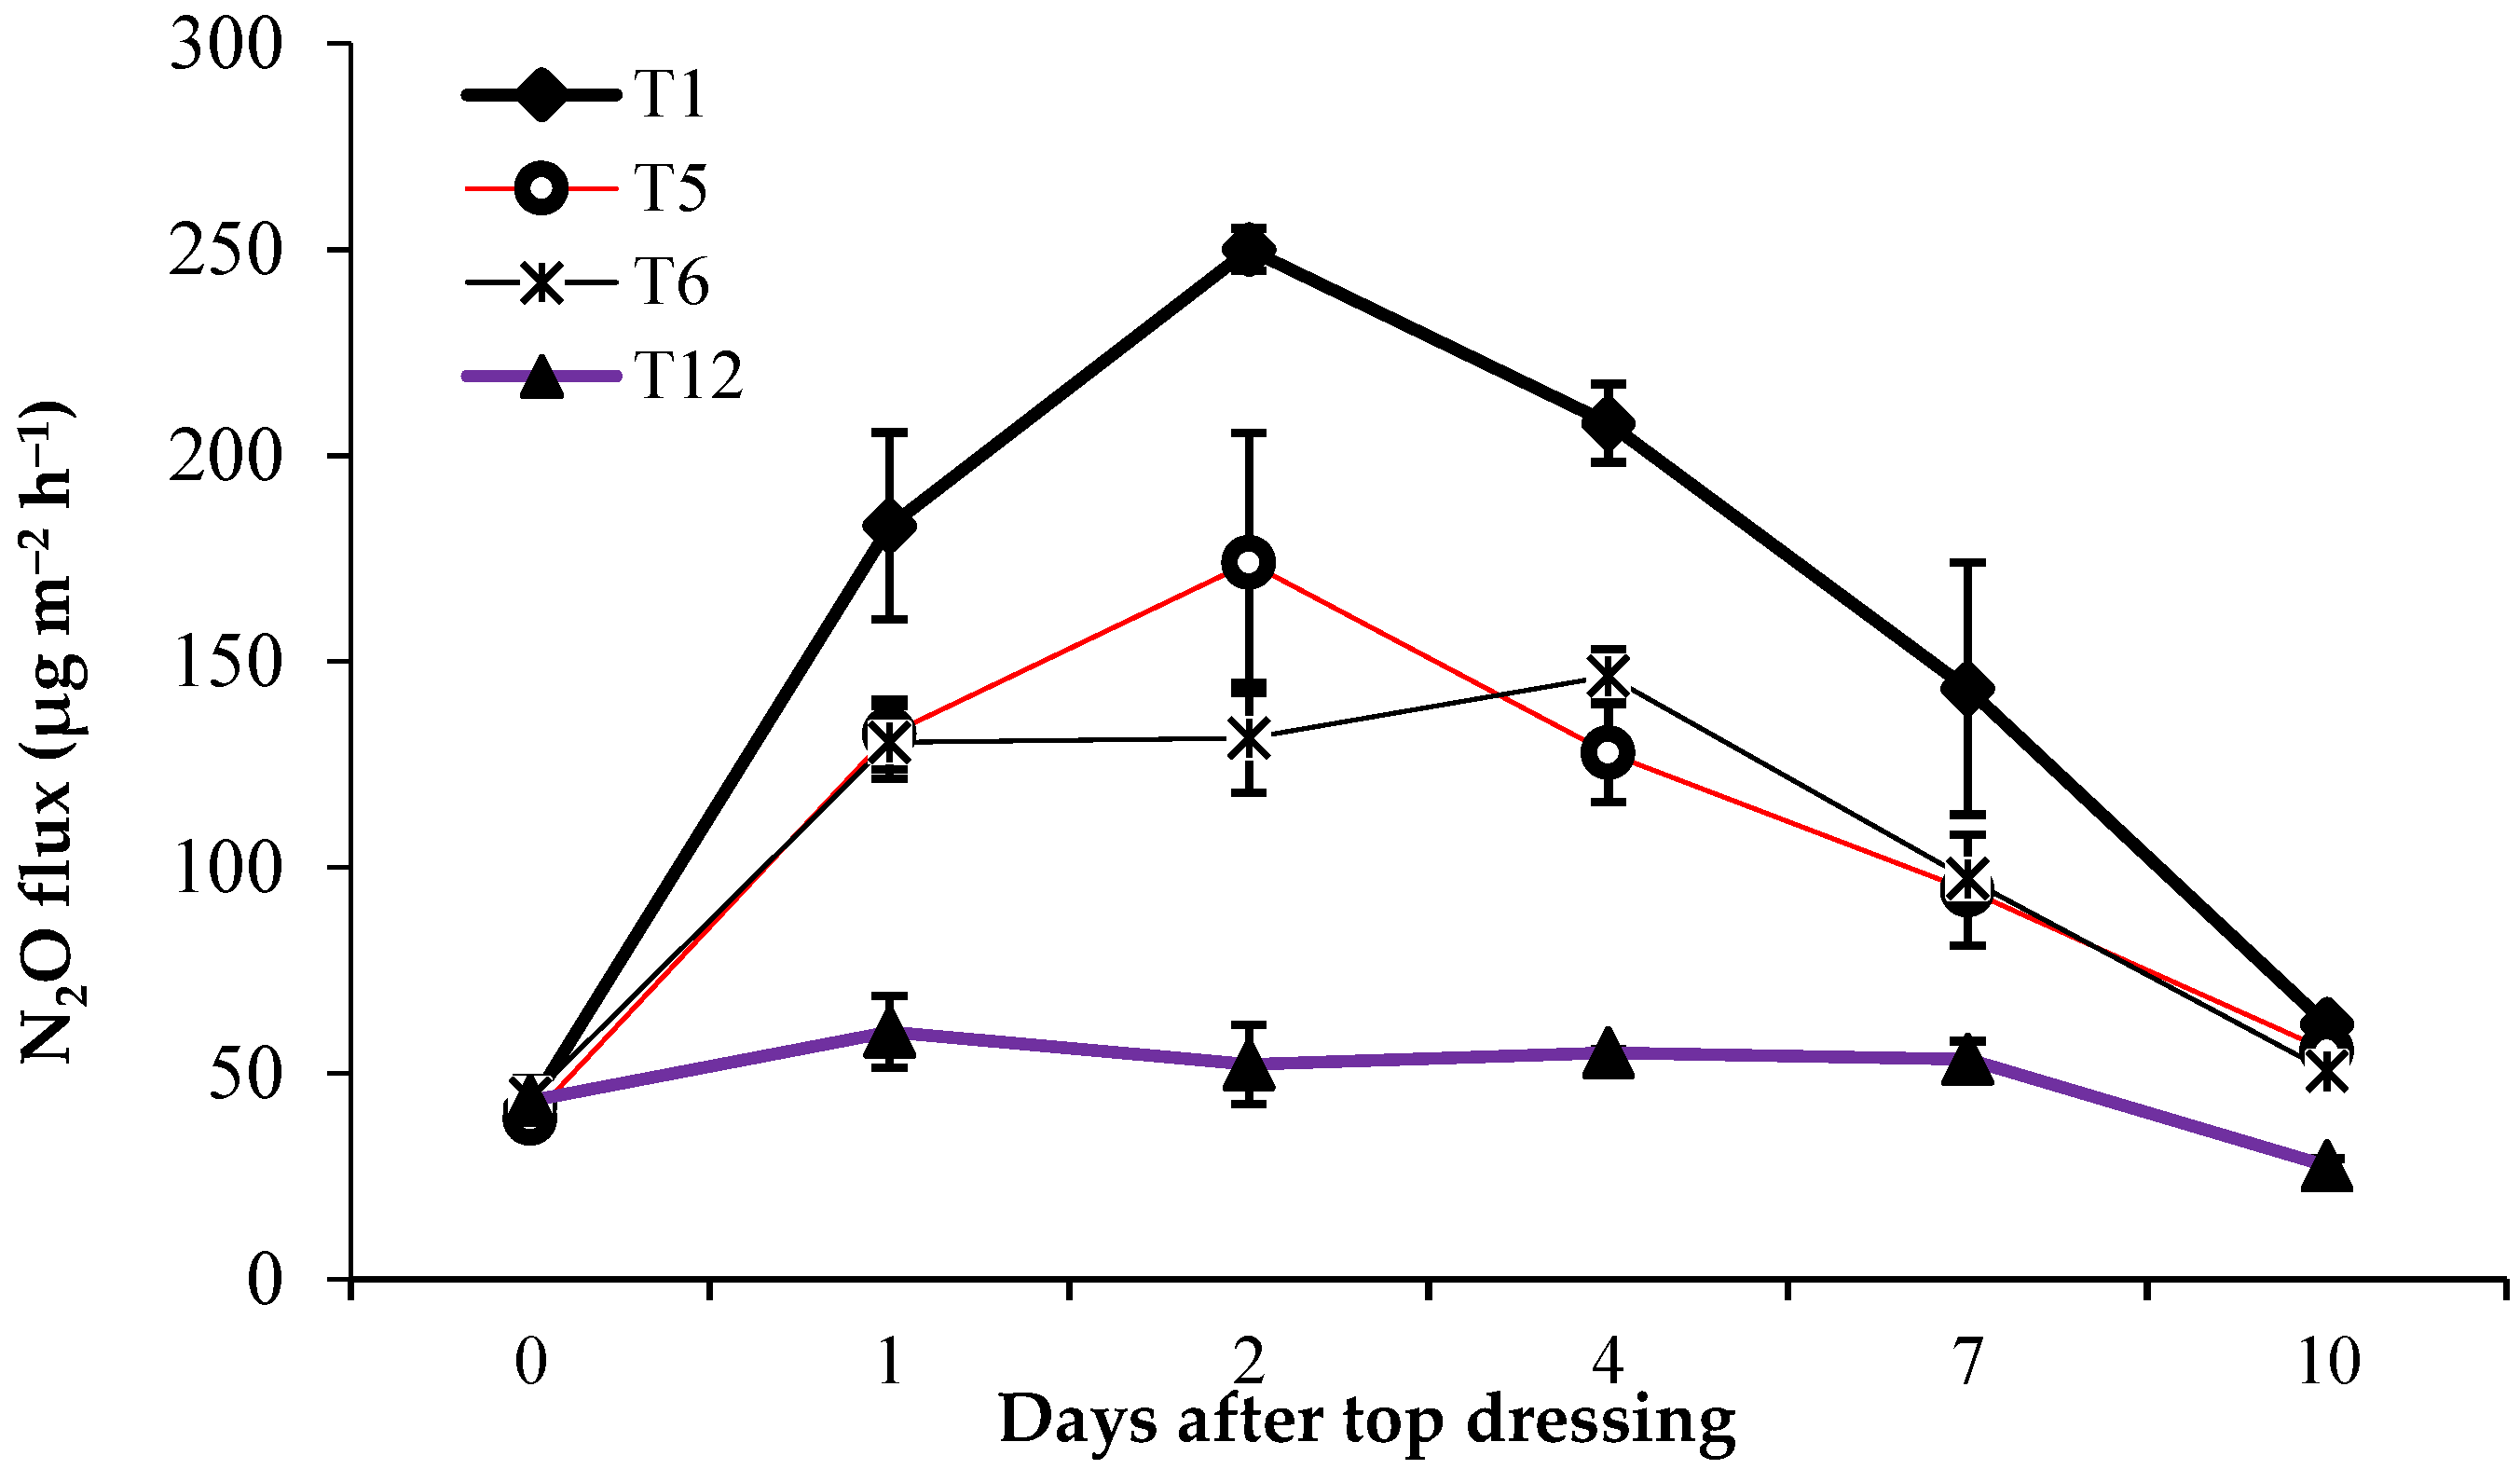
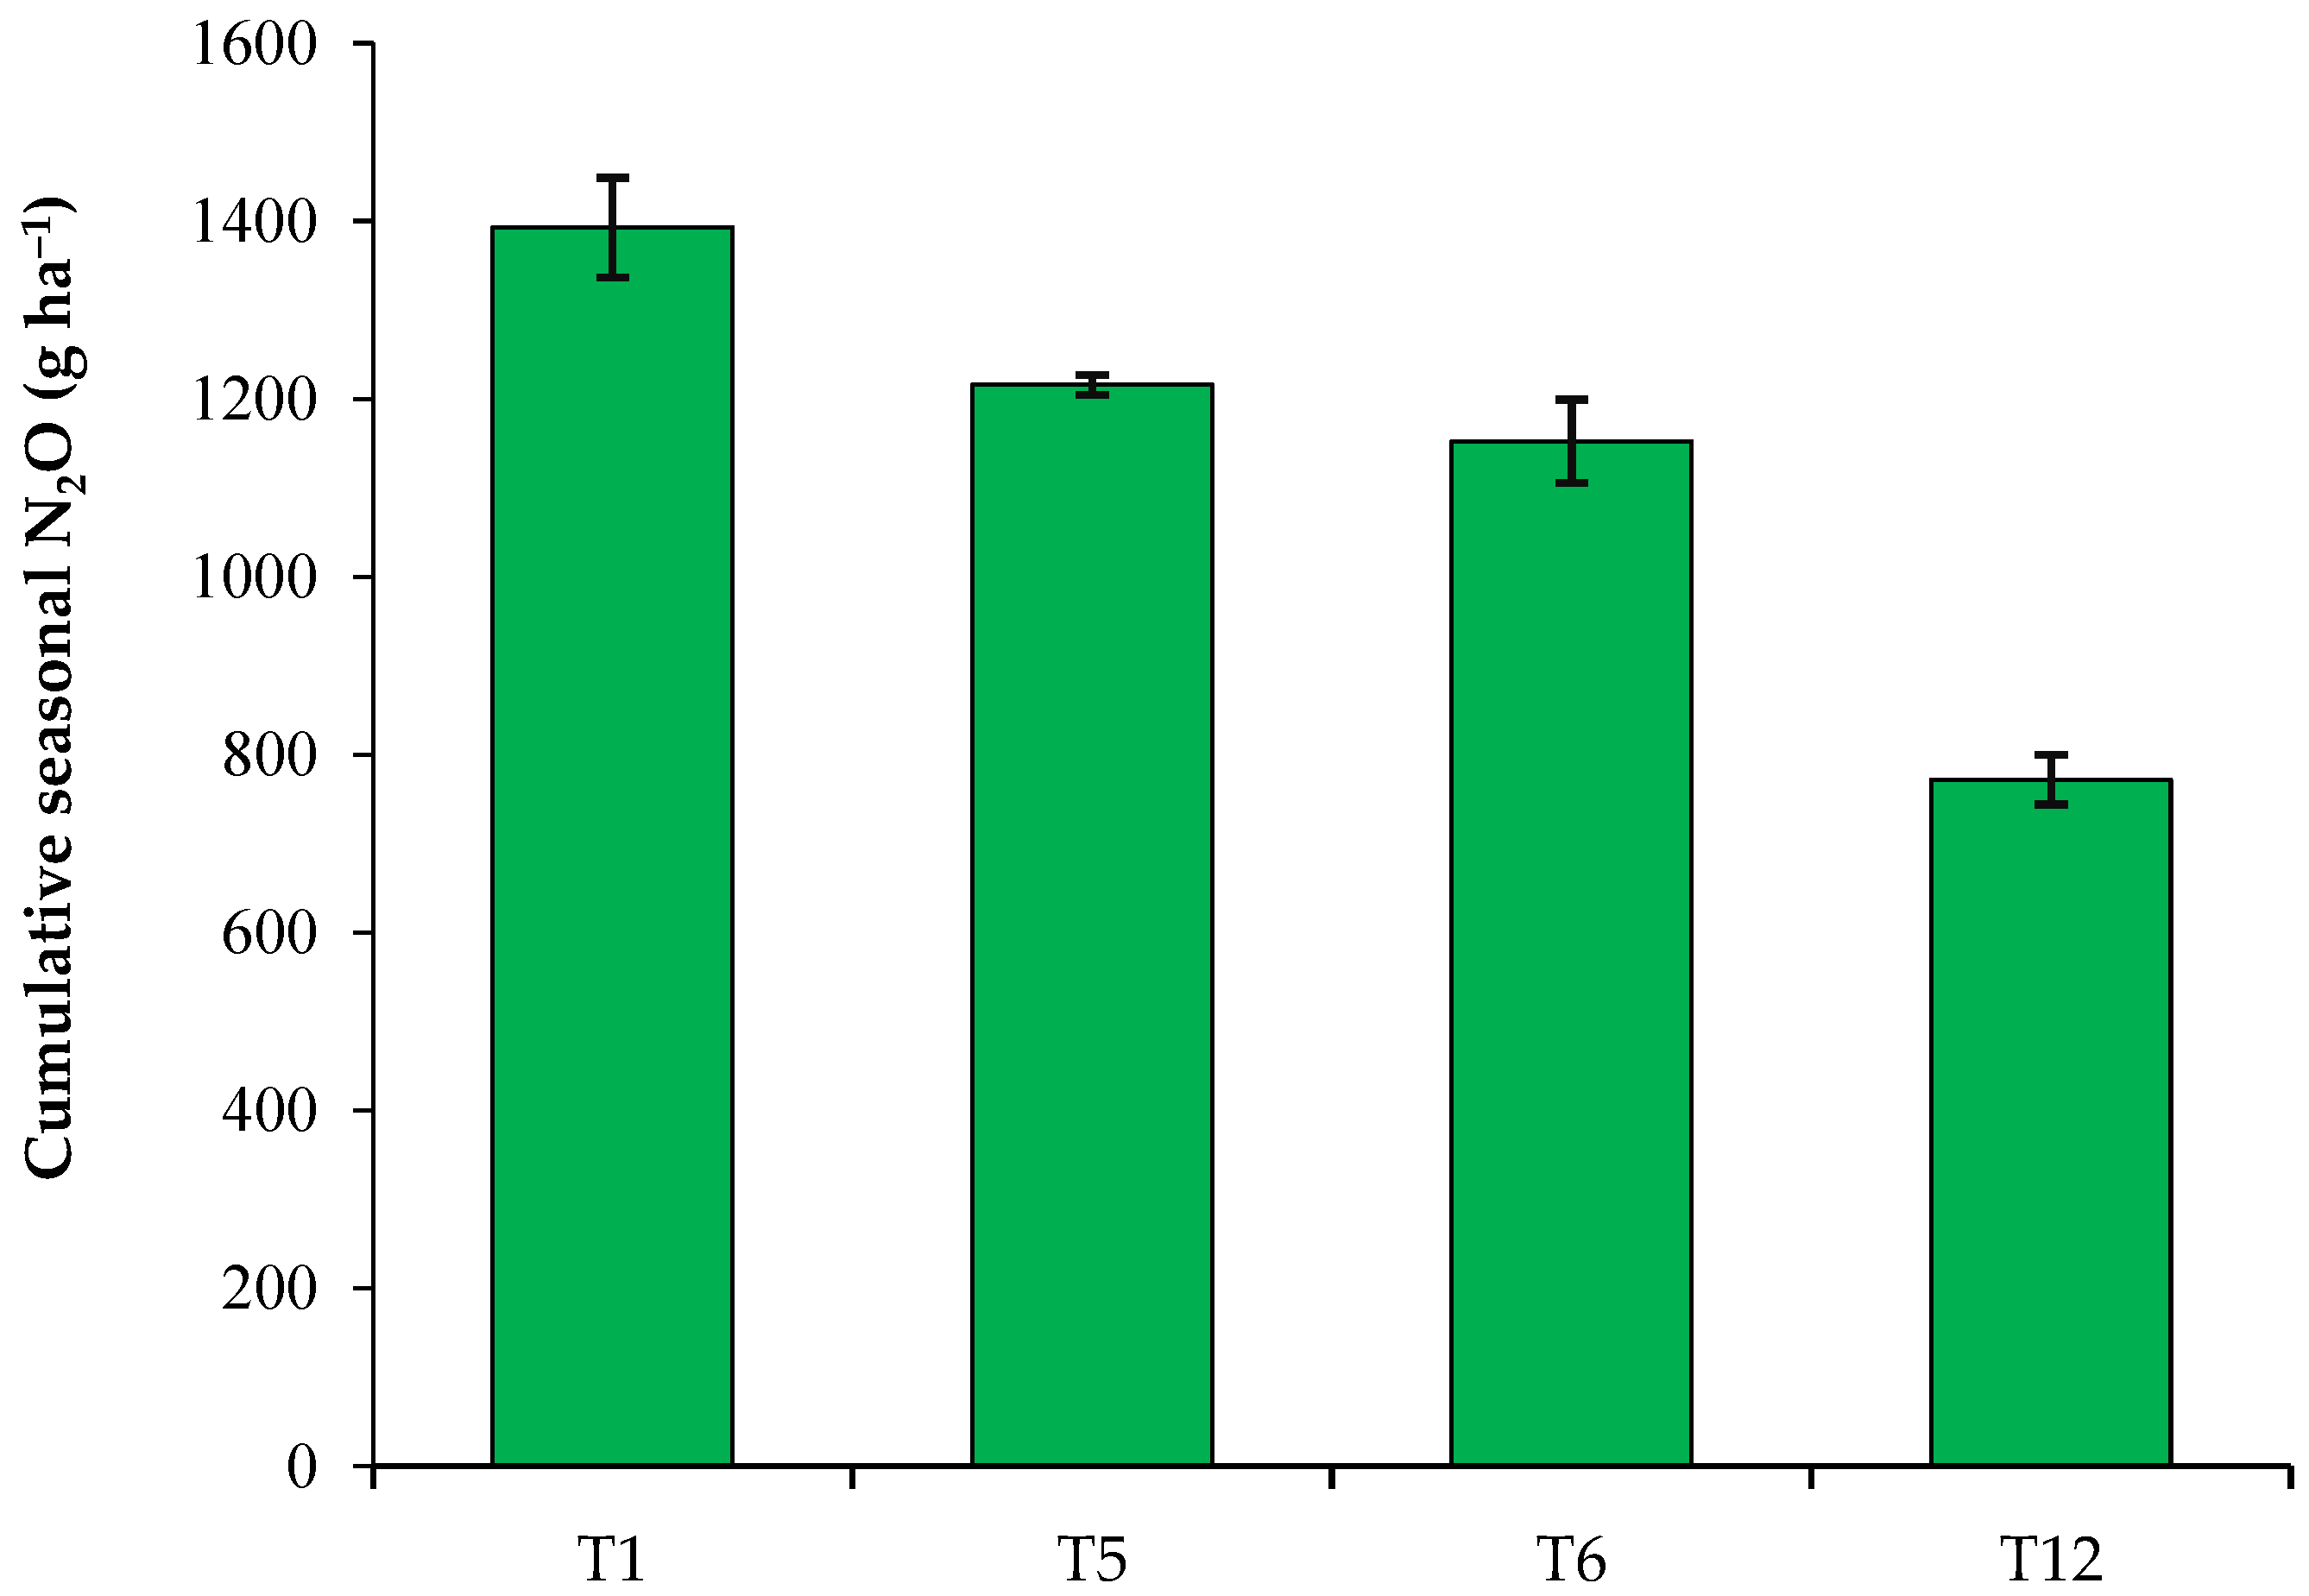
3.5. Different PNM influenced the Nitrous Oxide (N2O) Emission in DSR

PNM strategies drastically decreased the estimated N2O emissions per hectare from DSR fields. In the experimental year, nutrient management in a precise manner directly influenced the reduction of GHGs emissions. Here, it was evident that the NE-based N (+LCC) PK management drastically minimized the N2O emission more than the other treatments. It was observed from Figure 4 and Figure 5 that the site-specific nitrogen management also reduced the emission of N2O from the direct seeded rice field.
In the omission plot technique of STB-based N0PK application, the lowest cumulative seasonal N2O emission (771.832 g ha−1) and N2O flux (~50 µg m−2 h−1) were found owing to zero application of nitrogenous fertilizer in that treatment. Moreover, emission of cumulative seasonal N2O (1392.56 gha−1) and N2O flux (~150 µg m−2 h−1) were highest in STB-based NPK application treatment due to higher application of N-fertilizer in the field as compared to other treatments. The highest carbon footprint and the % increase of N2O-N were reported in the STB-based nutrient application due to the enhanced application of N fertilizer.

3.6. Year-Specific Different PNMs Influenced the Profitability of DSR

The information in Table 4, Table 9 and Table S1 clearly showed that the net return, Benefit: Cost ratio, increased significantly (p ≤ 0.05) by performing the fertilizer application precisely, that is, by STB NPK and NE-based fertilizer applications during two consecutive years of research. However, the highest net return [$1401 ha−1] and B-C ratio [2.59] were recorded significantly (p ≤ 0.05) in STB-based NPK application treatment which was quantitatively at par with NE (+LCC) based NPK application [NR $1295.8 ha−1 & BCR 2.51] treatment.

4. Discussion

4.1. Crop Productivity

Over two years, conservation agriculture (direct seeding of rice) combined with a site-specific smart nutrient management strategy significantly increased the seed and biomass yield of DSR. Higher seed and biomass yield of DSR in the soil test-based NPK recommendation for two consecutive years, owing to increased nutrient uptake and assimilation, which ultimately increased yield under ZT-based farming practices following site-specific nutrient management. Field-specific nutrient management, particularly with N, P, and K, increased rice grain yield by 12% in India’s Northwestern Indo-Gangetic plain [25].
DSR yield may be higher due to better root proliferation, nutrient uptake at the seedling stage, and no root injury compared to transplanted rice. However, there was no marked variation in yield between ZT, and conventional tillage practices from the same region [26], whereas higher yield advancements in cereal (wheat) were reported under no-tillage conventions [13]. Rice grain yields (9.5 t ha−1) were also highest in the SSNM treatment, followed by the Improved Blanket State Recommendation (IBSR), and lowest in the Farmer Fertilizer Practices under rice-potato system, according to another study [27].

4.2. Efficiency of Nutrient Use

Higher NUE in terms of PFP and AE of applied NPK was found in PNM (NE-NPK and STB-based NPK) under ZT practices, owing to efficient moisture conservation in ZT, which resulted in higher crop nutrient uptake. The ZT system retains previous crop residue on the soil surface, which reduces evaporative losses of soil water, thus conserving moisture, and allows for a higher rate of nutrient uptake and better nutrient assimilation by the crop [28]. The STB-based and NE-based nutrient/fertilizer scheduling recommendations optimized application rate and timing to match the peak nutrient demands of the crops, resulting in efficient nutrient acquisition and reduced nutrient losses. Balanced fertilization increases yields and nutrient efficiency (PFP and AE). Farmers are typically inclined to apply more N fertilizer and either skip or use sub-optimal doses of P and K in rice production, resulting in imbalanced fertility management and lower use-efficiencies of other nutrients applied [12]. Optimum P fertilizer application helps in early root development, facilitating better nutrient uptake.
Similarly, K helps plants withstand biotic and abiotic stresses, maintains optimal water balance, and enables better assimilate translocation, leading to higher crop yields and better nutrient recovery [29]. The study’s findings showed that when nitrogen was given with phosphorus and potash combinedly, particularly P, the PFP and AE of NPK applied increased significantly with NE-based applications and STB treatments, indicating the importance of optimal P fertilizer application. The PFP of NE-based NPK was more stable for rice. The PFP of nutrients improved with increasing crop yield, implying the favorable chances of upward PFP with the advancement of crop yield, as well as the sustainability and feasibility of RWCS and MWCS in terms of N, P, and K, use efficiencies [30]. Pooniya et al. [19] reported higher AE of applied N, P, and K with precision nutrient management (i.e., NE-based SSNM). Balanced nutrition facilitated by NE-based SSNM resulted in higher rice grain yield with better nutrient recovery, resulting in higher NPK efficiency [19]. Sapkota et al. [12] discovered that NE-based SSNM had higher PFP of applied N and P than other recommended fertilizer application methods.

4.3. Water Use Efficiency

DSR had been compared to TPR in many countries with differential results concerning water saving [27] and environmental pollution. The first study assessed the TWP, IWP & CWUE with the Penman-Monteith equation in precision nutrient management of the DSR- ZT wheat system. The results suggested that DSR had the potential to utilize less water for higher production. The STB-based NPK and NE-based NPK produced higher grain yield, leading to higher total and irrigation water productivity. Application of nutrients like N, P, and K and other micronutrients such as Fe increased the grain yield of the crop (like rice), substantially increasing crop water productivity [31]. The increased water productivity of DSR could be attributed to the healthy roots of rice seedlings efficiently utilizing conserved soil moisture at the initial stages as compared to TPR. Besides, applying P precisely led to strong root development, which helped to easily uptake water, and K assisted in optimum transpiration and translocation of photosynthates inside the plant system. Similarly, water saving is higher in aerobic rice (AR), which is 36% higher than in conventional rice [32].

4.4. Nitrous Oxide (N2O) Emission in DSR Is Influenced by Different PNMs

The conservation agriculture-based cropping system like ZT-DSR led to a marked reduction in greenhouse gas emissions (such as N2O). The adoption of DSR by paradigm shifting from conventional tillage led to a significant decrease in the carbon footprint of RWCS [33]. The direct N2O emission from the soil was 25–29% under conservation agriculture-based RWCS [34]. Similarly, SSNM had a marked influence on the estimated nitrous oxide (N2O) emission during both years of the experiment, as suggested by our study. The N2O-N emission from the RWCS was maximum in the urea fertilized plot (1570 g ha−1) and minimum in the unfertilized plot (654 g ha−1) [35]. However, the estimated N2O emission was found to be lowest with the precision nutrient management like NE 33:33:33 (N) based management practices mainly because of a more significant proportion of broadcasted application of nitrogenous fertilizer under innovative nitrogen management strategies [12]. The lowest emission (Figure 4) of nitrous oxide (N2O) coupled with the lowest yield achieved under the STB N0PK treatment confirmed the poor utilization of nitrogen fertilizer and reduced nitrogen uptake by the DSR during the two consecutive years of the experiment.

4.5. Profitability of DSR Is Influenced by Different PNMs

The saving of labor and water costs is the major impediment to the widespread adoption of DSR in Southeast Asia’s NWIGP [27]. Similarly, higher net return and profitability under ZT-Wheat CS are mainly owing to lower production cost as a non-requirement of preparatory tillage combined with higher gross return in conservation agriculture as compared to conventional tillage [12]. The STB-based NPK application treatment yielded the maximum NR and B:C ratio due to the highest yield achieved under the said treatment, followed by NE NPK treatment owing to better utilization of NPK fertilizer and efficient nutrient uptake by the grain and straw as well, whereas the lowest NR& B-C ratio was found in STB N0PK treatment. NE-based management strategies (i.e., NE: Green Seeker; NE 80:20 and NE 33:33:33 based N) yielded significantly higher net return due to efficient utilization of nutrients as inputs than the farmers’ fertilizer practices (FFP) under both ZT and CT systems [12,36].

5. Conclusions

Based on the findings of two years of research, it is possible to conclude that the seed and biomass yields, NR, and B-C ratio of DSR were markedly higher in the STB-based NPK and NE-based nutrient management treatments than the other treatments. The NUE in intelligent nutrient management was significantly higher than others. However, N2O emissions from the paddy field were higher in STB-based NPK and RDF applications, comparatively low in NE-NPK treatment with no N application emitting the least. The IWP, TWP, and CWUE of DSR were higher in STB-based NPK recommendation during both the year of the experiment due to higher grain yield obtained in that treatment. These findings with DSR may be helpful in the future adoption of PNM strategies in the IGP of South East Asia under conservation agriculture and in areas with similar agroecology.

Supplementary Materials

The following supporting information can be downloaded at: https://www.mdpi.com/article/10.3390/agriculture13040784/s1, Table S1: ANOVA of Grain yield, Total biomass yield, NR and BC ratio (Factorial RCBD); Table S2: ANOVA Table of PFP and AE of N, P, and K; Table S3: ANOVA of IWP, TWP, and CWUE.

Author Contributions

Conceptualization: R.S., D.K., S.S. (Suman Sen), S.S. (Seema Sepat), A.G. (Avijit Ghosh), Y.S.S., M.C.M., A.A., R.K., L.D.S., K.P. and V.P.; methodology: R.S., D.K., S.S. (Suman Sen), S.S. (Seema Sepat), A.G. (Avijit Ghosh), Y.S.S., M.C.M., A.A., R.K., L.D.S., K.P. and V.P.; formal analysis: R.S., A.M.A., A.G.(Ahmed Gaber) and A.H.; data curation: R.S., A.M.A., A.G.(Ahmed Gaber) and A.H.; statistical expertise: A.M.A., A.G.(Ahmed Gaber) and A.H.; writing—original draft preparation: R.S., D.K., S.S. (Suman Sen), S.S. (Seema Sepat), A.G. (Avijit Ghosh), Y.S.S., M.C.M., A.A., R.K., L.D.S., K.P. and V.P.; writing—review and editing: A.M.A., A.G. (Ahmed Gaber) and A.H.; visualization: R.S., D.K., S.S. (Suman Sen), S.S. (Seema Sepat), A.G. (Avijit Ghosh), Y.S.S., M.C.M., A.A., R.K., L.D.S., K.P. and V.P.; supervision: D.K. and S.S. (Suman Sen); funding acquisition: A.M.A., A.G. (Ahmed Gaber) and A.H. All authors have read and agreed to the published version of the manuscript.

Funding

This research was funded by ICAR-Indian Agricultural Research Institute, New Delhi-110012, India. This research was also partially funded by Princess Nourah bint Abdulrahman University Researchers Supporting Project number (PNURSP2023R65), Princess Nourah bint Abdulrahman University, Riyadh, Saudi Arabia.

Institutional Review Board Statement

Not applicable.

Data Availability Statement

Data recorded in the current study are available in all Tables and Figures of the manuscript.

Acknowledgments

All the authors duly acknowledge the research farm, ICAR-Indian Agricultural Research Institute, New Delhi-110012. The Authors would also like to sincerely thank Princess Nourah bint Abdulrahman University Researchers Supporting Project number (PNURSP2023R65), Princess Nourah bint Abdulrahman University, Riyadh, Saudi Arabia, for supporting the current research.

Conflicts of Interest

The authors declare no conflict of interest.

References

  1. Agricultural Statistics at a Glance; Directorate of Economics & Statistics, Department of Agriculture, Co-operation and Farmers Welfare, Ministry of Agriculture & Farmers Welfare, Govt. of India: New Delhi, India, 2022; pp. 409–419.
  2. FAOSTAT. United Nations Food and Agricultural Organisation [WWW Document]. Available online: http://www.fao.org/faostat/en/#data (accessed on 14 February 2023).
  3. FAOSTAT. Available online: http://www.fao.org/faostat/en/#data/QC (accessed on 14 February 2023).
  4. Valera, H.; Balié, J. The Outlook of the Rice Economy; International Rice Research Institute (IRRI): Los Banos, Philippines, 2020. [Google Scholar]
  5. FAI. Fertilizer Statistics, 6th ed.; The Fertilizer Association of India: New Delhi, India, 2018. [Google Scholar]
  6. Sharma, S.K. Characterization and Mapping of Rice–Wheat System: Its Changes and Constraints to System Sustainability; Final Report for National Agricultural Technology Project, Irrigated Agro-Ecosystem Production Systems Research (PSR 4.1); Project Directorate for Cropping Systems Res.: Meerut, India, 2003. [Google Scholar]
  7. Wang, W.; Lu, J.; Ren, T.; Li, X.; Su, W.; Lu, M. Evaluating regional mean optimal nitrogen rates in combination with indigenous nitrogen supply for rice production. Field Crops Res. 2012, 137, 37–48. [Google Scholar] [CrossRef]
  8. Qin, J.Q.; Impa, S.M.; Tang, Q.Y.; Yang, S.H.; Yang, J.; Tao, Y.S.; Jagadish, K.S.V. Integrated nutrient, water and other agronomic options to enhance rice grain yield and N use efficiency in double-season rice crop. Field Crops Res. 2012, 148, 15–23. [Google Scholar] [CrossRef]
  9. Liu, H.; Wang, Z.H.; Yu, R.; Li, F.C.; Li, K.Y.; Cao, H.B.; Yang, N.; Li, M.H.; Dai, J.; Zan, Y.L.; et al. Optimal nitrogen input for higher efficiency and lower environmental impacts of winter wheat production in China. Agric. Ecosyst. Environ. 2016, 224, 1–11. [Google Scholar] [CrossRef]
  10. Majumdar, K.; Satyanarayana, T.; Pampolino, M.; Dutta, S.; Jat, M.L.; Sulewski, G.; Johnston, A.M. Nutrient Expert for Hybrid Maize (Version 1.1). A Decision Support Tool for Providing Field Specific Fertilizer Recommendations for Tropical Hybrid Maize; International Plant Nutrition Institute: Gurgaon, India, 2013. [Google Scholar]
  11. Singh, V.K.; Dwivedi, B.S.; Sukla, A.K.; Chauhan, Y.S.; Yadav, R.L. Diversification of rice with pigeon pea in a rice-wheat cropping system on a Typic Ustochrept: Effect on soil fertility, yield and nutrient use efficiency. Field Crops Res. 2005, 92, 85–105. [Google Scholar] [CrossRef] [Green Version]
  12. Sapkota, T.B.; Majumdar, K.; Jat, M.L.; Kumar, A.; Bishnoi, D.K.; McDonald, A.J.; Pampolino, M. Precision nutrient management in conservation agriculture based wheat production of Northwest India: Profitability, nutrient use efficiency and environmental footprint. Field Crops Res. 2014, 155, 233–244. [Google Scholar] [CrossRef]
  13. Saharawat, Y.S.; Singh, B.; Malik, R.K.; Ladha, J.K.; Gathala, M.; Jat, M.L.; Kumar, V. Evaluation of alternative tillage and crop establishment methods in a rice-wheat rotation in North Western IGP. Field Crops Res. 2010, 116, 260–267. [Google Scholar] [CrossRef]
  14. Kakumanu, K.R.; Kotapati, G.R.; Nagothu, U.S.; Kuppanan, P.; Kallam, S.R. Adaptation to climate change and variability: A case of direct-seeded rice in Andra Pradesh, India. J. Water Clim. Chang. 2019, 10, 419–430. [Google Scholar] [CrossRef] [Green Version]
  15. Kaur, J.; Singh, A. Direct seeded rice: Prospects, problems/constraints and researchable issues in India. Curr. Agric. Res. J. 2017, 5, 13–17. [Google Scholar] [CrossRef]
  16. Das, D.K.; Maiti, D.; Pathak, H. Site-specific nutrient management in rice in Eastern India using a modeling approach. Nutr. Cycl. Agroecosyst. 2017, 83, 85–94. [Google Scholar] [CrossRef]
  17. Xu, X.P.; He, P.; Zhao, S.C.; Qiu, S.J.; Johnston, A.M.; Zhou, W. Quantification of yield gap and nutrient use efficiency of irrigated rice in China. Field Crops Res. 2016, 186, 58–65. [Google Scholar] [CrossRef]
  18. Chen, Y.T.; Peng, J.; Wang, J.; Fu, P.H.; Hou, Y.; Zhang, C.D.; Fahad, S.; Peng, S.B.; Cui, K.H.; Nie, L.X.; et al. Crop management based on multi-split top dressing enhances grain yield and nitrogen use efficiency in irrigated rice in China. Field Crops Res. 2015, 184, 50–57. [Google Scholar] [CrossRef]
  19. Pooniya, V.; Jat, S.L.; Choudhary, A.K.; Singh, A.K.; Parihar, C.M.; Bana, R.S.; Rana, K.S. Nutrient Expert assisted site-specific-nutrient-management: An alternative precision fertilization technology for maize-wheat cropping system in South-Asian Indo-Gangetic Plains. Indian J. Agric. Sci. 2015, 85, 996–1002. [Google Scholar]
  20. Pampolino, M.F.; Witt, C.; Pasuquin, J.M.; Johnston, A.; Fisher, M.J. Development approach and evaluation of the Nutrient Expert software for nutrient management in cereal crops. Comput. Electron. Agric. 2012, 88, 103–110. [Google Scholar] [CrossRef]
  21. Dobermann, A. Nutrient use efficiency measurement and management. In Fertilizer Best Management Practices. General Principles, Strategy for their Adoption and Voluntary Initiatives vs. Regulations; Drauss, A., Ed.; IFA: Paris, France, 2007. [Google Scholar]
  22. Dastane, N.G. Effective Rainfall in Irrigated Agriculture; FAO Irrigation and Drainage Paper No. 25; FAO: Rome, Italy, 1974. [Google Scholar]
  23. Allen, R.; Pereira, L.A.; Raes, D.; Smith, M. Crop Evapotranspiration; FAO Irrigation and Drainage Paper No. 56; FAO: Rome, Italy, 1998. [Google Scholar]
  24. Debnath, G.; Jain, M.C.; Kumar, S.; Sarkar, K.; Sinha, S.K. Methane emissions from rice fields amended with biogas slurry and farm yard manure. Clim. Chang. 1996, 33, 97–109. [Google Scholar] [CrossRef]
  25. Khurana, H.S.; Bijay-Singh, A.D.; Phillips, S.B.; Sidhu, A.S. Site-specific nutrient management performance in a rice-wheat cropping system. Better Crops 2008, 92, 26–28. [Google Scholar]
  26. Chhokar, R.S.; Sharma, R.K.; Jat, G.R.; Pundir, A.K.; Gathala, M.K. Effect of tillage and herbicides on weeds and productivity of wheat under rice-wheat growing system. Crop Prot. 2007, 26, 1689–1696. [Google Scholar] [CrossRef]
  27. Panneerselvam, P.; Kumar, V.; Banik, N.C.; Kumar, V.; Parida, N.; Wasim, I.; Das, A.; Pattnaik, S.; Roul, P.K.; Sarangi, D.R.; et al. Transforming labor requirement, crop yield, and profitability with precision dry-direct seeding of rice and integrated weed management in Eastern India. Field Crops Res. 2020, 259, 107961. [Google Scholar] [CrossRef]
  28. Sapkota, T.B. Conservation Tillage Impact on Soil Aggregation, Organic Matter Turnover and Biodiversity. In Organic Fertilisation, Soil Quality and Human Health. Sustainable Agriculture Reviews; Lichtfouse, E., Ed.; Springer: Dordrecht, The Netherlands, 2012; Volume 9. [Google Scholar] [CrossRef]
  29. Van Duivenbooden, N.; Witt, C.T.; Van Keulen, H. Nitrogen, phosphorus and potassium relations in five major cereals reviewed in respect to fertilizer recommendations using simulation modeling. Fert. Res. 1996, 44, 37–49. [Google Scholar] [CrossRef]
  30. Timsina, J.; Dutta, S.; Devkota, K.P.; Chakraborty, S.; Neupane, R.K.; Bishta, S.; Amgain, L.P.; Singh, V.K.; Islam, S.; Majumdar, K. Improved nutrient management in cereals using Nutrient Expert and machine learning tools: Productivity, profitability and nutrient use efficiency. Agric. Syst. 2021, 192, 103181. [Google Scholar] [CrossRef]
  31. Dass, A.; Chandra, S. Irrigation, spacing and cultivar effects on net photosynthetic rate, dry matter partitioning and productivity of rice under system of rice intensification in Mollisols of Northern India. Exp. Agric. 2021, 49, 504–523. [Google Scholar] [CrossRef]
  32. Saha, S.; Singh, Y.V.; Gaind, S.; Kumar, D. Water productivity and nutrient status of rice soil in response to cultivation techniques and nitrogen fertilization. Paddy Water Environ. 2015, 13, 443–453. [Google Scholar] [CrossRef]
  33. Singh, P.; Singh, G.; Sodhi, G.P.S. Energy auditing and optimization approach for improving energy efficiency of rice cultivation in south-western Punjab, India. Energy 2019, 174, 269–279. [Google Scholar] [CrossRef]
  34. Ghosh, S.; Das, T.K.; Rana, K.S.; Biswas, D.R.; Das, D.K.; Singh, G.; Bhattacharyya, R.; Datta, D.; Rathi, N.; Bhatia, A. Energy budgeting and carbon footprint of contrasting tillage and residue management scenarios in rice-wheat cropping system. Soil Tillage Res. 2022, 223, 105445. [Google Scholar] [CrossRef]
  35. Pathak, H.; Bhatia, A.; Prasad, S.; Singh, S.; Kumar, S.; Jain, M.C.; Kumar, U. Emission of Nitrous Oxide from Rice-Wheat systems of Indo-Gangetic plains of India. Environ. Monit. Assess. 2001, 77, 163–178. [Google Scholar] [CrossRef]
  36. Qureshi, A.; Singh, D.K.; Pandey, P.C.; Singh, V.P.; Raverkar, K.P. Site specific nutrient management approaches for enhancing productivity and profitability in rice and wheat under rice -wheat cropping system. Int. J. Agric. Sci. 2016, 8, 2838–2842. [Google Scholar]
Figure 1. (a) Indian zones and cities including IGP-India; (b) Zones and cities-wise population density in India.
Agriculture 13 00784 g001
Figure 2. Estimation of N2O from the soil-plant system by closed chamber technique.
Agriculture 13 00784 g002
Figure 3. ET0 (mm/day) during the crop growth stages in both years.
Agriculture 13 00784 g003
Figure 4. The mean N2O flux (µg m−2h−1) and Days after top dressing (DATD) [over 2 years] are influenced by various treatments. [T1 = STB-based NPK application; T5 = RDF (120-60-40 NPK/ha); T6= Nutrient Expert based (LCC) NPK & T12 = STB-based N0PK application]. Each bar for treatment shows the standard error of the mean (SEm±), which was calculated for each treatment for three replications.
Agriculture 13 00784 g004
Figure 5. Cumulative seasonal mean N2O (g ha−1) emission over various treatments [over 2 years]. [Where T1 = STB-based NPK application; T5 = RDF (120-60-40 NPK/ha); T6 = Nutrient Expert based (LCC) NPK & T12 = STB-based N0PK application]. Each bar for treatment shows the standard error of the mean (SEm±), which was calculated for each treatment for three replications.
Agriculture 13 00784 g005
Table 1. The prevailing cropping history of the experimental plot.
YearKharifRabi
2014–2015RiceWheat
2015–2016RiceWheat
2016–2017DSRZT-Wheat
2017–2018DSRZT-Wheat
2018–2019DSRZT-Wheat
2019–2020DSRZT-Wheat
Table 2. Previous history of soil in the research trial site.
Soil PropertiesValues
Soil textureSandy clay loam
Sand (%)53.3
Silt (%)21.2
Clay (%)25.5
pH (1:2.5 soil:water)7.3
Organic carbon (%)0.55
Available N (kg ha–1)160
Available P (kg ha–1)20
Available K (kg ha–1)265
Table 3. The fertilizer elements used (kg ha−1) in various treatments during the observation in both years.
Treatment20182019
NP2O5K2ONP2O5K2O
STB NPK171–17567–7060–65167–17260–6555–60
RDF (120-60-40 kg ha–1)12060401206040
NE (target yield = 5 tha–1) NPK(LCC for N)112.5–1203550120–12535–4050
STB N0PK-67–7060–65-60–6555–60
STB NP0K171–175-60–65167–172-55–60
STB NPK0171–17567–70-167–17260–65-
SR N0PK-5040-5040
SR NP0K110-40110-40
SR NPK011050-11050-
NE N0PK-3550-3550
NE NP0K112.5–120-50112.5–120-50
NE NPK0112.5–12035-112.5–12035-
STB: Soil-test-based recommendation; SR: state recommendation; RDF: Dose of fertilizer at the recommended rate; NE: nutrient expert based.
Table 4. Significance of the effect of years and treatments as well as their interaction on the grain yield, total biomass yield, net return, BC ratio, PFP, AE, IWP, TWP, and CWUE of DSR.
Source of VariationDegree of FreedomGrain YieldTotal Biomass YieldNet Return ($)BC RatioPFPAEIWPTWPCWUE
Replications2NSNSNSNSNSNSNSNSNS
Treatments23SSSSSSSSS
Year1SNSNSSSSSNSNS
Treatment11SSSSSSSSS
Year × Treatment11NSNSNSNSNSNSNSNSNS
Error71
S, Significant at 5% level; NS, Non-Significant; BC, Benefit-cost; PFP, Partial Factor productivity; AE, Agronomic Efficiency; IWP, Irrigation Water Productivity; TWP, Total Water Productivity, and CWUE, Crop Water Use Efficiency.
Table 5. Grain and total biomass yield of DSR rice as influenced by year-specific different plant nutrient management (PNM).
FactorsGrain Yield
(t ha−1)
Total Biomass Yield
(t ha−1)
Year
20183.54 a10.14
20193.34 a10.28
LSD (p ≥ 0.05)0.23NS
Treatment
STB NPK4.37 a13.65 a
SR N0PK3.12 c9.43 de
SR NP0K3.20 c9.58 cde
SR NPK03.17 c9.53 cde
RDF (120-60-40)3.89 ab11.07 bc
NE (LCCN) NPK4.13 a12.45 ab
NE N0PK3.12 c9.40 de
NE NP0K3.32 bc9.25 de
NE NPK03.37 bc9.97 cde
STB NPK03.30 c10.23 cd
STB NP0K3.18 c9.33 de
STB N0PK3.14 c8.62 e
LSD (p ≥ 0.05)0.581.59
Year × Treatment
LSD (p ≥ 0.05)NSNS
STB: Soil-test-based recommendation; SR: state recommendation; RDF: Dose of fertilizer at the recommended rate; NE: nutrient expert based. LSD, the least significant difference at a 5% level of probability. Means in the same column within the same year with different letters are significantly different at the 5% level by LSD.
Table 6. Partial factor productivity (PFP; kg grain kg–1nutrient applied) of direct-seeded rice is influenced by year-specific PNM.
FactorsPFPNPFPPPFPK
Year
201821.13 a55.87 a54.82 a
201919.52 b53.14 a52.78 a
LSD (p ≥ 0.05)1.724.453.37
Treatment
STB NPK25.53 c64.68 c73.06 cd
SR N0PK-62.33 c77.92 bc
SR NP0K29.10 b-80.03 bc
SR NPK028.81 bc63.38 c-
RDF (120-60-40)32.45 ab64.89 c97.33 a
NE (LCCN) NPK36.73 a118.07 a82.65 b
NE N0PK-89.24 b62.47 e
NE NP0K26.58 c-66.45 de
NE NPK026.95 c96.24 b-
STB NPK019.21 d48.72 d-
STB NP0K18.55 d-53.16 f
STB N0PK-46.47 d52.49 f
LSD (p ≥ 0.05)4.2911.158.42
Year × Treatment
LSD (p ≥ 0.05)NSNSNS
STB: Soil-test-based recommendation; SR: state recommendation; RDF: Dose of fertilizer at the recommended rate; NE: nutrient expert based. LSD, the least significant difference at a 5% level of probability. PFPN, partial factor productivity of nitrogen; PFPP, partial factor productivity of phosphorus; PFPK, partial factor productivity of potassium. Means in the same column within the same year with different letters are significantly different at the 5% level by LSD.
Table 7. The agronomic efficiency (AE) of DSR is influenced by year-specific PNM.
FactorsAENAEPAEK
Year
20183.66 a7.08 a5.28 a
20192.53 a6.95 a8.06 a
LSD (p ≥ 0.05)1.344.0193.77
Treatment
STB NPK8.35 a17.37 ab16.67 a
SR N0PK-4.08 cd6.30 bcd
SR NP0K2.62 b-12.15 abc
SR NPK02.77 b9.08 bcd-
RDF (120-60-40)6.47 a11.94 bc16.39 a
NE (LCCN) NPK8.97 a23.50 a13.39 ab
NE N0PK-2.03 cd2.22 d
NE NP0K2.16 b-5.75 bcd
NE NPK02.85 b9.53 bcd-
STB NPK02.05 b5.05 cd-
STB NP0K0.87 b-3.84 cd
STB N0PK-1.60 d3.34 cd
LSD (p ≥ 0.05)3.2210.079.36
Year × Treatment
LSD (p ≥ 0.05)NSNSNS
STB: Soil-test-based recommendation; SR: state recommendation; RDF: Dose of fertilizer at the recommended rate; NE: nutrient expert based. LSD, the least significant difference at a 5% level of probability. Means in the same column within the same year with different letters are significantly different at the 5% level by LSD.
Table 8. Year-specific different PNM influenced the water productivity (kg m−3) in DSR.
FactorsIWP (kg m−3)TWP (kg m−3)CWUE (kg m−3)
Year
20180.79 a0.410.91
20190.66 b0.410.90
LSD (p ≥ 0.05)0.05NSNS
Treatment
STB NPK0.92 a0.52 a1.15 a
SR N0PK0.65 c0.37 c0.82 c
SR NP0K0.67 c0.38 c0.84 c
SR NPK00.67 c0.38 c0.83 c
RDF (120-60-40)0.82 a0.46 ab1.03 ab
NE (LCCN) NPK0.87 a0.49 a1.09 a
NE N0PK0.67 c0.37 c0.82 c
NE NP0K0.69 bc0.39 bc0.87 bc
NE NPK00.71 bc0.40 bc0.89 bc
STB NPK00.69 bc0.39 c0.87 c
STB NP0K0.67 c0.38 c0.84 c
STB N0PK0.66 c0.37 c0.83 c
LSD (p ≥ 0.05)0.1220.06920.122
Year × Treatment
LSD (p ≥ 0.05)NSNSNS
STB: Soil-test-based recommendation; SR: state recommendation; RDF: Dose of fertilizer at the recommended rate; NE: nutrient expert based. LSD, the least significant difference at a 5% level of probability. IWP, Irrigation Water Productivity; TWP, Total Water Productivity and CWUE, Crop Water Use Efficiency. Means in the same column within the same year with different letters are significantly different at the 5% level by LSD.
Table 9. Year-specific different PNMs influenced the profitability of DSR.
FactorsTotal Cost
($ ha–1)
Net Return
($ ha–1)
Benefit-Cost
Ratio
Year
2018530.79989.991.86 a
2019497.82972.561.95 a
LSD (p ≥ 0.05)-NS0.17
Treatment
STB NPK541.191401.30 a2.59 a
SR N0PK503.57853.30 d1.70 c
SR NP0K500.41892.40 d1.78 bc
SR NPK0512.52868.20 d1.69 c
RDF (120-60-40)526.181144.50 bc2.18 ab
NE (LCCN) NPK516.951295.80 ab2.51 a
NE N0PK499.54853.50 d1.72 c
NE NP0K504.75913.30 d1.81 bc
NE NPK0508.79952.20 cd1.87 bc
STB NPK0529.14918.70 d1.74 c
STB NP0K513.93862.90 d1.68 c
STB N0PK514.68819.10 d1.60 c
LSD (p ≥ 0.05)-9.360.42
Year × Treatment
LSD (p ≥ 0.05)NSNSNS
STB: Soil-test-based recommendation; SR: state recommendation; RDF: Dose of fertilizer at the recommended rate; NE: nutrient expert based. LSD, the least significant difference at a 5% level of probability. This means in the same column within the same year with different letters are significantly different at the 5% level by LSD.
Disclaimer/Publisher’s Note: The statements, opinions and data contained in all publications are solely those of the individual author(s) and contributor(s) and not of MDPI and/or the editor(s). MDPI and/or the editor(s) disclaim responsibility for any injury to people or property resulting from any ideas, methods, instructions or products referred to in the content.

