
Short-Term Biochar Impacts on Crop Performance and Soil Quality in Arid Sandy Loam Soil
by
 ,
,
Lindsay Keller
1,
Omololu John Idowu
2,*,
April Ulery
1,
Mohammed Omer
2 and
Catherine E. Brewer
3 1
Department of Plant and Environmental Sciences, New Mexico State University, P.O. Box 30003, Las Cruces, NM 88003, USA
2
Department of Extension Plant Sciences, New Mexico State University, P.O. Box 30003, Las Cruces, NM 88003, USA
3
Department of Chemical and Materials Engineering, New Mexico State University, P.O. Box 30001, Las Cruces, NM 88003, USA
*
Author to whom correspondence should be addressed.
Agriculture 2023, 13(4), 782; https://doi.org/10.3390/agriculture13040782
Submission received: 27 February 2023
/
Revised: 24 March 2023
/
Accepted: 27 March 2023
/
Published: 29 March 2023
(This article belongs to the Special Issue Applications of Biochar in Agriculture and Its Impact on Agricultural Systems)
Abstract
:A two-year field study was conducted in sandy loam soil to evaluate the impacts of biochar on soil quality and the growth and yields of pinto bean (Phaseolus vulgaris) and sorghum–Sudan (Sorghum × drummondii). A wood-derived commercial biochar was applied at three rates to pinto bean (PB) and sorghum–Sudan (SS) plots. The biochar application rates applied annually for two years to PB plots were 0, 2.2, and 11.2 Mg ha−1, whereas the rates for SS plots were 0, 3.4, and 6.7 Mg ha−1. Crop growth and harvest parameters were evaluated. Assessed soil measurements included pH, electrical conductivity, available nutrients, soil organic matter (SOM), permanganate oxidizable carbon (POXC), soil aggregates, and volumetric soil moisture content. The results showed no significant differences in plant growth parameters and yields over the two growing seasons for both PB and SS. Compared to the control treatment, the biochar at 11.2 Mg ha−1 in PB plots improved soil moisture retention after irrigation by 19% in the first year and 25% in the second year. The SOM in the SS plot at 6.7 Mg ha−1 biochar rate was higher (1.02%) compared to the control plot (0.82%), whereas a similar increase was not observed in the PB plot. Although biochar rates did not affect most of the soil measurements, there were significant changes in soil properties over time, regardless of biochar treatments: POXC increased in the PB and SS plots; SOM increased in the SS plot; and electrical conductivity, sodium adsorption ratio, and most soil micronutrients decreased. This research was conducted over two years; the effects of biochar can persist for much longer, indicating the need for longer-term biochar field studies in arid agroecosystems.
1. Introduction
Biochar is the solid carbon product of the anaerobic thermal decomposition of biomass that can improve agricultural soil quality [1]. Depending on the feedstock and pyrolysis conditions, biochars have different characteristics which can impact the soil in various ways. Biochar is recalcitrant within the soil due to highly condensed aromatic carbon structures that resist decomposition [2], effectively creating a long-term carbon sink. The rate of decomposition varies with feedstock, pyrolysis conditions, and soil texture [3]. Soil organic matter (SOM) is universally considered to be the foundation of high-quality, well-functioning agricultural soil [4] due to its influence on other soil properties such as structure, water-holding capacity, microbial diversity, and nutrient availability [5]. The addition of biochar carbon to the soil can serve as a pathway for increasing the SOM and enhancing the soil’s resilience against environmental stressors.
A meta-analysis study [3] found that the addition of biochar to sandy soils increased water-holding capacity and stimulated microbial functions, which aided in SOM mineralization and conversion of organic compounds into plant-available nutrients. Biochar can improve water movement by increasing the total surface area within the soil, leading to increased soil water and nutrient retention [6,7,8].
Alkaline soils are prevalent in arid regions. Biochar has been known to aid acidic soils by raising the pH and acting as a liming agent to improve nutrient availability. This effect may be unnecessary or undesirable within arid agroecosystems. Zhang et al.’s 2016 study concluded that biochar produced from pecan shells (pH 8.2), cotton gin trash (pH 8.4), yard waste (pH 9.7), and pecan wood (pH 9.5) did not affect the pH of coarse-textured soil [9]. Liu and Zhang (2012), however, reported that biochar produced from Chinese pine and locust (pH 8.38) resulted in a 0.32 unit decrease in pH in sandy soil over an 11-month incubation [10].
Due to the scarcity of vegetation and precipitation, arid soils are low in soil organic carbon (SOC), usually containing <1%, and carbon sequestration is often very challenging because of the mineralization of the SOM and loss of soil organic matter particles during erosion events. The incorporation of organic amendments has been shown to increase SOC [11] and reduce the adverse effects of soil compaction [12]. The raised levels of SOC can enhance infiltration and water retention in arid soils due to the improvement of aggregate stability, porosity, and mechanical resilience [13,14]. Understanding the potential of biochar in arid soils to promote increased carbon and water storage may be critical for maintaining and enhancing crop productivity in water-limited environments [15].
Within arid and semi-arid regions, water scarcity, land degradation, and low soil fertility—all potentially leading to lower crop yields—are prominent issues. Without proper management, increased irrigation using lower-quality water can increase soil salinity, leading to lower crop yield and nutritional disorders via osmotic and ionic plant stress [16]. Enhancing soil properties by using biochar to retain water for longer periods between irrigations, therefore, may benefit arid agriculture production.
Many studies have shown that biochar can have positive effects on crops by promoting nutrient use efficiency [17], promoting plant growth hormones, alleviating salt stress [18], and increasing growth and biological nitrogen fixation in legumes [19,20]. In a meta-analysis study on the effect of biochar on crop productivity [21], biochar application led to a small but significant increase in productivity with a grand mean increase of 10%. Although many studies have highlighted the positive effects of biochar on crop productivity, some studies have shown either a non-significant effect or a negative effect of biochar on crop growth and yield [8,22]. The suitability of a given biochar amendment is dependent on soil type, biochar characteristics, and crop species [23]. Consequently, it is essential to investigate how various crops react to biochar to determine its impacts on growth and yield.
Although biochar effects on soil quality and crop growth are well-documented for humid regions, limited information exists on biochar impacts in arid agroecosystems, especially the impacts on soil moisture retention and other soil properties in the early years after the biochar application. Arid and semi-arid soils are fragile and easily degraded due to low to very low organic carbon contents [24], and several properties of these soils are suboptimal for sustainable crop production. The objectives of this study were to investigate the effects of biochar applied at different rates on (i) soil quality indicators and (ii) the growth and yields of pinto bean (Phaseolus vulgaris) and sorghum–Sudan (Sorghum × drummondii) in arid sandy loam soil.
2. Materials and Methods
2.1. Experimental Field Site
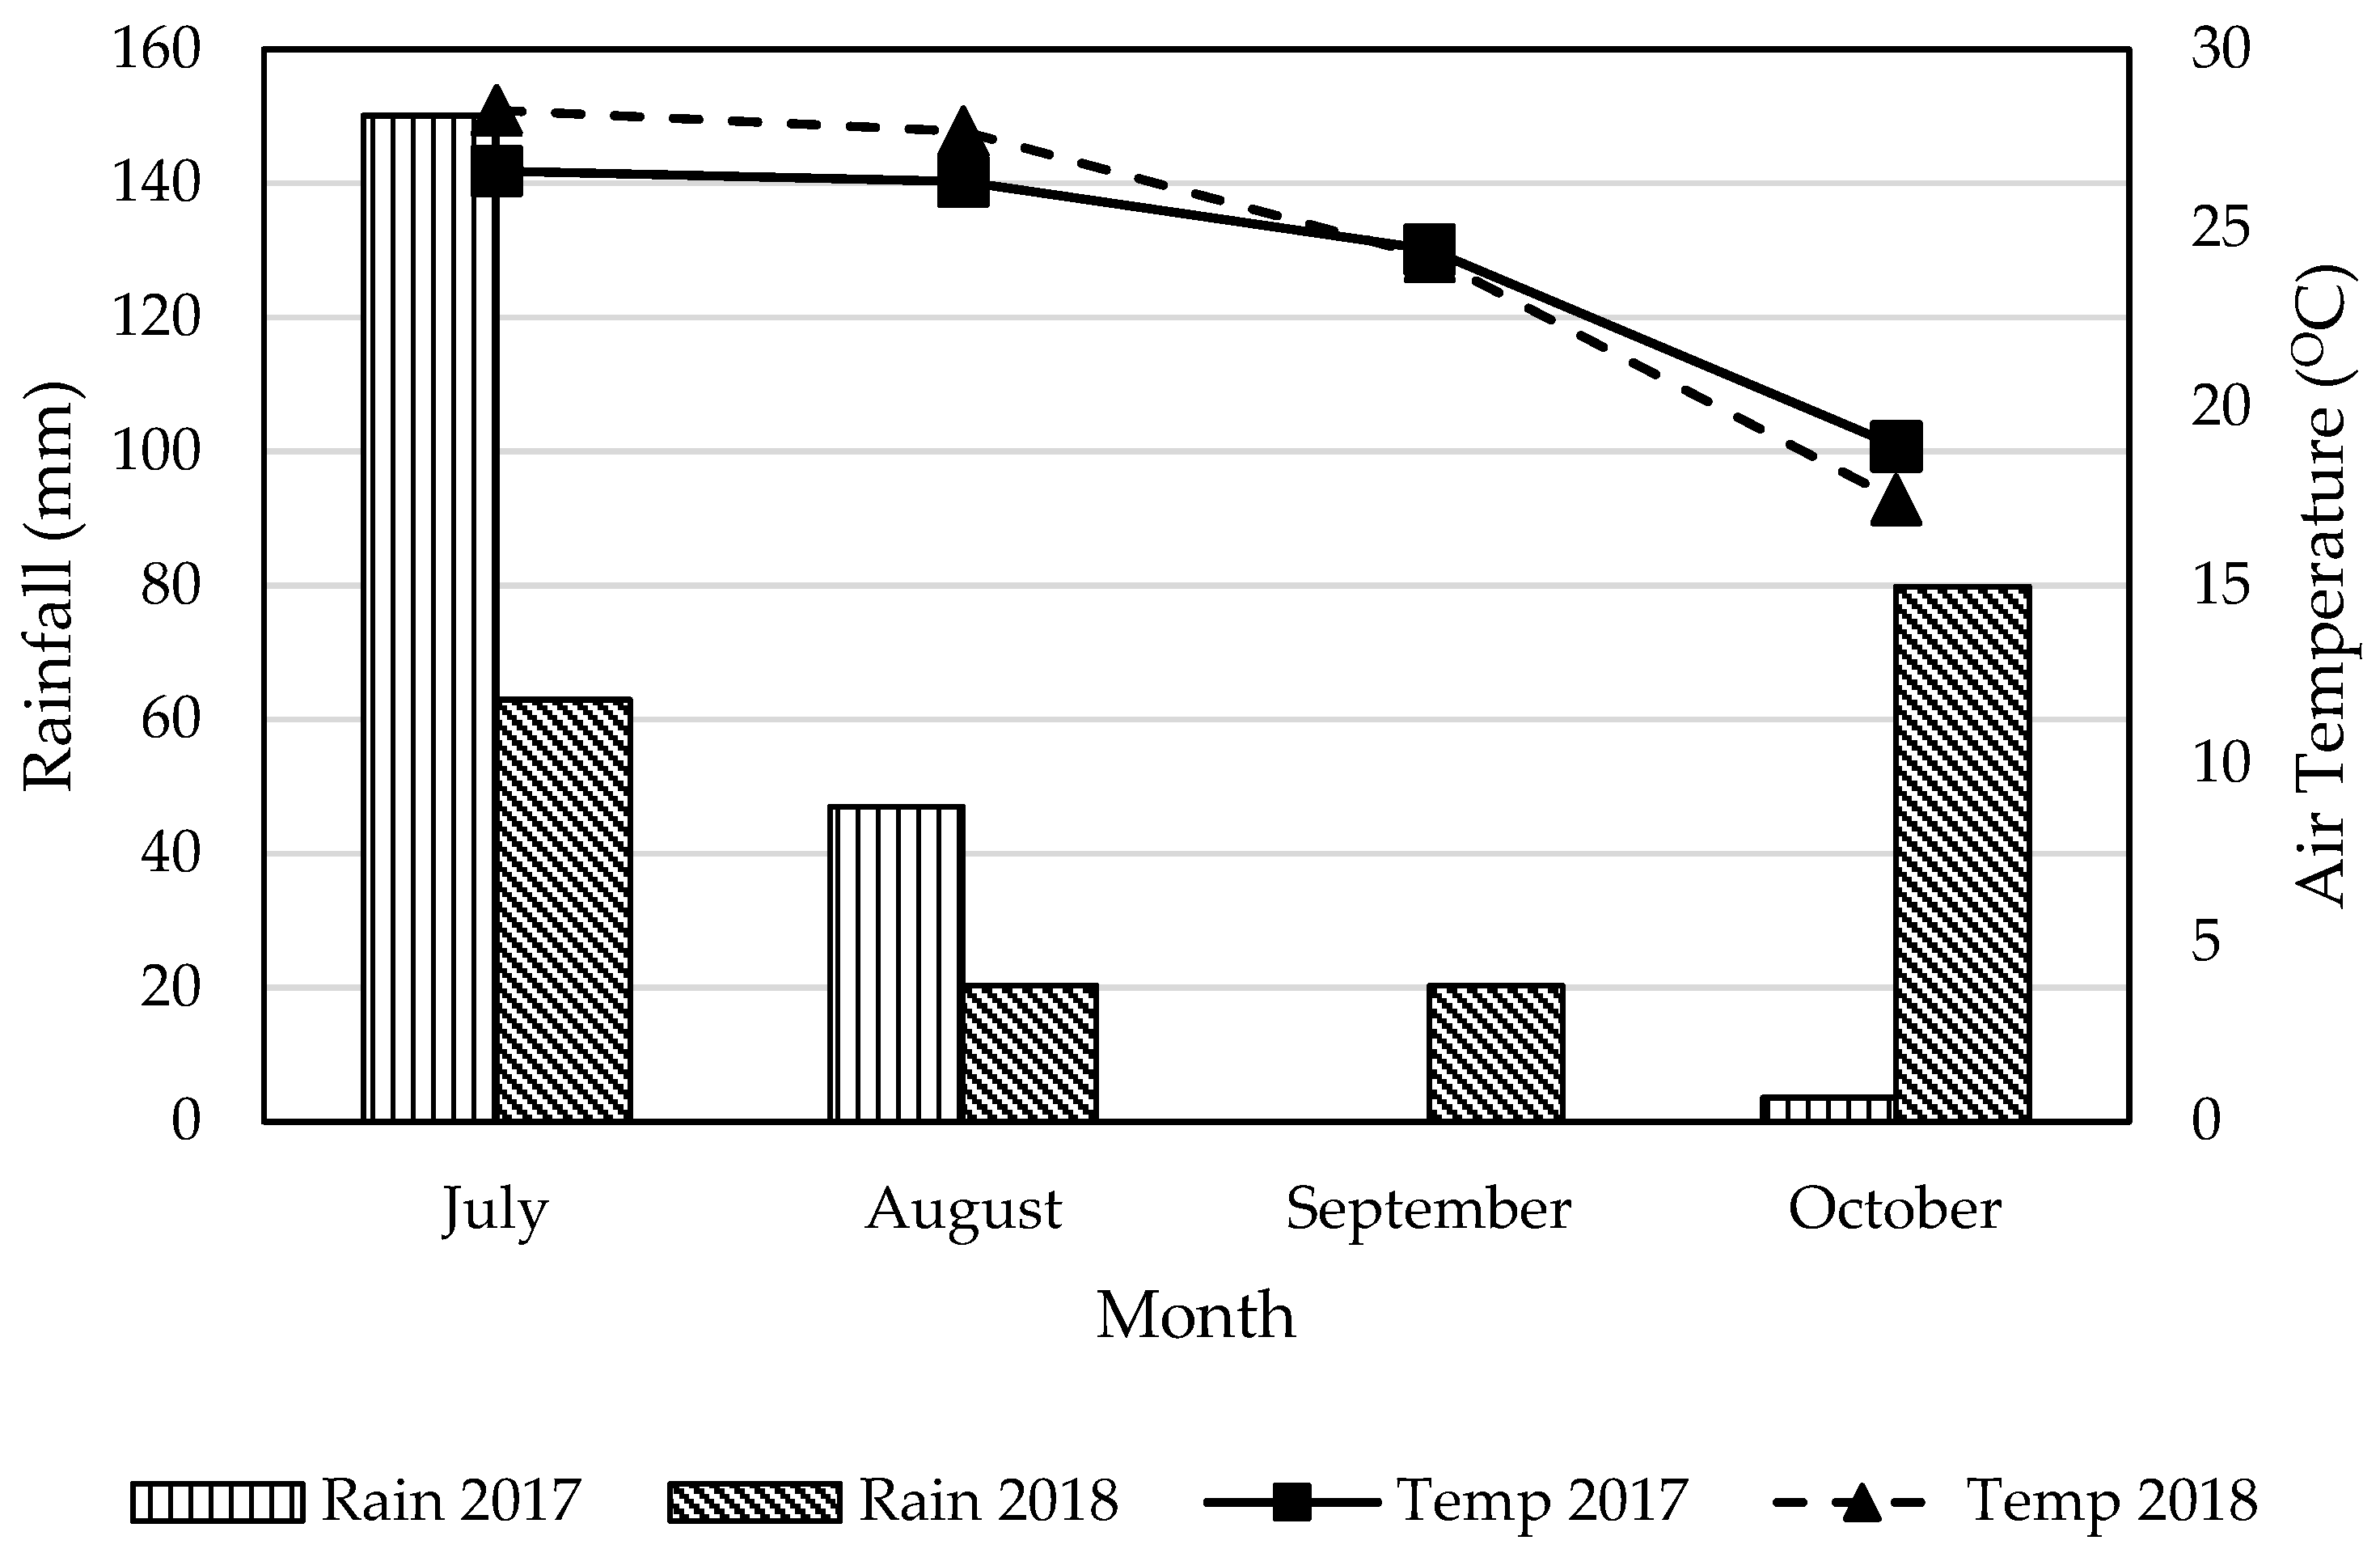
Field trials were conducted in the summer of 2017 and 2018 at Leyendecker Plant Science Center, Las Cruces, NM (32.19° N, 106.74° W). The elevation is approximately 1184 m and the climate is arid to semi-arid, with average annual precipitation of about 254 mm. The average monthly rainfall and air temperature during the 2017 and 2018 growing seasons at the trial site are presented in Figure 1. The soil of the study site is a Glendale sandy-loam soil, a fine-silty, mixed (calcareous), thermic Typic Torrifluvent according to the USDA classification system [25].
2.2. Cultural Practices
Separate fields within the same soil mapping unit were used for the pinto bean (PB) and sorghum–Sudan (SS) trials. The PB and SS fields were tilled with a tandem disk before the biochar application. Commercial biochar derived from lodgepole pine (Pinus contorta) was purchased in bulk from Biochar Solutions, Inc. (Carbondale, CO, USA). Pyrolysis conditions included one minute at 600 °C followed by nine minutes at 350 °C. The physical and chemical properties of the biochar are presented in Table 1.
For PB plots (4 m × 15 m), total biochar application was 0 Mg ha−1 (control, R0), 2.2 Mg ha−1 (R1), and 11.2 Mg ha−1 (R2). For SS plots (3 m × 15 m), total biochar application was 0 Mg ha−1 (control, R0), 3.4 Mg ha−1 (R1), or 6.7 Mg ha−1 (R2). Biochar was manually applied and incorporated with a cultivator (0–10 cm). Biochar rates were split between two years with half applied in 2017 and the other half in 2018. After the biochar application and incorporation, a bed shaper was used to form raised beds 0.46 m apart and the field was furrow irrigated for the PB plot. The SS field was only flood-irrigated. Before planting, RoundUp® (glyphosate active ingredient applied at 2.52 kg/ha mixed with a quarter part of Choice Weather Masters® and LI 700®) was applied for weed control.
Pinto bean (Phaseolus vulgaris; Cv. Windbreaker) and sorghum–Sudan (Sorghum × drummondii) were planted in late June of 2017 and 2018. PB was seeded at 67.3 kg ha−1 with a John Deere four-row Max Emerge Planter. SS was seeded at 44.9 kg ha−1 using a John Deere Grain Drill. Weeds were manually removed as necessary to minimize weed pressure. In both years, about a month after seeding, nitrogen fertilizer (urea 46-0-0) was applied to SS plots at 112 kg N ha−1. Phosphorus fertilizer (MAP 11-52-0) was applied to the PB plots at 22 kg P2O5 ha−1. After the 2017 experimental plot harvest, PB residue was mowed and left on the soil surface. The SS field was mowed, and the residue was incorporated into the soil. Winter oat (Avena sativa) was grown as a cover crop in early November in PB and SS plots and terminated using RoundUp® herbicide in May before establishing the 2018 trials. As much as possible, the treatment plots were managed to minimize soil disturbances to maintain the integrity of the biochar treatments.
2.3. Plant Growth Parameters and Harvest Measurements
For the PB plots, plant population, plant height, number of leaves and flowers, and number of nodes were measured weekly. Plant population was measured by counting the plants within a randomized 1.83 m span of the middle two rows of each plot. Six flagged plants (three each from the two middle rows in each treatment plot) were used each season to evaluate average plant height (measured with a meter stick from the base of the plant to the terminal bud), the number of leaves, and the number of nodes. The number of flowers was recorded after the appearance of the first flowers on the flagged plants. Pinto bean was harvested on 26 September 2017 and 6 October 2018. To evaluate the yield components, all the above-ground biomass in a 3 m long section of the two inner rows was harvested. The harvested biomass was weighed in the field to estimate the wet biomass. The samples were transported to the laboratory and oven-dried at 65 °C for three days to estimate the dry biomass. After drying, the pods were separated from the dry biomass and shelled to estimate the weight of beans produced per treatment plot.
For the SS, plant height was measured weekly using a meter stick on three flagged plants in each treatment plot. The height was measured from the base of the plant to the top of the main stalk. Plant biomass was harvested on 26 September 2017 and 6 October 2018 to estimate the total dry biomass yield. Sorghum–Sudan plants were cut at ground level in three randomized sections per plot by using a 0.5 m × 0.5 m quadrant. The samples collected were weighed to estimate the wet biomass and then oven-dried at 65 °C for three days to estimate the dry biomass.
2.4. Soil Moisture Depletion Measurements and Other Soil Measurements
The volumetric moisture content of the surface soil (0–6 cm) was measured in May 2017 and September 2018 in both the PB and SS plots using a HydraProbe® (Stevens Water Monitoring Systems Inc., Portland, OR, USA) for six days after an irrigation event.
Representative soil samples were collected from the treatment plots before planting in 2017 and post-harvest in 2017 and 2018. The samples were air-dried and analyzed for multiple soil measurements. The soil pH, electrical conductivity (EC), and sodium adsorption ratio (SAR) measurements were determined from saturated paste extracts [27]. Extractable Fe, Mn, Zn, and Cu in soils were determined using the DTPA method [28]. Soil organic matter content (SOM) was determined using the Walkley–Black method [29]. Extractable P was measured using the Olsen method [30]. Nitrate-N was determined using KCl extraction, and permanganate oxidizable carbon (POXC) was determined using the method developed by Weil et al. [31].
Dry aggregate size distribution and wet aggregate stability were not measured in 2017; however, they were measured before planting and after harvest in 2018. Dry aggregate size distribution was measured using a Tyler RX-29 Rotap sieve shaker (W.S. Tyler, Mentor, OH, USA), providing mean weight diameter (MWD) and aggregates greater than 2 mm (AGG > 2 mm) [32]. Wet aggregate stability (WAS) was measured using the Cornell Sprinkle Infiltrometer [33].
2.5. Statistical Analysis
The PB and SS trials used a randomized complete block design with treatments replicated four times. Because there was no treatment-by-year interaction, the yield components for PB and SS were analyzed together for both years, with biochar rates as the fixed effect and the year as the random effect using a mixed-model analysis of variance (ANOVA). The soil data were analyzed with a repeated-measure ANOVA to assess the treatment effects and how the measurements varied over time. A Tukey HSD post hoc analysis was performed after a significant F-ratio was detected. The package used for analysis was SPSS Statistical Software [34].
3. Results
3.1. Plant Growth Parameters
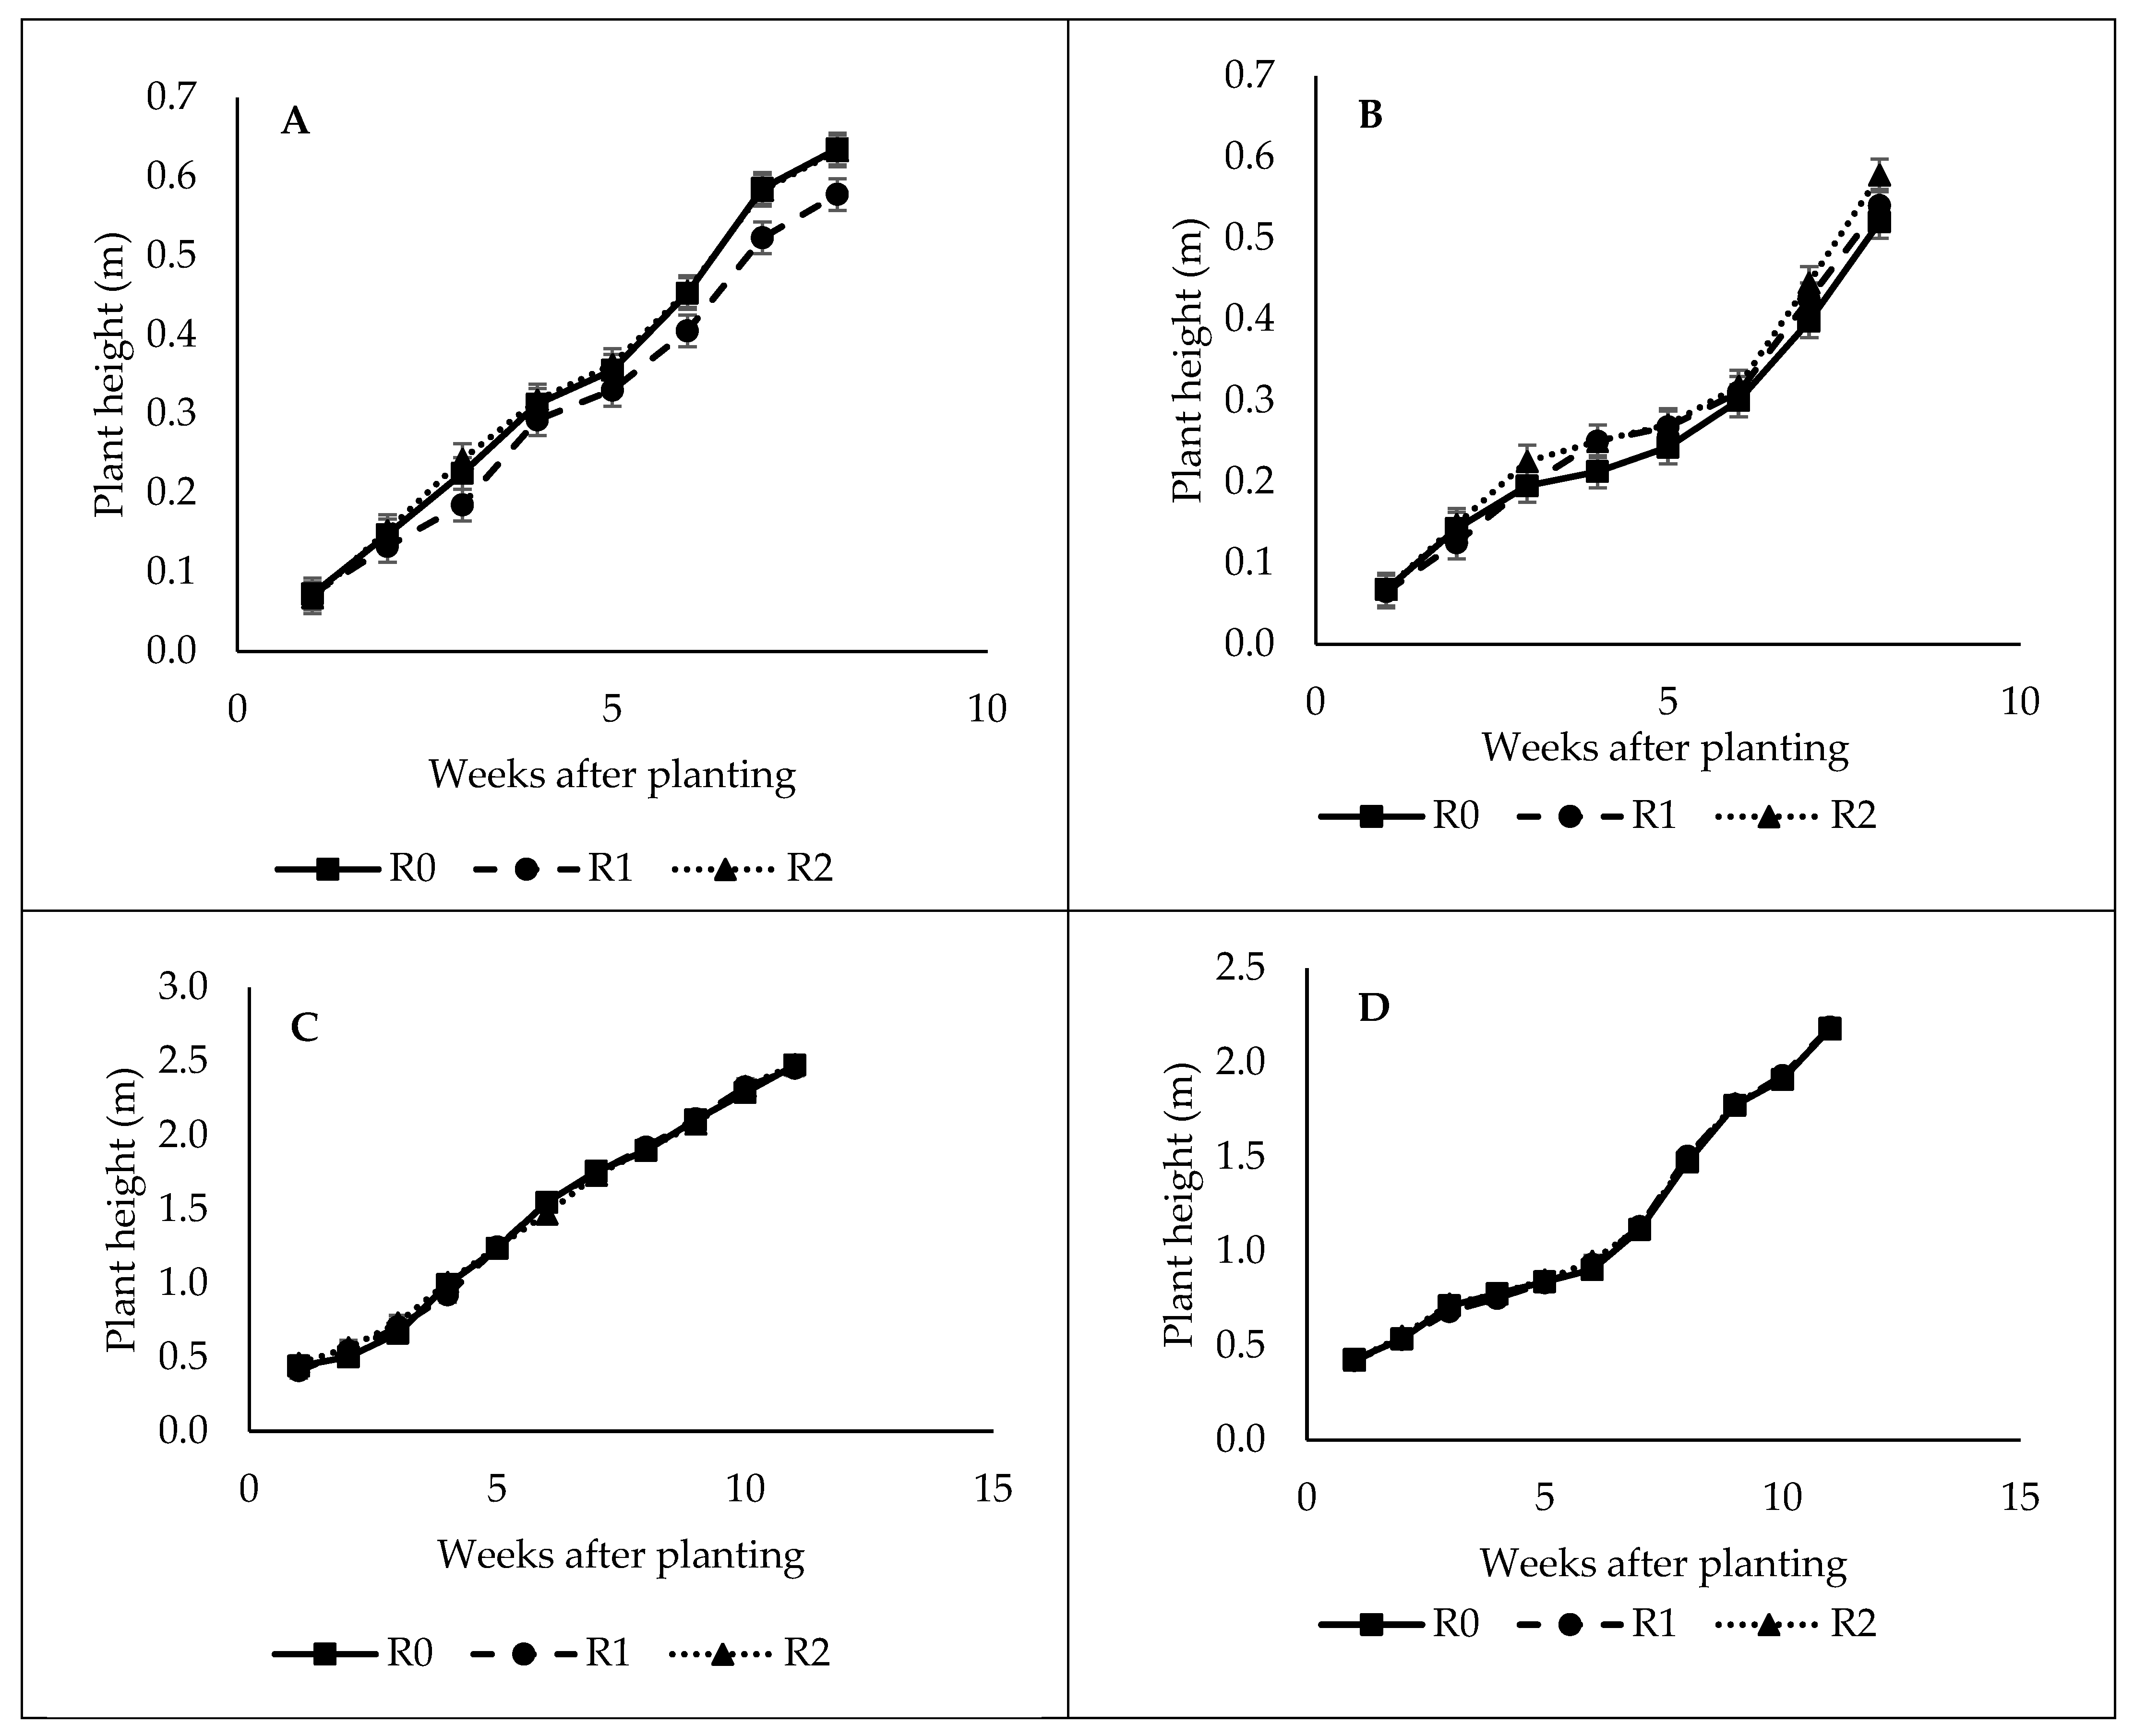
The plant height of pinto bean reached a maximum at eight weeks after planting (WAP) for all three treatment rates in 2017. The plant height for biochar treatment R1 was generally lower as a rate main effect at α = 0.05 (p = 0.026) when compared to R0 and R2 in 2017 (Figure 2A). In 2018, there were no differences in the plant height of PB at different biochar rates (Figure 2B). More rapid growth of the PB was observed during the early part of the season in 2017 compared to 2018 (Figure 2A,B). At 4 WAP, the mean height of PB across treatments was 0.3 m in 2017, whereas the mean number of leaves was 30. This contrasts with the mean plant height of just 0.2 m and 20 leaves measured in 2018 at 5 WAP during an equivalent growth stage (Figure 2A,B). Flowering began at five WAP during both growing seasons. The number of leaves, nodes, flowers, and plant population of PB were not different between the three biochar treatments.
Although the plant height of SS was not impacted by biochar rates during either year, the growth rate was slower in 2018 compared to 2017 (Figure 2C,D).
3.2. Yield Parameters
The analysis of variance (ANOVA) results did not indicate any significant biochar effect on dry biomass yield, seed yield, and harvest index of PB (Table 2). The highest bean yield of 2444 kg ha−1 (averaged over two years) was recorded under the R1 biochar treatment, whereas the lowest average bean yield of 1955 kg ha−1 was recorded under the R2 treatment (Table 2). A field observation during the first year of biochar application indicated a delayed maturity of pods in the R2 treatment, but this was not observed in the second year. The PB yield parameters were generally lower in 2018 compared to 2017 though not statistically different (Table 2). The SS biomass yield was also not affected by the biochar rates during the two trial seasons, with the biomass yields being almost the same during both years (Table 2).
3.3. Soil Measurements
The ANOVA results of the soil measurements over time in the PB plots showed no effect of biochar on any of the soil chemical measurements assessed (Table 3).
In contrast to the biochar rates, most of the measured soil parameters were significantly affected over time, except for SOM (Table 3). The EC, SAR, K, Cu, Fe, Mn, and Zn showed a decreasing trend with time, whereas POXC and pH showed an increasing trend with time (Table 4).
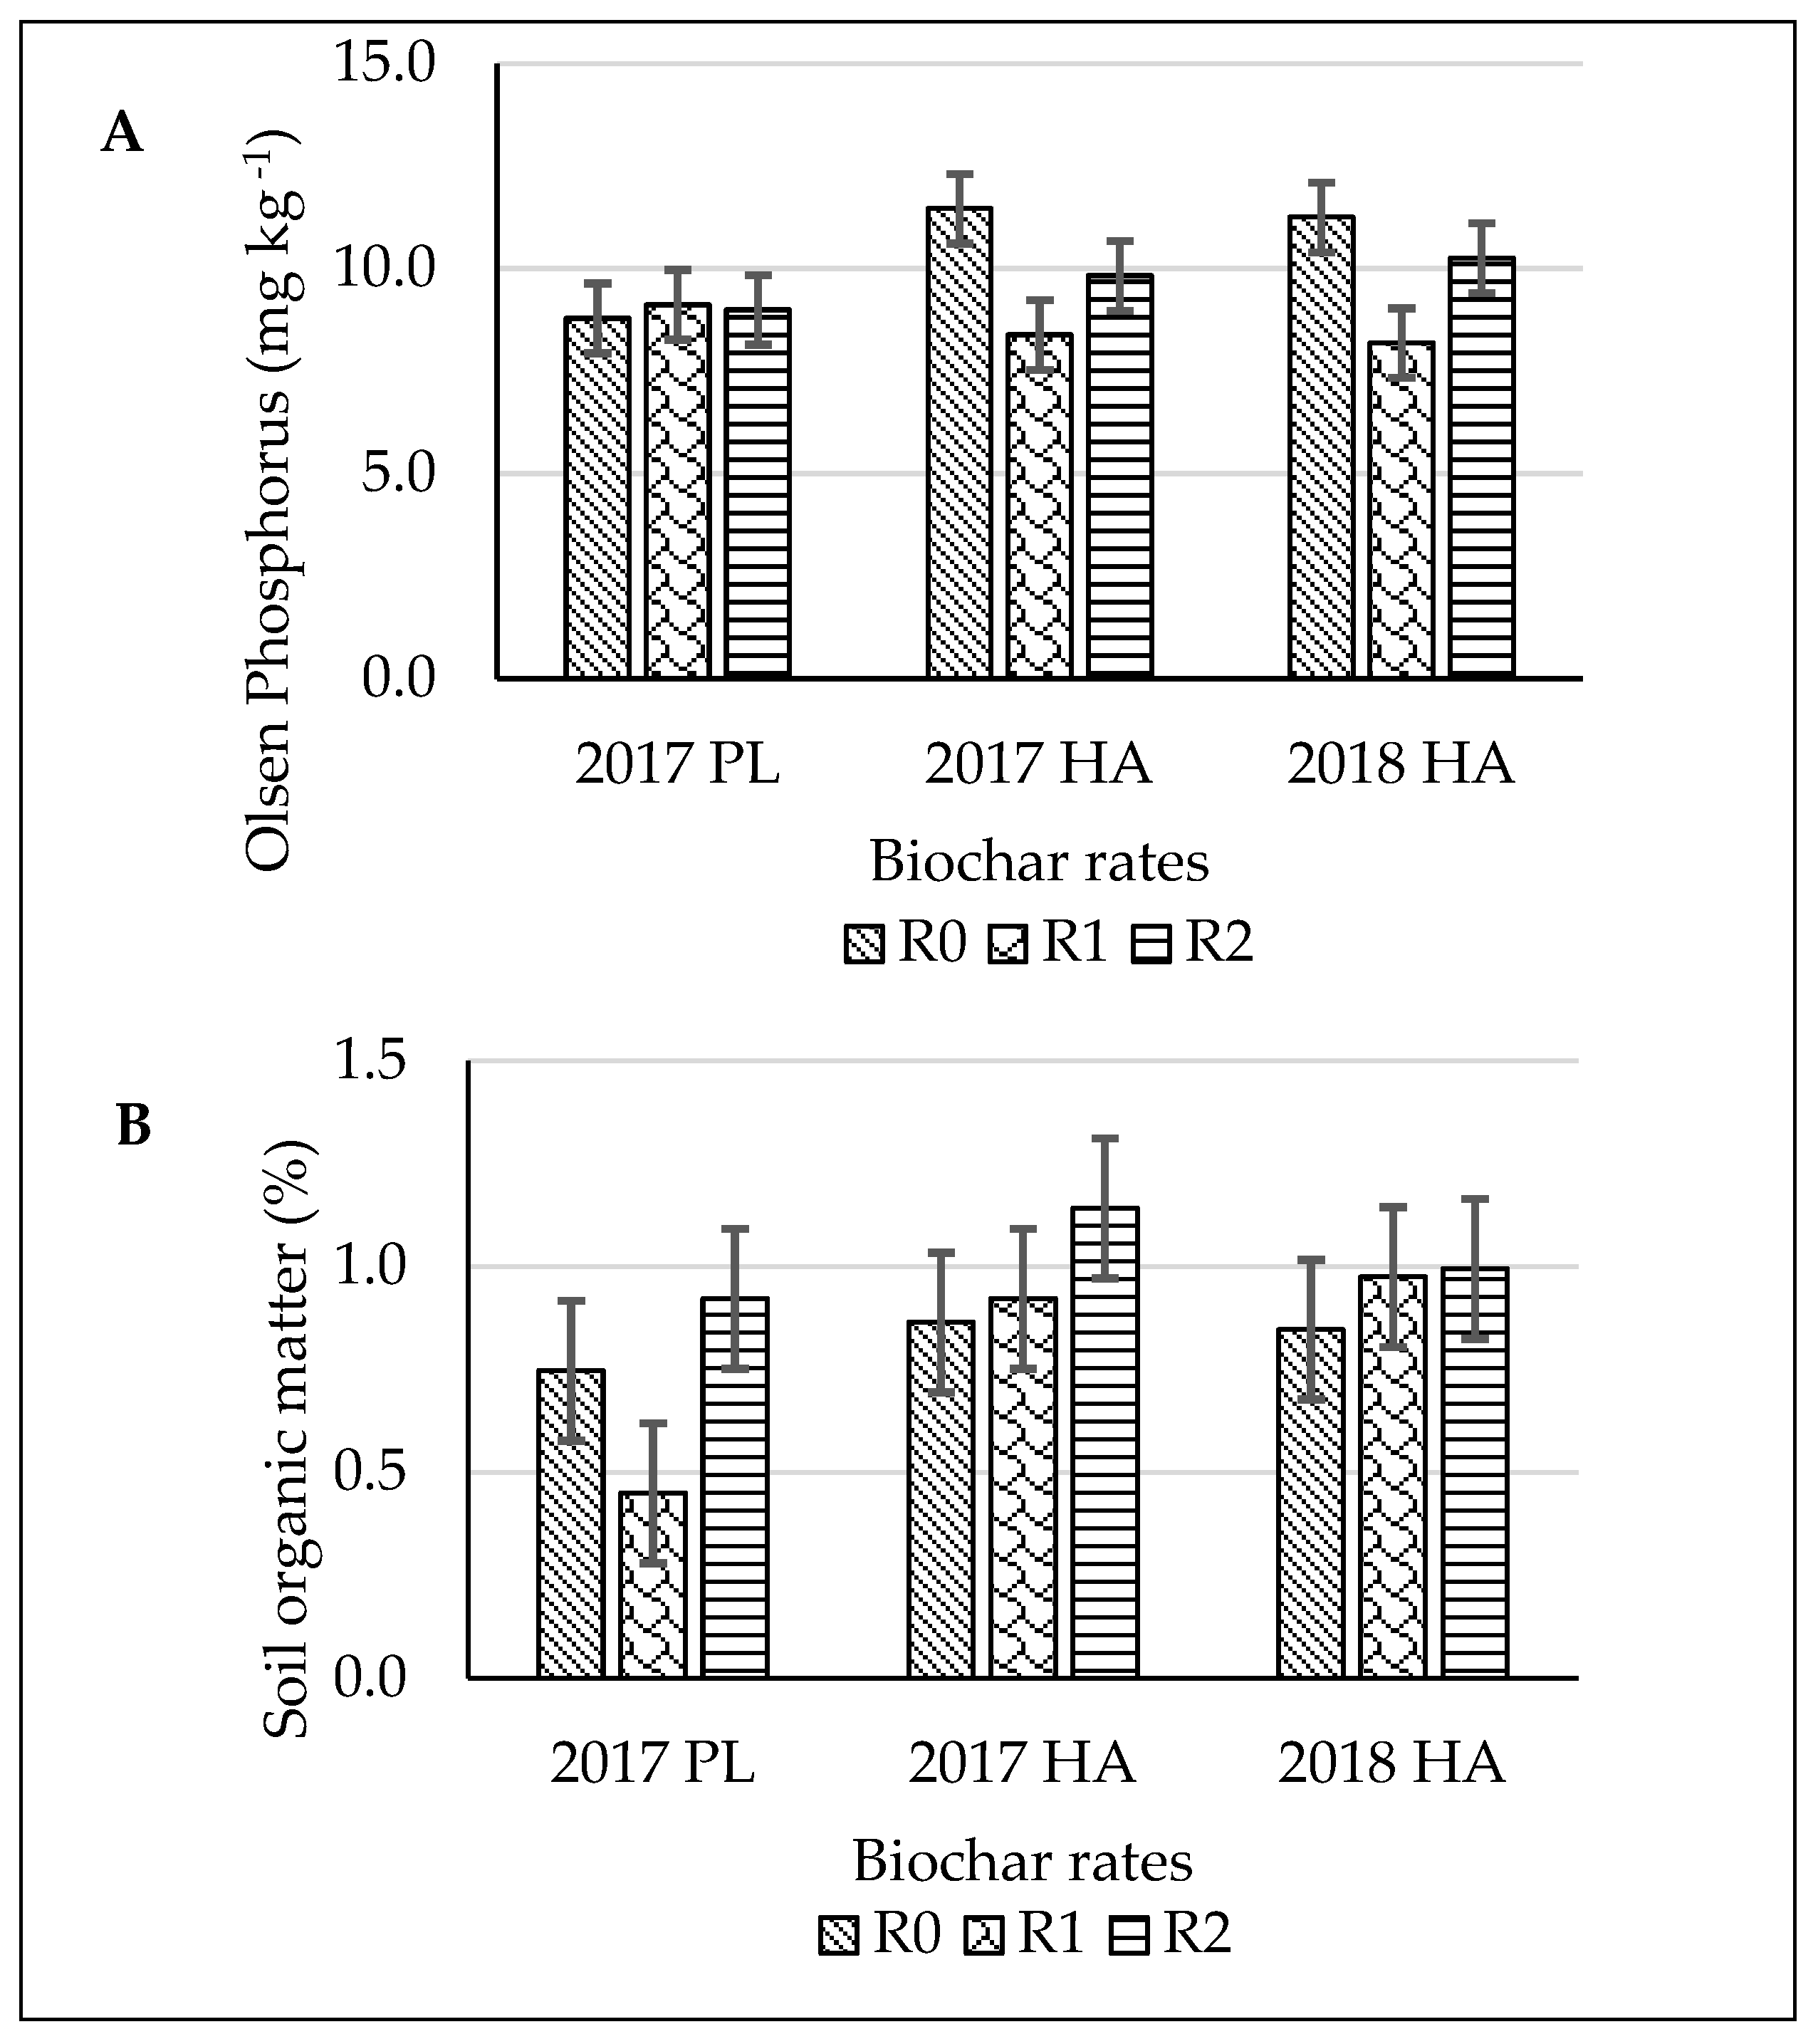
There was no significant interaction effect between biochar rates and sampling time for all the measured soil properties, except for the Olsen-P (Table 3). Olsen-P was not statistically different under the three biochar rates in the pre-trial samples but, by the end of the first season, the Olsen-P under R0 was statistically higher than the R1 treatment but not different from R2 (Figure 3A). By the end of the second season (2018), both the R0 and R2 had significantly higher Olsen-P than the R1 treatment (Figure 3A).
Similar to the soil under PB, the ANOVA results of the soil chemical measurements under SS were mostly unaffected by the biochar application rates, except for SOM (Table 5). The SOM was higher in the R2 treatment compared to R1 and the control (Table 6). All the measured soil properties were highly significant with sampling time, except for Olsen-P (Table 5). Under SS, the EC, SAR, Cu, Mn, and Zn exhibited a decreasing trend with time, whereas POXC, SOM, and pH had an increasing trend with time (Table 6). The Fe and K contents increased towards the end of 2017 but decreased by the end of harvest in 2018 to a level comparable to the baseline values (Table 6).
The interaction effect between biochar rates and sampling time in the SS plots was not significant for any measurements except for SOM (Table 5). The SOM of the R1 treatment was lower than the R2 treatment but not different from the R0 treatment in samples collected at the beginning of the trial (Figure 3B). However, by the end of the first and second seasons, the SOM was not different among the treatments (Figure 3B).
The soil physical measurements did not differ with biochar treatments in PB and SS plots; however, the MWD and AGG > 2 mm differed between the 2018 pre-plant and harvest samples (Table 7). In both PB and SS plots, there was an increase in MWD and AGG > 2 mm by the end of the 2018 season compared to the beginning of the season (Table 7).
3.4. Soil Moisture Depletion
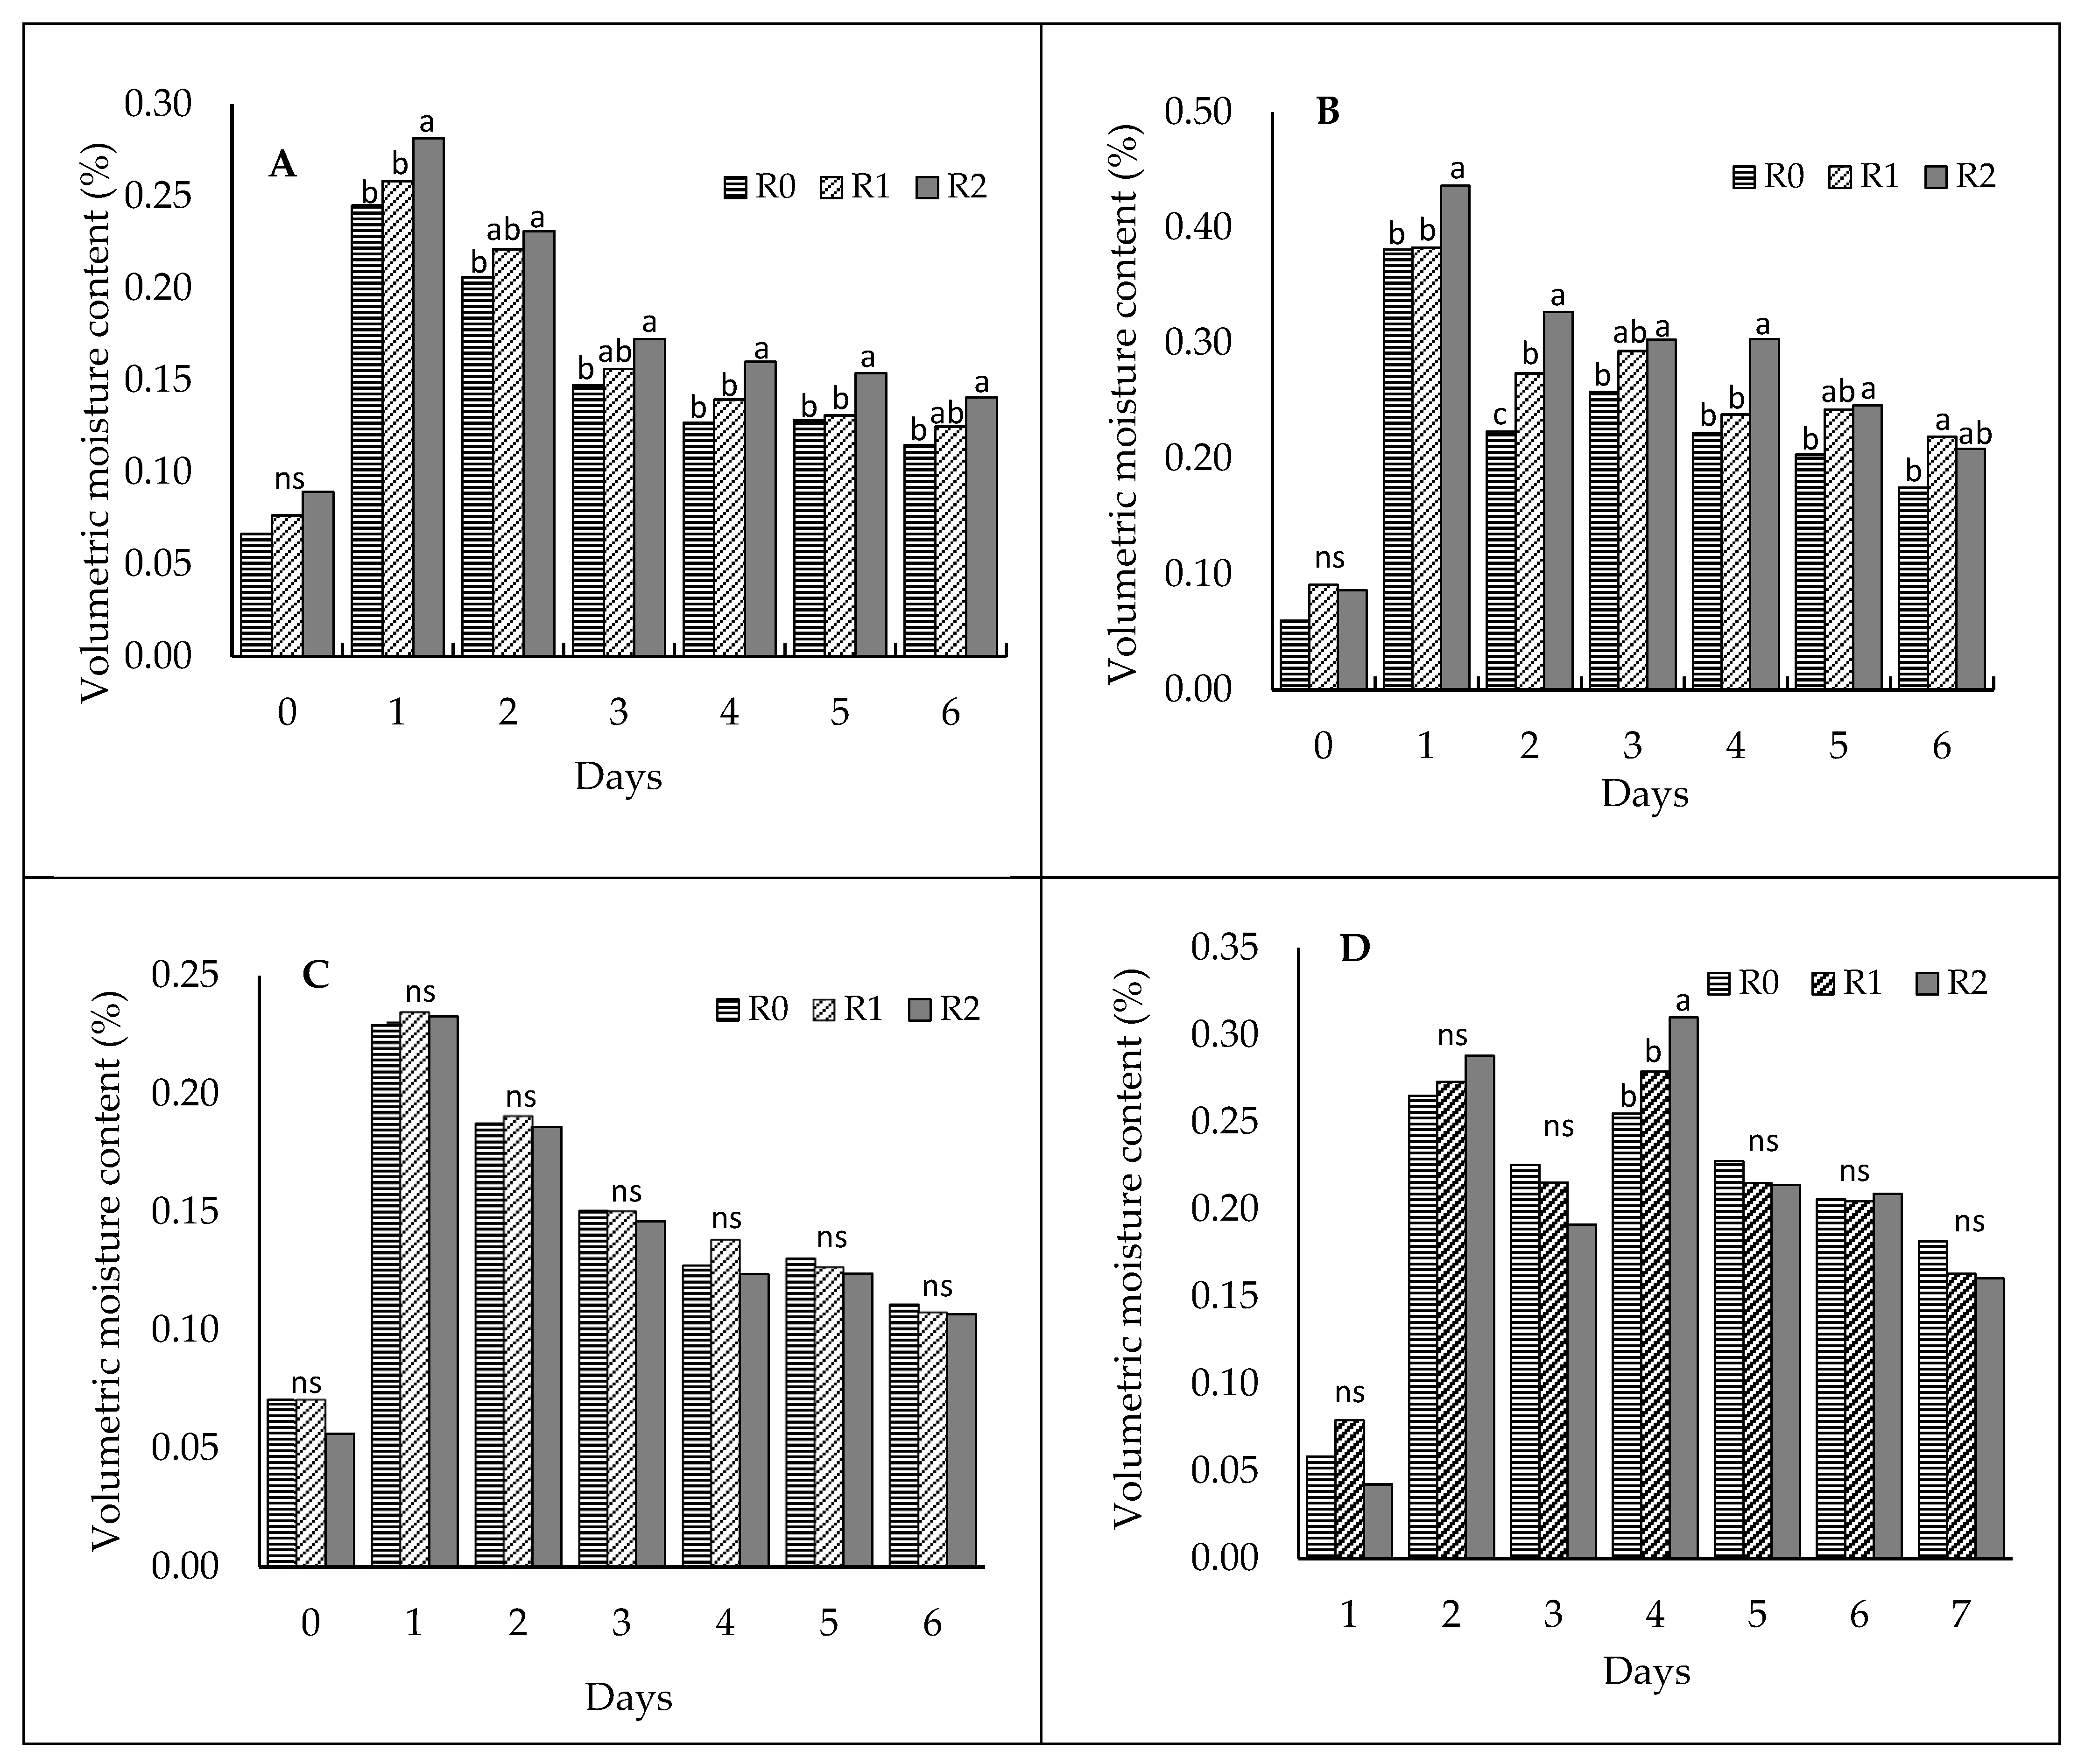
The results of the soil moisture depletion study after irrigation are shown in Figure 4A–D for PB and SS. In the PB plot, the soil moisture contents were higher in the R2 treatment from day 1 to day 6 compared to the control treatment in 2017 and from day 1 to day 5 in 2018 (Figure 4A,B). Although the soil moisture contents of the R1 treatment were generally higher than the R0 treatment, they were often not statistically different (Figure 4A,B). In the SS plots, the soil moisture contents were mostly not different between the biochar treatments during both years of measurement (Figure 4C,D).
4. Discussion
This study highlights how biochar can affect plant growth and soil quality of sandy soil in an arid environment in the short term. This study is of importance because limited information exists on biochar impacts in arid and semiarid agroecosystems, especially the impacts on soil moisture retention, soil health indicators, and crop performance [35].
4.1. Biochar Effect on Crop Growth and Yields
From this short-term study, the biochar applied did not appear to improve the yields of pinto bean (PB) and sorghum–Sudan (SS) over two growing seasons. The effect of biochar on crop yield is mixed in the literature. Although some studies have shown that biochar can have positive impacts on crop yields, others have shown either no impacts or negative impacts on yields [22,23]. Similar to our results, a study showed that the application of biochar did not improve the yield of corn and beans in low-fertility, coarse-textured surface soil [36]. Another short-term field experiment found that the application of biochar alone at 10 t/ac did not significantly impact the yield of beans; however, when biochar was combined with poultry manure, the yield was significantly increased [37]. Other studies have shown that the biochar impacts on crop yield can be affected by variables such as environmental conditions, soil type, feedstock type, pyrolysis conditions, soil management, and plant species [21,38]. All these factors combined will influence the response of crops to biochar at a given location. A major confounding factor in this trial was the application of fertilizers to meet crop requirements, added to the soil after crop establishment. Although biochar has been shown in studies to enhance soil nutrient uptake when fertilizers are applied [38], this was not supported in this study as no increases in biochar-amended soil were observed compared to the control treatment. The fertilizers added to the soil may have masked any contribution of the biochar to the soil nutrient level. It is worth noting that a delay in maturity was observed for PB during the first year at the highest biochar application rate (11.2 Mg ha−1). Additionally, the quantitative PB seed yield was lower by about 15% at the highest biochar application rate compared to the control treatment, though not statistically significant. This was not observed at the much lower application rate (2.2 Mg ha−1). This may be an indicator that the high rate of biochar used in this study may have had some interaction with the growth and development of PB during the first year. The direct reason for this was not clear as the maturity was not delayed in the second year, though the PB seed yield at the highest biochar rate was still quantitatively lower than the control treatment. No such issues were observed for SS at the biochar application rates used. This is likely a reinforcement of the crop species-dependent response of growth and yields to biochar [38]. Reduced growth rates, as shown by plant heights observed in 2018 compared to 2017 for both SS and PB, may be due to variations in weather patterns observed between the two study years. Although the mean monthly temperatures did not show much difference between the two years, the rainfall distribution was very different (Figure 1). The total rainfall in 2017 during the early growth stages (July and August) of both PB and SS was 197 mm compared to 83 mm in 2018. The higher rainfall could have promoted the more rapid growth observed for both crops in 2017.
A general observation of more rapid growth of PB and SS during the early part of the season in 2017 compared to 2018 may have been due to higher rainfall in July and August of 2017 compared to 2018 (Figure 1). The rainfall during both of these months in 2017 was more than double the rainfall during these months in 2018. This higher rainfall likely enhanced crop growth in 2017 during the early PB and SS growth stages.
4.2. Biochar Effects on Soil Moisture
A major significant positive impact of the biochar applied in this study was its effect on soil moisture retention as measured in the moisture depletion study after irrigation events in PB plots. The moisture retention effect was more pronounced at the highest biochar application rates (R2) in PB plots and was higher than in the control treatment. There was an average of 19% more moisture retained in the soil at the R2 biochar rate compared with the control treatment (R0) for 2017, and 25% more moisture was retained in R2 compared to R0 in 2018. The higher moisture retention in 2018 could have been due to the cumulative effect of biochar application, because the total rate was split into two and applied during each year of this study. Several studies have shown improvement in soil moisture retention after biochar application to coarse-textured soils [39,40]. Although evidence of higher soil moisture retention in the PB plot was seen at the highest biochar rate (11.2 Mg ha−1), a similar result was not observed for the highest rate in the SS plot (6.7 Mg ha−1). Another possible reason is that SS, belonging to the grass family, has a higher soil moisture requirement than grain legumes such as PB [41]. The higher moisture demand of SS would create a quicker soil moisture deficit compared to PB. This higher rate of soil moisture depletion by SS may have masked any effect of biochar’s moisture retention capacity that could be measured by the methods used in this study. In water-limited environments such as arid regions, drought-tolerant crops with low moisture requirements will probably benefit more from biochar application than crops with high water demands.
4.3. Biochar Effects on Soil Quality Indicators
The lack of significant effects of biochar application on most of the measured soil quality parameters was not unexpected. Studies have shown that the effects of amendments on soil measurements often take several years to become apparent [42]. However, one of the interesting observations was the significant increase in the SOM compared to the control treatment at the highest rate of biochar application in SS plots (Table 6). Although the highest biochar rate applied to the SS plot (6.7 Mg ha−1) was much lower than the highest rate in the PB plot (11.2 Mg ha−1), there was no significant increase in the SOM in the PB plots compared to the control treatment. The average SOM in the SS plot at the highest biochar application rate was about 17% more than the SOM for the highest biochar rate in the PB plot (Table 4 and Table 6). The increased SOM in the SS plot could be linked to the residue returned to the soil after the first year of the trial. In both PB and SS plots, residues were returned to the soil in the first year after harvesting plots for yield evaluations. The amount of SS biomass returned as residue to the soil was much higher than the PB residue. This higher residue amount, combined with the biochar, could have led to a higher SOM that was detected in the SS plots. SS has high biomass production and has been shown to contribute significantly to building soil health and increasing SOM when incorporated into the soil [43]. This result confirms that combining a variety of methods for adding organic materials to the soil can lead to a quicker buildup of the SOM and the enhancement of soil health [44].
Soil properties changed over time during the two trial years, with some measurements increasing and others decreasing (Table 4 and Table 6). POXC, an indicator of soil labile carbon [45], increased over time in both the PB and SS soils, presumably due to the additions of crop residues to the soil after the first year harvest. POXC is regarded as a soil quality indicator that is very responsive to shifts in the soil carbon pools as it can detect a directional change in soil carbon earlier than the SOM measurement [46]. Whereas the SOM showed a significant increase over time only in the SS soil, an increase of POXC in the PB soil with time may indicate a positive shift of the SOM, implying a beneficial contribution of the PB residue to the soil-building process, even though the measured SOM did not show any significant increase.
Another soil property that increased with time was the pH, from a baseline of 7.73 to 8.13 in the PB plots and from 7.71 to 8.18 in the SS plots. This is less beneficial for soil quality as a higher pH can limit nutrient availability for crop use. It was unexpected that the soil became more alkaline irrespective of biochar treatment. The inherently higher pH of the biochar materials (Table 1) was expected to result in higher soil pH proportional to the biochar application rate. However, the PB and SS plots did not show an increase in pH as a function of biochar amendment. The pH of the control treatment was similar to the biochar-amended soils (Table 4 and Table 6). The reason for a rise in soil pH over time is not clear, but this may be related to the variation in the quality of irrigation water used. However, we could not verify this because we did not measure the irrigation water quality.
The EC and SAR decreased with time in both the PB and SS plots, which is a welcome development in arid soils that are often prone to salinity and sodicity problems.
Most of the available micronutrients were reduced with time in both the PB and SS plots (Table 4 and Table 6), indicating that these nutrients were being mined by the crops growing in the soil. Even though the micronutrients were drawn down over time, they were mostly still in the sufficient range for crop production [47], except for Fe in the PB soil, which shifted from the sufficient to the moderate range [47]. This necessitates monitoring of these nutrients through regular soil testing to make sure that they are not deficient for sensitive crops in rotation.
Biochar research is still at an active stage to evaluate its value in various agroecosystems around the world. Documentation of the effects of different types of biochar on crop growth, yield, and soil quality in different climatic zones is essential. Producers must be careful when choosing which type of biochar to use for their production systems because procuring biochar for farm use can be very expensive, especially if the material must be transported over long distances. Understanding how a specific type of biochar can impact crop production and soil health will assist farmers in arid regions to make informed decisions.
5. Conclusions
Application of lodgepole pine biochar to an arid sandy loam soil did not impact the yields of pinto bean and sorghum–Sudan over the two growing seasons. The average seed yields over two years for PB at biochar rates of 0, 2.2, and 11.2 Mg ha−1 were 2305, 2444, and 1955 kg ha−1, respectively, whereas the average biomass yield of SS for the biochar rates of 0, 3.4, and 6.7 Mg ha−1 were 16, 16, and 17 Mg ha−1, respectively. A delay was observed in pinto bean maturity during the first year at the highest biochar application rate. There was an increase in moisture retention measured up to 6 days after an irrigation event at the highest biochar application rate (11.2 Mg ha−1) compared to the control for the soil planted to the pinto bean. The average increase in moisture retention was 19% in the first year and 25% in the second year. A similar moisture retention effect was not observed in the sorghum–Sudan plots. Most of the soil properties were not affected by biochar rates, except the soil organic matter which was approximately 24% higher in the sorghum–Sudan plot at the highest biochar rate (6.7 Mg ha−1) compared to the control. A higher level of the soil organic matter (1.02%) at the highest biochar rate in the sorghum–Sudan plot compared to the soil organic matter in the control treatment (0.82%) was attributed to the combined effect of biochar and sorghum–Sudan residue returned to the soil after the first trial year. The permanganate oxidizable carbon increased with time in both pinto bean and sorghum–Sudan plots, whereas electrical conductivity, sodium adsorption ratio, and most of the soil micronutrients decreased over time irrespective of biochar rates. Future studies for which soil salinity and pH may be of concern for biochar amendments should track irrigation water quality to help separate biochar and water effects. This short-term study investigated the impact of a single type of biochar; longer-term studies are needed to evaluate different types of biochar and their effects on crop productivity and soil quality in arid agroecosystems.
Author Contributions
Conceptualization, O.J.I.; methodology, O.J.I. and A.U.; software, O.J.I.; validation, O.J.I. and M.O.; formal analysis, L.K. and O.J.I.; investigation, L.K., M.O. and O.J.I.; resources, O.J.I.; data curation, L.K. and O.J.I.; writing—original draft preparation, L.K.; writing—review and editing, A.U., O.J.I. and C.E.B.; visualization, O.J.I.; supervision, A.U., O.J.I. and C.E.B.; project administration, O.J.I.; funding acquisition, A.U., O.J.I. and C.E.B. All authors have read and agreed to the published version of the manuscript.
Funding
This research was funded by the U.S. Department of Agriculture (USDA) National Institute for Food and Agriculture National Needs Fellows Program Grant “2015-38420-23706”, USDA-Hatch Grant, and New Mexico State University Agricultural Experiment Station.
Data Availability Statement
The data presented in this study are available on request from the corresponding author.
Acknowledgments
We thank the farm crew at Leyendecker Plant Science Research Center, Las Cruces, New Mexico for helping with the field preparations and cultural practices.
Conflicts of Interest
The authors declare no conflict of interest. The funders had no role in the design of the study; in the collection, analyses, or interpretation of data; in the writing of the manuscript; or in the decision to publish the results.
References
- Agegnehu, G.; Srivastava, A.K.; Bird, M.I. The Role of Biochar and Biochar-Compost in Improving Soil Quality and Crop Performance: A Review. Appl. Soil Ecol. 2017, 119, 156–170. [Google Scholar] [CrossRef]
- Wiedemeier, D.B.; Abiven, S.; Hockaday, W.C.; Keiluweit, M.; Kleber, M.; Masiello, C.A.; McBeath, A.V.; Nico, P.S.; Pyle, L.A.; Schneider, M.P.W.; et al. Aromaticity and Degree of Aromatic Condensation of Char. Org. Geochem. 2015, 78, 135–143. [Google Scholar] [CrossRef] [Green Version]
- Wang, J.; Xiong, Z.; Kuzyakov, Y. Biochar Stability in Soil: Meta-Analysis of Decomposition and Priming Effects. GCB Bioenergy 2016, 8, 512–523. [Google Scholar] [CrossRef] [Green Version]
- Haynes, R.J. Labile Organic Matter Fractions as Central Components of the Quality of Agricultural Soils: An Overview. Adv. Agron. 2005, 85, 221–268. [Google Scholar]
- Carter, M.R. Soil Quality for Sustainable Land Management: Organic Matter and Aggregation Interactions That Maintain Soil Functions. Agron. J. 2002, 94, 38–47. [Google Scholar] [CrossRef]
- Downie, A.; Crosky, A.; Munroe, P. Physical Properties of Biochar. In Biochar for Environmental Management; Lehmann, J., Joseph, S., Eds.; Earthscan: London, UK; Sterling, VA, USA, 2009; pp. 13–30. [Google Scholar]
- Ippolito, J.A.; Ducey, T.F.; Cantrell, K.B.; Novak, J.M.; Lentz, R.D. Designer, Acidic Biochar Influences Calcareous Soil Characteristics. Chemosphere 2015, 142, 184–191. [Google Scholar] [CrossRef]
- Spokas, K.A.; Cantrell, K.B.; Novak, J.M.; Archer, D.W.; Ippolito, J.A.; Collins, H.P.; Boateng, A.A.; Lima, I.M.; Lamb, M.C.; Mcaloon, A.J.; et al. Biochar: A Synthesis of Its Agronomic Impact beyond Carbon Sequestration. J. Environ. Qual. 2012, 41, 973–989. [Google Scholar] [CrossRef] [Green Version]
- Zhang, Y.; Idowu, O.; Brewer, C. Using Agricultural Residue Biochar to Improve Soil Quality of Desert Soils. Agriculture 2016, 6, 10. [Google Scholar] [CrossRef] [Green Version]
- Liu, X.-H.; Zhang, X.-C. Effect of Biochar on PH of Alkaline Soils in the Loess Plateau: Results from Incubation Experiments. Int. J. Agric. Biol. 2012, 14, 745–750. [Google Scholar]
- Mahmoodabadi, M.; Yazdanpanah, N.; Sinobas, L.R.; Pazira, E.; Neshat, A. Reclamation of Calcareous Saline Sodic Soil with Different Amendments (I): Redistribution of Soluble Cations within the Soil Profile. Agric. Water Manag. 2013, 120, 30–38. [Google Scholar] [CrossRef]
- Kuncoro, P.H.; Koga, K.; Satta, N.; Muto, Y. A Study on the Effect of Compaction on Transport Properties of Soil Gas and Water. II: Soil Pore Structure Indices. Soil Tillage Res. 2014, 143, 180–187. [Google Scholar] [CrossRef]
- Eibisch, N.; Durner, W.; Bechtold, M.; Helfrich, M.; Fub, R.; Mikutta, R.; Woche, S.K. Does Water Repellency of Pyrochars and Hydrochars Counter Their Positive Effects on Soil Hydraulic Properties? Geoderma 2015, 245–246, 31–39. [Google Scholar] [CrossRef]
- Ajayi, A.E.; Horn, R. Biochar-Induced Changes in Soil Resilience: Effects of Soil Texture and Biochar Dosage. Pedosphere 2017, 27, 236–247. [Google Scholar] [CrossRef]
- Artiola, J.F.; Rasmussen, C.; Freitas, R. Effects of a Biochar-Amended Alkaline Soil on the Growth of Romaine Lettuce and Bermudagrass. Soil Sci. 2012, 177, 561–570. [Google Scholar] [CrossRef]
- Grattan, S.; Grieve, C.M. Salinity-Mineral Nutrient Relations in Horticultural Crops. Sci. Hortic. 1998, 78, 127–157. [Google Scholar] [CrossRef]
- Hussain, M.; Farooq, M.; Nawaz, A.; Al-Sadi, A.M.; Solaiman, Z.M.; Alghamdi, S.S.; Ammara, U.; Ok, Y.S.; Siddique, K.H. Biochar for Crop Production: Potential Benefits and Risks. J. Soils Sediments 2017, 17, 685–716. [Google Scholar] [CrossRef]
- Farhangi-Abriz, S.; Torabian, S. Biochar Increased Plant Growth-Promoting Hormones and Helped to Alleviates Salt Stress in Common Bean Seedlings. J. Plant Growth Regul. 2018, 37, 591–601. [Google Scholar] [CrossRef]
- Rondon, M.A.; Lehmann, J.; Ramírez, J.; Hurtado, M. Biological Nitrogen Fixation by Common Beans (Phaseolus vulgaris L.) Increases with Bio-Char Additions. Biol. Fertil. Soils 2007, 43, 699–708. [Google Scholar] [CrossRef]
- Egamberdieva, D.; Zoghi, Z.; Nazarov, K.; Wirth, S.; Bellingrath-Kimura, S.D. Plant Growth Response of Broad Bean (Vicia faba L.) to Biochar Amendment of Loamy Sand Soil under Irrigated and Drought Conditions. Environ. Sustain. 2020, 3, 319–324. [Google Scholar] [CrossRef]
- Jeffery, S.; Verheijen, F.G.; van der Velde, M.; Bastos, A.C. A Quantitative Review of the Effects of Biochar Application to Soils on Crop Productivity Using Meta-Analysis. Agric. Ecosyst. Environ. 2011, 144, 175–187. [Google Scholar] [CrossRef]
- Mukherjee, A.; Lal, R. The Biochar Dilemma. Soil Res. 2014, 52, 217–230. [Google Scholar] [CrossRef]
- Prapagdee, S.; Tawinteung, N. Effects of Biochar on Enhanced Nutrient Use Efficiency of Green Bean, Vigna radiata L. Environ. Sci. Pollut. Res. 2017, 24, 9460–9467. [Google Scholar] [CrossRef] [PubMed]
- Idowu, J.; Flynn, R. Understanding Soil Health for Production Agriculture in New Mexico; NM State University, Cooperative Extension Service: Las Cruces, NM, USA, 2013. [Google Scholar]
- Soil Survey Staff. Keys to Soil Taxonomy; Natural Resources Conservation Service and Agriculture Department: Washington, DC, USA, 2014. [Google Scholar]
- Rajkovich, S.; Enders, A.; Hanley, K.; Hyland, C.; Zimmerman, A.R.; Lehmann, J. Corn Growth and Nitrogen Nutrition after Additions of Biochars of Various Properties to a Temperate Soil. Biol. Fertil. Soils 2012, 48, 271–284. [Google Scholar] [CrossRef]
- Rhoades, J.D. Soluble Salts. In Methods of Soil Analysis, Part 2; Miller, R.H., Keeney, D.R., Eds.; SSSA, ASA: Madison, WI, USA, 1982; pp. 168–170. [Google Scholar]
- Lindsay, W.L.; Norvell, W.A. Development of a DTPA Soil Test for Zinc, Iron, Manganese and Copper. Soil Sci. Soc. Am. J. 1978, 42, 421–428. [Google Scholar] [CrossRef]
- Walkley, A.; Black, I.A. An Examination of Degtjareff Method for Determining Soil Organic Matter and a Proposed Modification of the Chromic Acid Titration Method. Soil Sci. 1934, 37, 29–38. [Google Scholar] [CrossRef]
- Olsen, S.R.; Sommers, I.E. Phosphorus. In Methods of Soil Analysis, Part 2; Miller, R.H., Keeney, D.R., Eds.; SSSA, ASA: Madison, WI, USA, 1982; pp. 421–422. [Google Scholar]
- Weil, R.R.; Islam, K.R.; Stine, M.A.; Gruver, J.B.; Samson-Liebig, S.E. Estimating Active Carbon for Soil Quality Assessment: A Simplified Method for Laboratory and Field Use. Am. J. Altern. Agric. 2003, 18, 3–17. [Google Scholar]
- Idowu, O.J.; Kircher, P. Soil Quality of Semi-Arid Conservation Reserve Program Lands in Eastern New Mexico. Arid Land Res. Manag. 2016, 30, 153–165. [Google Scholar] [CrossRef]
- Ogden, C.B.; Van Es, H.M.; Schindelbeck, R.R. Miniature Rain Simulator for Field Measurement of Soil Infiltration. Soil Sci. Soc. Am. J. 1997, 61, 1041–1043. [Google Scholar] [CrossRef]
- IBM Corp. IBM SPSS Statistics for Windows, Version 26.0; IBM Corp.: Armonk, NY, USA, 2019. [Google Scholar]
- Diatta, A.A.; Fike, J.H.; Battaglia, M.L.; Galbraith, J.M.; Baig, M.B. Effects of Biochar on Soil Fertility and Crop Productivity in Arid Regions: A Review. Arab. J. Geosci. 2020, 13, 595. [Google Scholar] [CrossRef]
- Castro, A.; da Silva Batista, N.; Latawiec, A.E.; Rodrigues, A.; Strassburg, B.; Silva, D.; Araujo, E.; De Moraes, L.F.D.; Guerra, J.G.; Galvão, G. The Effects of Gliricidia-Derived Biochar on Sequential Maize and Bean Farming. Sustainability 2018, 10, 578. [Google Scholar] [CrossRef] [Green Version]
- Lima, J.R.D.S.; Goes, M.D.C.C.D.; Hammecker, C.; Antonino, A.C.D.; Medeiros, É.V.D.; Sampaio, E.V.D.S.B.; Leite, M.C.D.B.S.; Silva, V.P.D.; de Souza, E.S.; Souza, R. Effects of Poultry Manure and Biochar on Acrisol Soil Properties and Yield of Common Bean. A Short-Term Field Experiment. Agriculture 2021, 11, 290. [Google Scholar] [CrossRef]
- Al-Wabel, M.I.; Hussain, Q.; Usman, A.R.; Ahmad, M.; Abduljabbar, A.; Sallam, A.S.; Ok, Y.S. Impact of Biochar Properties on Soil Conditions and Agricultural Sustainability: A Review. Land Degrad. Dev. 2018, 29, 2124–2161. [Google Scholar] [CrossRef]
- Fischer, B.M.; Manzoni, S.; Morillas, L.; Garcia, M.; Johnson, M.S.; Lyon, S.W. Improving Agricultural Water Use Efficiency with Biochar–A Synthesis of Biochar Effects on Water Storage and Fluxes across Scales. Sci. Total Environ. 2019, 657, 853–862. [Google Scholar] [CrossRef] [PubMed]
- Razzaghi, F.; Obour, P.B.; Arthur, E. Does Biochar Improve Soil Water Retention? A Systematic Review and Meta-Analysis. Geoderma 2020, 361, 114055. [Google Scholar] [CrossRef]
- Kumar, N.; Hazra, K.K.; Nath, C.P.; Praharaj, C.S.; Singh, U. Grain Legumes for Resource Conservation and Agricultural Sustainability in South Asia. In Legumes for Soil Health and Sustainable Management; Springer: Singapore, 2018; pp. 77–107. [Google Scholar]
- Bai, Z.; Caspari, T.; Gonzalez, M.R.; Batjes, N.H.; Mäder, P.; Bünemann, E.K.; de Goede, R.; Brussaard, L.; Xu, M.; Ferreira, C.S.S.; et al. Effects of Agricultural Management Practices on Soil Quality: A Review of Long-Term Experiments for Europe and China. Agric. Ecosyst. Environ. 2018, 265, 1–7. [Google Scholar] [CrossRef]
- Clark, A. Managing Cover Crops Profitably, 3rd ed.; Sustainable Agriculture Network: Beltsville, MD, USA, 2012. [Google Scholar]
- Magdoff, F.; Weil, R.R. Soil Organic Matter Management Strategies. In Soil Organic Matter in Sustainable Agriculture; CRC Press: Boca Raton, LA, USA, 2004; pp. 45–65. [Google Scholar]
- Bongiorno, G.; Bünemann, E.K.; Oguejiofor, C.U.; Meier, J.; Gort, G.; Comans, R.; Mäder, P.; Brussaard, L.; de Goede, R. Sensitivity of Labile Carbon Fractions to Tillage and Organic Matter Management and Their Potential as Comprehensive Soil Quality Indicators across Pedoclimatic Conditions in Europe. Ecol. Indic. 2019, 99, 38–50. [Google Scholar] [CrossRef]
- Lucas, S.; Weil, R. Can Permanganate Oxidizable Carbon Predict Soil Function Responses to Soil Organic Matter Management? Soil Sci. Soc. Am. J. 2021, 85, 1768–1784. [Google Scholar] [CrossRef]
- Flynn, R. Interpreting Soil Tests: Unlock the Secrets of Your Soil; Circular 676; New Mexico State University, Cooperative Extension Service: Las Cruces, NM, USA, 2015. [Google Scholar]
Figure 1.
Monthly mean air temperature (°C) (lines) and rainfall (cm) (bars) in 2017 and 2018 recorded at Leyendecker Plant Science Center.
Figure 1.
Monthly mean air temperature (°C) (lines) and rainfall (cm) (bars) in 2017 and 2018 recorded at Leyendecker Plant Science Center.

Figure 2.
(A–D) Plant height of pinto bean during 2017 (A), 2018 (B), and plant height of sorghum–Sudan during 2017 (C) and 2018 (D) cropping seasons. Biochar rates for pinto bean: 0 Mg ha−1 (R0), 2.2 Mg ha−1 (R1), and 11.2 Mg ha−1 (R2). Biochar rates for sorghum–Sudan: 0 Mg ha−1 (R0), 3.4 Mg ha−1 (R1), and 6.7 Mg ha−1 (R2).

Figure 3.
Mean values of soil Olsen P in pinto bean soil (A) and soil organic matter in sorghum–Sudan soil (B) as a function of biochar rates and sampling time. Biochar rates for pinto bean: 0 Mg ha−1 (R0), 2.2 Mg ha−1 (R1), and 11.2 Mg ha−1 (R2). Biochar rates for sorghum–Sudan: 0 Mg ha−1 (R0), 3.4 Mg ha−1 (R1), and 6.7 Mg ha−1 (R2).

Figure 4.
(A–D) Soil volumetric moisture content as a function of biochar rates before irrigation and for six successive days after irrigation in pinto bean 2017 (A), pinto bean 2018 (B), sorghum–Sudan 2017 (C), and sorghum–Sudan 2018 (D). Day = 0: the day before irrigation; Day = 1: irrigation took place; Day = 2, 3, 4, 5, 6: successive days after irrigation. Biochar rates for pinto bean: 0 Mg ha−1 (R0), 2.2 Mg ha−1 (R1), and 11.2 Mg ha−1 (R2). Biochar rates for sorghum–Sudan: 0 Mg ha−1 (R0), 3.4 Mg ha−1 (R1), and 6.7 Mg ha−1 (R2). a, b, c: bars with different letters indicate significant treatment difference within a given day at p ≤ 0.05, ns: no significant treatment difference.


Table 1.
Chemical and physical properties of biochar produced from lodgepole pine feedstock.
| Year | 2017 | 2018 |
|---|---|---|
| Moisture 1 (% wet wt.) | 6.2 | 30.5 |
| Organic Carbon 2 (% tot. dry mass) | 89.5 | 86.2 |
| Bulk Density 3 (g cm−3) | 0.13 | 0.08 |
| Total Ash 1 (% tot. dry mass) | 1.6 | 5.1 |
| Electrical Conductivity 3 (dS m−1) | 0.23 | 1.86 |
| pH 3 | 8.43 | 9.35 |
| Surface Area 4 (m2 g−1) | 308 | 567 |
1 Determined using ASTM D1762-84; 2 Calculated as total C—inorganic C for total C by dry combustion-IR detection and inorganic C determined using ASTM D4373; 3 Determined using modifications from [26]: dilution of 1:20 biochar: deionized H2O (w:v) and equilibration at 90 min on shaker; 4 Determined using ASTM D6556.
Table 2.
Mean values of sorghum–Sudan dry biomass and pinto bean yield at different biochar rates and in different years.
Table 2.
Mean values of sorghum–Sudan dry biomass and pinto bean yield at different biochar rates and in different years.
| Pinto Bean | Sorghum–Sudan | |||
|---|---|---|---|---|
| Rate | Dry Biomass (kg ha−1) | Seed Yield (kg ha−1) | Harvest Index | Dry Biomass (Mg ha−1) |
| R0 | 4114.1 | 2304.7 | 0.55 | 16.47 |
| R1 | 5143.6 | 2444.0 | 0.49 | 16.37 |
| R2 | 4220.8 | 1954.5 | 0.46 | 17.47 |
| p-value | 0.697 | 0.667 | 0.503 | 0.809 |
| Year | ||||
| 2017 | 4949.6 | 2469.1 | 0.52 | 16.76 |
| 2018 | 4036.1 | 1999.7 | 0.49 | 16.78 |
| p-value | 0.182 | 0.190 | 0.577 | 0.987 |
Biochar rates for pinto bean: 0 Mg ha−1 (R0), 2.2 Mg ha−1 (R1), and 11.2 Mg ha−1 (R2). Biochar rates for sorghum–Sudan: 0 Mg ha−1 (R0), 3.4 Mg ha−1 (R1), and 6.7 Mg ha−1 (R2).
Table 3.
Analysis of variance results for the effects of biochar rate, sampling time, and their interaction on measured soil parameters under pinto bean.
Table 3.
Analysis of variance results for the effects of biochar rate, sampling time, and their interaction on measured soil parameters under pinto bean.
| Soil Measurements | Biochar Rates | Sampling Time | Biochar Rates × Sampling Time |
|---|---|---|---|
| POXC (mg kg−1) | NS | ** | NS |
| SOM (%) | NS | NS | NS |
| pH | NS | ** | NS |
| EC (dS m−1) | NS | ** | NS |
| SAR | NS | ** | NS |
| Olsen-P (mg kg−1) | NS | * | ** |
| Potassium (mg kg−1) | NS | * | NS |
| Copper (mg kg−1) | NS | ** | NS |
| Iron (mg kg−1) | NS | ** | NS |
| Manganese (mg kg−1) | NS | ** | NS |
| Zinc (mg kg−1) | NS | ** | NS |
*—significant treatment differences at p < 0.05; **—significant treatment differences at p < 0.01; NS—no significant treatment differences.
Table 4.
Means for soil properties from pinto bean plots averaged across biochar treatments and sampling times: PL-before planting, HA-after harvest.
Table 4.
Means for soil properties from pinto bean plots averaged across biochar treatments and sampling times: PL-before planting, HA-after harvest.
| Soil Measurements | Biochar Rates | Sampling Time | ||||
|---|---|---|---|---|---|---|
| R0 | R1 | R2 | 2017 PL | 2017 HA | 2018 HA | |
| POXC (mg kg−1) | 349 | 348 | 347 | 310 B | 335 B | 398 A |
| SOM (%) | 0.73 | 0.78 | 0.87 | 0.77 | 0.89 | 0.71 |
| pH | 7.92 | 7.88 | 7.83 | 7.73 B | 7.77 B | 8.13 A |
| EC (dS m−1) | 2.95 | 2.44 | 2.93 | 4.36 A | 2.45 AB | 1.52 B |
| SAR | 3.17 | 3.11 | 3.09 | 3.19 AB | 3.86 A | 2.31 B |
| Olsen-P (mg kg−1) | 10.50 | 8.56 | 9.69 | 8.97 B | 9.89 A | 9.90 A |
| Potassium (mg kg−1) | 24.2 | 26.2 | 25.1 | 27.8 A | 26.2 AB | 21.4 B |
| Copper (mg kg−1) | 0.86 | 0.94 | 0.86 | 0.92 A | 1.01 A | 0.73 B |
| Iron (mg kg−1) | 3.71 | 3.66 | 3.73 | 3.75 B | 4.34 A | 3.01 C |
| Manganese (mg kg−1) | 6.83 | 7.11 | 7.11 | 9.59 A | 8.53 B | 2.92 C |
| Zinc (mg kg−1) | 0.98 | 0.96 | 0.97 | 1.05 A | 1.02 A | 0.83 B |
A, B, C: mean values followed by the same letter within a row are not different at α = 0.05. Lowercase letters indicate differences between biochar treatments while uppercase letters indicate differences between the sampling times. Biochar rates for pinto bean: 0 Mg ha−1 (R0), 2.2 Mg ha−1 (R1), and 11.2 Mg ha−1 (R2). Biochar rates for sorghum–Sudan: 0 Mg ha−1 (R0), 3.4 Mg ha−1 (R1), and 6.7 Mg ha−1 (R2).
Table 5.
Analysis of variance results of the effects of biochar rates, sampling time, and their interaction on measured soil parameters under sorghum–Sudan.
Table 5.
Analysis of variance results of the effects of biochar rates, sampling time, and their interaction on measured soil parameters under sorghum–Sudan.
| Soil Measurements | Biochar Rates | Sampling Time | Biochar Rates × Sampling Time |
|---|---|---|---|
| POXC (mg kg−1) | NS | ** | NS |
| SOM (%) | ** | ** | * |
| pH | NS | ** | NS |
| EC (dS m−1) | NS | ** | NS |
| SAR | NS | ** | NS |
| Olsen-P (mg kg−1) | NS | NS | NS |
| Potassium (mg kg−1) | NS | ** | NS |
| Copper (mg kg−1) | NS | ** | NS |
| Iron (mg kg−1) | NS | ** | NS |
| Manganese (mg kg−1) | NS | ** | NS |
| Zinc (mg kg−1) | NS | ** | NS |
*—treatment differences at p < 0.05; **—significant treatment differences at p < 0.01; NS—no significant differences.
Table 6.
Sorghum–Sudan treatment means for soil properties averaged across biochar treatments and sampling times: PL-before planting, HA-after harvest.
Table 6.
Sorghum–Sudan treatment means for soil properties averaged across biochar treatments and sampling times: PL-before planting, HA-after harvest.
| Soil Measurements | Biochar Rates | Sampling Time | ||||
|---|---|---|---|---|---|---|
| R0 | R1 | R2 | 2017 PL | 2017 HA | 2018 HA | |
| POXC (mg kg−1) | 331 | 350 | 343 | 314 B | 307 B | 403 A |
| SOM (%) | 0.82 b | 0.78 b | 1.02 a | 0.71 B | 0.98 A | 0.94 A |
| pH | 7.88 | 7.88 | 7.85 | 7.71 B | 7.72 B | 8.18 A |
| EC (dS m−1) | 1.30 | 1.30 | 1.33 | 1.43 A | 1.59 A | 0.90 B |
| SAR | 1.57 | 1.63 | 1.58 | 2.26 A | 1.30 B | 1.22 B |
| Olsen-P (mg kg−1) | 10.31 | 9.66 | 10.11 | 9.29 | 10.29 | 10.50 |
| Potassium (mg kg−1) | 29.8 | 28.6 | 29.4 | 25.1 B | 33.3 A | 29.4 AB |
| Copper (mg kg−1) | 0.93 | 0.82 | 0.90 | 0.91 A | 1.05 A | 0.69 B |
| Iron (mg kg−1) | 4.19 | 4.46 | 4.53 | 4.19 B | 4.78 A | 4.20 B |
| Manganese (mg kg−1) | 10.30 | 9.86 | 9.38 | 9.33 A | 16.49 B | 3.72 C |
| Zinc (mg kg−1) | 0.98 | 0.92 | 0.90 | 1.03 A | 0.97 A | 0.80 B |
a, b, A, B, C: mean values followed by the same letter within a row are not different at α = 0.05. Lowercase letters indicate differences between biochar treatments while uppercase letters indicate differences between the sampling times. Biochar rates for pinto bean: 0 Mg ha−1 (R0), 2.2 Mg ha−1 (R1), and 11.2 Mg ha−1 (R2). Biochar rates for sorghum–Sudan: 0 Mg ha−1 (R0), 3.4 Mg ha−1 (R1), and 6.7 Mg ha−1 (R2).
Table 7.
Soil physical measurements at different biochar rates before planting (PL) and after harvest (HA) in 2018.
Table 7.
Soil physical measurements at different biochar rates before planting (PL) and after harvest (HA) in 2018.
| Pinto Bean | |||||||
|---|---|---|---|---|---|---|---|
| Biochar Rates | Sampling Time | ||||||
| R0 | R1 | R2 | p-Value | 2018 PL | 2018 HA | p-Value | |
| MWD (mm) | 0.149 | 0.149 | 0.165 | 0.068 | 0.147 B | 0.163 A | 0.018 * |
| AGG > 2 mm (%) | 1.42 | 1.48 | 2.05 | 0.125 | 1.27 B | 2.04 A | 0.005 ** |
| WAS (%) | 23.05 | 22.97 | 26.66 | 0.677 | 23.77 | 24.68 | 0.596 |
| Sorghum–Sudan | |||||||
| Biochar Rates | Sampling Time | ||||||
| R0 | R1 | R2 | p-value | 2018 PL | 2018 HA | p-value | |
| MWD (mm) | 0.147 | 0.156 | 0.154 | 0.391 | 0.143 B | 0.162 A | 0.003 ** |
| AGG > 2 mm (%) | 1.15 | 1.41 | 1.42 | 0.379 | 0.81 B | 1.83 A | 0.0001 ** |
| WAS (%) | 15.43 | 14.50 | 15.39 | 0.511 | 15.53 | 14.69 | 0.456 |
MWD: mean weight diameter; AGG > 2 mm: dry aggregates larger than 2 mm; WAS: wet aggregate stability. A, B: mean values followed by the same letter within a row are not different at α = 0.05. *—treatment differences at p < 0.05; **—significant treatment differences at p < 0.01.
Disclaimer/Publisher’s Note: The statements, opinions and data contained in all publications are solely those of the individual author(s) and contributor(s) and not of MDPI and/or the editor(s). MDPI and/or the editor(s) disclaim responsibility for any injury to people or property resulting from any ideas, methods, instructions or products referred to in the content. |
© 2023 by the authors. Licensee MDPI, Basel, Switzerland. This article is an open access article distributed under the terms and conditions of the Creative Commons Attribution (CC BY) license (https://creativecommons.org/licenses/by/4.0/).
Share and Cite
MDPI and ACS Style
Keller, L.; Idowu, O.J.; Ulery, A.; Omer, M.; Brewer, C.E. Short-Term Biochar Impacts on Crop Performance and Soil Quality in Arid Sandy Loam Soil. Agriculture 2023, 13, 782. https://doi.org/10.3390/agriculture13040782
AMA Style
Keller L, Idowu OJ, Ulery A, Omer M, Brewer CE. Short-Term Biochar Impacts on Crop Performance and Soil Quality in Arid Sandy Loam Soil. Agriculture. 2023; 13(4):782. https://doi.org/10.3390/agriculture13040782
Chicago/Turabian StyleKeller, Lindsay, Omololu John Idowu, April Ulery, Mohammed Omer, and Catherine E. Brewer. 2023. "Short-Term Biochar Impacts on Crop Performance and Soil Quality in Arid Sandy Loam Soil" Agriculture 13, no. 4: 782. https://doi.org/10.3390/agriculture13040782
Note that from the first issue of 2016, this journal uses article numbers instead of page numbers. See further details here.