Article

Development of an N-Free Culture Solution for Cultivation of Nodulated Soybean with Less pH Fluctuation by the Addition of Potassium Bicarbonate

1
Department of Agricultural Chemistry, Faculty of Applied Biosciences, Tokyo University of Agriculture, Tokyo 156-8502, Japan
2
Faculty of Bioresource Sciences, Akita Prefectural University, Akita 010-0195, Japan
*
Author to whom correspondence should be addressed.
Agriculture 2023, 13(3), 739; https://doi.org/10.3390/agriculture13030739
Submission received: 26 January 2023 / Revised: 11 March 2023 / Accepted: 20 March 2023 / Published: 22 March 2023
(This article belongs to the Special Issue Advances in Legume Nitrogen Fixation in Agroecosystems)

Abstract

:
Soybean plants can grow by solely depending on fixed N2 through their root nodules, a symbiotic organ with rhizobia. In this study, when nodulated soybeans were cultivated using hydroponics and an N-free culture solution, the pH rapidly decreased to 4.0, which may be harmful for root growth and nutrient absorption. Therefore, we prepared a new N-free culture solution characterized by less pH fluctuation due to the addition of potassium bicarbonate. A total of 1–2 mM sodium bicarbonate optimized the pH between 6 and 7. However, the solution pH increased to 8–9 during soybean cultivation when 5–20 mM of sodium bicarbonate was applied. The addition of potassium bicarbonate did not affect the dry weight of each organ. The evapotranspiration rate of the plants with bicarbonate on the 37th day after planting was higher than that of the control without bicarbonate. When the K2SO4 was replaced by KHCO3, the pH just after preparation ranged between 6.3 and 6.5, while that after cultivation for two days ranged frp, about 6.1 to 6.5. It was found that more than half of the bicarbonate remained in the culture solution after 3 days of cultivation. The optimum P concentrations for the modified culture solution were found to be 50 and 100 μM, while the P concentrations over 150 μM reduced the plant growth and led to yellowing in the lower leaves.

1. Introduction

Hydroponic culture is essential for research on plant nutrition and plant physiology because the compositions of nutrients can be more easily controlled in this culture compared with soil culture. In addition, the composition of nutrients can be easily altered by changing the solution. Recently, plant cultivation through hydroponics for agricultural production has become popular especially for vegetables such as tomato, cucumber, and pepper and leaf vegetables [1]. The global hydroponics crop market was estimated to be USD 37.7 billion in 2022 and is expected to reach USD 53.4 billion by 2027 [2]. Hydroponics provides faster crop growth and higher yields compared to other methods. Further, hydroponics avoids the risk of soil-borne diseases without requiring the application of pesticides [3]. Tomatoes are the largest hydroponically cultivated global crop, owing to their fast cultivation rate and their lower water requirements compared to regular tomatoes grown in the soil [3]. Indoor farmers use rock wool, perlite, or coconut coir as growing materials for tomato hydroponic cultivation. It is estimated that the European and Asia-Pacific regions will cultivate the largest quantities of tomatoes using the hydroponic method by 2028 [3].
Historically, plant cultivation through hydroponics was developed independently by Sacks and Knop around 1860 [4]. They used solutions containing the nutrient elements N, P, K, Ca, Mg, S, and Fe, which were recognized as the essential elements for plants at that time. During the 20th century, other essential elements, the micronutrients Mn, B, Zn, Cu, Mo, Cl, and Ni, were discovered [5]. Hoagland and Arnon prepared two types of culture solutions with B, Mn, Zn, Cu, and Mo; one contained N only in the form of NO3, and the other used both NH4+ and NO3 to prevent pH fluctuation during cultivation.
In addition to the concentrations of nutrients, the pH of a culture solution affects plant growth, especially root growth and nutrition absorption, so the solution pH should be kept within an adequate range. Generally, plants grow well at pH 5.5–6.5, but pH 5.0–5.5 is optimum for rice cultivation. The pH of a culture solution tends to decrease when N is supplied in the form of NH4+, while the pH increases when NO3 is the sole N source [5]. The pH of a culture solution needs to be adjusted through the addition of HCl or NaOH when the pH shifts out of the optimum pH range, but this is time-consuming and involves heavy labor. Ikarashi [6] used a culture solution containing NO3:NH4+ (4:1) to minimize the pH changes during cultivation.
Many studies have noted that pH affects plant growth in hydroponics. Islam et al. [7] reported that regarding the optimum pH levels of six plant species, namely ginger, cassava, maize, wheat, green bean, and tomato, these species grew in a continuously flowing nutrient solution with seven constant pH values that ranged from 3.3 to 8.5. All of these species achieved maximum or near-maximum growth in the pH range of 5.5–6.5. The roots of all the species at pH 3.3 and green bean at pH 4.0 exhibited hydrogen ion injury. Further, Kawasaki and Moritsugu [8] used an automated pH adjustment device to maintain pH values ranging from 3.6 to 6.6, which varied by ±0.1, for the cultivation of barley, rice, tomato, corn, and cucumber plants. The N forms with 5 mM NH4+ and 5 mM NO3 were compared. The growth of the plants was vigorous within the pH range of 5.4 to 6.0. Roosta and Rezaei [9] grew rose within a pH range of 4.5–8.0; the plant growth was good at pH 4.5 and 6.5 but bad at 8. Moreover, the concentrations of chlorophyll, P, Fe, Mn, and Cu were the highest at pH 6.5 and the lowest at pH 8.0.
Concerning the effect of pH on leguminous plants, Vargas and Graham [10] investigated seven cultivars of bean (Phaseolus vulgaris) in a sand culture using a culture solution with pH values of 4.5, 5.0, 5.5, and 6.0. The number and fresh weights of the nodules decreased with decreasing pH value. Harper and Nicholas [11] used an ion-exchange column to maintain the pH of a culture solution for nodulated soybean cultivation. By circulating the culture solution through the column using aeration, the solution pH fluctuated in a magnitude around 0.5–0.9 of the initial pH value of 6.5 for 2 weeks. They used a cation-exchange resin Amberlite IRC 50 in which the ratio of Ca2+:H+ was equilibrated at 8:2. This apparatus was able to maintain the pH of the culture solution at around 6.5 for 2 weeks.
The addition of buffer reagents has been used as an alternative method for maintaining a solution pH. Imsande and Ralston [12] used 1–2 mM 2-(N-morpholino)ethanesulfonic acid (MES) plus 0.1 mM phosphate for a nodulated soybean culture because a culture solution with 1 mM phosphate is toxic to a soybean plant that derives its nitrogen solely from dinitrogen fixation. Soybean plants with an N-free culture solution with 0.1 mM phosphate and 1–2 mM MES achieved excellent growth and a high rate of nitrogen-fixation activity. Five days after the change in medium, the change in the pH was −2.0 when using the solution without MES, while this ranged from −0.7 to −1.4 when the MES solution was used. On the other hand, the addition of MES to a hydroponic culture of clover (Trifolium repense) decreased its growth and nitrogen-fixation activity [13]. MES also decreased Arabidopsis’s root growth [14]. Nicholas and Harper [15] reported that the pH of a 4.0 mM MES buffered nutrient solution decreased from 6.5 to below 4.0 in 5 days with 25- to 30-day-old plants.
In this research, we used sodium bicarbonate or potassium bicarbonate for the buffering reagent of an N-free culture solution to prevent decreases in pH when cultivating nodulated soybean plants. Buffering by bicarbonate is used for pH adjustment in animal blood and CO2 discharge [16]. HCO3 is a major form of inorganic C in seawater and accounts for 90% of inorganic C [17]. On the other hand, the accumulation of bicarbonate in soil causes high pH values and Fe deficiency in crops, especially in calcareous soils in arid and semiarid regions [18]. Tang and Thomson [19] investigated the effects of the addition of 5 mM KHCO3 in 14 species of leguminous plants, and almost all plants showed decreases in their shoot growth, nodulation, and shoot N concentration.

2. Materials and Methods

2.1. Plant Cultivation

Seeds of soybean (Glycine max [L.] Merr., cv. Williams) were soaked in 70% ethanol for 30 sec and sterilized with 0.5% sodium hypochlorite solution for 5 min. Then, the seeds were thoroughly washed with tap water, inoculated with a suspension of Bradyrhizobium diazoefficience (USDA110), and planted in a vermiculite bed. At 5 DAP (days after planting), a plant seedling was transplanted into 800 mL of nitrogen-free nutrient solution [20] in a 900 mL glass bottle covered with aluminum foil with continuous aeration. Plants were cultivated in a biophotochamber (LH-350S, Nippon Medical & Chemical Instruments Co. Ltd., Osaka, Japan) under 28 °C day/18 °C night temperatures, 55% relative humidity, and a photon flux density of 228 μmol m−2 s−1 with a 16 h photoperiod and an 8 h dark period.

2.2. Composition of Culture Solution

Table 1A shows the original nutrient solution we used for soybean cultivation. The composition of this solution was based on the solution used in Dr. Harper’s laboratory at Illinois University [21,22]. We used a half strength of the original solution [20], because some Japanese cultivars showed leaf burn, possibly due to excess nutrient symptoms. When we used a half-strength solution, no such symptoms were observed. For Stock 1 of the modified solution (Table 1B), 625 μM of K2SO4 and 12.6 μM of KCl in original composition (Table 1A) were replaced by 1250 μM of KHCO3. Stocks 2 (Ca), 3 (Mg), and 4 (Fe) were the same. Stock 5 (micronutrient) concentrations were the same except for Cu. A culture solution was prepared in a bucket. A total of 10 L of distilled water was put in the bucket, and 20 mL of Stock 1 was added and mixed well. Then, 10 mL of Stocks 2, 3, 4, and 5 were added and mixed well each time. The initial pH was around 6–7, so the pH of the solution was not adjusted.

2.3. Measurement of pH

The pH of the culture solution was measured just after preparation of the culture solution as well as after plant cultivation. An aliquot of the solution was used for measurement with a pH meter (LAQUA twin B-71X, Horiba Ltd., Kyoto, Japan). The pH meter was calibrated at 6.86 and 4.01 using standard pH buffers.

2.4. Determination of Bicarbonate Concentration

The concentration of bicarbonate in the culture solution was determined by the modified method of Mishima et al. [23], in which the spectrum changes in bromocresol green (BCG) by pH were measured. The procedure was as follows. A total of 0.5 mL of 0.1 mM HCl and 19 μL of 0.04% (w/v) BCG solution was placed in a 1.5 mL microtube. Then, 30 μL of the culture solution or the standard solution was mixed and kept for 5 min. A total of 200 μL of the reaction mixture was transferred to a microplate well (96 wells with flat bottoms), and the optical absorptions at 445 nm and 616 nm were measured by a microplate reader (SSH-1000, Corona Electric Co., Ltd., Ibaraki, Japan). The standard curve was obtained using 0, 20, 40, 60, 80, 100, and 120 mg/L NaHCO3 solutions, wherein the concentration of NaHCO3 was plotted on the horizontal axis, while the ratios of the absorbance (616 nm/445 nm) were plotted on the vertical axis.

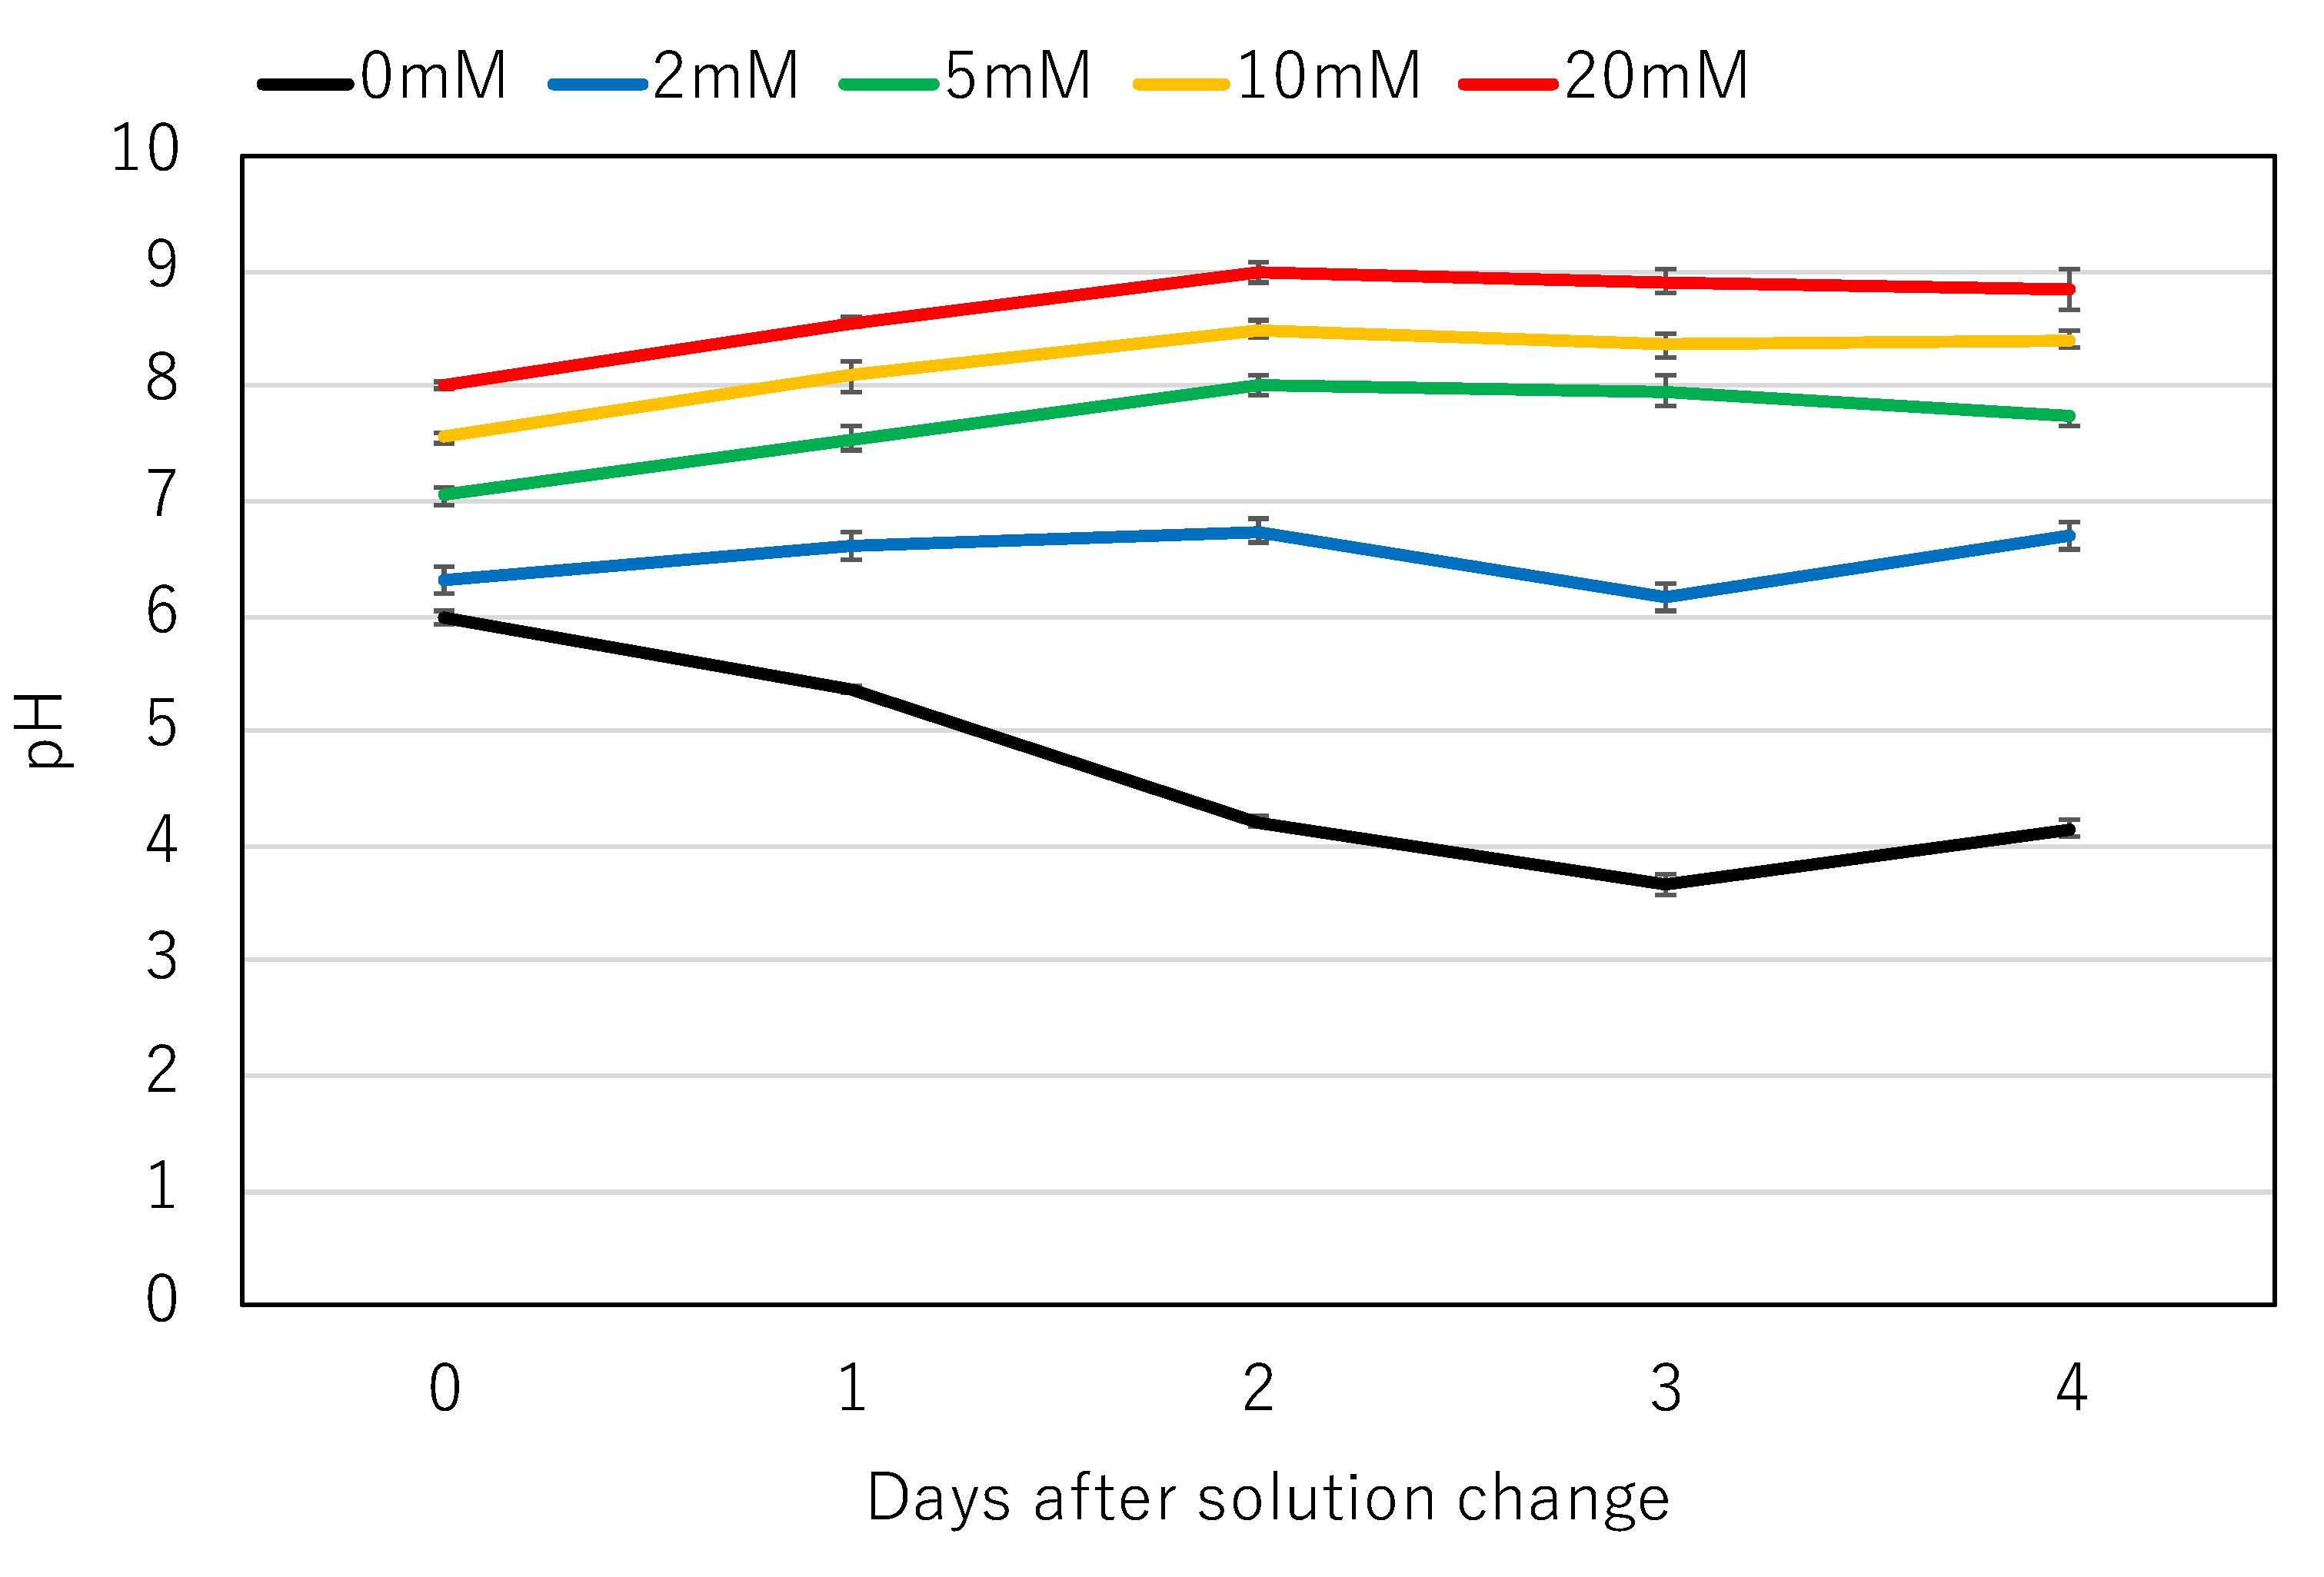
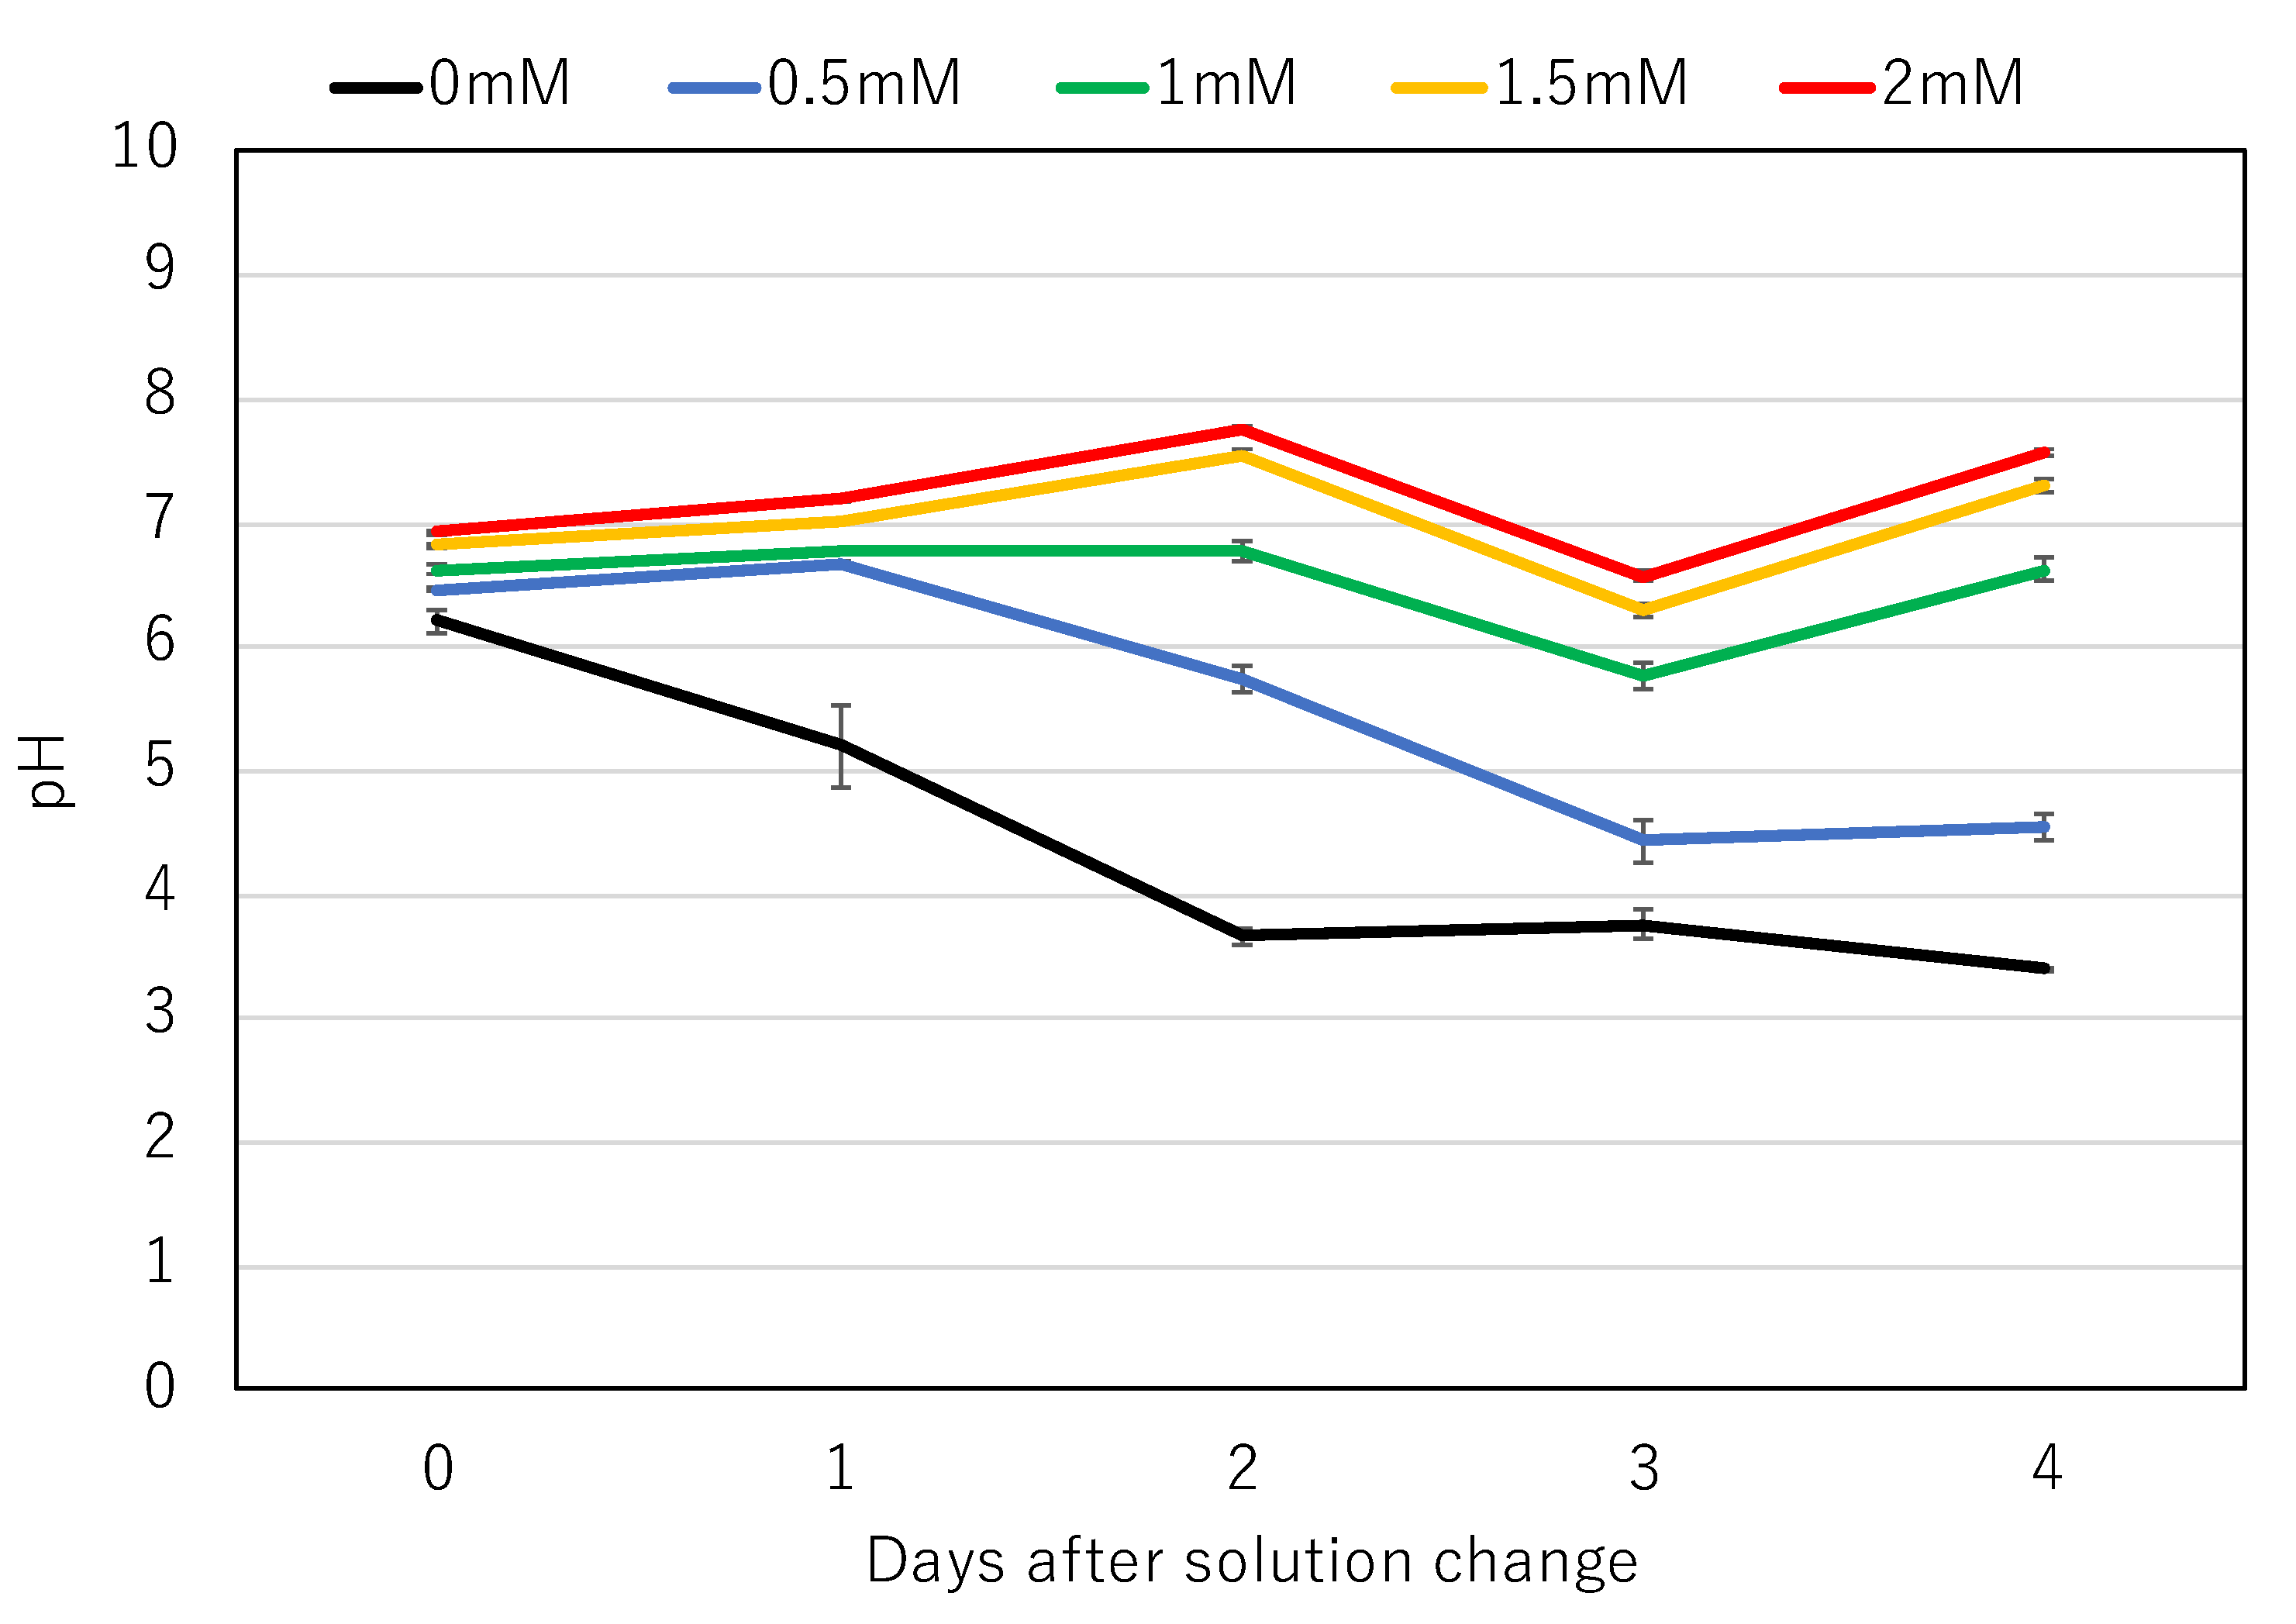
2.5. pH Changes through the Addition of Various NaHCO3 Concentrations

At first, an experiment that measured the effects of the addition of high concentrations (0, 2, 5, 10, 20 mM) of NaHCO3 on the pH changes in the culture solution cultivated between 20 and 24 DAP was conducted. Then, a similar experiment that measured the effects of low concentrations (0, 0.5, 1.0, 1.5, 2.0 mM) of NaHCO3 on the pH changes in the culture solution cultivated between 32 and 36 DAP was conducted.

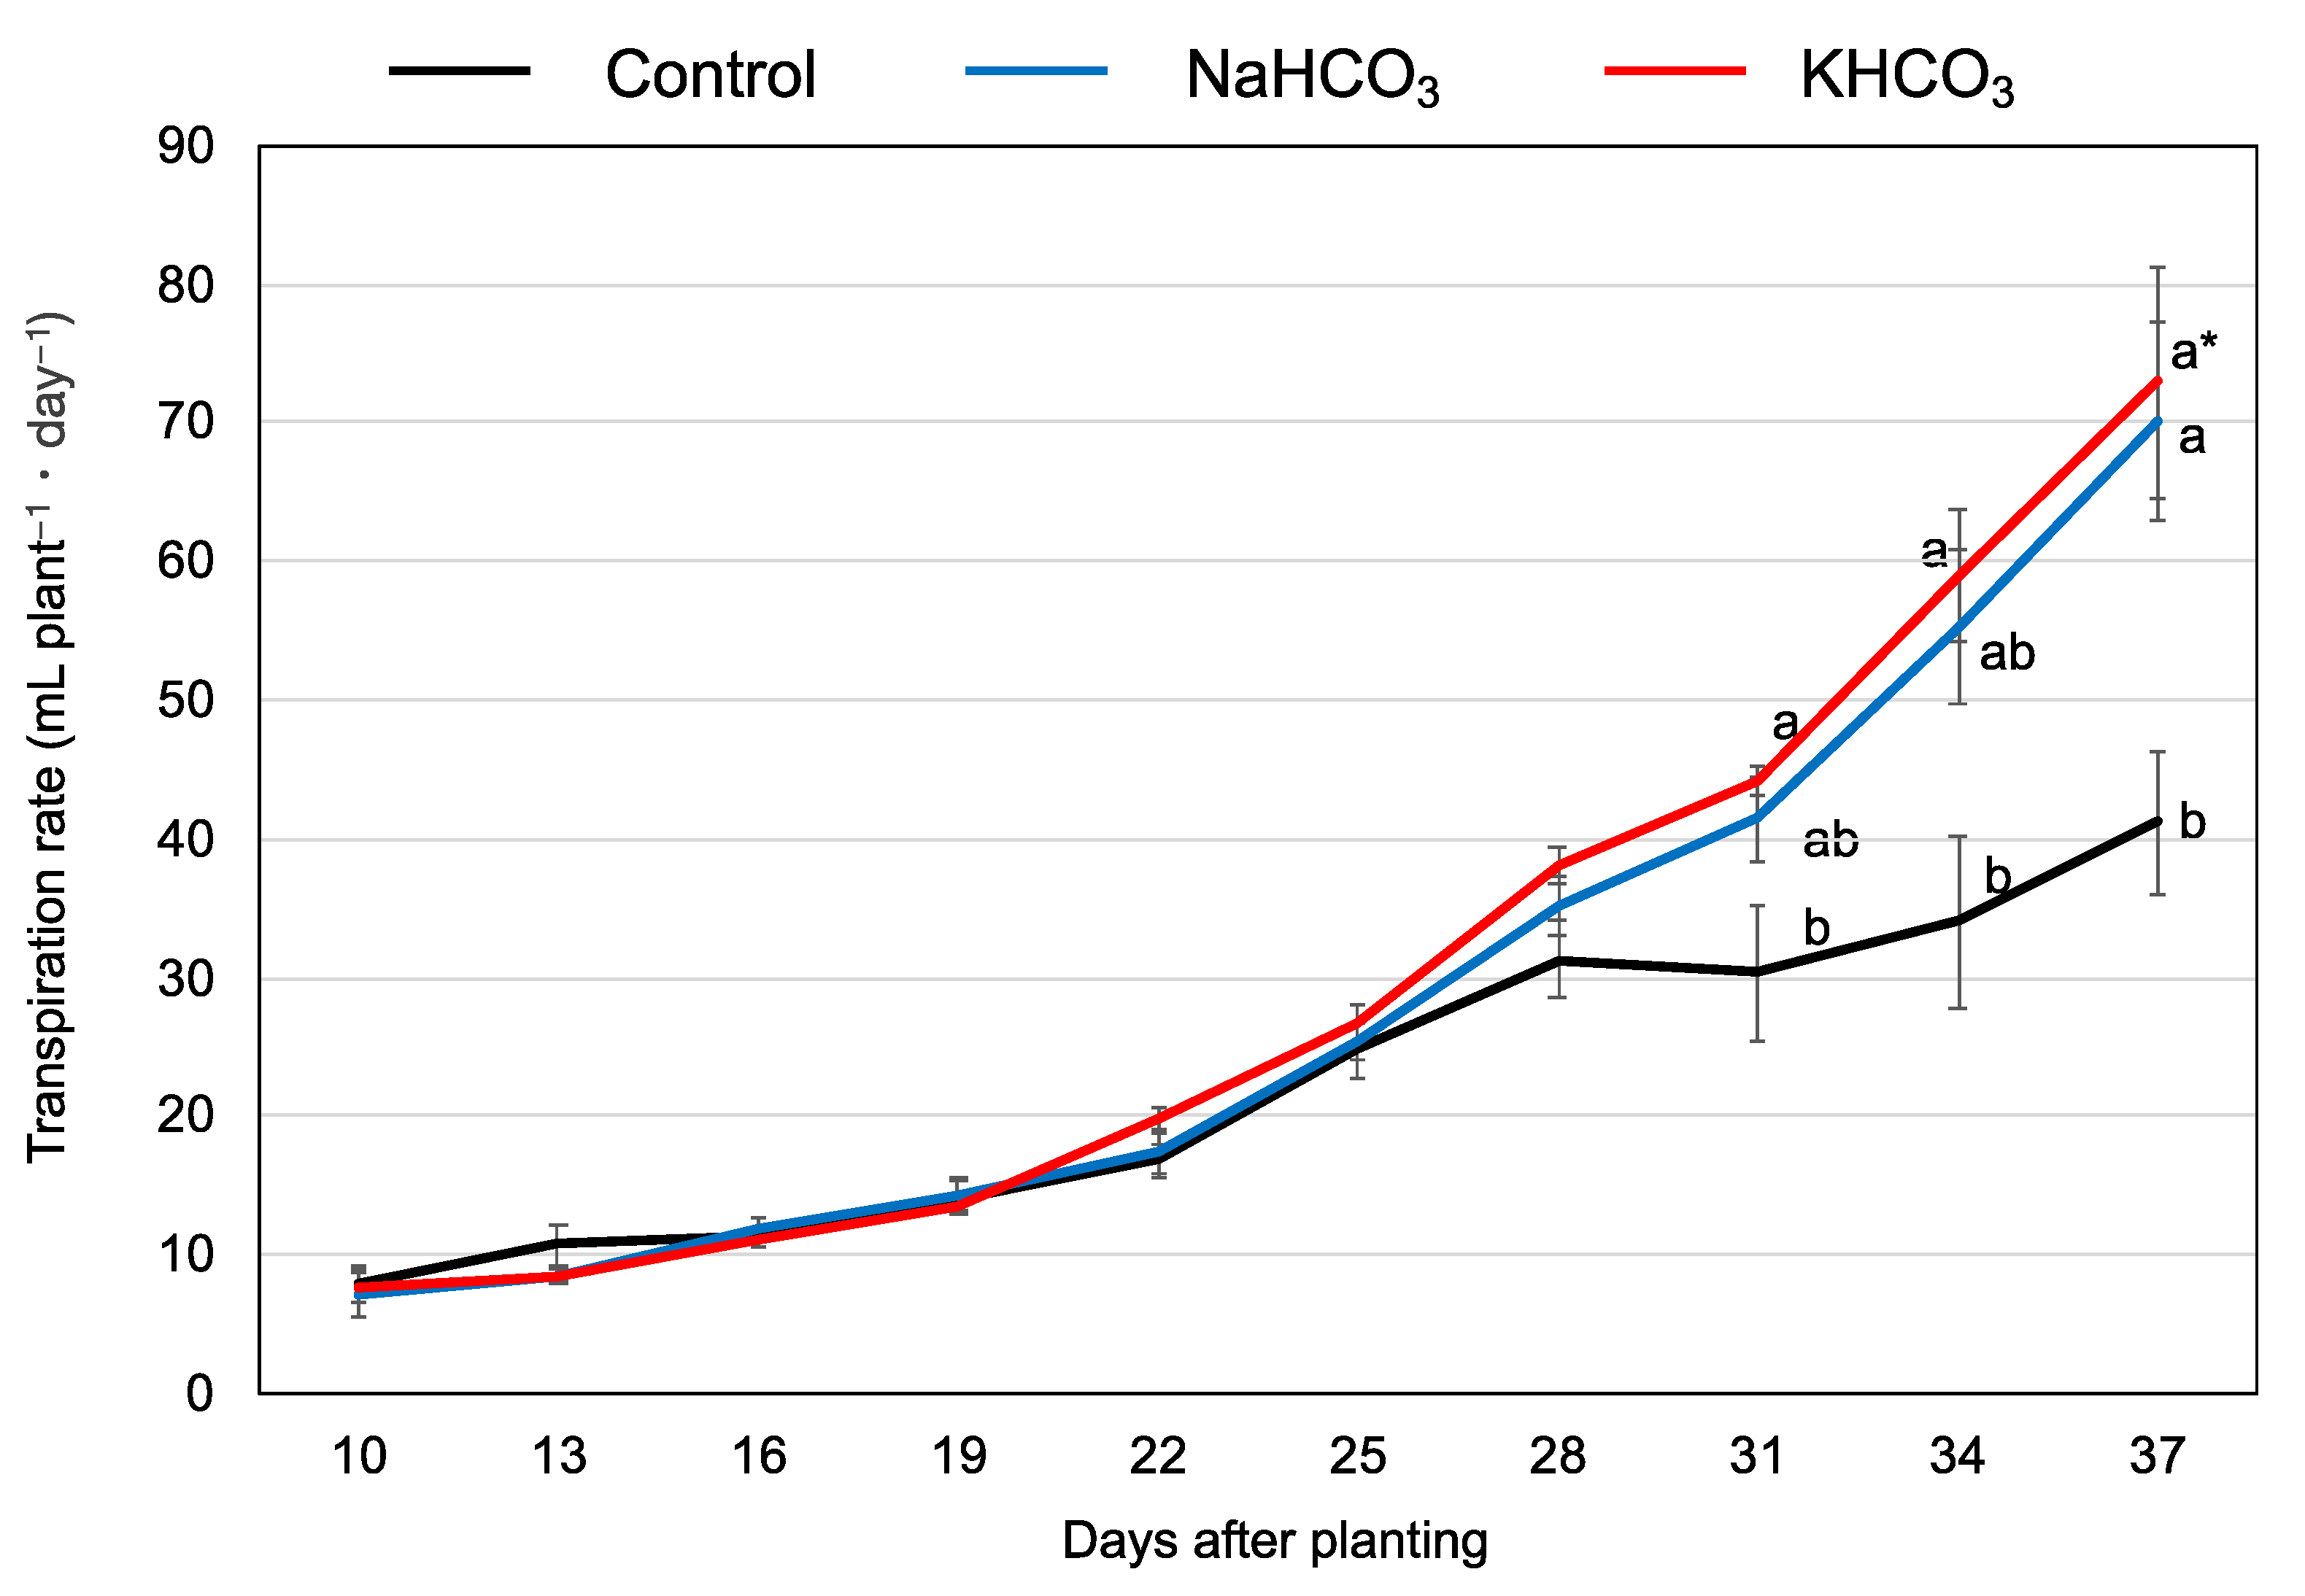
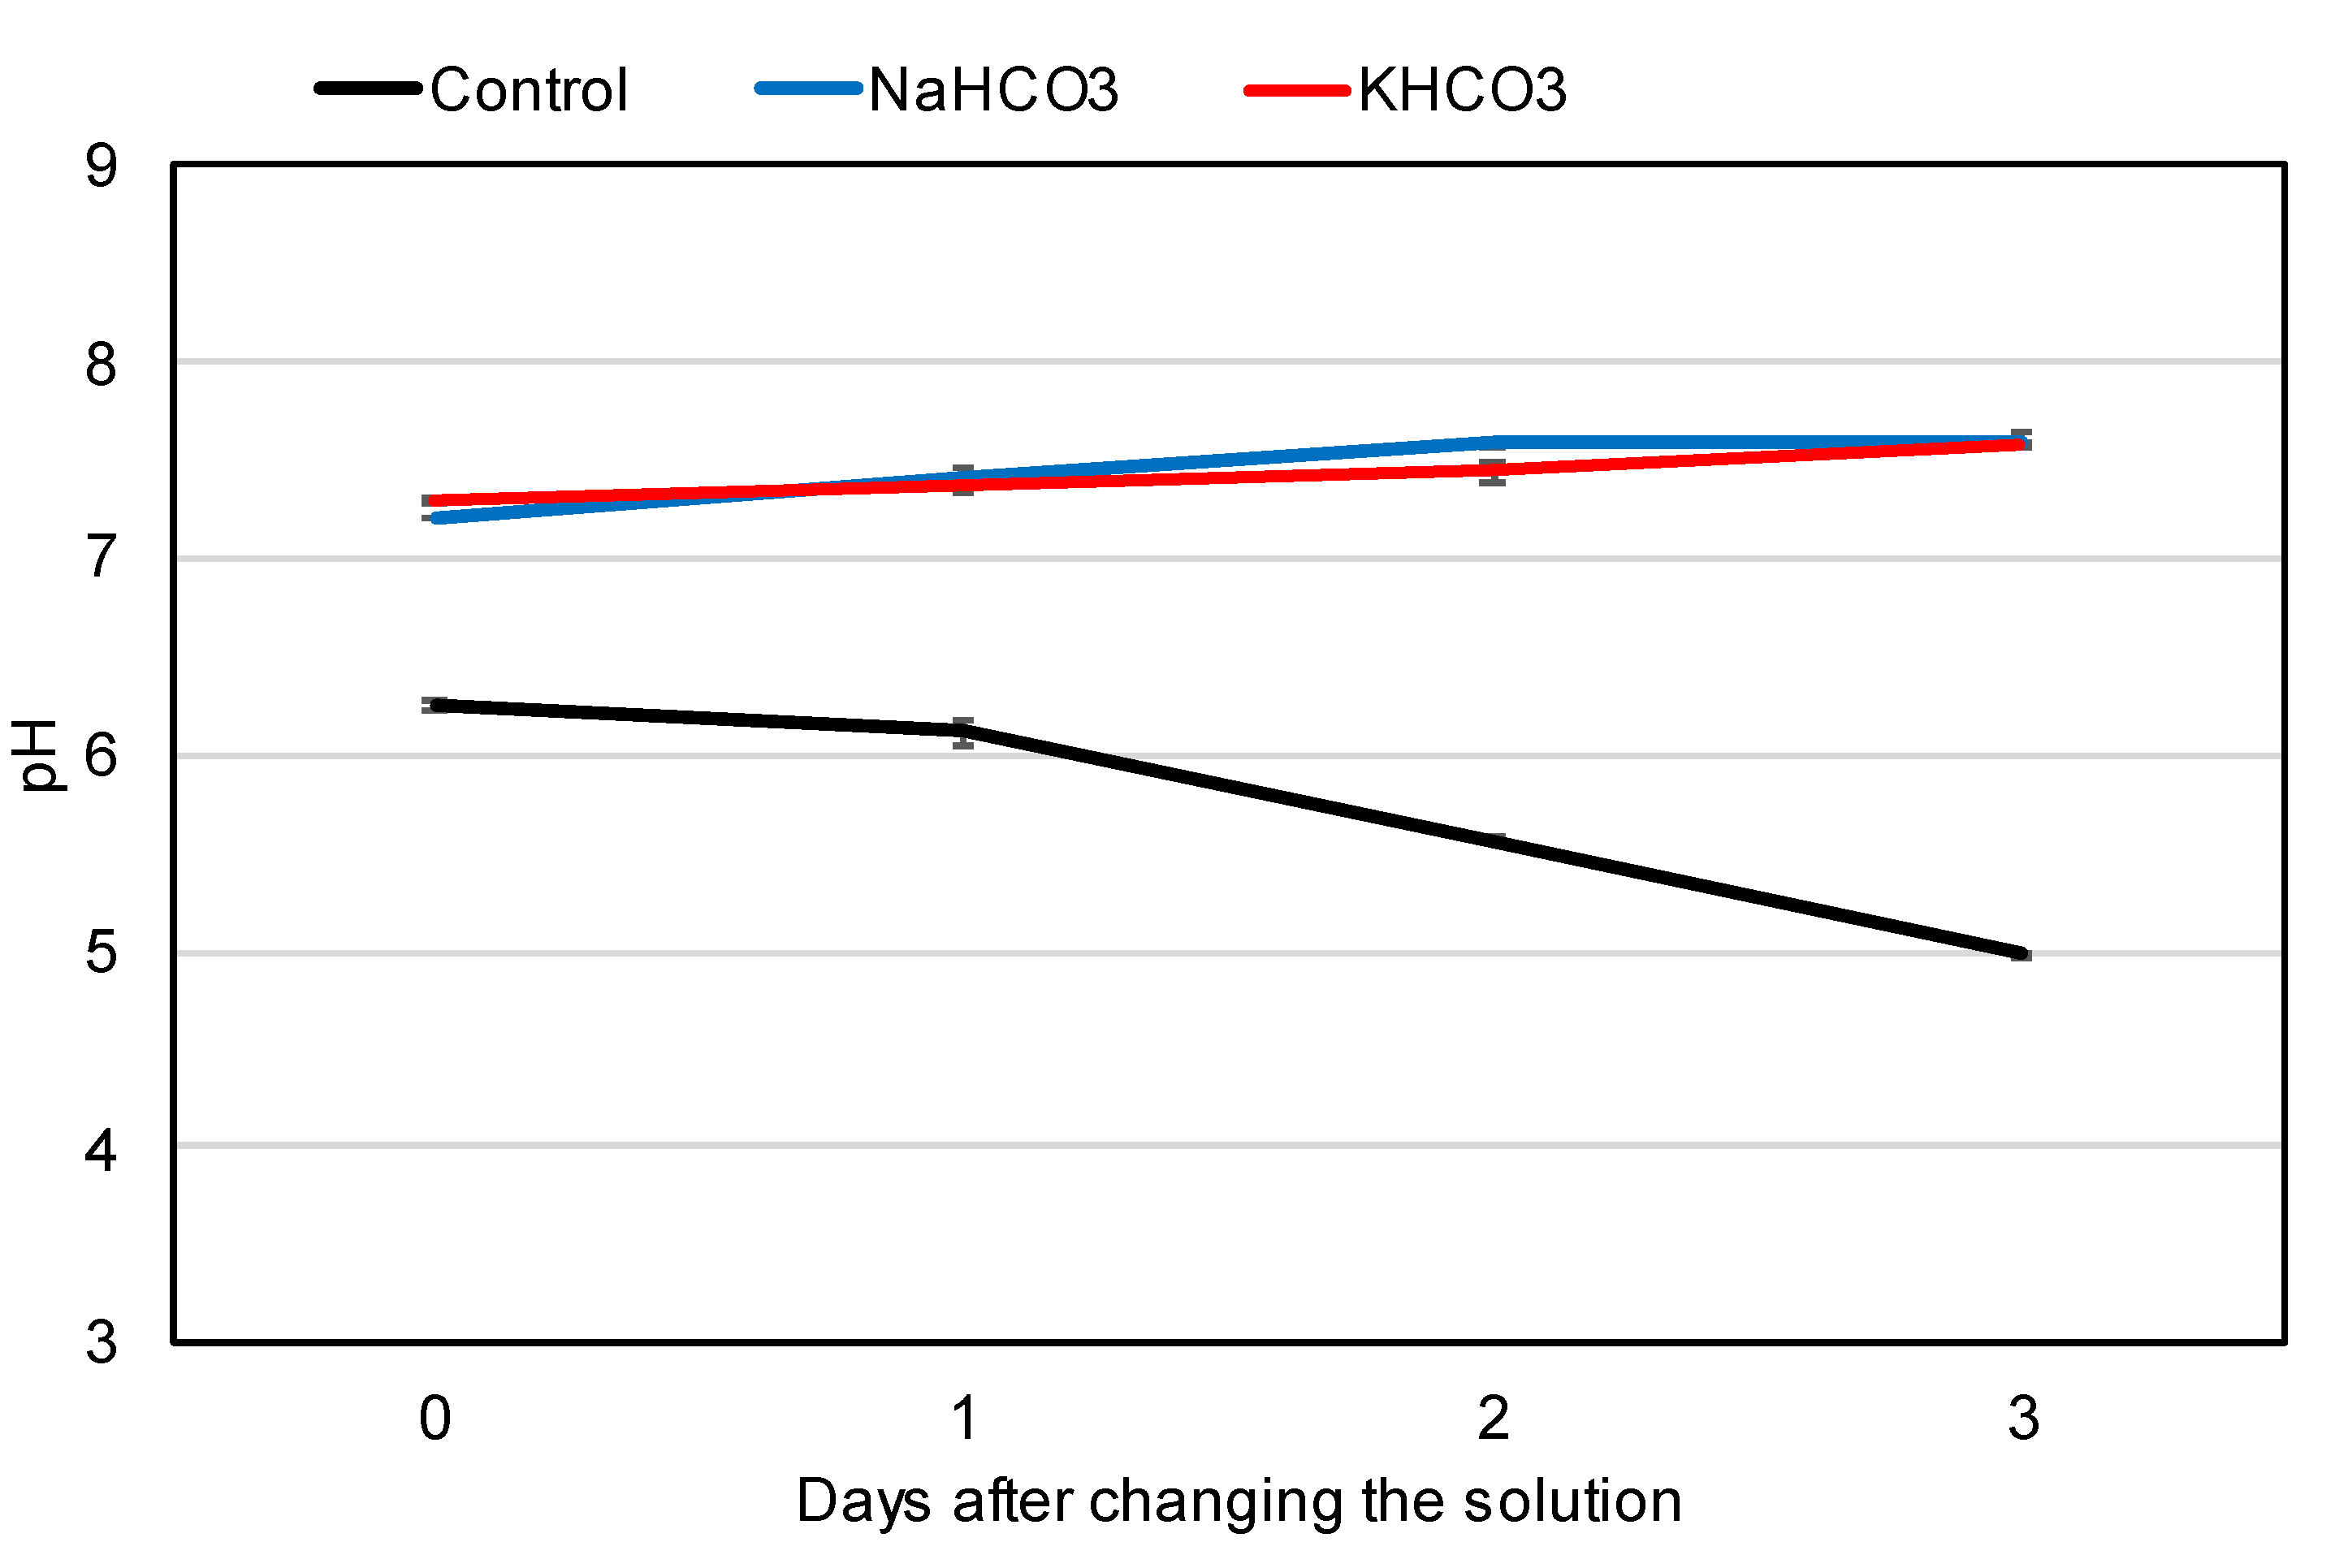
2.6. Effects of the Addition of NaHCO3 or KHCO3 on Evapotranspiration and Plant Growth

The effects of the addition of NaHCO3 or KHCO3 to the culture solution on the plant growth parameters, such as the evapotranspiration and chlorophyll contents of each leaf as well as the dry weights of the plants, were compared with control plants without bicarbonate. The 19 DAP soybean plants were cultivated with either the original solution (Table 1A) or the solutions to which 1 mM NaHCO3 or KHCO3 had been added. Evapotranspiration was measured by weighing the culture solution in the glass bottle before and after cultivation. The plants were harvested on 37 DAP, and the chlorophyll contents (SPAD values) of each leaf were measured using a chlorophyll meter (SPAD-502Plus, Konica Minolta, Japan, Inc., Tokyo, Japan). The parts of each plant were separated into the leaves, stems plus petioles, roots, and other and were dried to a constant weight in a ventilation oven at 80 °C.

2.7. Effects of P Concentrations on Soybean Growth

To determine the concentration of P suitable for a new culture solution with bicarbonate, soybean plants were cultivated with KH2PO4 concentrations of 50 μM (P50), 100 μM (P100), 150 μM (P150), 200 μM (P200), and 400 μM (P400). Soybean seeds were inoculated and germinated using the same method described in Section 2.1. The seedlings on 7 DAP were transplanted into the glass bottle with a culture solution of 50 μM K2HPO4. At 33 DAP, plants were subjected to KH2PO4 concentrations of 50, 100, 150, 200, and 400 μM for 14 days. The culture solution was changed every 3 days. Plants were harvested on 47 DAP; dried in a ventilation oven at 80 °C; separated into roots, nodules, stems plus petioles, healthy leaves, damaged leaves, and young immature leaves; and weighed. The roots, nodules, stems, healthy leaves, and damaged leaves were ground into fine powder, and 20 mg of dry powder was placed in a 1.5 mL plastic tube and extracted with 1 mL of 1% HCl solution by shaking the tube for 15 min. Then, the extract and precipitate were separated by centrifugation. The extract was dried using a centrifuge drier, and the precipitate was dissolved in 1 mL of water and then diluted to 50 mL using distilled water. Concentrations of anions and cations were determined by ion chromatography (IC-2010, Tosoh Techno-System, Inc., Tokyo, Japan) using cation column (TSKgel superIC-Anion) or anion column (TSKgel superIC-Cation). The concentrations of P in the precipitate were determined after digestion by the Kjeldahl digestion and molybdenum blue method [24].

2.8. Statistics

Experiments were conducted with 4 biological replications. Plants were cultivated using a random arrangement in a growth chamber. Statistical significance by Tukey’s test or Student’s t-test was determined using the statistical analysis program of Biomedical Statistics, Graduate School of Medicine, Osaka University.

3. Results

3.1. Changes through the Addition of Various NaHCO3 Concentrations

Figure 1 shows the effects of the addition of 0, 2, 5, 10, and 20 mM NaCO3 on the pH of the culture solution. The plants at 20 DAP were treated for 4 days. The culture solution was changed on day 0 (20 DAP) and was not changed thereafter. The pH of the culture solution without bicarbonate (0 mM) was initially 6.0 but decreased to nearly 4.0 on day 2 of the treatment period and reached 3.7 on day 3. The initial pH values increased as the NaHCO3 concentration increased: at 2, 5, 10, and 20 mM NaHCO3, these values were 6.3, 7.0, 7.6, and 8.0, respectively. Under the 2 mM NaHCO3 treatment, the pH values ranged between 6.0 and 7.0 until day 4 of the treatment. However, under the higher NaHCO3 concentrations, the pH of the culture solution increased by about +1.0 from day 0 to day 2, reaching pH values ranging between 8.0 and 9.0; the pH then remained constant from day 2 to day 4. The measurements were repeated from 24 to 28 DAP and from 28 to 32 DAP, and similar results were observed, although the decrease in pH under the 0 mM treatment became faster (data not shown).
The concentrations of NaHCO3 over 5 mM were not adequate. The effects of the lower concentrations of NaHCO3 were evaluated (Figure 2). Under the 0 mM NaHCO3 concentration, the pH of the culture solution decreased rapidly to 3.6 on day 2, then remained constant. When the culture solution with 0.5 mM NaHCO3 was used, the pH did not change on day 1 but decreased to 4.3 on day 3. The pH values ranged between 6 and 7 under the 1 mM NaHCO3 concentration. When 1.5 mM or 2.0 mM NaHCO3 was used, the pH tended to increase over the initial 2 days. From the results obtained, it is clear that 1 mM NaHCO3 was the optimum concentration under our cultivation conditions for maintaining the pH of the solution.

3.2. Effects of the Additions of NaHCO3 or KHCO3 on Evapotranspiration and Plant Growth

From the results in Figure 1 and Figure 2, it can be seen that the culture solution with 1–2 mM NaHCO3 was able to maintain the pH of the culture solution to near a neutral level. However, there is a possibility that the addition of Na or HCO3 may be toxic to or have detrimental effects on soybean growth. Therefore, long-term cultivation from 19 to 37 DAP with 1 mM NaHCO3 or KHCO3 was conducted, and the effects of this on the evapotranspiration (Figure 3) and chlorophyll contents (Table 2) of each plant and the dry weight of each plant part (Figure 4) were compared with those of the original solution without bicarbonate.
The daily evapotranspiration rates became higher during cultivation with the bicarbonate treatments, possibly due to the growth of the roots and leaves. After the treatments imposed on 19 DAP, there was no significant difference among the treatments until 28 DAP. However, from 31 to 37 DAP, the evapotranspiration rates under the NaHCO3 and KHCO3 treatments were higher than those under the control without bicarbonate.
The dry weight of the roots, stems, leaves, and other parts did not significantly differ among the treatments, including the control. However, the nodule dry weight of the plants under the NaHCO3 treatment was significantly lower than the control plants but not the KHCO3 treatment plants. Although the root dry weight did not significantly differ among the treatments (Figure 4), the evapotranspiration rates were significantly higher under the 1.0 mM NaHCO3 and KHCO3 treatments compared to those under the control treatment. This might have been due to the low pH damage that occurred in the control roots. The color of the roots was white in the NaHCO3- and KHCO3-treated plants but was brownish in the control plants’ roots.
The leaf color values of the primary leaves and the lower first to fifth leaves were higher under the NaHCO3 and KHCO3 treatments than those under the control treatment. Because all the plants depended only on N2 fixation, the higher leaf color values achieved under the NaHCO3 and KHCO3 treatments might have been due to the higher N2 fixation activities these treatments produced by stabilizing the medium pH.
Figure 5 shows the changes in the pH values of the solution with 1.0 mM NaHCO3 or KHCO3 compared with the control. The plants were cultivated using the above solution, and the changes in pH were monitored every day for 3 days from 12 to 15 DAP. Although young plants were used in this experiment, the pH of the control solution decreased from the initial pH of 6.2 to 5.0 by day 3. On the other hand, the initial pH of the solution with 1.0 mM NaHCO3 or KHCO3 was about 7.2 and tended to increase to 7.6 by day 3. The pH values did not differ between the NaHCO3 and KHCO3 treatments, indicating that buffering activities depend only on HCO3 and not on cations.
The modified culture solution is shown in Table 1B. The 1.25 mM K (0.625 mM K2SO4) used in the original solution (Table 1A) was replaced by 1.25 mM KHCO3. The soybean plants were cultivated with the modified solution, and the culture solution was changed at 23, 25, 27, and 29 DAP. The initial pH and the pH of the culture solution after cultivation were measured (Table 3). Further, the changes in the HCO3 concentration of the solution were also determined. The initial pH values ranged between 6.33 and 6.48, and the final pH values ranged between 6.15 and 6.35. The initial concentration of HCO3 ranged between 1.13 and 1.35 mM, and the final concentration decreased to a range between 0.87 and 0.97 mM but was not depleted during cultivation for 2 days.

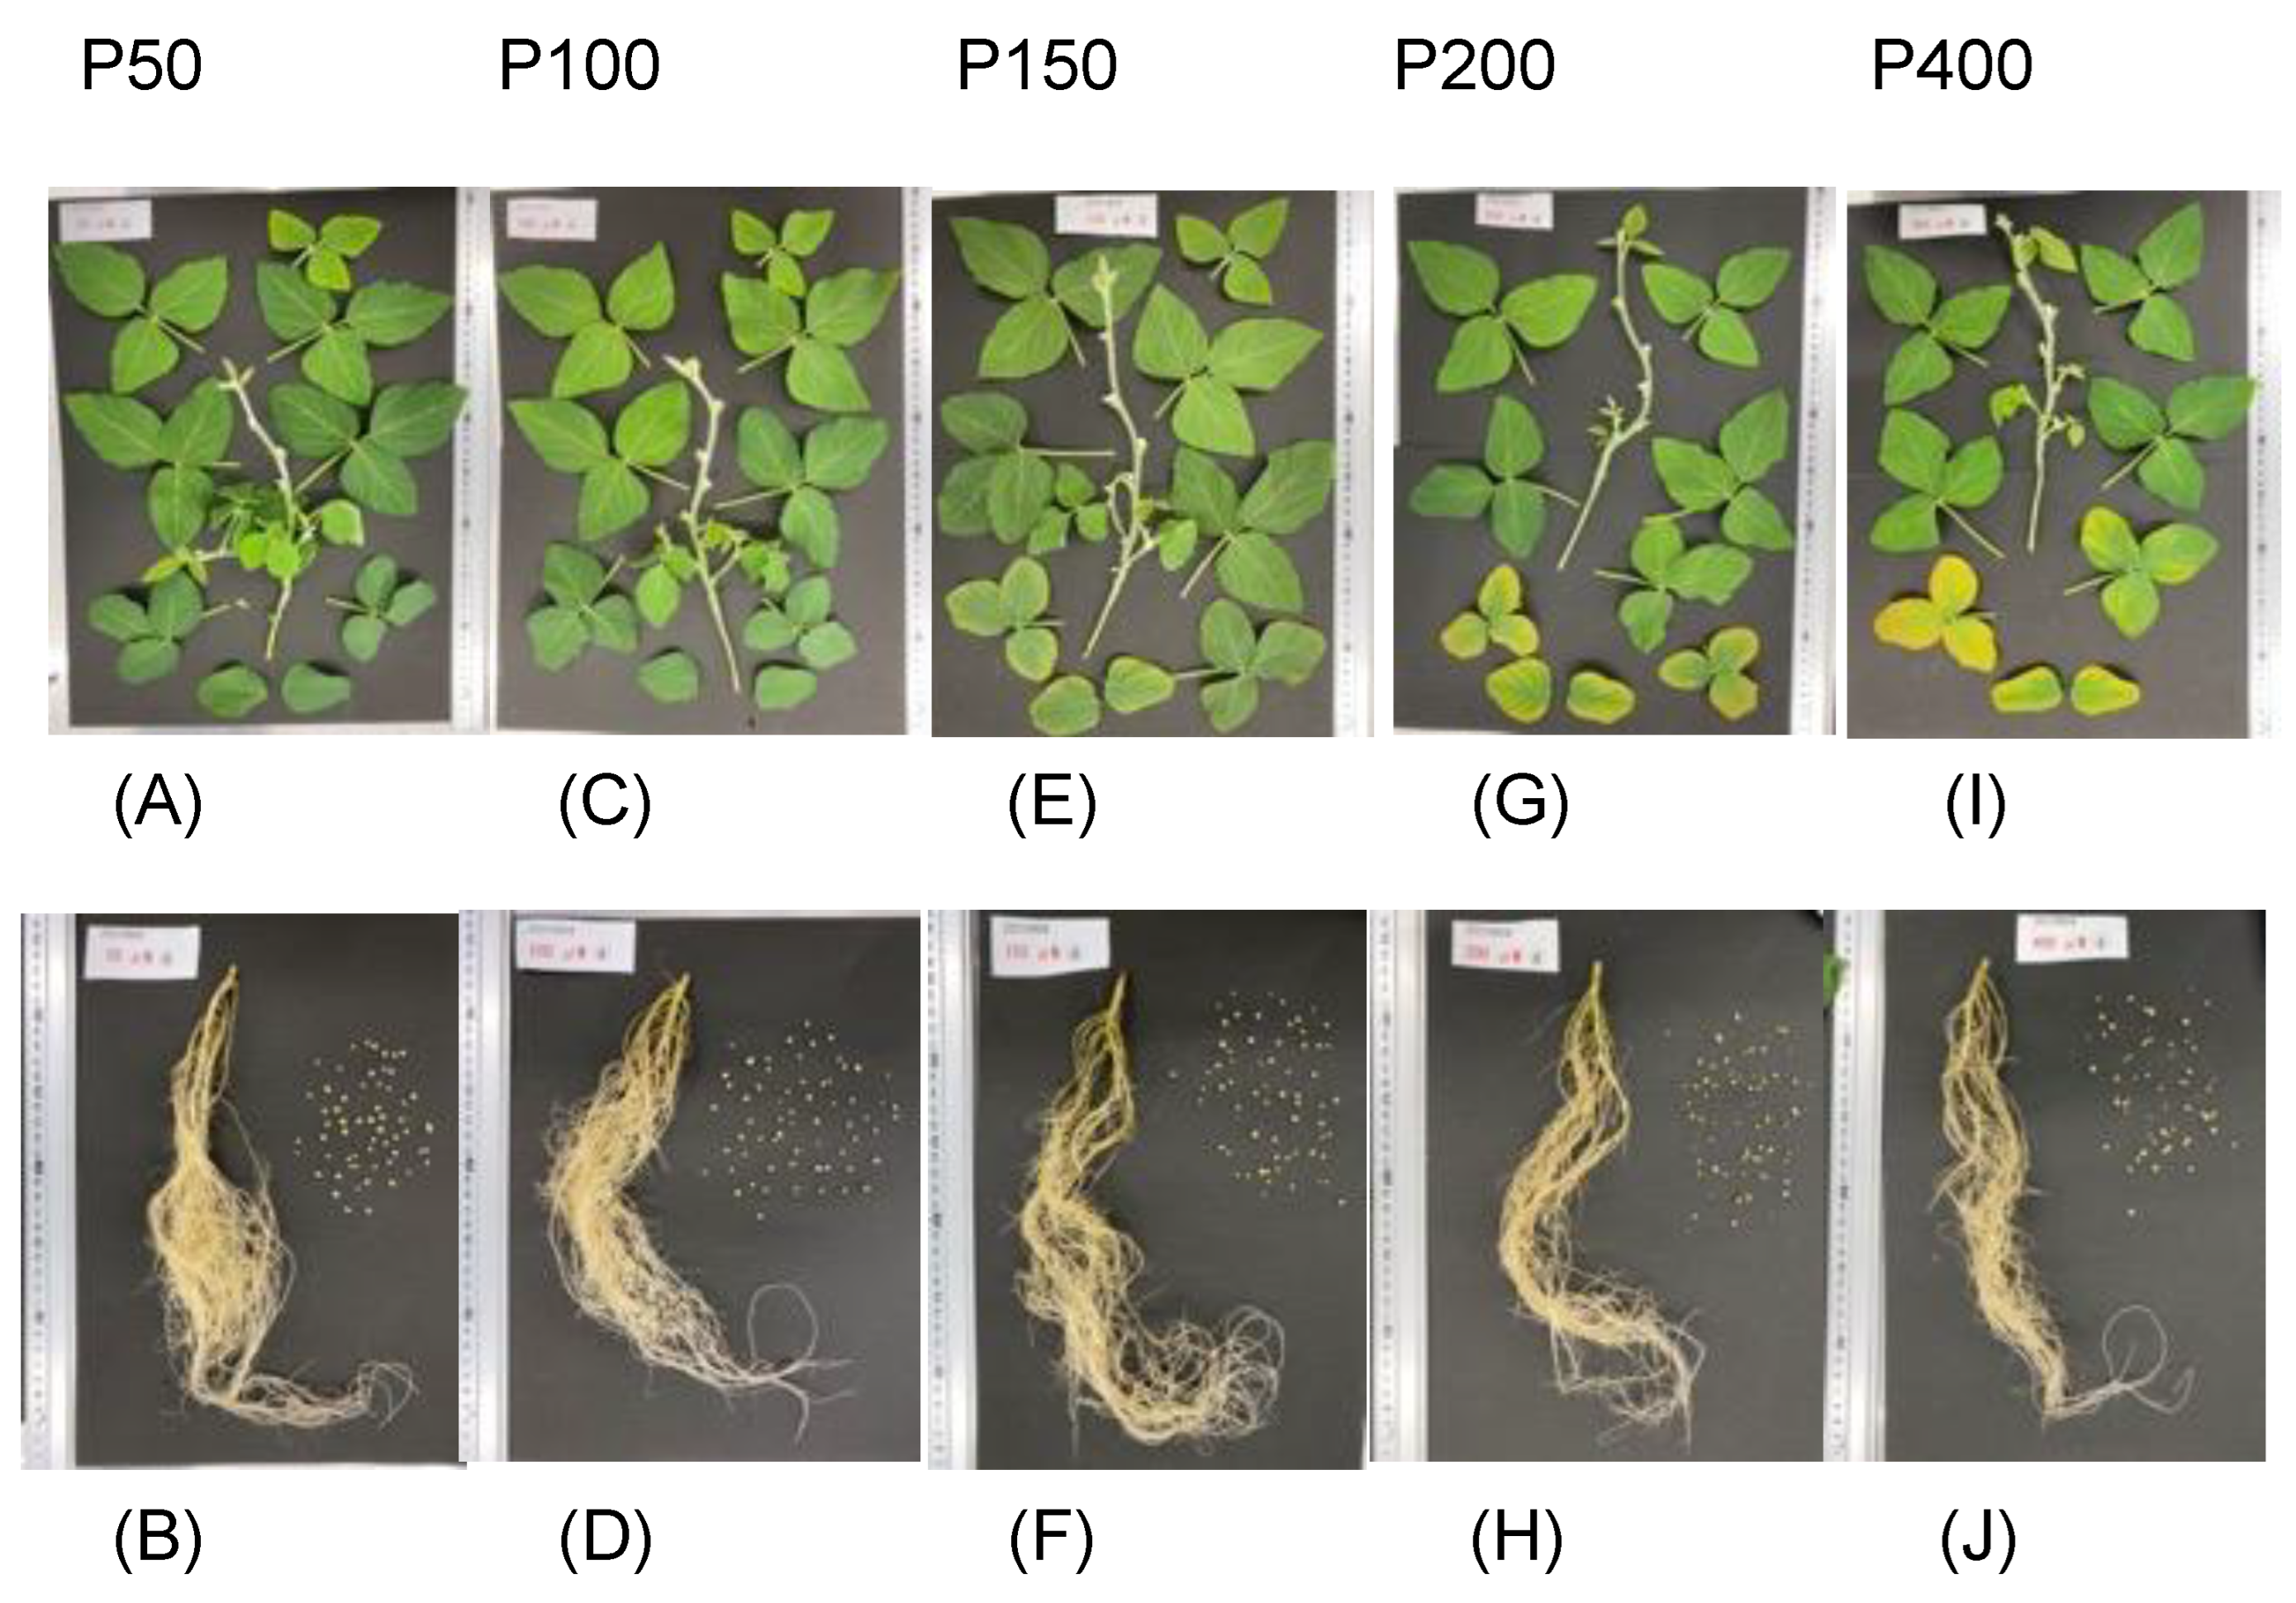
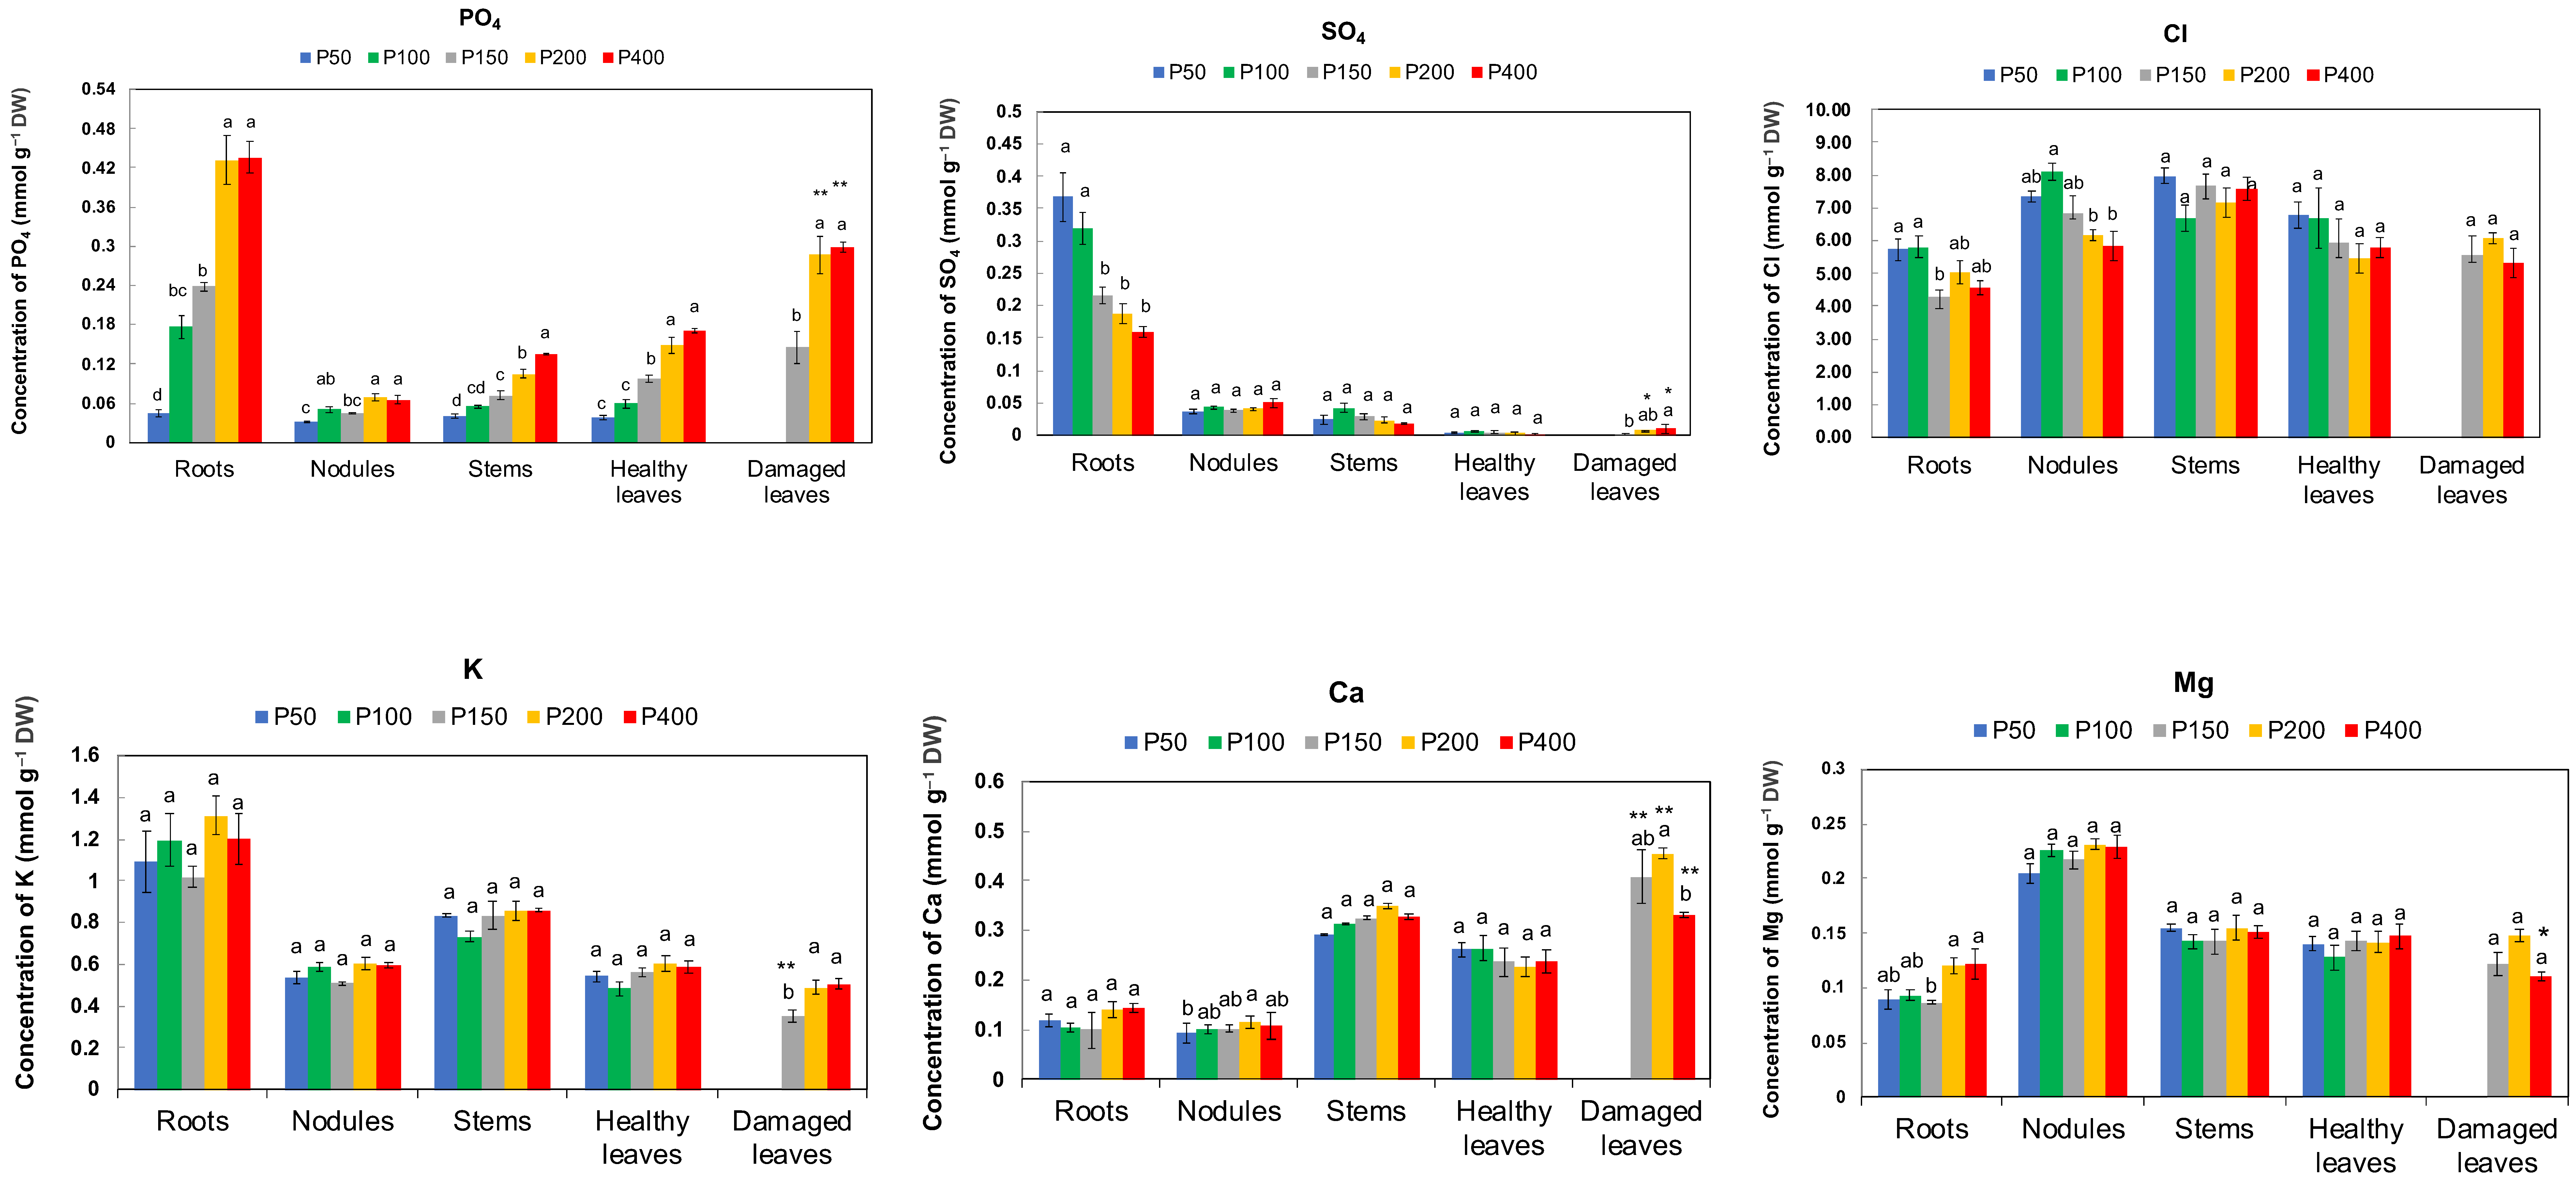
3.3. Evaluation of the Appropriate P Concentrations in a New Culture Solution with KHCO3 for Plant Growth and Evaluation of the Concentrations of Major Anions and Cations

The plants were cultivated with the modified culture solution (Table 1B) with 50 μM K2HPO4. At 33 DAP, the plants were subjected to different P conditions, namely P50, P100, P150, P200, and P400, for 14 days. Figure 6 shows photographs of shoots, roots, and nodules separated at harvest at 47 DAP after 14 days of P treatments. The root size was smaller in the plants under the P200 and P400 treatments than in those under the P50 and P100 treatments. Further, the leaf size was smaller in the plants under the P200 and P400 treatments than in those under the P50 and P100 treatments. The smaller leaves at the lower position showed a yellow color, so we classified these as damaged leaves.
The total plant dry weight decreased as the concentration of P in the solution increased; it was significantly higher in P50 and P100 than in P400 (Figure 7). The same was true for the roots, nodules, healthy leaves, and immature leaves. Damaged leaves appeared under the P150, P200, and P400 treatments. These results suggest that P50 and P100 were suitable concentrations for soybean growth under the experimental conditions, while P concentrations higher than 150 μM may cause harmful effects on the growth of roots, nodules, and leaves. Moreover, the leaf colors displayed excess symptoms above 150 μM K2HPO4.
Further, the concentrations of anions and cations in the 1% HCl extract of each organ were measured (Figure 8). Through 1% HCl extraction, most of the inorganic anions, namely PO4, SO4, and Cl, and the cations K, Ca, and Mg were found to be extractable. Organic P, such as P in the form of nucleic acids, phospholipids, etc., remained in the residue. When the P concentration in the medium was increased, the concentration of inorganic PO4 became significantly higher in all the organs. The P concentration in the roots under the P200 and P400 treatments was about 10 times higher than that under the P50 treatment. Further, the concentration of P in the damaged leaves was about twice that of the healthy leaves under the P200 and P400 treatments. Conversely, the concentrations of SO4 in the roots were significantly lower under the P400, P200 and P150 treatments than those under P50 and P100. Further, the concentrations of SO4 in the nodules, stems, and healthy leaves did not differ among the various P treatments. The Cl concentrations in the roots and nodules decreased as the P concentration increased in the culture solution, but the Cl concentrations in the shoots were not affected by the various P treatments. Further, the concentrations of organic P in the residue did not significantly differ among the various P treatments. The average concentrations of the organic P in the plant parts were as follows: roots (1.12), nodules (1.52), stems (0.96), healthy leaves (1.19) and damaged leaves (1.66 mmole g1DW).
The concentrations of K, Ca, and Mg were not significantly affected by the P concentration used in the culture solution. On the other hand, the Ca concentration in the damaged leaves was about twofold higher than that in the healthy leaves (p < 0.01).

4. Discussion

In hydroponics, a culture solution’s pH is important for growing healthy plants. In this study, the addition of 1–2 mM NaHCO3 to the original solution was effective in maintaining an adequate pH range during nodulated soybean cultivation. However, the use of KHCO3 was better than NaHCO3 for nodule growth (Figure 4), although the evapotranspiration rates (Figure 3) and chlorophyll concentrations (Table 2) were the same under the KHCO3 and NaHCO3 treatments. Therefore, we replaced the 0.625 mM K2SO4 in the original solution (Table 1A) with 1.25 mM KHCO3 (Table 1B).
The decrease in pH observed during cultivation may have been primarily due to H+ efflux from the roots [25]. H+ efflux is known to decrease under low pH conditions. The pH decrease in the original solution stopped at around pH 3–4 in this experiment (Figure 1 and Figure 2). It has been suggested that H+ efflux may be related to an imbalance in the absorption of cations and anions [26,27]. In our study, the mechanism that stabilized pH by the addition of KHCO3 may have operated through the neutralization of H+ by bicarbonate (HCO3), producing H2CO3 in the solution [28].
On the other hand, a high concentration of bicarbonate is harmful to soil and hydroponic cultures. Souri [29] reported that the use of calcium bicarbonate at high concentrations (5 mM) reduced plant growth, particularly root growth. In alkaline soils, especially in calcareous soil, high concentrations of NaHCO3 or other bicarbonate salts accumulate, and plant cultivation is repressed by increased pH and an imbalance in the availabilities of nutrient elements, especially Fe [18]. In scientific studies, distilled water or deionized water is used to prepare culture solutions. However, when underground or river water is used for hydroponics in agricultural practice, the concentrations of bicarbonate that affect the solution pH need attention [30].
KHCO3 can be used for hydroponics in not only scientific studies but also agricultural production. The main advantage of this method is its good buffering effect. Further, potassium bicarbonate is cheaper than other buffer reagents, such as MES. Additionally, KHCO3 is safe for humans and the environment when discharged. Bicarbonate accounts for 90% of the inorganic carbon in seawater [17], and it is related to pH buffering and the exclusion of CO2 in animals [16]. Bicarbonate is a safe compound because it has been used as baking powder and in medicines such as antacids. Phosphate has pH-buffering capacity, but using a high concentration of phosphate in a culture solution is harmful for soybean growth [12,31].
In this study, the optimum concentrations of P in a modified culture solution were found to be 50 μM and 100 μM. P concentrations over 150 μM exhibited harmful effects on the roots, nodules, and leaf growth, with the lower leaves showing yellowing damage. The concentrations of organic P in the residue did not significantly differ among the various P treatments, suggesting that P deficiency did not occur at the level of 50 μM P at this stage. Foote and Howell [32] investigated the P tolerance and sensitivity of soybean varieties, and Lincoln plants exhibited decreased growth caused by P toxicity at P levels over 0.72 mM. Burnett et al. [33] studied the effects of P concentrations on hydroponically grown Scaevola plants, and the root and shoot dry mass, leaf area, and number of flowers of the plants reached their maximum values under the lowest level of P (0.65 mM) and decreased under higher P levels. Gremaud and Harper [21] used a culture solution with 100 μM P.
Phosphate availability is often limited in soil, and due to its low mobility, little information is available regarding the effect of excess P on plants [34]. In this study, as seen in Figure 8, the PO43− concentration in the roots increased as the concentration of P increased in the culture solution, while SO42− and Cl decreased. The high concentration of PO43− itself, or the decrease in SO42− or Cl, may have caused the growth retardation and leaf damage. Another possibility is that excess PO43− may have decreased the soluble Ca concentration in the cells. The total cations, including Ca, were not affected by the P concentrations in the culture solution, while the Ca concentrations in the cytosol may have decreased under toxic P levels. Shukla et al. [34] reported that an excess P response is related to a modulation in ethylene biosynthesis and signaling, the metal ion deficiency response, and root development gene expressions.

5. Conclusions

In this study, a culture solution was modified by adding 1.25 mM KHCO3 to an N-free solution in order to stabilize the pH of the culture solution for the cultivation of nodulated soybean plants. The soybean plants cultivated with the new solution exhibited healthy white roots, and their evapotranspiration rate was higher than that of the control plants without bicarbonate. This study’s use of appropriate concentrations of bicarbonate is applicable for agricultural practices that use N in a given medium, although the concentrations and formulae used should be evaluated for different methods and crops. Bicarbonate ion is a major inorganic carbon and is used for pH-stat in animals. Therefore, the use and discharge of bicarbonate will not lead to harmful effects on human health and the environment. This study found that the optimum P concentrations for a modified culture solution were 50 and 100 μM, while the concentrations over 150 μM reduced the plant growth and led to lower leaf damage.

Author Contributions

T.O.: Conceptualization, writing—original draft preparation; K.T.: analysis and investigation for carbonate; A.A.: analysis for optimum P concentration; A.S.: writing—review and editing; K.H.: writing—review and editing, supervision; and T.S.: writing—review and editing. All authors have read and agreed to the published version of the manuscript.

Funding

This research did not received external funding

Institutional Review Board Statement

Not applicable.

Data Availability Statement

The data presented in this study are available on request from the corresponding author.

Conflicts of Interest

The authors declare no conflict of interest.

References

  1. Dehnavard, S.; Souri, M.K.; Mardanlu, S. Tomato growth responses to foliar application of ammonium sulfate in hydroponic culture. J. Plant Nutr. 2017, 40, 315–323. [Google Scholar] [CrossRef]
  2. Hydroponics Global Market Report. Higher Yield Compared with Conventional Agricultural Practices Driving Growth. 2022, October 19, 2022, 04:13 ET | Source: Research and Markets. Available online: https://www.globenewswire.com/en/news-release/2022/10/19/2537067/28124/en/Hydroponics-Global-Market-Report-2022-Higher-Yield-Compared-with-Conventional-Agricultural-Practices-Driving-Growth.html (accessed on 12 January 2023).
  3. Hydroponics Market Size, Share & Trends Analysis Report By Type (Aggregate Systems, Liquid Systems), By Crops (Tomatoes, Lettuce, Peppers, Cucumbers, Herbs), By Region, And Segment Forecasts, 2021–2028. Available online: https://www.,mordorintelligence.com/industry-reports/hydroponics-market (accessed on 12 January 2023).
  4. Hoagland, D.R.; Arnon, D.I.; The Water-Culture Method for Growing Plants without Soil. California Agricultural Experiment Station. 1950. Available online: https://archive.org/details/watercultureme3450hoag/mode/2up (accessed on 12 March 2023).
  5. Marshiner, H. Ion Uptake Mechanisms of Individual Cells and Roots: Short-Distance Transport. In Mineral Nutrition of Higher Plants, 2nd ed.; Academic Press: London, UK, 1986; pp. 6–78. [Google Scholar]
  6. Ikarashi, T. Hydrsoponic cultivation of autumn planting spring sprouting flower bulbs. In Hydroponic cultivation and Plant nutrition; J. Soc. Soil Sci. Plant Nutr., Ed.; Hakuyusha: Tokyo, Japan, 1989; pp. 103–133. [Google Scholar]
  7. Islam, A.K.N.S.; Edwards, D.G.; Asher, C.J. pH optima for crop growth: Results of a flowing solution culture experiment with six species. Plant Soil 1980, 54, 339–357. Available online: https://www.jstor.org/stable/42935246 (accessed on 12 March 2023). [CrossRef]
  8. Kawasaki, T.; Moritsugu, M. Ammonium-N and nitrate-N in the medium and plant growth. In Nutrient Solution Soil Cultivation, Liquid fertilizer, and Management of the Medium; J. Soc. Soil Sci. Plant Nutr., Ed.; Hakuyusha: Tokyo, Japan, 2005; pp. 29–53. [Google Scholar]
  9. Roosta, H.R.; Rezaei, I. Effect of Nutrient Solution PH on the Vegetative and Reproductive Growth and Physiological Characteristics of Rose Cv. ‘Grand Gala’ in Hydroponic System. J. Plant Nutr. 2014, 37, 2179–2194. [Google Scholar] [CrossRef]
  10. Vargas, A.A.T.; Graham, P.H. Cultivar and pH effects on competition for nodule sites between isolates of Rhizobium in beans. Plant Soil 1989, 117, 195–200. Available online: https://link.springer.com/article/10.1007/BF02220712 (accessed on 12 January 2023). [CrossRef]
  11. Harper, J.E.; Nicholas, J.C. Control of Nutrient Solution pH with an Ion Exchange System: Effect on Soybean Nodulation. Physiol. Plant. 1976, 38, 24–28. [Google Scholar] [CrossRef]
  12. Imsande, J.; Ralston, E.J. Hydroponic Growth and the Nondestructive Assay for Dinitrogen Fixation. Plant Physiol. 1981, 68, 1380–1384. [Google Scholar] [CrossRef] [Green Version]
  13. Rys, G.J.; Phung, T. Nutrient Solution pH Control using Dipolar Buffers in Studies of Trifolium repens L. Nitrogen Nutrition. J. Exp. Bot. 1985, 36, 426–431. [Google Scholar] [CrossRef]
  14. Kagenishi, T.; Yokawa, K.; Baluška, F. MES Buffer Affects Arabidopsis Root Apex Zonation and Root Growth by Suppressing Superoxide Generation in Root Apex. Front. Plant Sci. 2016, 7, 79. [Google Scholar] [CrossRef] [Green Version]
  15. Nicholas, J.C.; Harper, J.E. Effect of MES [2(N-morpholino)ethanesulfonic acid] and amberlite IRC-50 resin on nutrient pH control and soybean growth. J. Plant Nutr. 2008, 16, 895–909. [Google Scholar] [CrossRef]
  16. Asano, Y. Acid-base equilibrium anomalies, Basic knowledge of acid-base equilibrium and how to read arterial blood gas analysis. J. Jpn. Soc. Int. Med. 1997, 86, 1868–1872. [Google Scholar]
  17. Poschenrieder, C.; Fernández, J.A.; Rubio, L.; Peréz, L.; Terés, J.; Barceló, J. Transprot and use of bicarbonate in plants: Current knowledge and challenges ahead. Int. J. Mol. Sci. 2018, 19, 1352. [Google Scholar] [CrossRef] [PubMed] [Green Version]
  18. Motesharezadeh, B.; Hesam-Arefi, A.; SavaghebiArefi, G.R. The effect of bicarbonate on iron (Fe) and zinc (Zn) uptakes by soybean varieties. Desert 2017, 22, 145–155. [Google Scholar]
  19. Tang, C.; Thomson, B.D. Effects of solution pH and bicarbonate on the growth and nodulation of a range of grain legume species. Plant Soil 1996, 186, 321–330. Available online: https://link.springer.com/article/10.1007/BF02415527 (accessed on 12 January 2023). [CrossRef]
  20. Fujikake, H.; Yashima, H.; Sato, T.; Ohtake, N.; Sueyoshi, K.; Ohyama, T. Rapid and reversible nitrate inhibition of nodule growth and H2 fixation activity in soybean (Glycine max (L.) Merr.). Soil Sci. Plant Nutr. 2002, 48, 211–217. [Google Scholar] [CrossRef]
  21. Gremaud, M.F.; Harper, J.E. Selection and initial characterization of partially nitrate tolerant nodulation mutants of soybean. Plant Physiol. 1989, 89, 169–173. Available online: https://www.jstor.org/stable/4271808 (accessed on 12 January 2023). [CrossRef] [Green Version]
  22. Ohyama, T.; Nicholas, J.C.; Harper, J.E. Assimilation of 15N2 and 15NO3 by Partially Nitrate-Tolerant Nodulation Mutants of Soybean. J. Exp. Bot. 1993, 44, 1739–1747. [Google Scholar] [CrossRef]
  23. Mishima, T.; Ohsawa, S.; Yamada, M.; Kitaoka, K. A new method for determination of bicarbonate ion in a small amount of environmental water samples. J. Jpn. Assoc. Hydrol. Sci. 2009, 38, 157–168. [Google Scholar]
  24. Ohyama, T.; Ito, M.; Kobayashi, K.; Araki, S.; Yasuyoshi, S.; Sasaki, O.; Yamazaki, T.; Soyama, K.; Tanemura, R.; Mizuno, Y.; et al. Analytical procedures of N, P, K contents in Plant and Manure materials using Kjeldahl digestion method. Bull. Facul. Agric. Niigata Univ. 1991, 43, 111–120. Available online: http://hdl.handle.net/10191/23768 (accessed on 12 January 2023).
  25. Yan, F.; Schubert, S.; Mengel, K. Effect of Low Root Medium pH on Net Proton Release, Root Respiration, and Root Growth of Corn (Zea mays L.) and Broad Bean (Vicia faba L.). Plant Physiol. 1992, 99, 415–421. [Google Scholar] [CrossRef] [Green Version]
  26. Allen, S.; Raven, J.A. Intracellular pH Regulation in Ricinus communis Grown with Ammonium or Nitrate as N Source: The Role of Long Distance Transport. J. Exp. Bot. 1987, 38, 580–596. [Google Scholar] [CrossRef]
  27. Schubert, S.; Schubert, E.; Mengel, K. Effect of low pH of the root medium on proton release, growth, and nutrient uptake of field beans (Vicia faba). Plant Soil 1990, 124, 239–244. Available online: https://link.springer.com/article/10.1007/BF00009266 (accessed on 12 January 2023). [CrossRef]
  28. Mizuno, N. Application of physics and chemistry to agricultural technology. Agric. Hortic. 2016, 91, 1189–1203. [Google Scholar]
  29. Souri, M.K. Influence of N-forms and changes in nutrient solution pH on growth of Palisadegrass plants. J. Plant Nutr. 2022, 45, 1827–1836. [Google Scholar] [CrossRef]
  30. Shinohara, Y.; Masamori, K.; Tsukagoshi, S.; Maruo, T.; Ito, T. Studies on the method for determination and control of bicarbonate ion in the nutrient solution for hydroponics. Tech. Bull. Fac. Hort. Chiba Univ. 1997, 51, 1–6. [Google Scholar]
  31. Furlani, M.C.; Furlani, P.R.; Tanaka, R.T.; Mascarenhas, H.A.A.; Delgado, M.D.D.P. Variability of soybean germplasm in relation to phosphorus uptake and use efficiency. Sci. Agricola 2002, 59, 529–536. [Google Scholar] [CrossRef] [Green Version]
  32. Foote, B.D.; Howell, R.W. Phosphorus Tolerance and Sensitivity of Soybeans as Related to Uptake and Translocation. Plant Physiol. 1964, 39, 610–613. [Google Scholar] [CrossRef] [Green Version]
  33. Burnett, S.E.; Zhang, D.; Stack, L.B.; He, Z. Effects of Phosphorus on Morphology and Foliar Nutrient Concentrations of Hydroponically Grown Scaevola aemula R. Br. ‘Whirlwind Blue’. Hortscience 2008, 43, 902–905. [Google Scholar] [CrossRef] [Green Version]
  34. Shukla, D.; Rinehart, C.A.; Sahi, S.V. Comprehensive study of excess phosphate response reveals ethylene mediated signaling that negatively regulates plant growth and development. Sci. Rep. 2017, 7, 3047. Available online: https://www.nature.com/articles/s41598-017-03061-9 (accessed on 12 January 2023). [CrossRef] [Green Version]
Figure 1. Effects of addition of 0, 2, 5, 10, and 20 mM NaHCO3 on pH of the culture solution. Average ± standard error; 20 DAP plants were used.
Agriculture 13 00739 g001
Figure 2. Effects of addition of 0, 0.5, 1.0, 1.5, and 2.0 mM NaHCO3 on pH of the culture solution. Average ± standard error; 32 DAP plants were used.
Agriculture 13 00739 g002
Figure 3. Effect of the addition of 1.0 mM NaHCO3 or KHCO3 at 19 DAP on the transpiration rate. Average ± standard error. Different letters indicate a significant difference in the values among treatments.
Agriculture 13 00739 g003
Figure 4. Effect of the addition of 1.0 mM NaHCO3 or KHCO3 on the dry weight of each part at 37 DAP. Average ± standard error. Different letters indicate a significant difference in the values among treatments.
Agriculture 13 00739 g004
Figure 5. Effect of the addition of 1.0 mM NaHCO3 or KHCO3 on pH of the culture solution. Plants at 12–15 DAP were used. Average ± standard error.
Agriculture 13 00739 g005
Figure 6. Photographs of soybean plants in the new culture solution with KHCO3 harvested on 47 DAP. P concentrations of 50 (A,B), 100 (C,D), 150 (E,F), 200 (G,H), and 400 μM (I,J) were applied from 33 to 47 DAP.
Agriculture 13 00739 g006
Figure 7. Effect of the concentrations of P on the dry weight of each part of soybean plants in the new culture solution with KHCO3 on 47 DAP. P concentrations of 50, 100, 150, 200, and 400 μM were applied from 33 to 47 DAP. Average ± standard error. Different letters at the top of the colored bars indicate a significant difference in the total DW. Different letters beside the column indicate a significant difference in each organ.
Agriculture 13 00739 g007
Figure 8. Effect of the concentrations of P on inorganic anions and cations of each part of soybean plants in the new culture solution with KHCO3 on 47 DAP. Different P concentrations of 50, 100, 150, 200, and 400 μM were applied from 33 to 47 DAP. Average ± standard error. Different letters at the top of the colored bars indicate a significant difference by Tukey’s test. * and ** on the column of damaged leaves indicate significant differences between healthy and damaged leaves at 0.05 > p > 0.01 and 0.01 > p, respectively.
Agriculture 13 00739 g008
Table 1. Compositions of original culture solution (A) and modified culture solution with bicarbonate (B). Stock solutions were separated into five bottles with either 500-fold (Stock 1) or 1000-fold (Stocks 2–5) composition increases compared to the original solution.
(A) Original Composition
Stock
(Enrichment)
CompoundMolar ConcentrationWeight Concentration
(μM)(mg/L)
1 (×500)K2HPO4498.5
K2SO4625109
KCl12.60.936
2 (×1000)CaCl2·2H2O1,250184
3 (×1000)MgSO4·7H2O500123
4 (×1000)Fe-EDTA·3H2O5021.05
5 (×1000)H3BO35.940.367
CuSO4·5H2O0.130.032
MnSO4·5H2O0.7720.186
ZnSO4·7H2O0.50.144
CoCl2·6H2O0.1810.043
(NH4)6Mo7O24·7H2O0.00320.004
NiCl2·6H2O0.0130.003
(B) Modified Composition with Bicarbonate
Stock
(Enrichment)
CompoundMolar ConcentrationWeight Concentration
(μM)(mg/L)
1 (×500)K2HPO4508.71
KHCO31250125
2 (×1000)CaCl2·2H2O1250184
3 (×1000)MgSO4·7H2O500123
4 (×1000)Fe-EDTA·3H2O5021.05
5 (×1000)H3BO35.940.367
CuSO4·5H2O1.260.315
MnSO4·5H2O0.7720.186
ZnSO4·7H2O0.50.144
CoCl2·6H2O0.1810.043
(NH4)6Mo7O24·7H2O0.00320.004
NiCl2·6H2O0.0130.003
Table 2. Leaf color index (SPAD) values of each leaf of 37 DAP soybean treated with 1.0 mM NaHCO3 or KHCO3. Average ± standard error, n = 3, * significant error by Student’s t-test compared to control treatment (p < 0.05).
ControlNaHCO3KHCO3
Primary Leaves37.0 (1.3)40.3 (1.4)41.7 (0.7) *
1st Leaves31.8 (5.6)40.3 (1.0)40.2 (0.8)
2nd Leaves26.7 (6.5)38.9 (0.4)38.1 (0.9)
3rd Leaves28.1 (8.0)41.4 (1.0)41.1 (1.0)
4th Leaves28.7 (6.0)37.5 (1.0)36.5 (1.3)
5th Leaves31.3 (3.0)34.3 (1.3)33.5 (1.8)
6th Leaves31.5 (0.8)31.0 (1.1)30.3 (1.4)
7th Leaves26.0 (1.5)29.5 (1.1)28.8 (0.9)
Table 3. Changes in pH and HCO3 concentration before and after changing culture solution during soybean cultivation. Average (standard error); n = 4.
pHHCO3 Concentration (mM)
DAPbeforeafterbeforeafter
21~236.38 (0.09)6.45 (0.10)1.19 (0.07)0.97 (0.09)
23~256.35 (0.10)6.35 (0.13)1.18 (0.07)0.91 (0.03)
25~276.33 (0.10)6.18 (0.10)1.35 (0.04)0.87 (0.00)
27~296.48 (0.03)6.15 (0.06)1.13 (0.00)0.71 (0.06)
Disclaimer/Publisher’s Note: The statements, opinions and data contained in all publications are solely those of the individual author(s) and contributor(s) and not of MDPI and/or the editor(s). MDPI and/or the editor(s) disclaim responsibility for any injury to people or property resulting from any ideas, methods, instructions or products referred to in the content.

