Article

Wavelet Scattering Convolution Network-Based Detection Algorithm on Nondestructive Microcrack Electrical Signals of Eggs

1
College of Intelligent Equipment, Shandong University of Science and Technology, Tai’an 271019, China
2
College of Mechanical and Electronic Engineering, Shandong Agricultural University, Tai’an 271018, China
*
Author to whom correspondence should be addressed.
Agriculture 2023, 13(3), 730; https://doi.org/10.3390/agriculture13030730
Submission received: 28 February 2023 / Revised: 13 March 2023 / Accepted: 20 March 2023 / Published: 22 March 2023
(This article belongs to the Special Issue Robots and Autonomous Machines for Agriculture Production)

Abstract

:
The detection of poultry egg microcracks based on electrical characteristic models is a new and effective method. However, due to the disorder, mutation, nonlinear, time discontinuity, and other factors of the current data, detection algorithms such as support-vector machines (SVM) and random forest (RF) under traditional statistical characteristics cannot identify subtle defects. The detection system voltage is set to 1500 V in the existing method, and higher voltages may cause damage to the hatched eggs; therefore, how to reduce the voltage is also a focus of research. In this paper, to address the problem of the low signal-to-noise ratio of microcracks in current signals, a wavelet scattering transform capable of extracting translation-invariant and small deformation-stable features is proposed to extract multi-scale high-frequency feature vectors. In view of the time series and low feature scale of current signals, various convolutional networks, such as a one-dimensional convolutional neural network (1DCNN), long short-term memory (LSTM), bi-directional long short-term memory (Bi-LSTM), and gated recurrent unit (GRU) are adopted. The detection algorithm of the wavelet scattering convolutional network is implemented for electrical sensing signals. The experimental results show that compared with previous works, the accuracy, precision, recall, F1-score, and Matthews correlation coefficient of the proposed wavelet scattering convolutional network on microcrack datasets smaller than 3 μ m at a voltage of 1000 V are 99.4393%, 99.2523%, 99.6226%, 99.4357%, and 98.8819%, respectively, with an average increase of 2.0561%. In addition, the promotability and validity of the proposed detection algorithm were verified on a class-imbalanced dataset and a duck egg dataset. Based on the good results of the above experiments, further experiments were conducted with different voltages. The new feature extraction and detection method reduces the sensing voltage from 1500 V to 500 V, which allows for achieving higher detection accuracy with a lower signal-to-noise ratio, significantly reducing the risk of high voltage damage to hatching eggs and meeting the requirements for crack detection.

1. Introduction

Eggs are one of the best sources of nutrition for human beings and are known as the best protein food. To ensure the quality of eggs, cracked eggs produced in packaging, processing, transportation, and other links should be eliminated. Cracks in eggs will not only lead to a reduction of freshness but also breed bacteria and do harm to health [1,2]. The quality and safety of eggs is a matter of concern to the public, so the detection of egg cracks is a necessary operation before the eggs enter the market for consumption. Manual detection is high-cost, low-efficiency, and depends on detection experience. After a long period of operation, the probability of missing cracks and false detection increases due to visual fatigue. This can also cause some damage to the operators’ vision [3]. With the continuous development of industrialization and informatization, people are trying to find an automatic detection method to reduce the labor intensity of this task while simultaneously improving efficiency and accuracy.
Numerous techniques for egg crack detection have been put forth by researchers and academics, of which acoustic [4,5,6,7] and visual [8,9,10,11] methods are the most well-known and established. Crack detection based on acoustic characteristics is realized by collecting knock response signals with sound sensors after mechanical excitation on several parts of the egg surface, analyzing and processing the signal differences between the intact area and the cracked area of the egg surface, and finally extracting characteristic parameters. However, its accuracy easily suffers from interference by eggshell thickness, external noise, and the knock location. The detection of cracks in poultry eggs based on visual characteristics involves taking pictures of the surface of poultry eggs with an industrial camera and transmitting the images to supporting software. By analyzing the images, the software can identify the characteristics of cracked and intact eggs and then construct a model for discrimination. Nevertheless, many simple factors must be considered in practice, such as the camera’s resolution, the recognition algorithm, and the shape of the egg crack. Additionally, the online detection speed and accuracy for microcracks cannot meet today’s requirements. Hence, significant limitations remain on industrial sites.
The detection method based on high-voltage discharge has a good ability to detect leakage. Hu [12] proposed a “conductivity method” for ampoule bottle detection, applying a 3000 V∼5000 V direct current(DC) on the tested drug bottle and judging the leakage of the test sample by setting the threshold value of the measured current. Yan et al. [13] used 20 kHz of high voltage to carry out their experiment and finally verified the feasibility of high-voltage discharge for the detection of small leaks of large infusion plastic bottles. The micro-current high-voltage discharge method is similar to the traditional high-voltage discharge method. It requires that the package itself is not conductive and the contents are conductive, creating a difference between the electrical parameters of a defect-free package and a defective package. The micro-current high-voltage discharge method can also be used to detect tiny cracks or damages to sealed packaging in the food industry. With the further deepening of the basic theoretical research on the dielectric properties of eggs, egg crack detection based on electrical properties will become our research direction.
Recent research shows that detecting cracked eggs using the response model of egg electrical characteristics can effectively compensate for the shortcomings of the above methods [14]. 
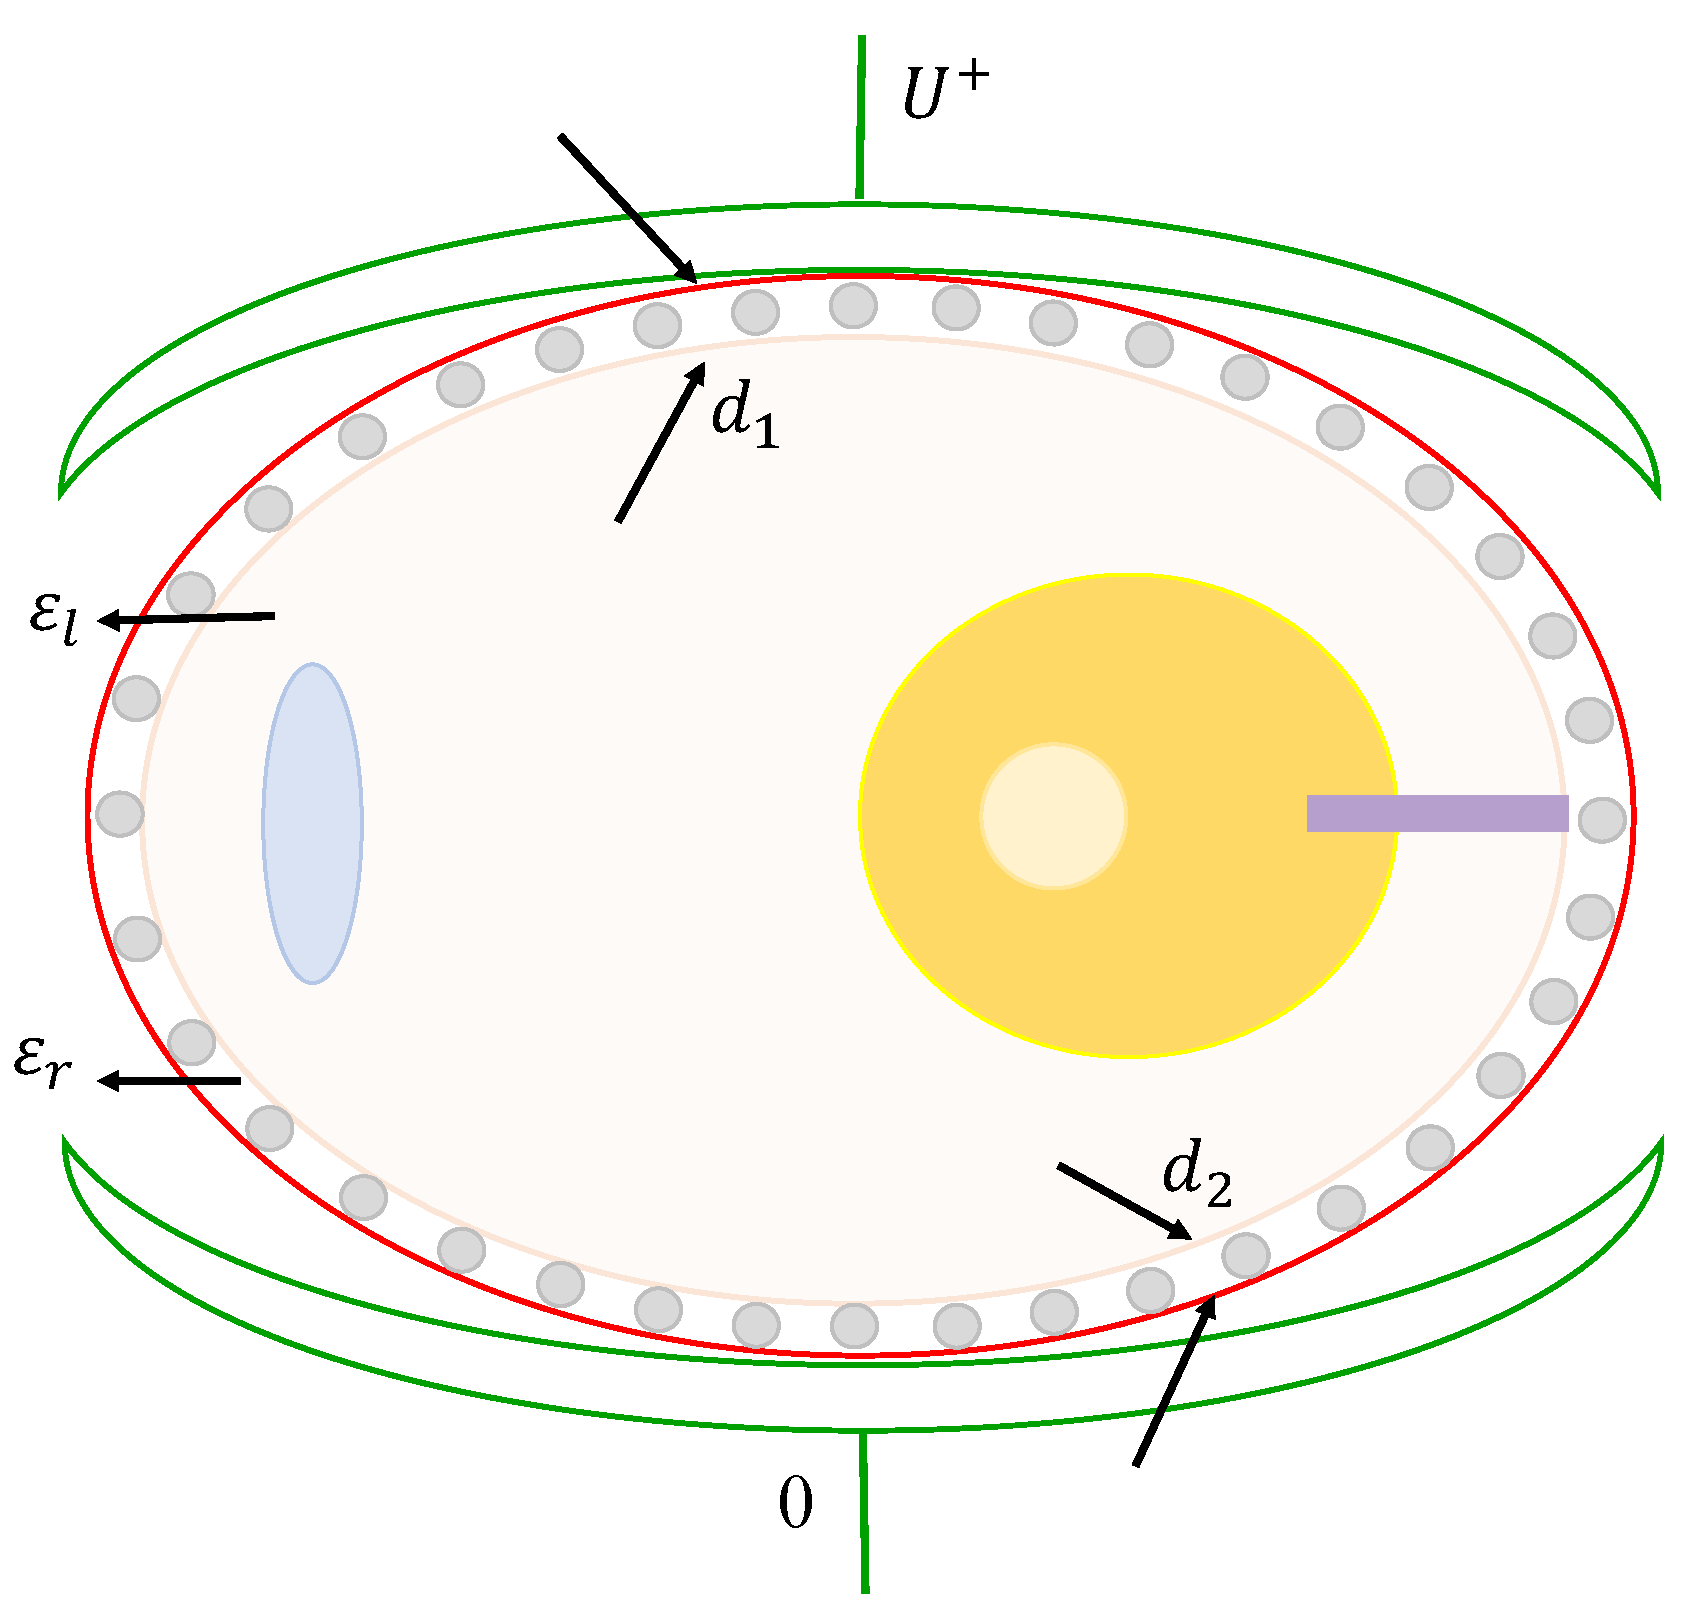
Figure 1 illustrates how the electrical characteristic model can be used to detect egg cracks. The capacitors include the two electrodes and the egg in the center, and the eggshell is the insulator. Due to its low resistance value, the egg liquid is approximately the conductor. The current value detected is either a capacitance jump, a breakdown, or a combination of both. When the egg is intact, the whole system is in equilibrium, and the current value will remain stable. When the egg has a crack, the electrical characteristic model will change when the electrode passes through the crack, resulting in a transient current. Therefore, if the voltage of the two electrodes is kept constant and only the breakdown of the air medium is allowed, it is possible to identify cracked eggs based on the change in the current signal. Traditional machine learning methods have been used to classify the current signals, and the accuracy of detecting eggs with microcracks less than 3 µm compared to intact eggs was found to be 99 % . Relevant experiments also prove that the proposed method has a certain universality and versatility. However, it has three shortcomings. In terms of the experimental device, the electrode position is fixed, which can easily cause the egg size to not fit with the upper electrode, thus causing errors in detection. In signal analysis, the extracted features are inadequate to allow capturing the details and changes of cracked eggs in the current signal, so further study of the feature extraction method of the current signal is necessary. A further area of research is how to reduce the 1500 V voltage used in the experiments because it is too high and might harm the unhatched eggs.
Therefore, this research aimed to propose an accurate and effective nondestructive method based on the electrical characteristics of eggs to detect cracks in poultry eggs in the industrial field on the basis of existing experiments [14]. The main objectives of the study are as follows:
  • To modify the experimental device so that the electrode fits the egg to avoid missed or wrong detection due to data acquisition;
  • To adjust the analysis algorithm, to analyze the characteristics of the microcurrent signal, and to design a feature extraction and classification algorithm that is effective for the current signal;
  • To investigate how to reduce the voltage while maintaining detection accuracy and reducing the damage caused by high voltage to unhatched eggs.
Employing wavelet scattering transform, Jinghui Li et al. [15] stratified and dispersed the information of a heart sound signal to each layer so that the information would not be lost and maintained the stability of signal features, which effectively expressed the corresponding characteristic information of the signal. Then they obtained the characteristic matrix of the signal, which was input into a double support-vector machine for classification, yielding excellent results. Ahmad A. Al-Taee et al. [16] used deep wavelet scattering transform as a feature extraction method for electromyographic signals and compared it with other wavelet methods, significantly improving the performance of electromyographic pattern recognition. Liu Hui et al. [17] adopted a wavelet scattering network to extract the features of the fault zero sequence current signal. Academics have found that wavelet scattering transform can extract both simple and complex characteristics from low-frequency and high-frequency signals, respectively, and thus can reduce intra-class differences to the greatest extent while preserving inter-class differentiation. The fault feature vector is input into bi-directional LSTM, which has the advantages of high identification accuracy and short training time compared with the fault identification methods in other literature. In addition, wavelet scattering convolutional neural networks have been widely used in sound, image, and time series fields due to their superior performance and perfect mathematical properties, and some achievements have been made [18,19,20,21]. To our knowledge, no researchers have applied appropriate research methods and ideas to detect microcurrent signals in eggs.
In recent years, deep learning has been rapidly developed. Because of its advantages of automatic feature extraction, ability to process unstructured data, and high accuracy, it has been widely used and studied in industrial defect detection. Yu et al. [22] combined convolutional neural networks(CNN), migration learning, and decision-level images to propose a vision-based automatic recognition method for the identification of the surface condition of concrete structures and designed an improved Dempster–Shafer (D-S) algorithm, which greatly improved the recognition accuracy of concrete structures. Yu et al. [23] used the improved bird swarm algorithm to optimize a 2DCNN, which performed better than other machine learning models in the evaluation of the torsional capacity of reinforced concrete (RC) beams. Deep learning has also shown strong performance in the processing of one-dimensional(1D) data. Hu et al. [24] designed a fault diagnosis method based on a one-dimensional convolutional neural network (1DCNN) and L2-support-vector machine(L2-SVM) for unbalanced data, which, compared with other intelligent methods, significantly improved the recognition accuracy and diagnostic performance of the model compared with other intelligent methods in processing unbalanced data. Le et al. [25] developed a 1DCNN for automated fault diagnosis, which can autonomously learn damage-sensitive features without pre-processing and can accurately diagnose potential faults that damage the smart chain. Relevant research [26,27,28] also shows that deep learning exhibits good performance in processing time series classifications.
Therefore, this study focuses on applying wavelet scattering on poultry eggs based on real-time electrical characteristics. The main innovations and contributions of this research can be summarized as follows:
  • In order to solve the problem of missing detection caused by the lack of fit between the egg and the electrode due to the fixed position of the upper electrode, we improved the micro-crack detection system based on discharge analysis. We added a size identification device so that the upper electrode position can be automatically moved and fitted according to the size of the egg.
  • Given the problem that the extracted features are inadequate to capture the details and changes in a cracked egg in the current signal, we applied the wavelet scattering transform to obtain the features of the micro-current signal. Using deep learning methods, we classified the features extracted and attained satisfactory results with local translation invariance and elastic deformation stability.
  • The proposed and existing methods’ effects were compared and analyzed. The class-imbalanced dataset and duck egg dataset were used to verify the versatility and effectiveness of the proposed method. Finally, the experiments with different voltage effects were conducted to verify that the proposed method can obtain higher accuracy on data with a low signal-to-noise ratio while reducing the sensing voltage and further reducing the risk of damage to unhatched eggs caused by high voltages.
The remaining chapters are organized as follows. Section 2 introduces the deployment of experimental equipment and the method of microcurrent signal analysis. In Section 3, we compare and analyze the experimental results to verify the effectiveness of the proposed method. Finally, the whole paper is summarized and the future research on egg crack detection is prospected in Section 4.

2. Materials and Methods

2.1. Egg Electrical Characteristic Crack Detection System

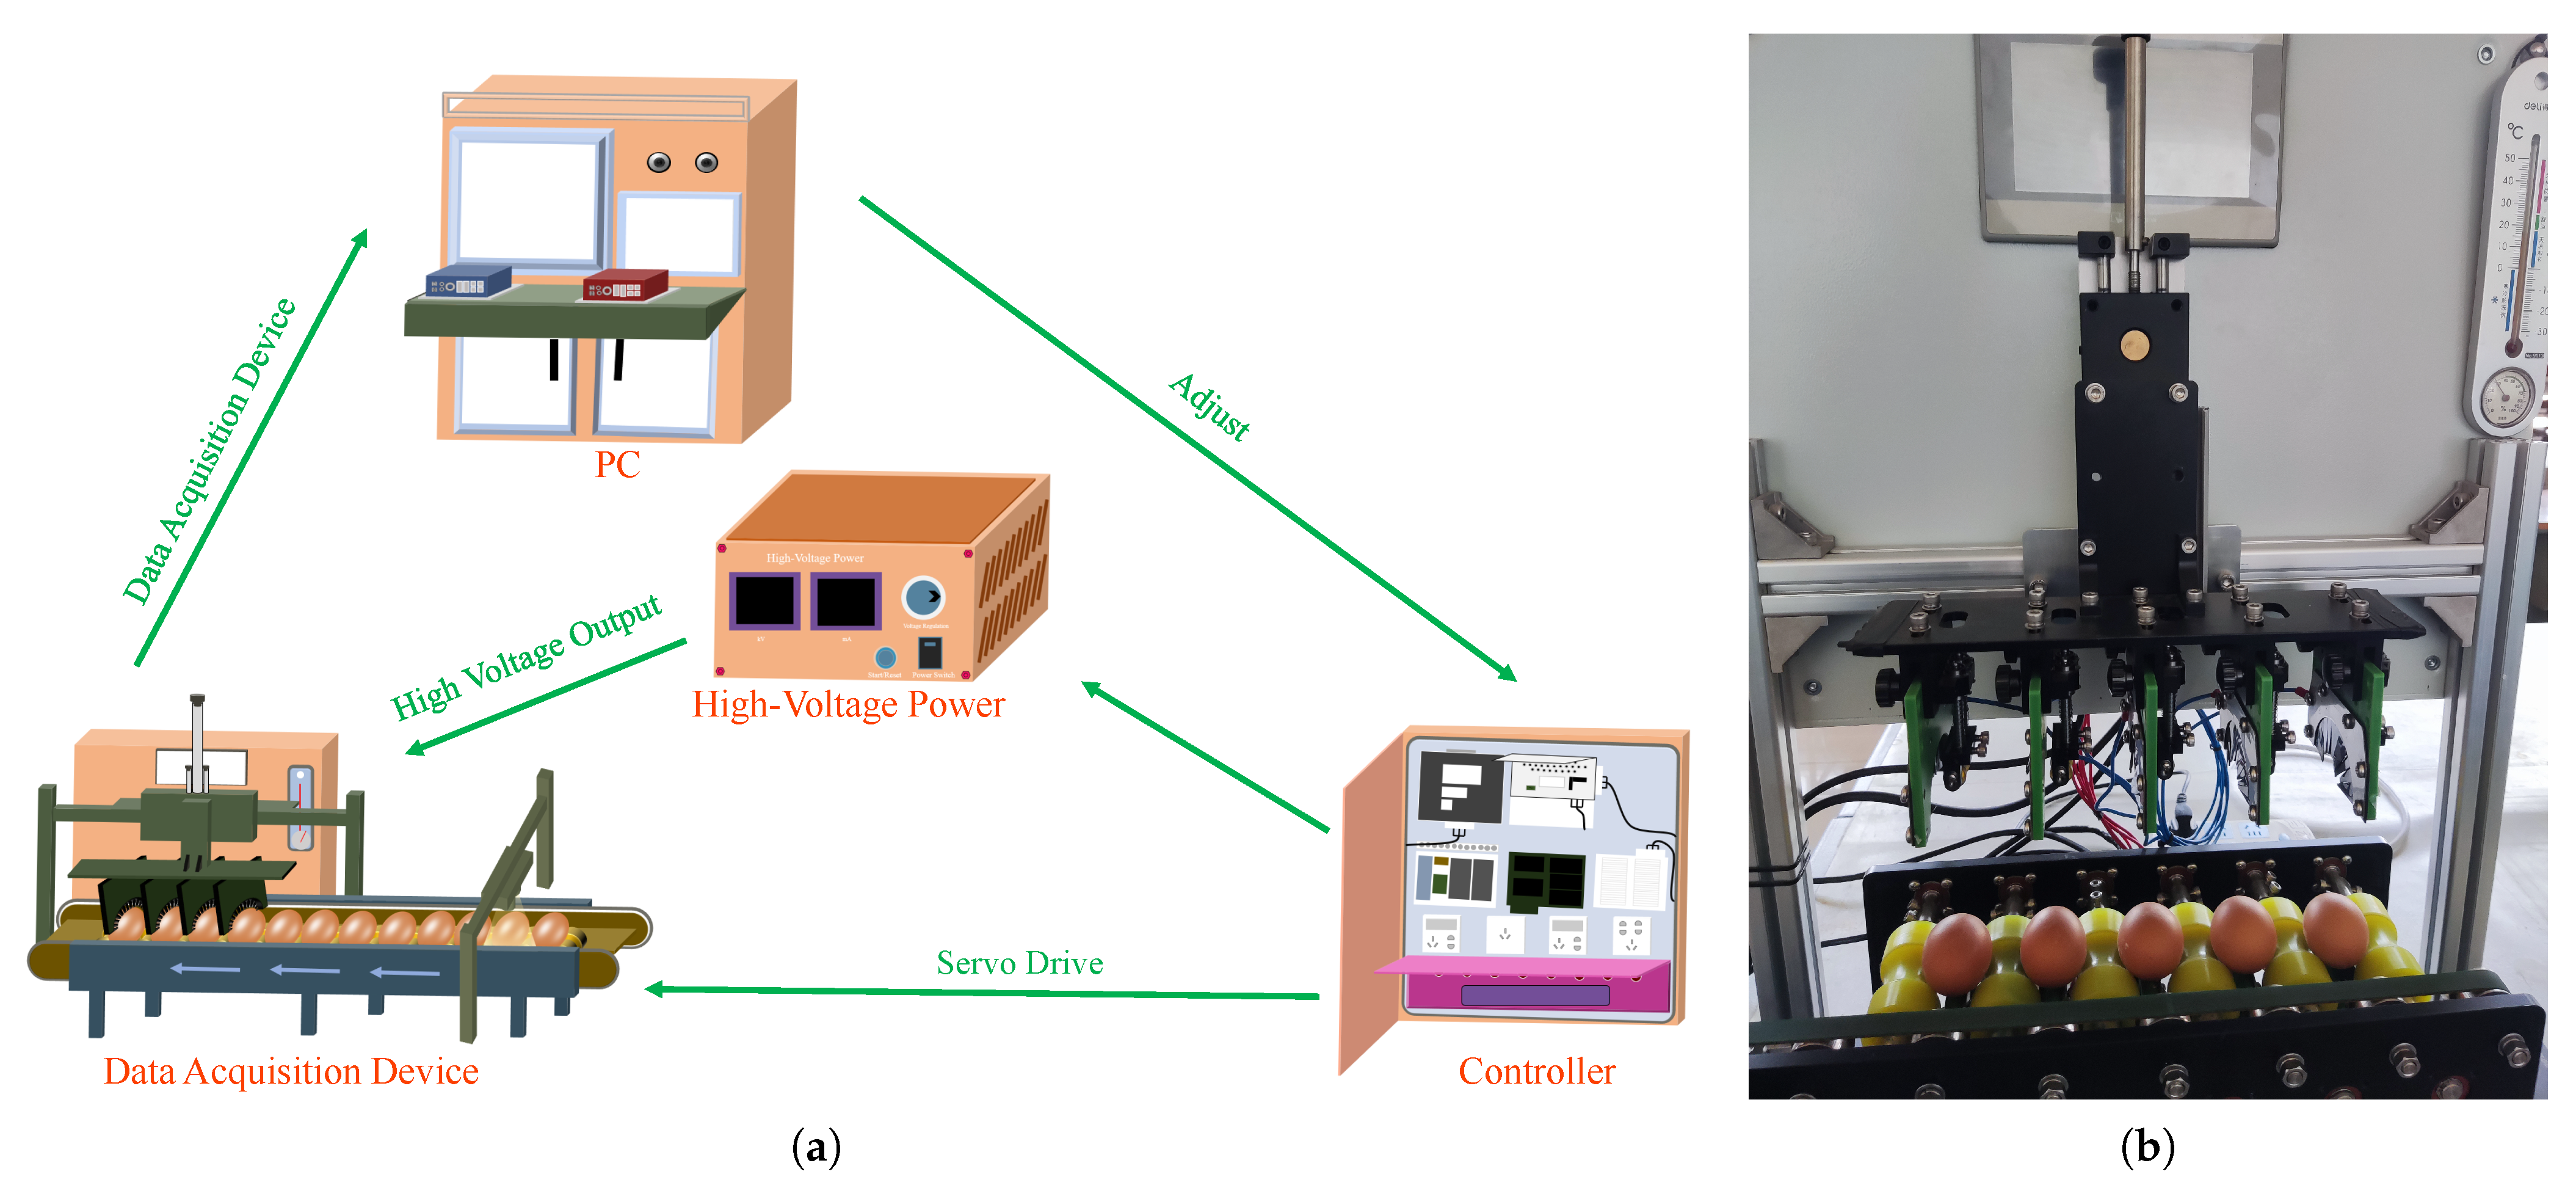
In this study, a crack detection system for poultry eggs based on real-time electrical characteristics was developed. As shown in Figure 2a, the system is mainly composed of four parts: a data acquisition platform, a high-voltage power supply, a controller, and a computer processing system. The data acquisition platform includes a visual detection part and a discharge detection part. The visual detection part is used to detect the size of eggs and control the automatic electrode adjustment mechanism. The discharge detection part comprises a rotating mechanism, a discharge electrode, an automatic electrode regulating mechanism, etc. The rotating mechanism ensures that eggs of different sizes can rotate flexibly and uniformly. The automatic electrode regulating mechanism adjusts up and down according to the data from the visual detection part to provide stable and reliable surface contact, as shown in Figure 2b. Through preliminary experiments and debugging, conductive silica gel was used as the electrode material for crack detection under a voltage of 1000 V, average humidity of 40%, and an average temperature of 18.5 °C. In this experiment, the current value is strictly controlled, and the automatic protection mechanism is triggered when the current exceeds 1 mA so that no damage will be caused to the eggs. In this study, the microcurrent signal obtained from an egg under the electrical characteristic crack detection system was used to evaluate and detect egg cracks. The detection and collection frequency of the detection system was set at 100 Hz, the collection time was 4.5 s, and the data length was 450 points. The data of egg rotation were collected 2.5 times in a single time, and one datum was collected for each egg.
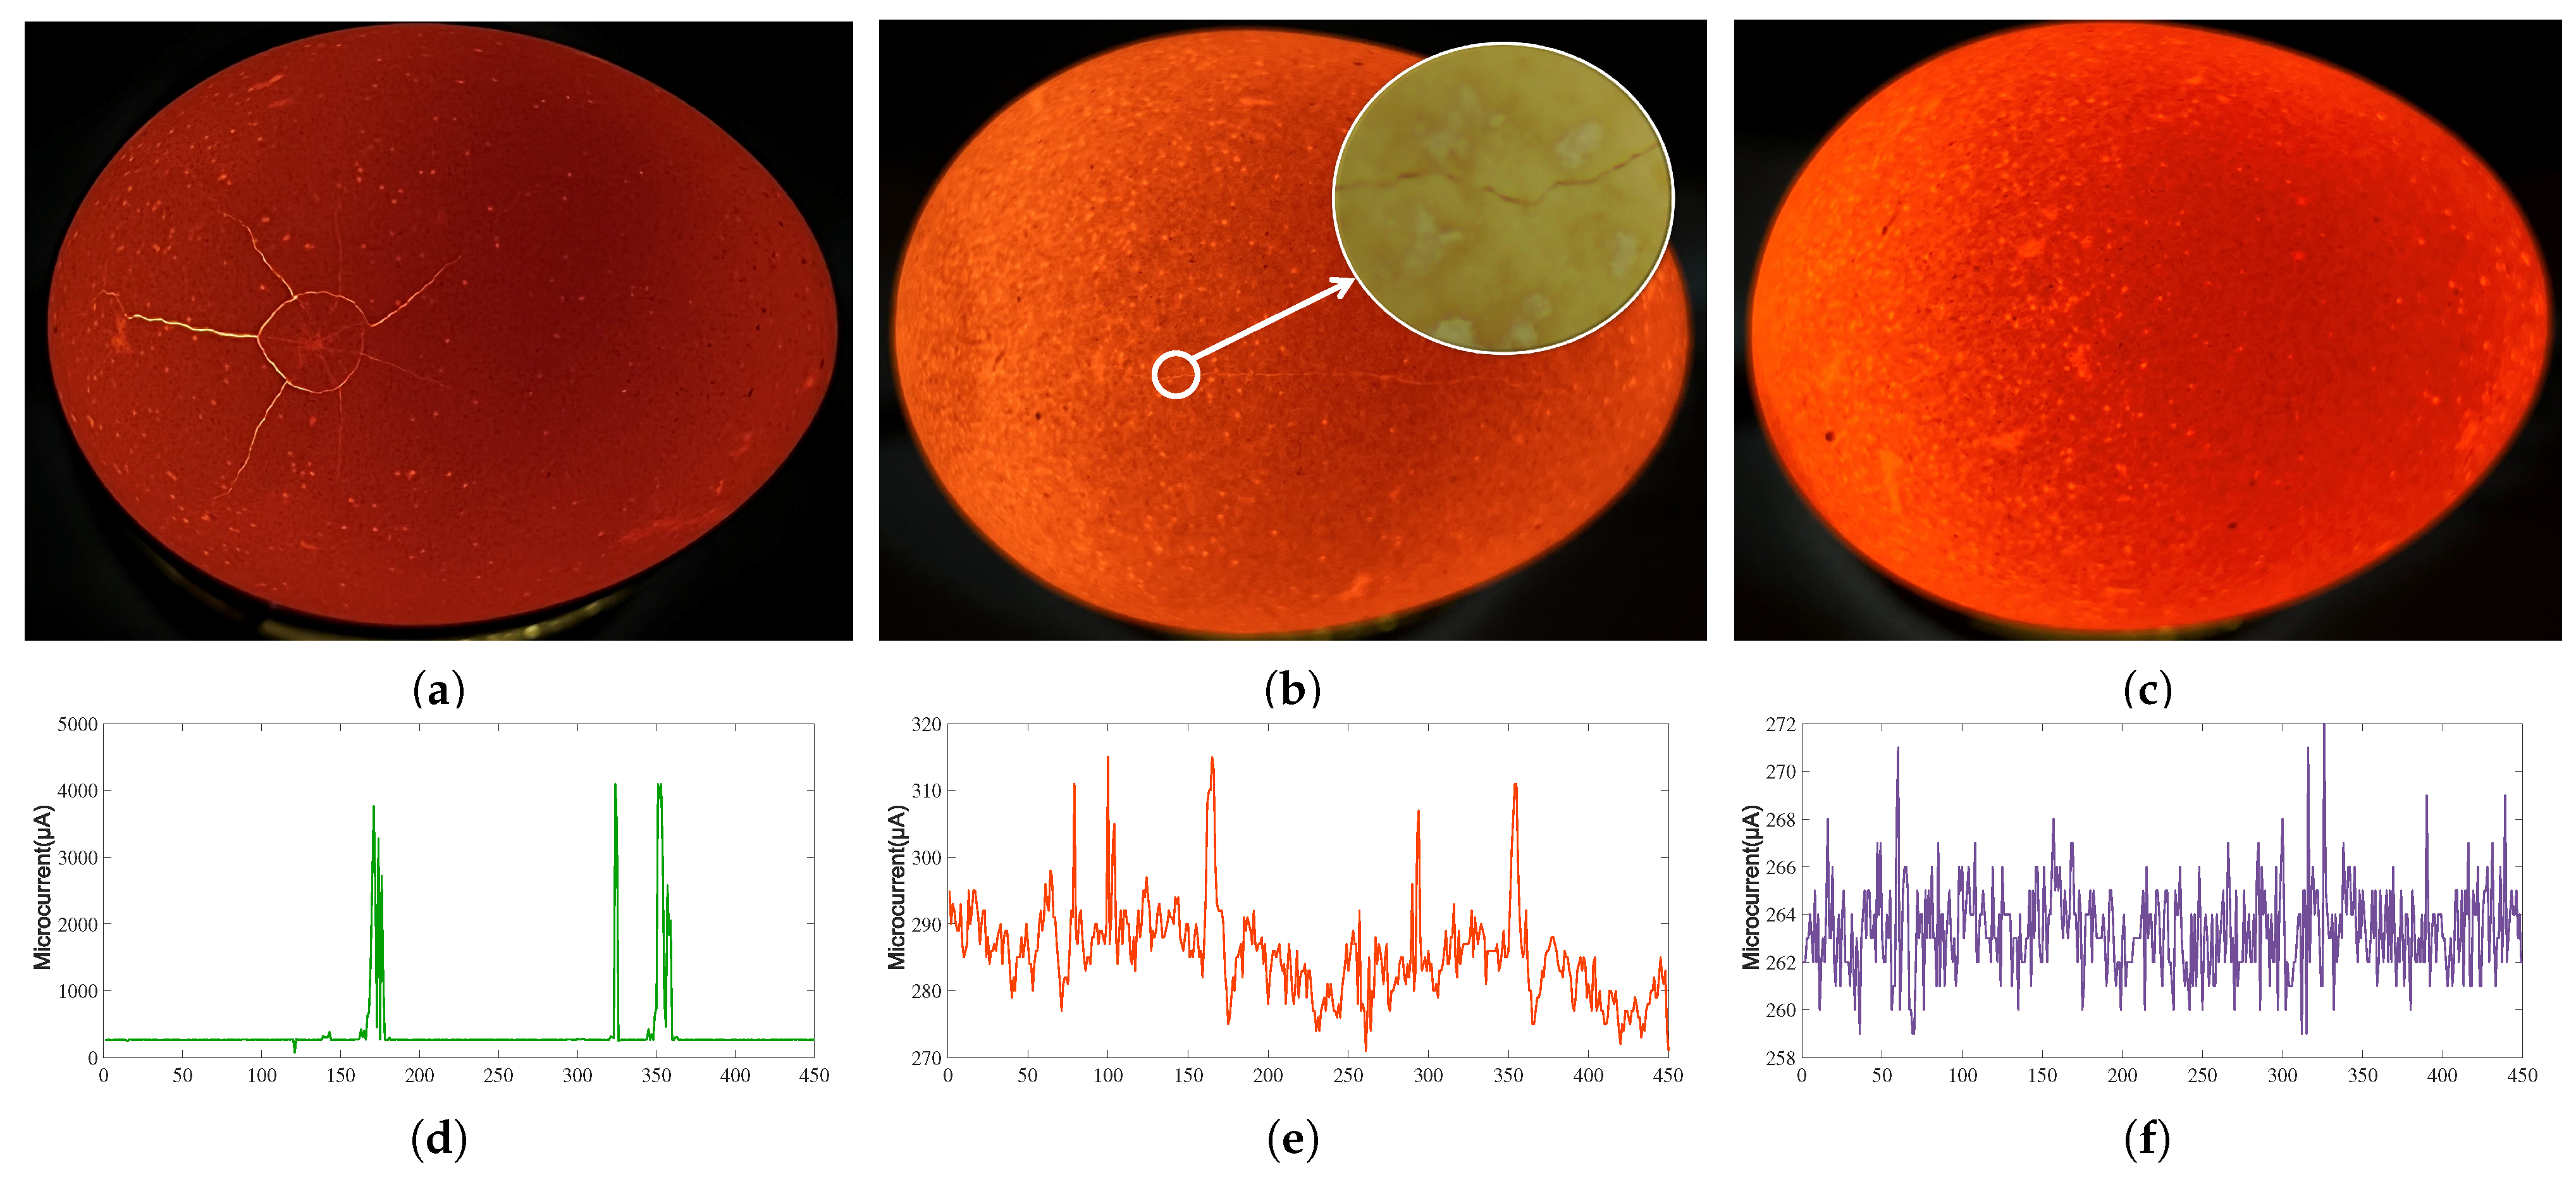
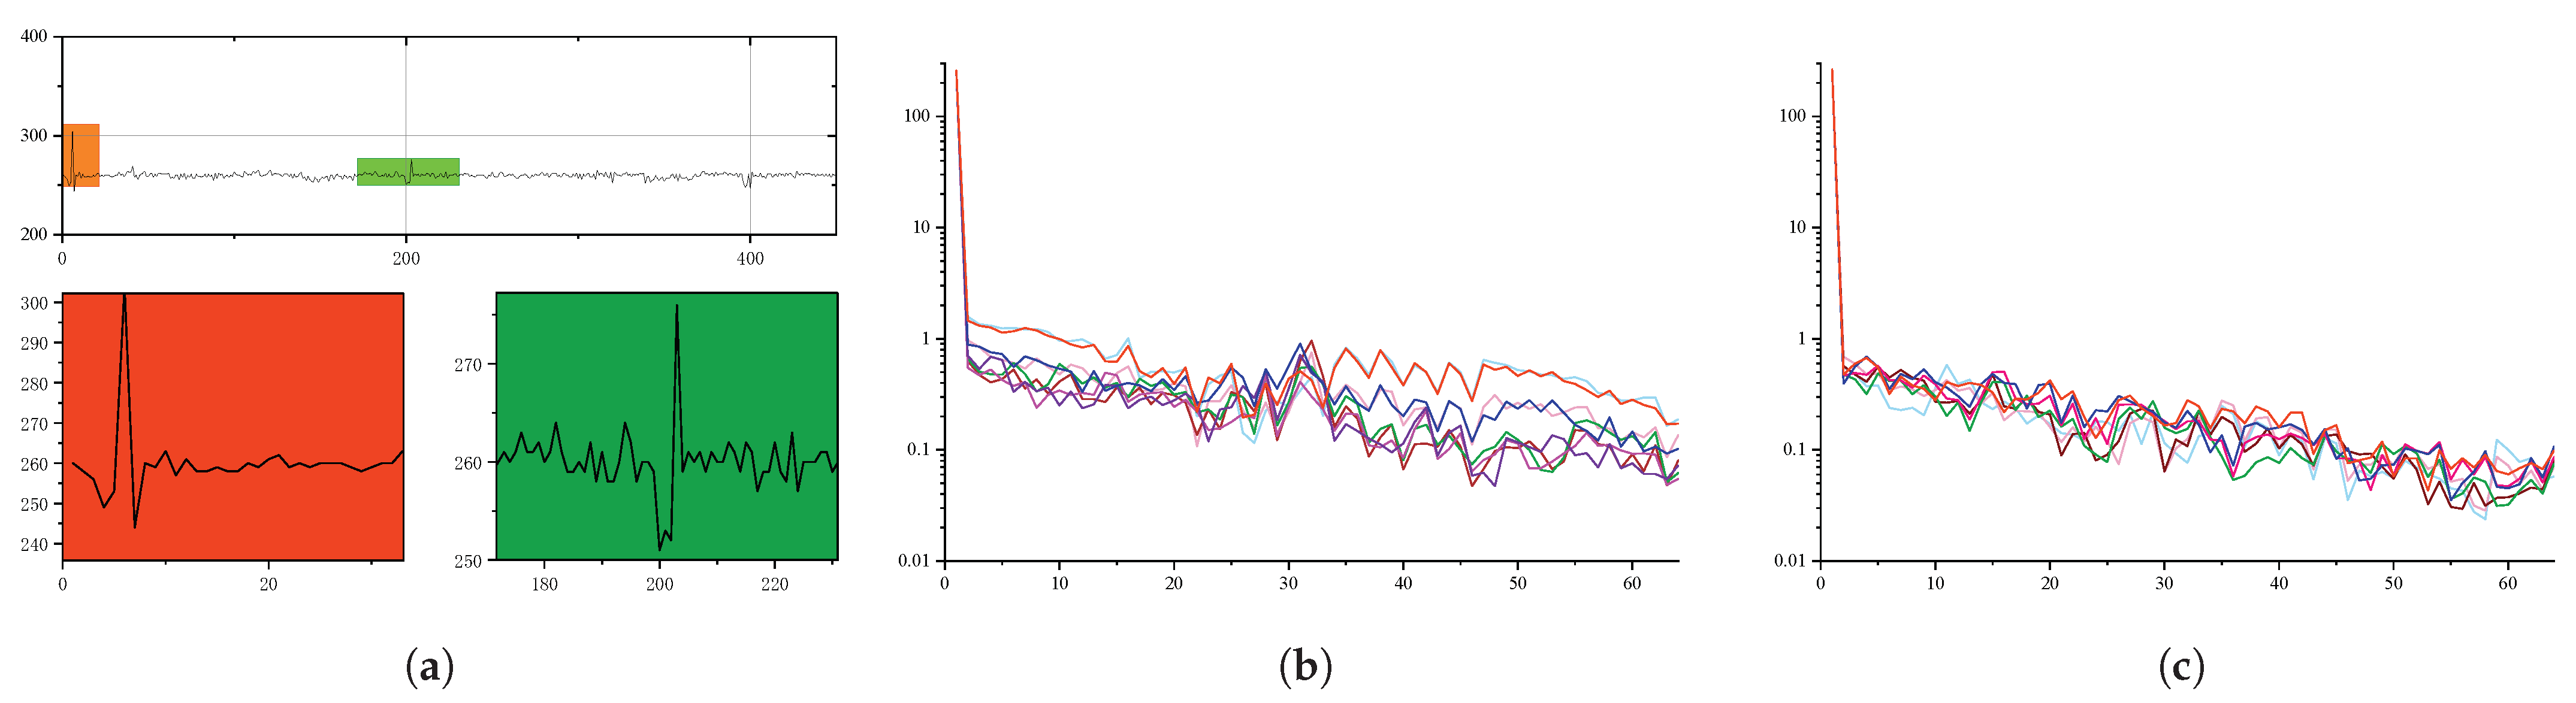
After the eggs are subjected to the application of a DC voltage, the data acquisition card acquires the micro-current signal from 450 sample points on the eggs. Three representative egg samples are selected for analysis, as shown in Figure 3a–c, which are examples of cracked egg samples, minimally cracked egg samples, and intact egg samples, respectively. Figure 3d shows a micro-current detection signal of the cracked egg sample in Figure 3a. When the electrode is swept to the crack location, a strong current response is generated, and the sample shows a sudden rise in a steady microcurrent signal. Figure 3f shows the microcurrent detection signal of the intact egg sample, which does not produce a strong current reaction under DC voltage. There is no special change in the whole rotation process, and the sample is very stable. The existing classification algorithm based on the electrical characteristic signals of eggs can have a good classification effect on the above samples. However, for some extremely tiny cracks, such as thsoe in Figure 3c, a microcurrent signal is used, as shown in Figure 3e. The strong current response is small, and the performance is similar to that of intact egg samples. Currently, the existing classification algorithms based on the electrical signal characteristics of eggs struggle to distinguish those extremely small cracks.
In order to verify the accuracy of the results, each experiment was executed multiple times. In each experiment, the training set and test set used by different methods remained the same. We randomly selected 70% of the sample data as the training set and the remaining 30% as the testing set for scattering feature extraction and then input these data to the deep learning network for classification for different experiments.

2.2. Detection Framework

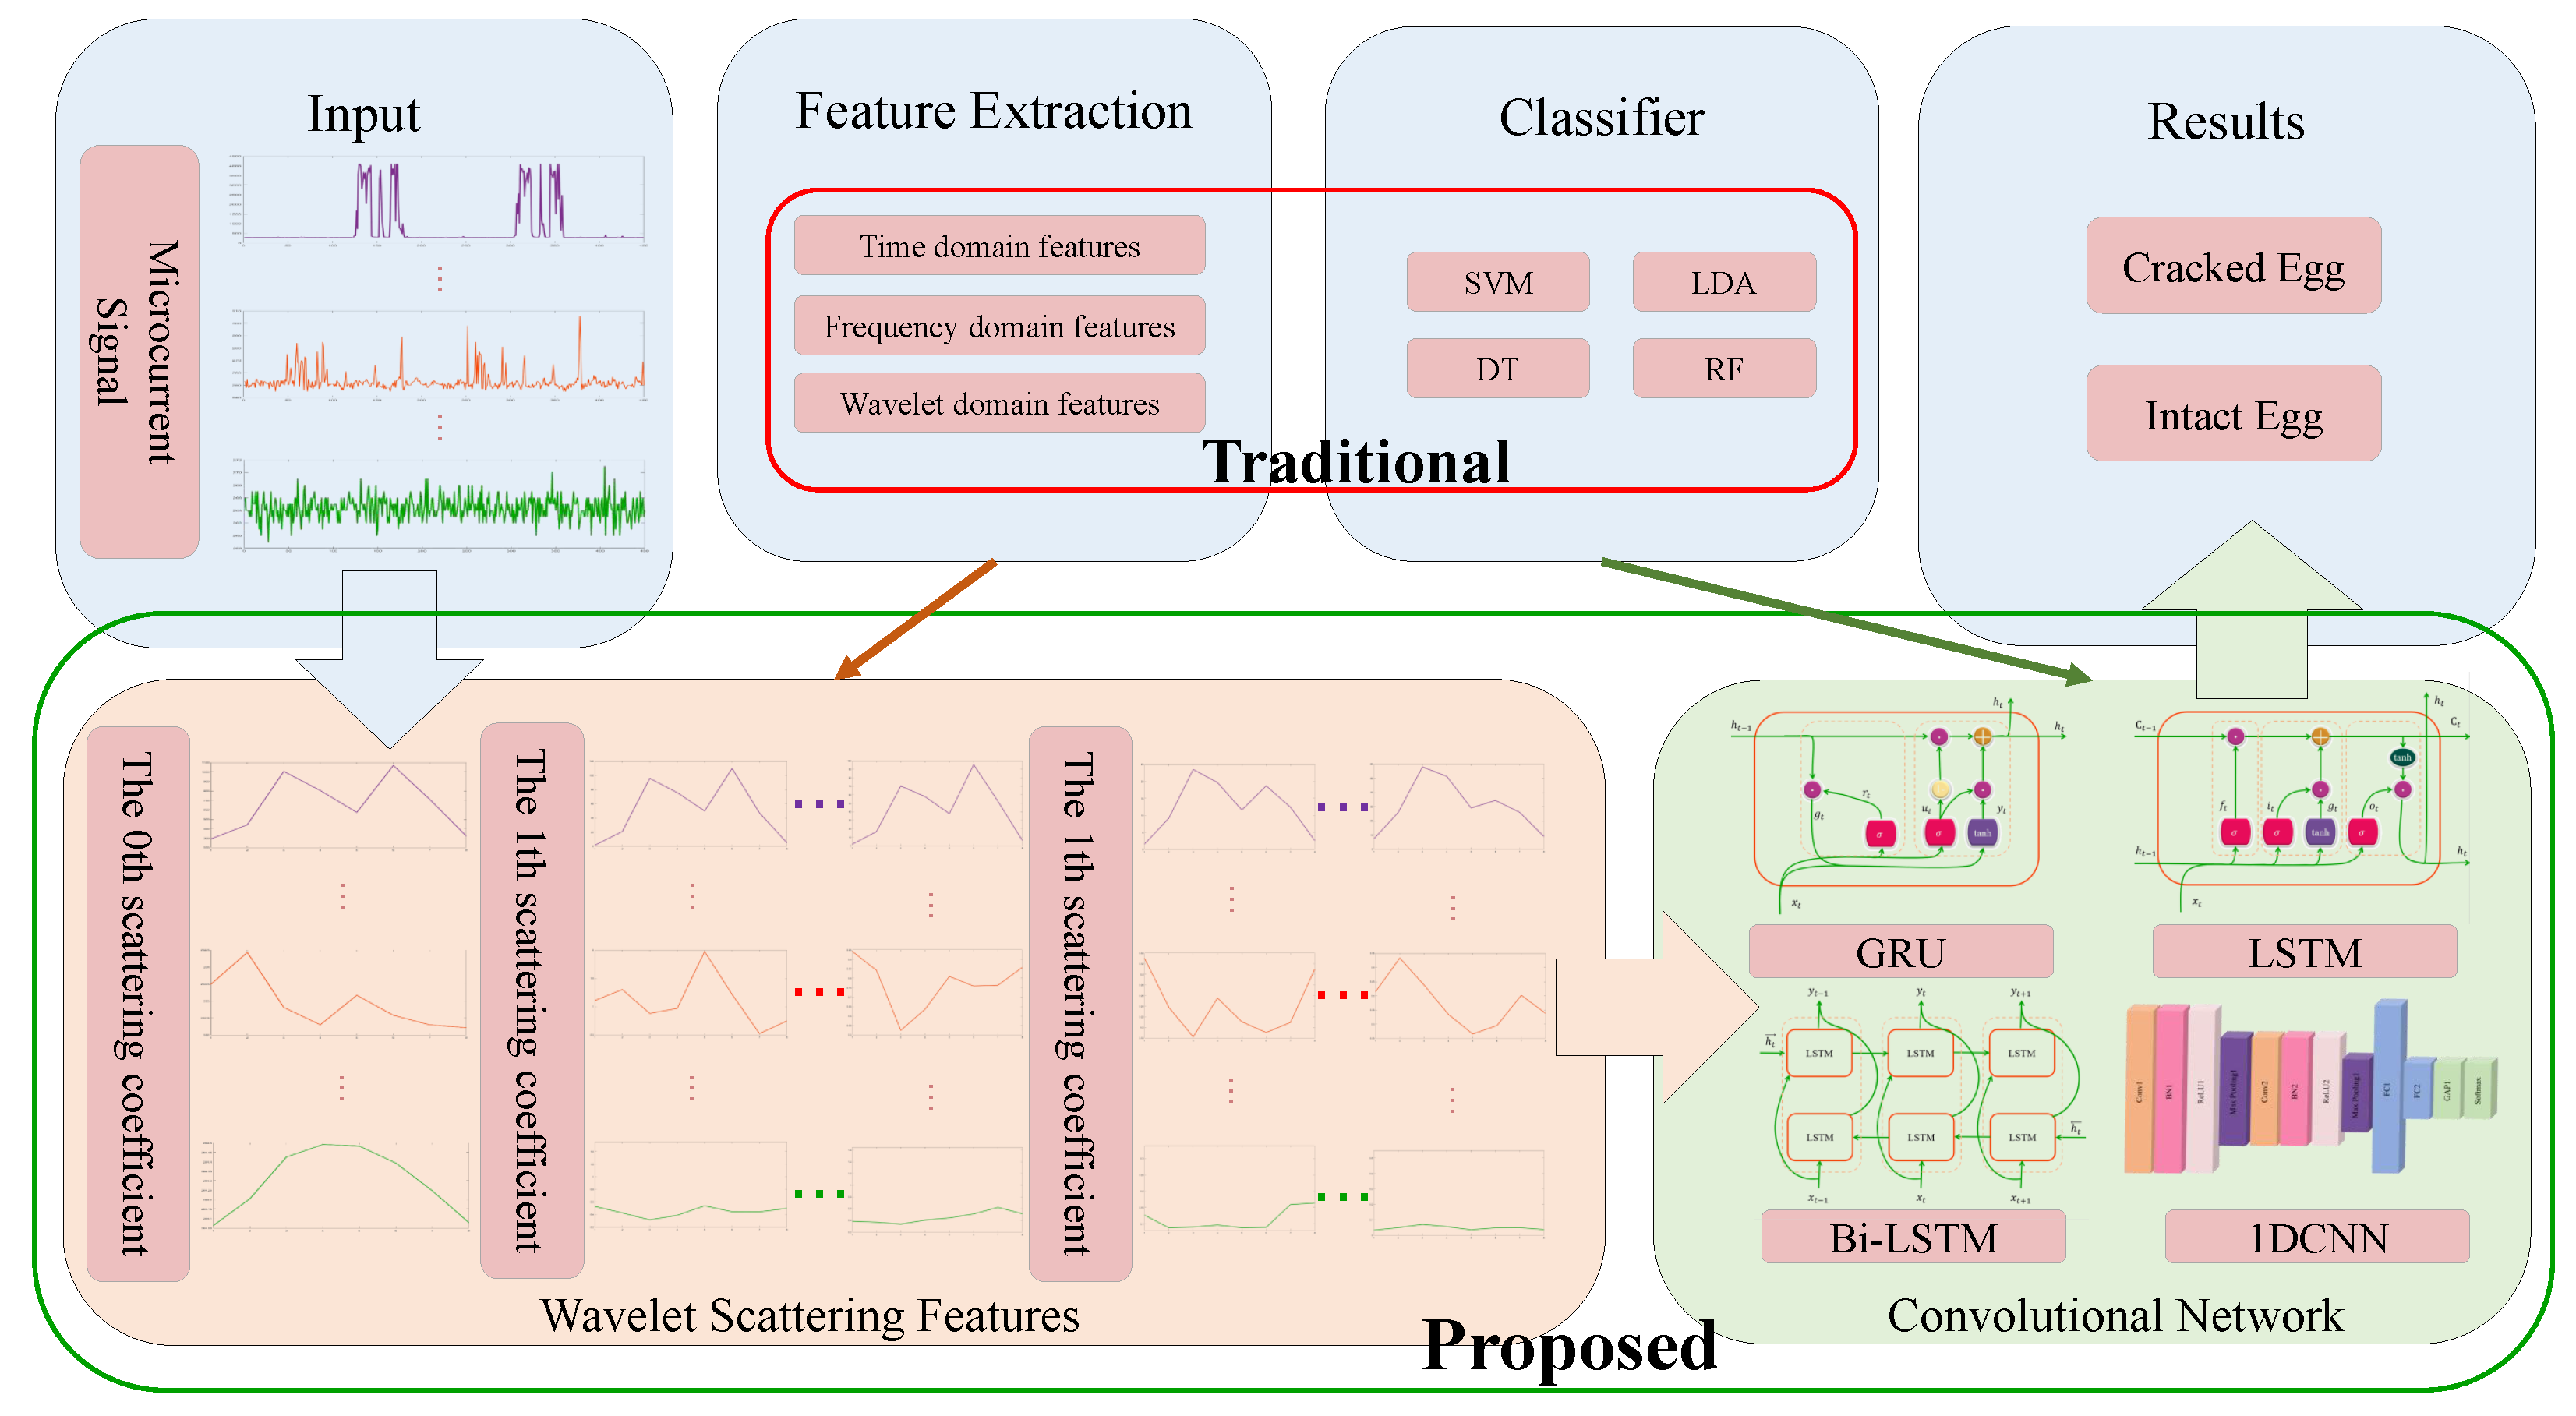
The framework of the current crack detection algorithm based on the egg electrical characteristics model is shown in part A of Figure 4. The time, frequency, and wavelet domain features were manually extracted, and the traditional machine learning algorithm was used for classification [14]. The features extracted by such methods are fixed, making it challenging to capture multi-scale features and, therefore, easy to overlook feature variations in detail. At the same time, traditional machine learning algorithms have low compatibility with feature dimensions and high dependence on features, leading to limitations in classification. Considering this situation, this paper investigates the feature extraction and classification of current signals separately, using wavelet scattering transform in conjunction with deep learning methods for experiments. Part Proposed of Figure 4 illustrates the algorithm framework based on the wavelet scattering convolution network used in this paper. In the feature extraction part, we used the wavelet scattering transform to extract the features of the current signal, which has the properties and advantages of translation invariance and local deformation stability and does not require a manual design to extract features from the signal. It is immune to translational and slight deformation information and discards the parts of the signal sensitive to translation and deformation while obtaining high-frequency information. The classification part was analyzed using deep learning methods, which have the advantages of high learning ability, portability, and compatibility with feature dimensions compared to traditional methods. In this paper, we tried different deep-learning methods to study the algorithms that can be used for the classification of microcurrent signals.

2.2.1. Wavelet Scattering Transform-Based Feature Extraction

Wavelet scattering transform (WST) [29,30,
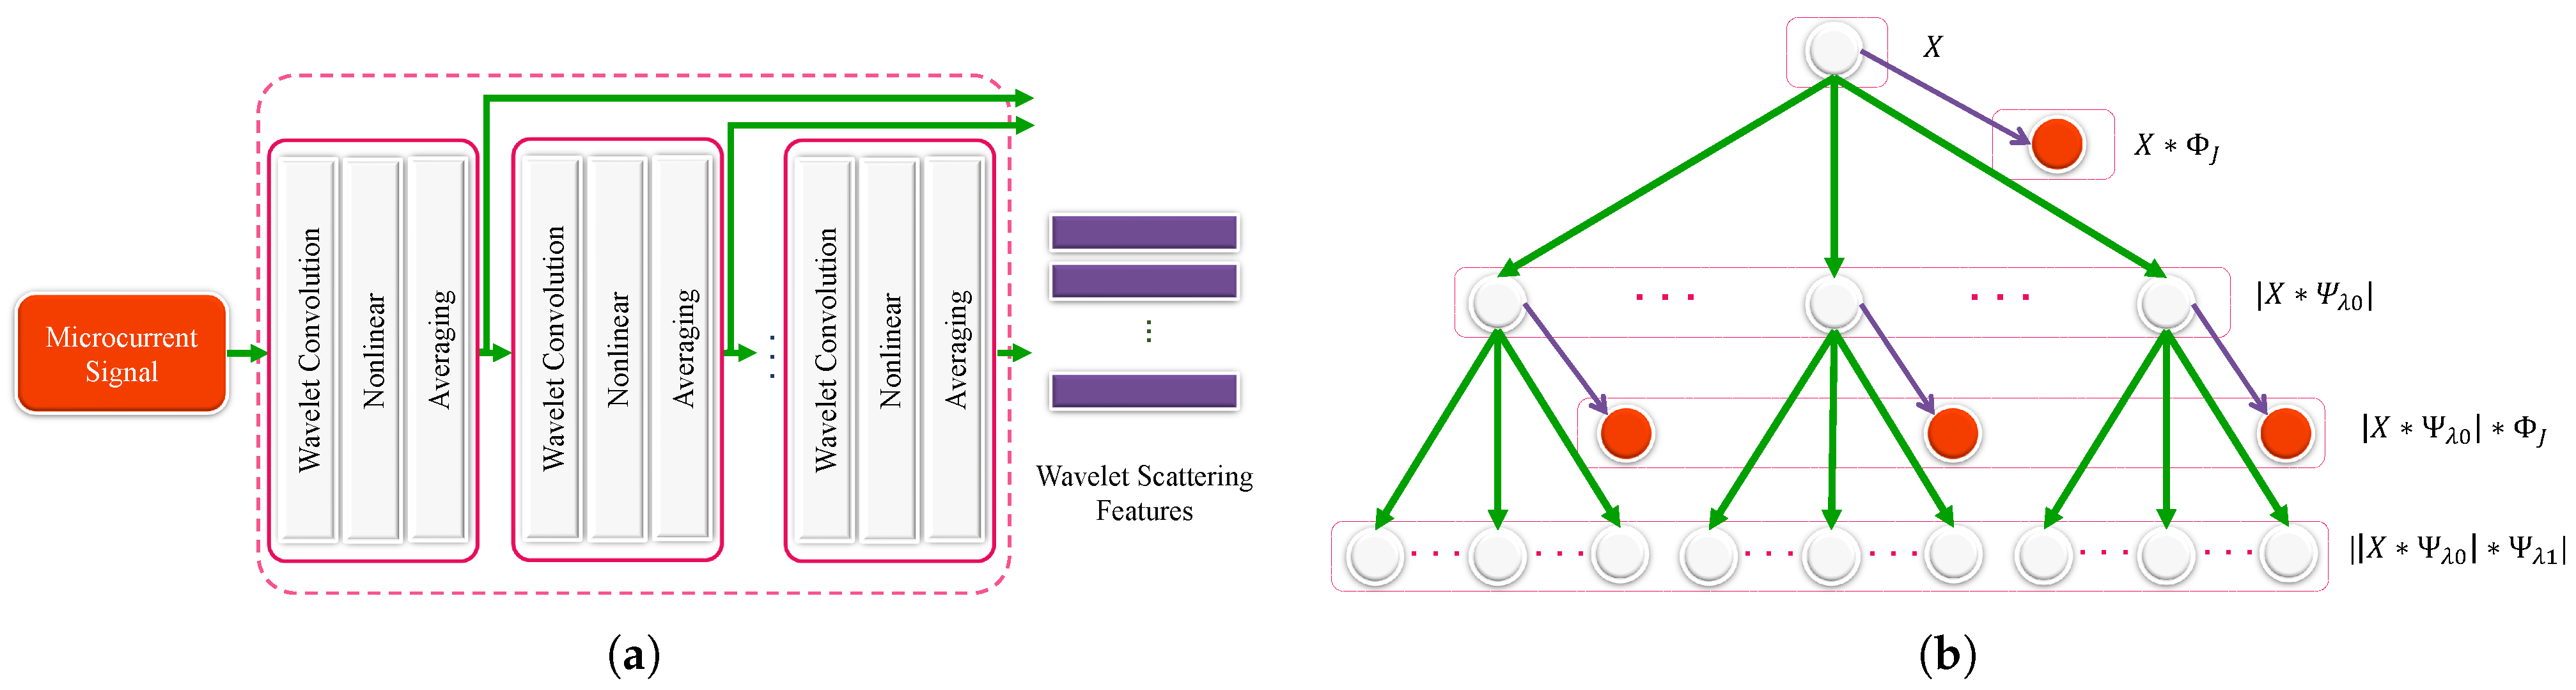
31] is an improved time-frequency analysis method based on wavelet transform, which solves the shortcomings of wavelet transform changing with time and has the advantages of translation invariance and local deformation stability of signal analysis and feature extraction. The wavelet scattering network is a framework for automatically extracting input signal features, requiring convolutional, nonlinear, and average cascade operations. After constructing the wavelet scattering network, the scattering coefficient matrix of training data can be obtained. The framework is shown in Figure 5a. In the wavelet scattering transform network, the convolution task is performed by the wavelet, the modular operator is used for nonlinearization, and the filtering function of the wavelet low-pass filter completes the pooling task.
Wavelet scattering takes the modulus of the wavelet transform, mainly because the mean value of the wavelet coefficient is 0. In contrast, the mean value of linear transformation will not change, so the non-0 wavelet coefficient can be obtained through nonlinear transformation to carry specific information. After removing the complex phase of all wavelet scattering coefficients, operator W can be obtained. By convolving with input signal X, the operator of the wavelet modulus transformation can be obtained:
W X = S X , U X
S X = X × ϕ J
U X = X × ψ λ
Equation (1) contains two parts: S X (see Equation (2), where ϕ J is the low-pass filter) is the invariant part, namely the scattering coefficient, which is the low-pass filtering and averaging of the input signal. It represents the translation invariance of the wavelet scattering transform, with the purpose of extracting the low-frequency information of the input signal and removing the high-frequency information. U X (see Equation (3), where ψ λ is high frequency wavelet) is the covariant part, representing the high frequency information on scale λ and acting as the exchange modulus of the nonlinear wavelet change. It is also the input to the next transformation and represents the stability of the operator, with the purpose of recovering the high-frequency information lost by the operation of the invariant part.
Therefore, the 0th-order wavelet scattering transform information is:
W 0 X = S 0 X , U 0 X
S 0 X = X × ϕ J
U 0 X = X × ψ λ 0
By taking the 0th-order high-frequency U 0 X as the input X 1 of the first-order scattering transform and calculating with the new wavelet modulus operator, the information of the 1st-order wavelet scattering transform is obtained.
W 1 X 1 = S 1 X 1 , U 1 X 1
S 1 X 1 = X 1 × ϕ J = X × ψ λ 0 × ϕ J
U 1 X 1 = X 1 × ψ λ 1 = X × ψ λ 0 × ψ λ 1
Similarly, by iterating the above process, the g 1 -order high-frequency U g 1 X g 1 can be used as the input X g of the first-order scattering transform to operate with the new wavelet modulus operator for the higher g-order scattering transform:
W g X g = S g X g , U g X g
The structure of the scattering transformation is shown in Figure 5b. Input current signals are iterated successively in layers, forming a series of scattering coefficients from order 0 to order g:
S G X = S 0 X , S 1 X 1 , , S g X g
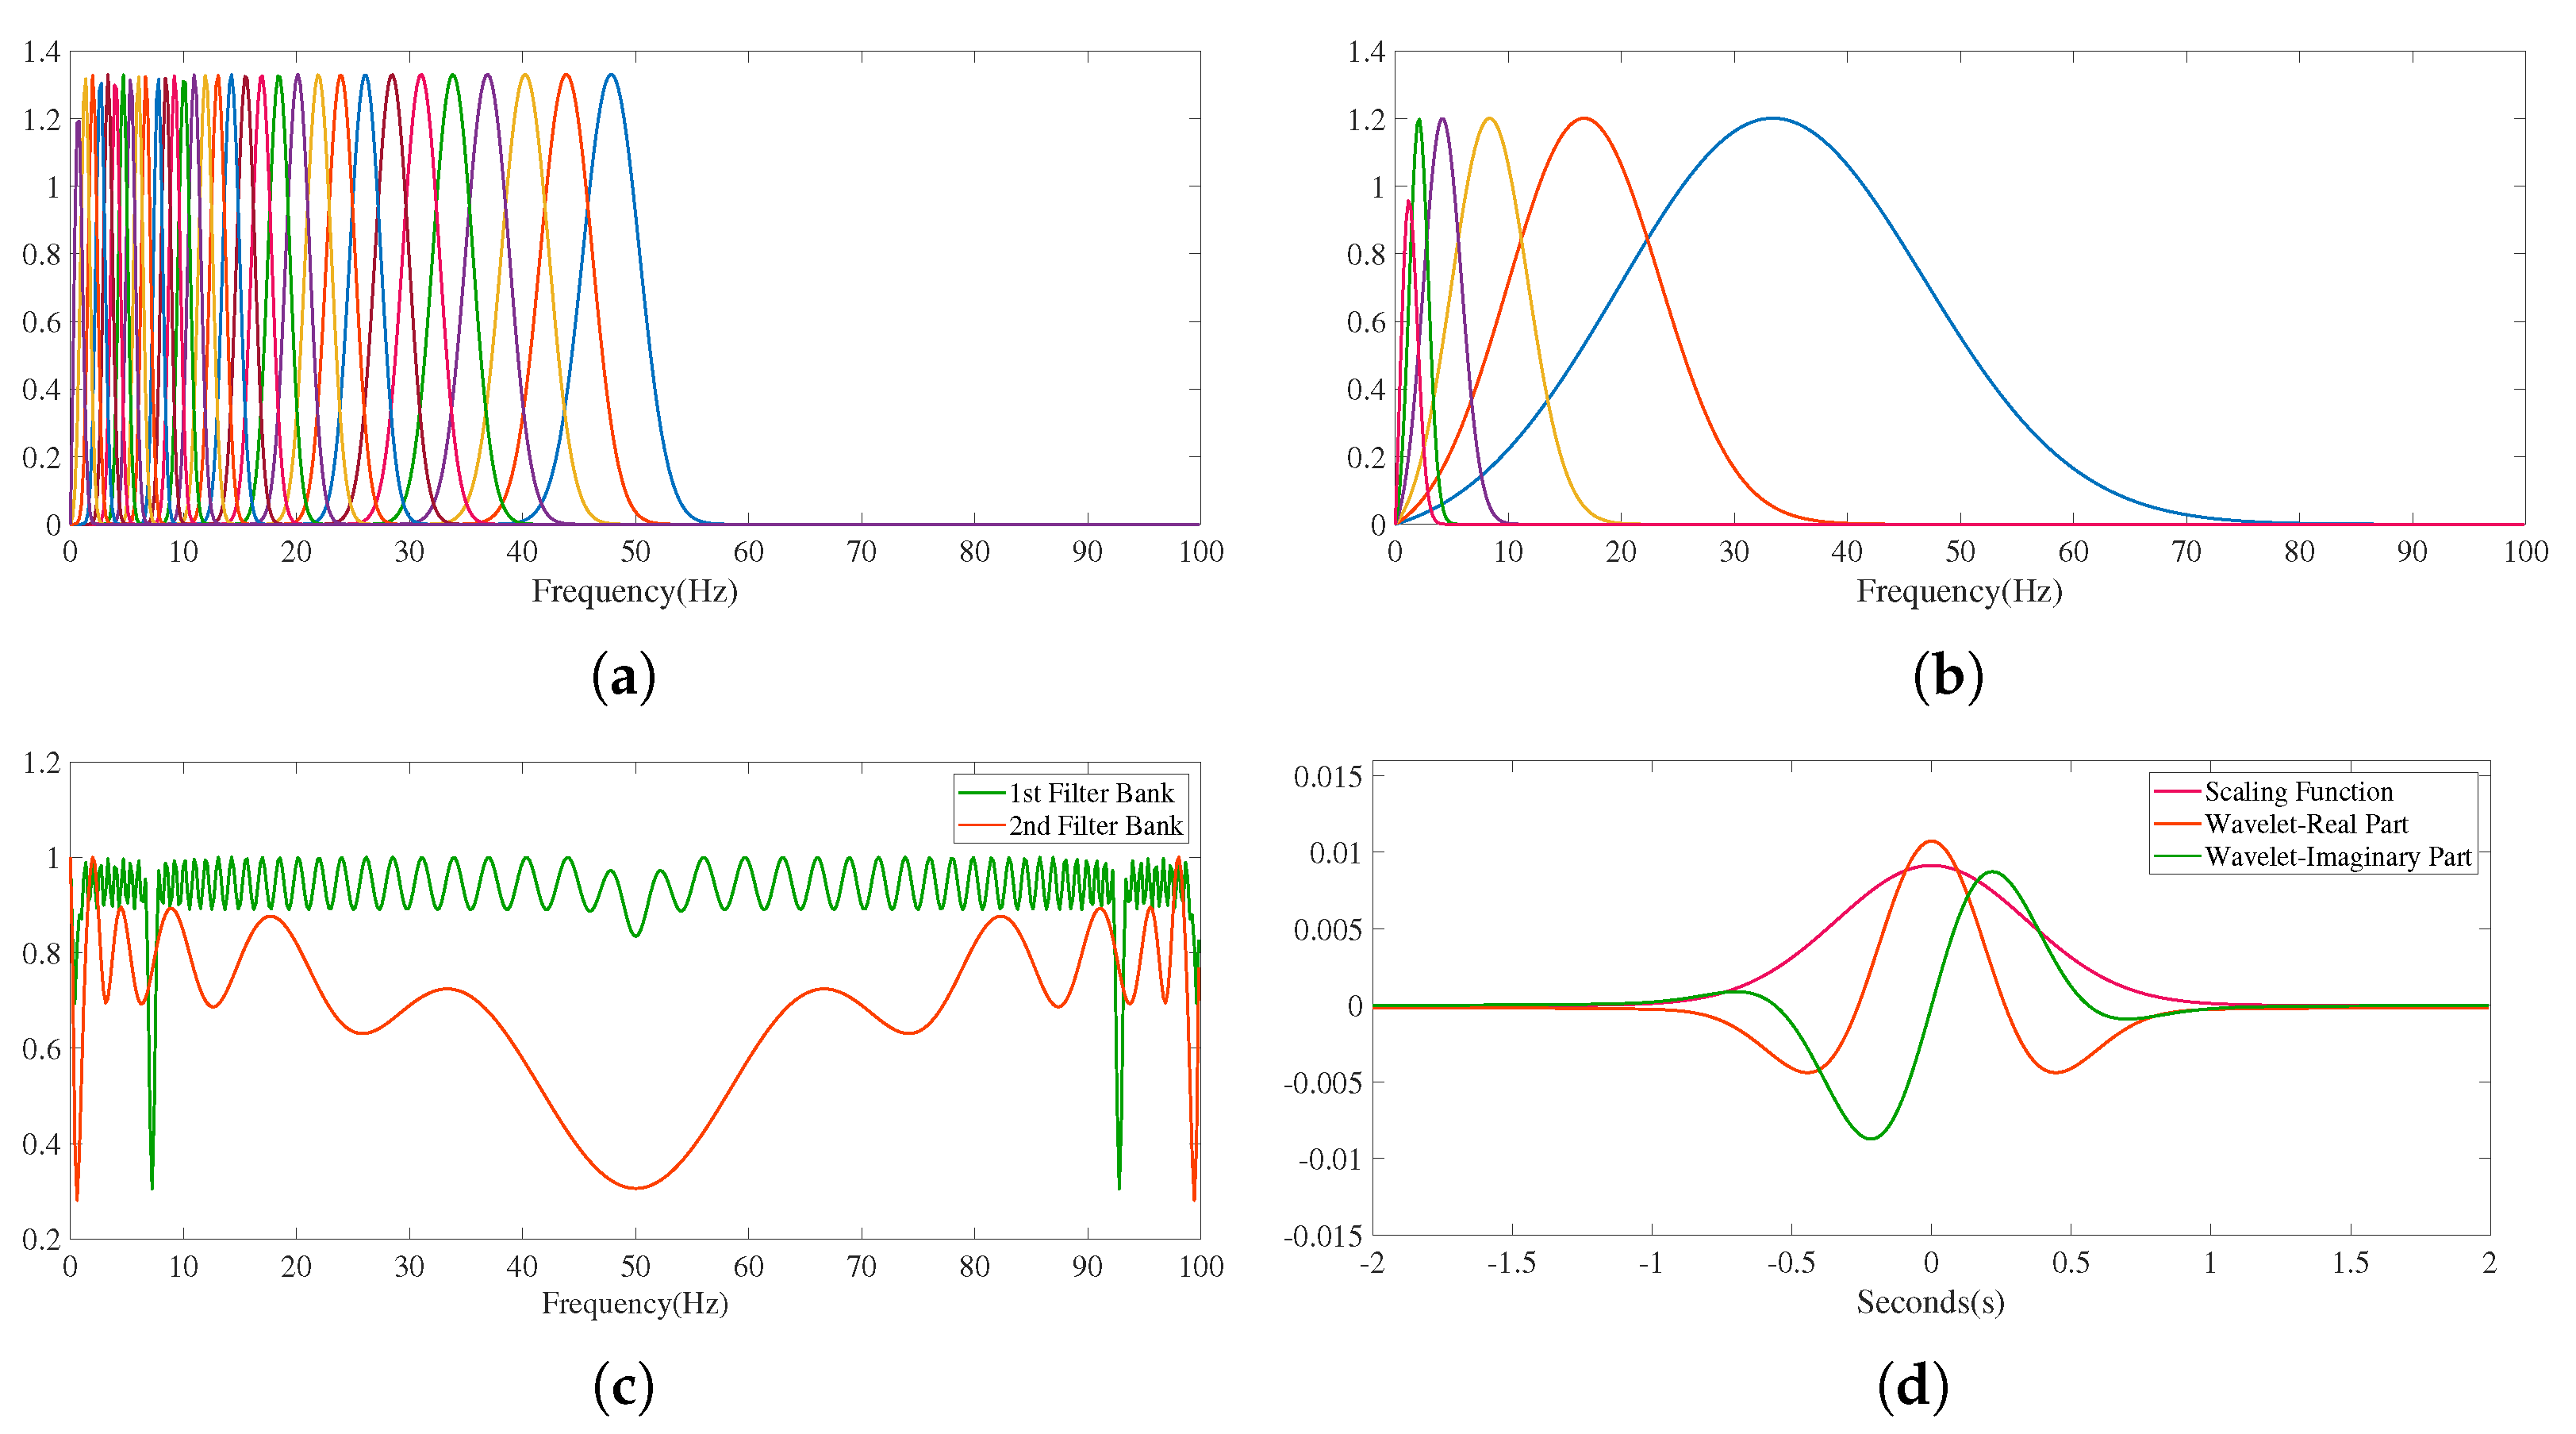
The scattering coefficient is the extracted micro-current wavelet scattering feature. After collecting the microcurrent signal of the egg, the wavelet scattering network is constructed to extract the wavelet scattering characteristics of the microcurrent signal, and a wavelet time scattering network with two cascaded filter banks is constructed. The first filter bank has eight wavelets per octave, the second filter bank has one wavelet per octave, the wavelet filter in the two filter banks is shown in Figure 6a,b, and the Littlewood–Paley sums of the filter banks are shown in Figure 6c. Figure 6d shows the Gabor small wave used for its low-pass filter to prove the invariance scale, obtain the inverse Fourier transform of the scale function, and center it in 0 s.

2.2.2. Classification Modeling Methods

Compared with traditional machine learning methods, deeper networks can accommodate richer semantic information and are more effective in processing temporal order, feature dimensionality, and scale. LSTM can effectively capture the association between long sequences, which is very effective in processing temporal information and can also alleviate the phenomena of gradient disappearance or explosion. Bi-LSTM is a combination of forward LSTM and backward LSTM, which can effectively use the input forward and backward feature information. GRU can effectively capture the association of long sequences, and the number of parameters used is small, which can also reduce the risk of overfitting. 1DCNN features scale shifts and invariance, region awareness, comprehensive feature learning, and fault tolerance, which can compensate for the shortcomings of other shallow classification algorithms with inadequate feature learning and poor generalization ability.
The data used in this paper are characterized by disorder, mutation, nonlinearity, and time discontinuity. Therefore, in this study, LSTM, Bi-LSTM, GRU, and 1DCNN were used to classify the features extracted from wavelet scattering. The details of these methods are as follows.
Long short-term memory (LSTM) [32] is a particular recurrent neural network (RNN), which is an improved neural network used to solve the problems of gradient disappearance and gradient explosion inherent to traditional RNNs in long sequence samples. The neural unit of LSTM contains three different gate structures: forgetting gates, input gates, and output gates to control information. Its appearance successfully solves the problem that the original RNN cannot store information for a long time and can effectively reduce the feature input dimension of the signal and enhance the temporal modeling capability.
Bi-directional long short-term memory (Bi-LSTM) [33] is a variant of LSTM, which refers to the combination of forward LSTM and reverse LSTM. The forward and reverse layers are simultaneously connected to the input and output layers through different weights. There is input each time, while the hidden layer has two node vectors, which can be transmitted from forward to backward or backward to forward. The state transmission is bidirectional. It can learn not only the rule of forward data but also the rule of backward data. Applying LSTM twice can improve the long-term dependence on learning and thus improve the model’s accuracy.
A gated recurrent unit (GRU) [34] is a simple variant of LSTM, and its working principle is similar to LSTM. It has two gates: update doors and reset doors. GRU aims to reduce parameters to optimize the cell structure and improve operational efficiency, making converging during training more manageable. Its flexible and straightforward structure guarantees accuracy while significantly reducing the time required for classification.
A convolutional neural network (CNN) [35] is a typical representative of deep learning, consisting of an input layer, convolutional layer, pooling layer, fully connected layer, and output layer. Similar in structure to CNN, a one-dimensional convolutional neural network (1DCNN) [36] refers to a CNN whose input is a one-dimensional vector; similarly, its convolution kernel is one-dimensional, and it carries out a one-dimensional convolution operation. It is a deep learning algorithm suitable for processing one-dimensional data. Compared with 2DCNN, the convolution kernel of 1DCNN only needs to be scanned in one direction. The convolutional layer performs convolution operations on the one-dimensional input signal and the one-dimensional convolution kernel and then extracts the features through the activation function. The pooling layer scales and maps the input data through the pooling kernel and extracts features while reducing the dimension of the data. This paper uses max pooling, which selects the maximum value of each small region as the output. Pooling operations can reduce the size of spatial information, improve operational efficiency, and reduce the risk of overfitting.
As we all know, the selection of hyperparameters affects the performance of deep learning to a large extent. The improper setting of hyperparameters may lead to under-fitting and over-fitting of the network model during training, so that the samples outside the training samples cannot be accurately classified. In this paper, the method of grid search [37] is used for hyperparameter selection first, and the optimal hyperparameter method is determined by traversing the given parameter combination to determine the optimal value performance. Finally, we used the methods of LSTM, Bi-LSTM, GRU, and 1DCNN to classify the extracted feature data. The maximum number of rounds of training was 150. The Adam optimizer was applied. The learning rate was 0.01. The learning rate decline factor was set to 0.2. The number of iterations when the learning rate decreases was 5. The fully connected layer had two layers, and the number of corresponding classifications in the second layer was finally classified using the probability of the Softmax layer. The prediction label of the test sample was the output.

2.3. Performance Indicators

We divided all samples in the classification model into positive and negative samples. In this paper, cracked eggs were labeled as positive samples, and intact eggs were marked as negative samples. The prediction category determined by the model was obtained by predicting the sample data output in the model. In order to better evaluate the classification performance of the proposed detection model, five evaluation indicators, accuracy (ACC), precision (P), recall (R), F1-score (F1), and Matthews correlation coefficient (MCC), were used to comprehensively evaluate the algorithm models regarding their classification ability.
We define the false-positive (FP) rate as the number of negative samples that the model incorrectly predicts as positive samples. We define the true-positive (TP) rate as the number of positive samples correctly predicted by the model as positive samples. We define the false-negative (FN) rate as the number of positive samples that the model incorrectly predicts as negative samples and the true-negative (TN) rate as the number of negative samples correctly predicted by the model as negative samples.
Accuracy (ACC), precision (P), recall (R), and F1-Score (F1) are common performance indicators used to evaluate the predictive ability of classification models, and their calculation formulas are as follows:
A C C = T P + T N T P + F P + T N + F N × 100 %
P = T P T P + F P
R = T P T P + F N
F 1 = 2 × P × R P + R
The Matthews correlation coefficient (MCC) [38] comprehensively considers TP, TN, FP, and FN. It is considered to be a better measure of the classifier’s performance. The value range of the MCC is [−1, 1]. A value of 1 means that the prediction is entirely consistent with reality, a value of 0 means that the predicted result is not as good as the result of random prediction, and a value of −1 means that the predicted result is inconsistent with the actual result. MCC is defined as follows:
M C C = T P × T N F P × F N F P + T P T P + F N F N + T N T N + F P
We used ACC, P, R, F1, and MCC as the evaluation indicators of the proposed method. In addition, the training time and preference time of the model were considered as a metric for performance evaluation, as they are of great significance to the real-time detection of cracked eggs.

2.4. Experimental Environment

All experimental calculations in this study were performed using MATLAB R2022a software, and the experimental computer processor was an 11th Gen Intel (R) Core (TM) i5-11400H @ 2.70GHz 2.69 GHz, Windows 10 (64-bit) Professional version.

3. Results and Discussion

3.1. Experimental Data

The experimental data came from fresh eggs purchased at the farmers’ market near the laboratory. The eggs were cleaned and transported to the laboratory. The mass of each egg was between 43.2 g∼62.3 g. The intact samples were observed under 10× magnification, and a total of 400 eggs were observed. To quickly obtain a sufficient number of egg microcrack samples, we selected 220 cracks of different types and positions by exerting external forces on different positions of eggs through the egg crack collision machine. The width of the artificial microcracks was generally less than 3 microns, which is usually not easy to observe with the human eye. The samples that could not be subjected to a discharge test due to excessive force or improper operation during the production process were rejected. Finally, a total of 356 egg samples that met the requirements were selected for experimentation, as shown in Table 1.

3.2. Wavelet Scattering Transform Features

Based on the settings described above, a wavelet scattering network was constructed to extract the wavelet scattering characteristics of the microcurrent signal. After the signal input network, the wavelet scattering transformation was carried out layer by layer, and the 0th scattering output was the convolution coefficient of the original signal and scale function. Figure 7 shows the partial scattering results obtained from the cracked egg sample in Figure 3e and the intact egg sample in Figure 3f and the scattering coefficient of 8 time windows, respectively.
The scattering feature of the cracked egg signal maintains the undulation information at the crack, and the scattering feature of the intact egg signal clarifies the small deformation in the original signal process and maintains the elastic deformation stability of the signal. The feature matrix extracted by the wavelet scattering network maintains the stability of the signal feature while ensuring that the information is not lost so that the cracked egg and intact egg signal features extracted by wavelet scattering transformation have an apparent distinction. The first and second order output a matrix of wavelet scattering coefficients, the dimensions of which represent the scattering path and wavelet scale, respectively. A current signal with a data size of 450 × 1 is input to the wavelet scattering network to extract the wavelet scattering feature with a data size of 64 × 8, where each row and column correspond to one scattering path and one time window, respectively.

3.3. Comparison of Experimental Results and Analysis

3.3.1. Experimental Results

Based on the optimal hyperparameters, we constructed and trained the wavelet scattering convolutional network to classify the microcurrent signals. In addition, we also used the previously studied methods to classify the microcurrent signals. The resulting comparison of the final classification is shown in Table 2. By comparing the five models, it can be found that WST+1DCNN gets higher results on index ACC (99.4393%), F1 (99.4357%) and MCC (98.8819%). WST+GRU and WST+1DCNN get higher results on R (99.6226%) index, WST+Bi-LSTM obtains higher results on index P (99.6154%). In general, the detection effects of WST+LSTM, WST+Bi-LSTM, WST+GRU, and WST+1DCNN based on the wavelet scattering convolutional network are superior to existing methods [14]. The algorithm based on WST+1DCNN has the best recognition effect and can effectively and accurately detect cracked eggs. The accuracy is 2.0561% higher than the accuracy of the existing method [14]. In terms of the real-time implementation of the method, the training time of the previous method is faster, being almost half of that of the method studied in this paper. Considering that all models can be pre-trained, the research in this paper is acceptable in terms of training time. We found that all five methods were able to keep the reasoning time within 0.01 s, with the previous research method processing the fastest at 0.0009 s. In contrast, previous studies used machine learning to extract manual features, while this study uses deep learning to implement, which requires the integration of multiple convolutional blocks, so the network architecture is deep and the time is relatively long. However, the results obtained in this study have met the requirements of industrial real-time detection of egg cracks, and the processing speed is faster than other microcrack detection techniques; see Table 3 for details. In conclusion, the method proposed in this paper can detect cracked eggs effectively and accurately and is acceptable in practical application.
To further verify the validity of the method proposed in this paper, we re-experimented on the dataset used in the existing method [14] and conducted a comparative study. A total of 770 egg signals were collected, including 367 intact egg signals and 403 cracked egg signals. The final results are shown in Table 4. Compared with the existing egg microcrack classification algorithm based on the electrical characteristics model, our proposed method has improved the accuracy rate by 0.3478 % in the dataset. Considering the results above, the results obtained in this study on the detection of microcracks based on the electrical characteristics of eggs are better than those obtained by the preliminary experimental methods. It mainly considers feature extraction and classification algorithm. In the aspect of feature extraction, the existing method extracted the time domain feature, frequency domain feature and wavelet feature of the micro-current signal. A specific function calculates the features extracted by the manual design-based feature extraction method, so the extracted features will ignore the changes in detail, resulting in some of the distinguishing representative features being ignored, such as the cracked egg feature shown in Figure 8a, where the crack changes are subtle. The features extracted by traditional manual design methods focus on the general information of the signal and therefore struggle to capture the variations in detail. The wavelet scattering transform used in this paper extracts invariant and small deformation-stable features to extract multi-scale high-frequency feature vectors. The features extracted from the sample in Figure 8a using the wavelet scattering transform are shown in Figure 8b, which is significantly different from the regular intact egg signal features shown in Figure 8c. It can maintain the undulation information at the crack so that the features at the crack can have a clear representation in the whole feature matrix for classification and differentiation. In the aspect of classification algorithm, the machine learning method was used for classification in the previous experiment. Compared with the machine learning algorithm, the deep learning algorithm used in this study can effectively capture the correlation between long sequences and has a good effect in the processing of time sequences, feature dimensions, and scales and can carry out the comprehensive learning of features. Therefore, the method proposed in this paper can improve the performance of the model according to the electrical characteristics of eggs and can be used online in the detection of microcracked eggs in industrial application.

3.3.2. Ablation Study

To evaluate the superior performance of the microcrack nondestructive detection algorithm for egg electrical characteristics based on wavelet scattering convolution network proposed in this paper, the extracted current original signal and the characteristics processed by wavelet scattering transformation were inputted to four classification methods for comparison, including LSTM, Bi-LSTM, GRU, and 1DCNN. The results are shown in Figure 9a. For the four classification methods, the accuracy of the wavelet scattering feature extraction was 2.243%, 1.8692%, 3.3644%, and 2.9907% higher than the accuracy of directly feeding microcurrent signals into the deep learning network. The average statistical error of accuracy of LSTM, Bi-LSTM, GRU, and 1DCNN is 0.9622%, 0.6339%, 0.9157%, and 0.5449% respectively. The results indicate that under the same conditions, the features extracted by wavelet scattering transformation were more recognizable and more capable of distinguishing cracked eggs from intact eggs.
The wavelet scattering network finally constructed in this paper has two cascaded filter banks. The first filter bank has eight wavelets per octave, and the second has one wavelet per octave. As for the selection of filter banks, the experiment proves that the scattering coefficient energy converges rapidly with the deepening of the network, and the energy after the two-layer network structure is about 1% [30], so two cascades of filter banks are constructed in this paper. For the number of wavelets per octave in the filter bank, different experiments as shown in Figure 9b have been made, proving that the combination of (8, 1) has the best result.

3.3.3. More Results on Imbalanced and Duck Egg Datasets

It is worth noting that the data in a real industrial scenario are unpredictable. To verify the performance and versatility of the proposed method, the class-imbalanced dataset of eggs collected in this experiment and the duck egg dataset experiment were set up. The distribution of cracks in the duck egg dataset is shown in Figure 10. The experimental results for the class-imbalanced and duck egg datasets are shown in Table 5. The class-imbalanced dataset removed some collected data to simulate an imbalanced state. The dataset has 200 entries, including 169 intact and 31 cracked egg signal data. The MCC (98.0788%) was obtained under the condition of fewer cracked eggs, which is slightly lower than the previous experiments. It is still in the high-accuracy range, fully demonstrating its stability under data imbalance. A total of 267 fresh duck eggs were purchased from the advanced breeding duck incubation base. Signal data of 130 intact and 137 cracked eggs were obtained in this experiment, and an accuracy of 99.6169% was finally obtained. This experiment shows that the method proposed in this paper has good universality and extensibility.

3.4. Discussion

This paper used the micro-current high-voltage discharge method to detect microcracks in eggs, but there is a small amount of literature and patents that investigate this technique. The most studied application for this technique is the case of plastic container leaks. Regarding the range of voltages, some studies [12] suggest that the voltage applied is typically 3000 V∼5000 V DC, but no relevant theoretical description is given. The electrode may cause certain damage to the detected object when it is in direct contact with the detected object. In the previous experiment, 1500 V was used, which may cause damage to eggs that are being incubated. The voltage in this study was set to 1000 V. The results obtained from the above four experiments proved the effectiveness of the proposed method.Especially for the detection of eggs to be hatched, the lower the voltage used, the safer the eggs will be, and the less they will be damaged. In this study, twenty eggs (ten intact and ten microcracked) were selected to conduct classification experiments on the signals extracted from poultry eggs with different voltages. The extracted signals were tested by the existing method [14] and the method proposed in this paper. The results are shown in Figure 11 and Figure 12.
The selected eggs were tested using 250 V, 500 V, 750 V, 1000 V, 1200 V, 1400 V, 1500 V, and 1800 V. From Figure 11 and Figure 12, it can be concluded that the existing method and the method based on the wavelet scattering convolutional network proposed in this paper can be used to distinguish the microcurrent signals obtained from cracked eggs and intact eggs in the voltage between 1000 V and 1500 V. Both methods have detection errors when the voltage is higher than 1500 V. This is because when the voltage is increased, the current signal generated by the system fluctuates strongly, resulting in the voltage breakdown of the intact egg, which will reflect on the current and lead to false detection. The effect of the existing method on the classification of current signals below 1000 V is not obvious because of the weakening of the current response at the crack for voltages below 1000 V. The method proposed in this paper has the characteristics of translation invariance and elastic deformation stability and still maintains a good effect on the classification of current signals between 500 V and 1000 V. When the voltage is less than 500 V, the system cannot generate enough feedback signals, so it is difficult to detect extremely small cracks. The egg crack detection method based on electrical characteristics may cause damage to incubating eggs under high-voltage conditions, while the wavelet scattering convolutional network method proposed in this paper can adapt the sensing voltage from 1500 V to 500 V and can obtain higher detection accuracy on the data with a low signal-to-noise ratio, thus greatly reducing the risk of high-voltage damage to incubating eggs.

4. Conclusions

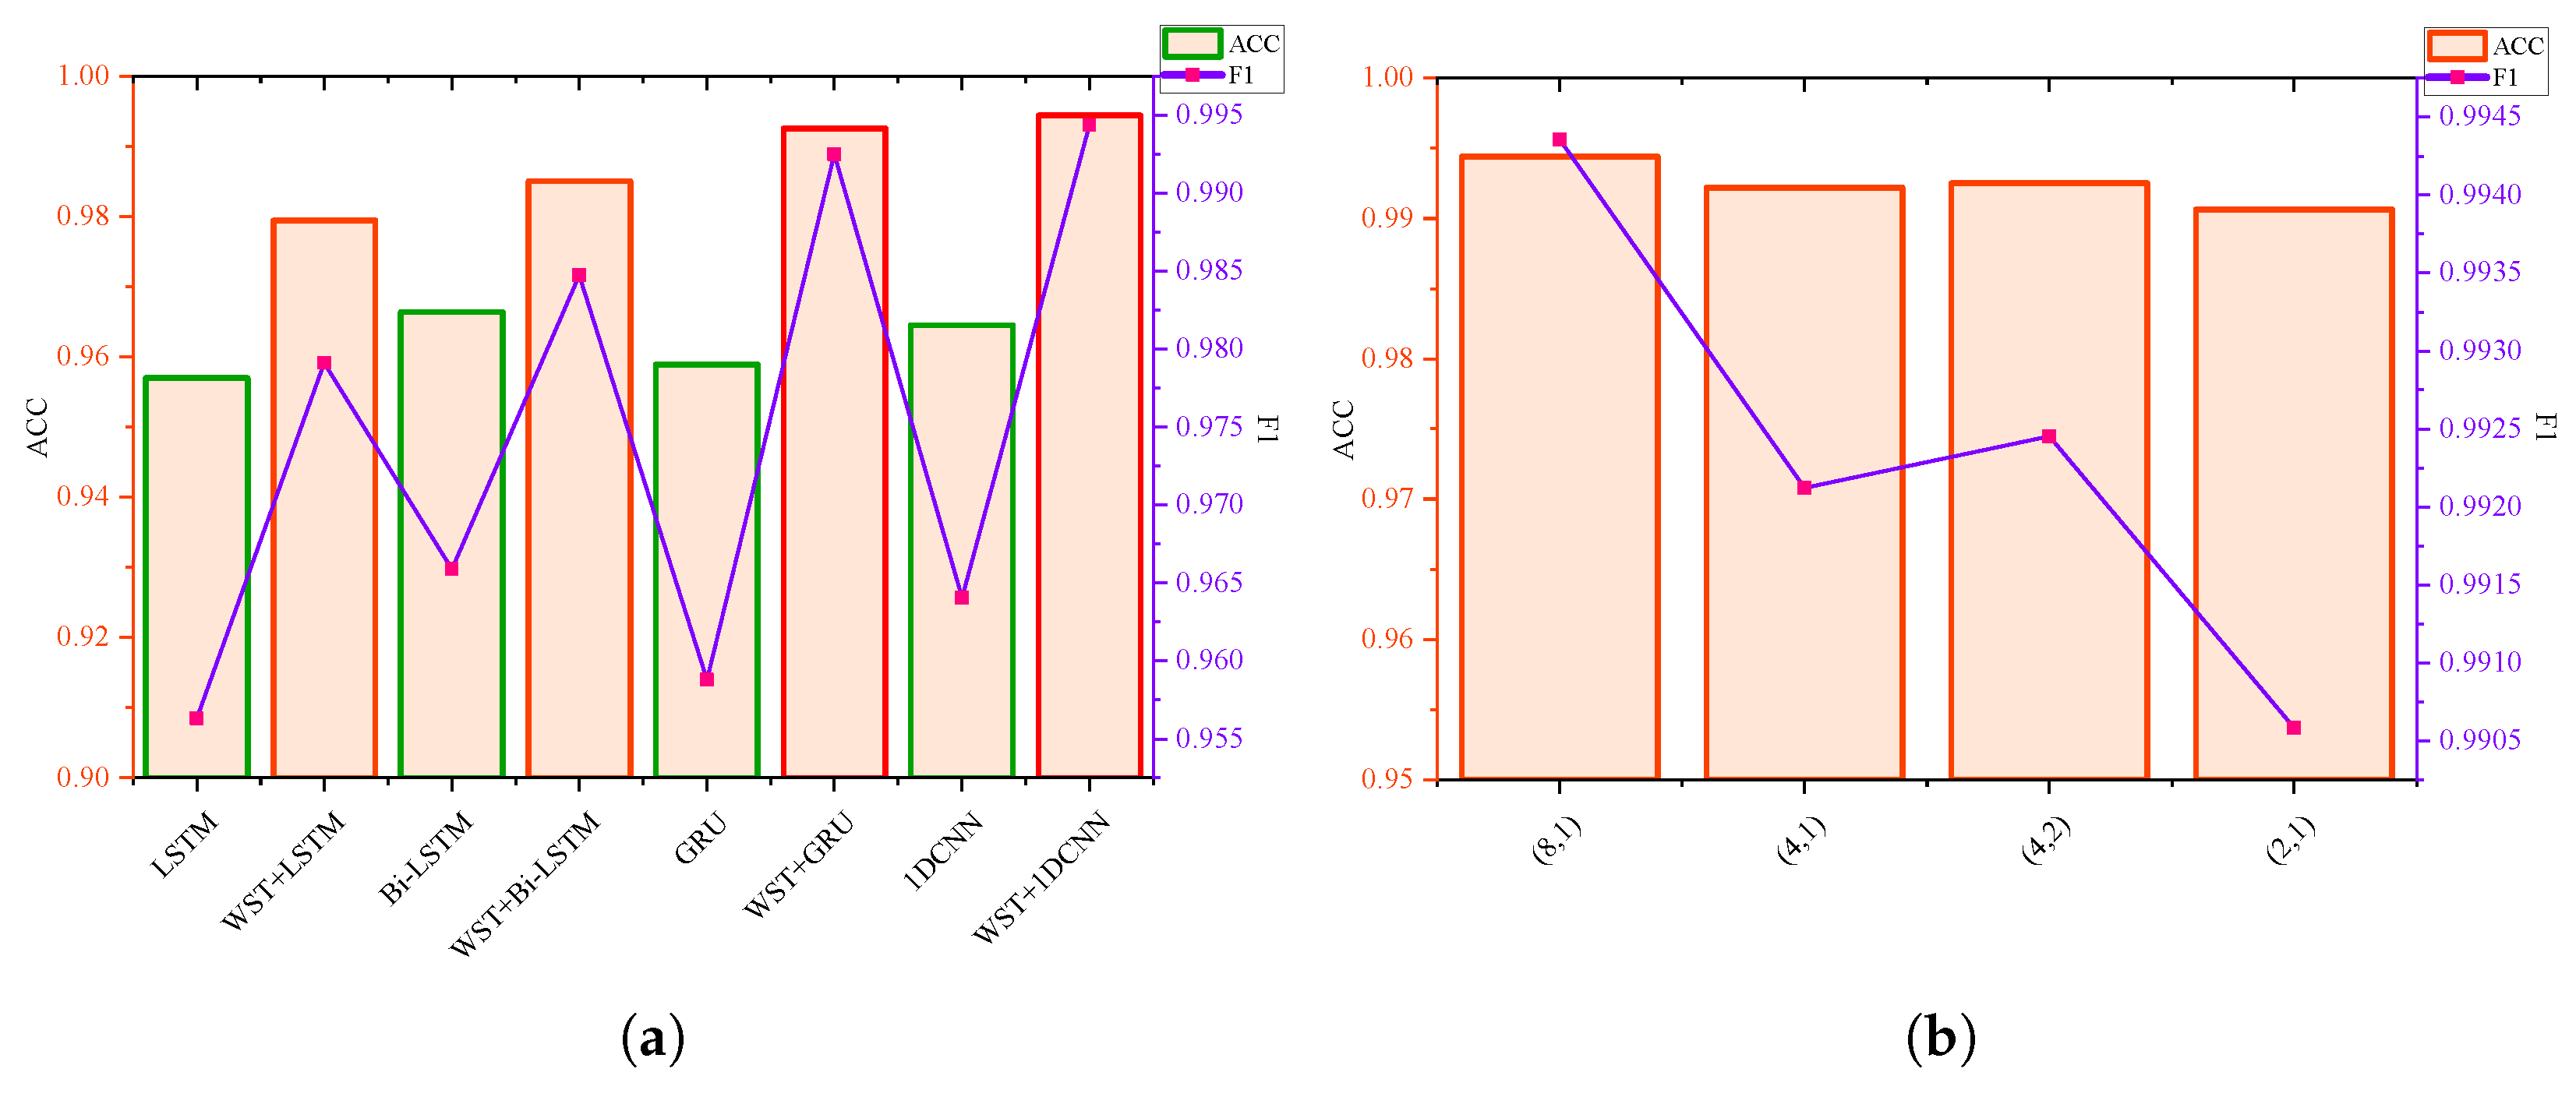
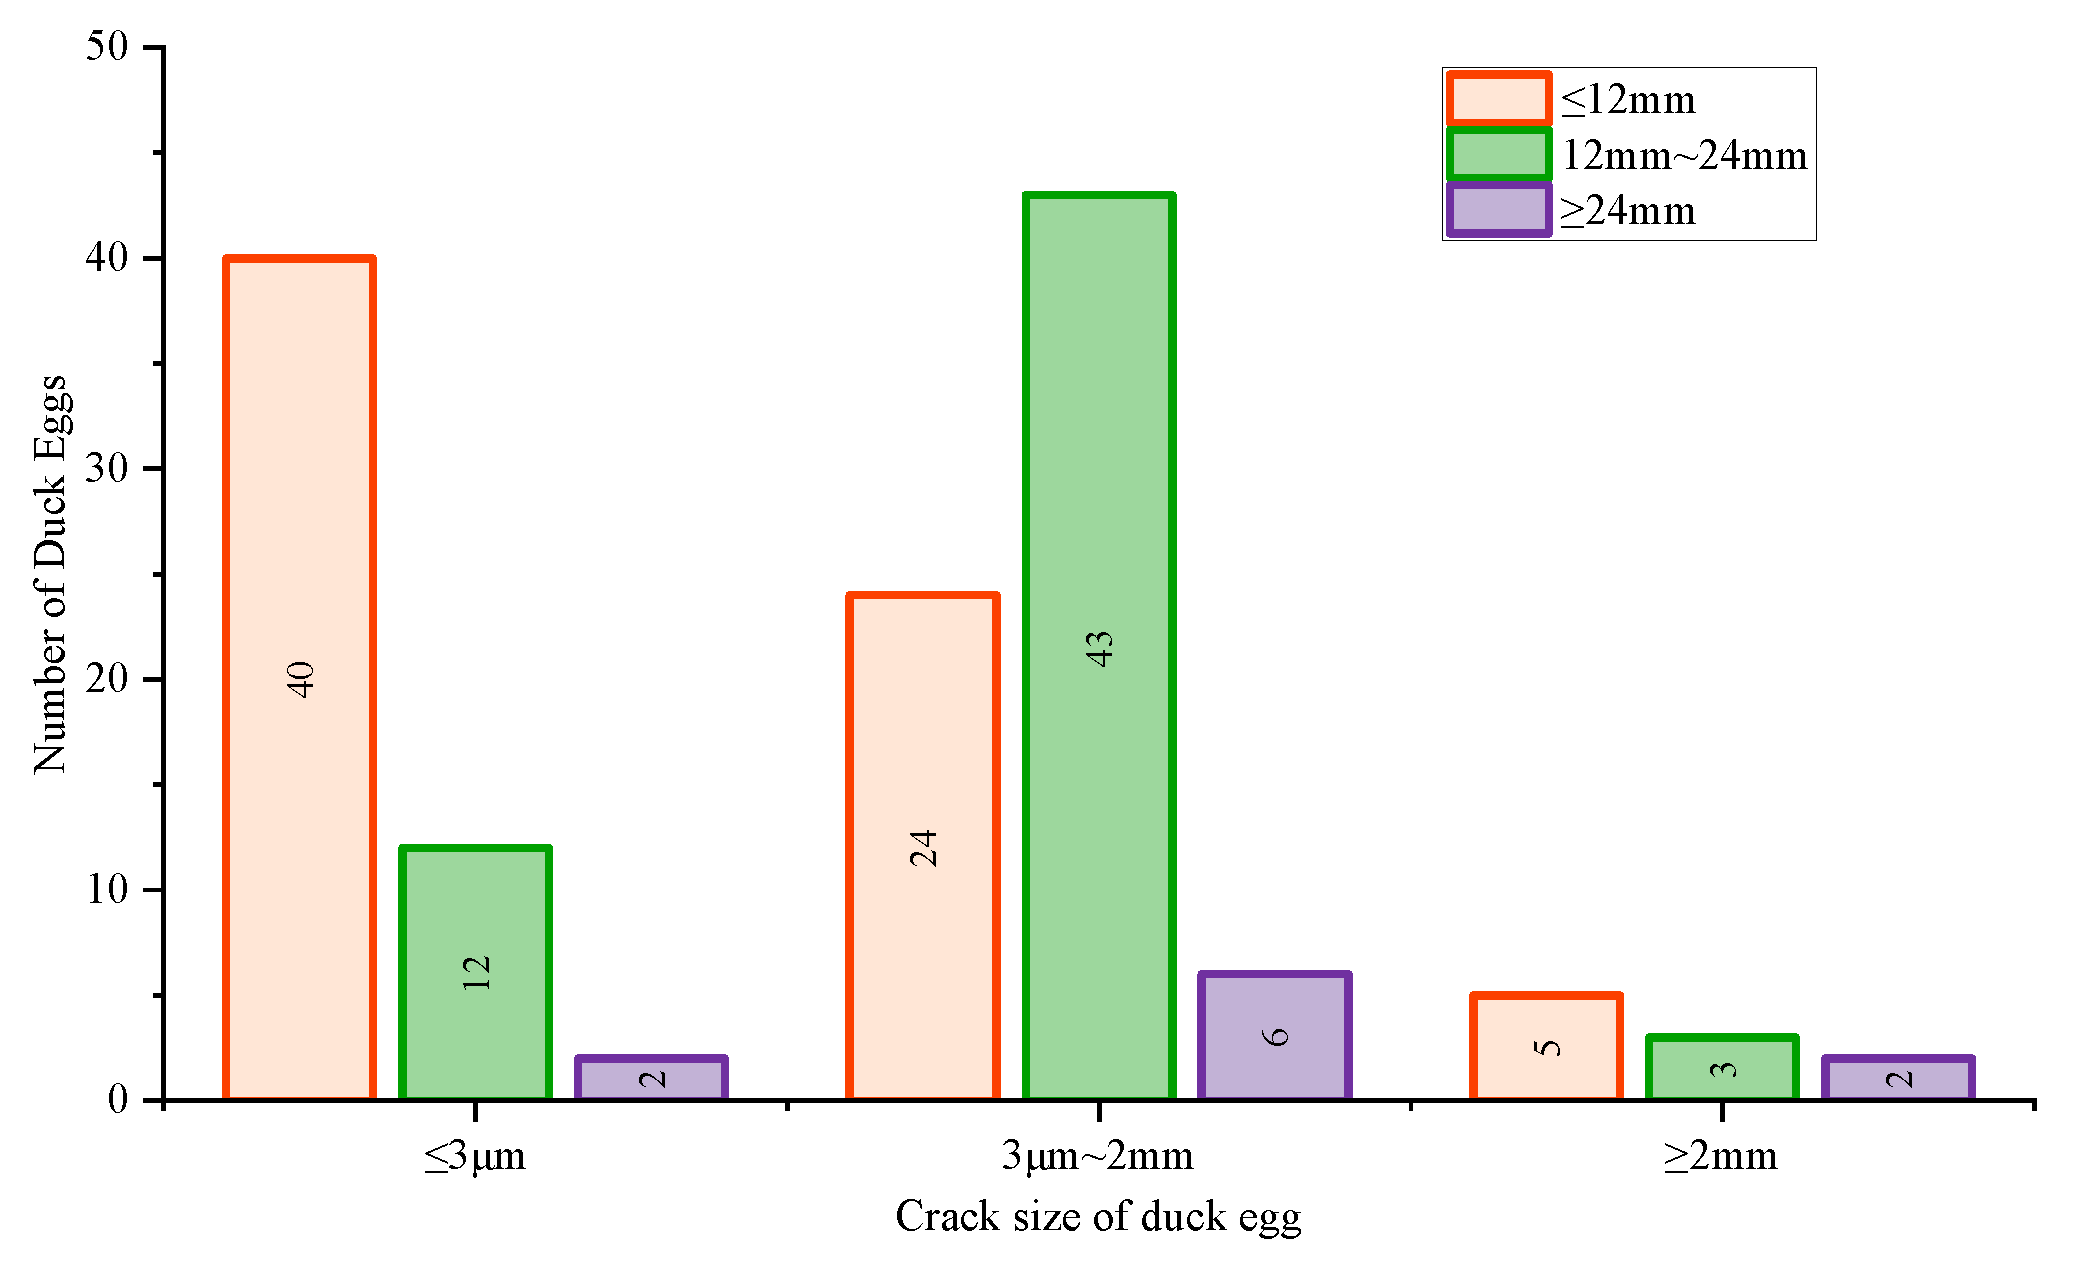
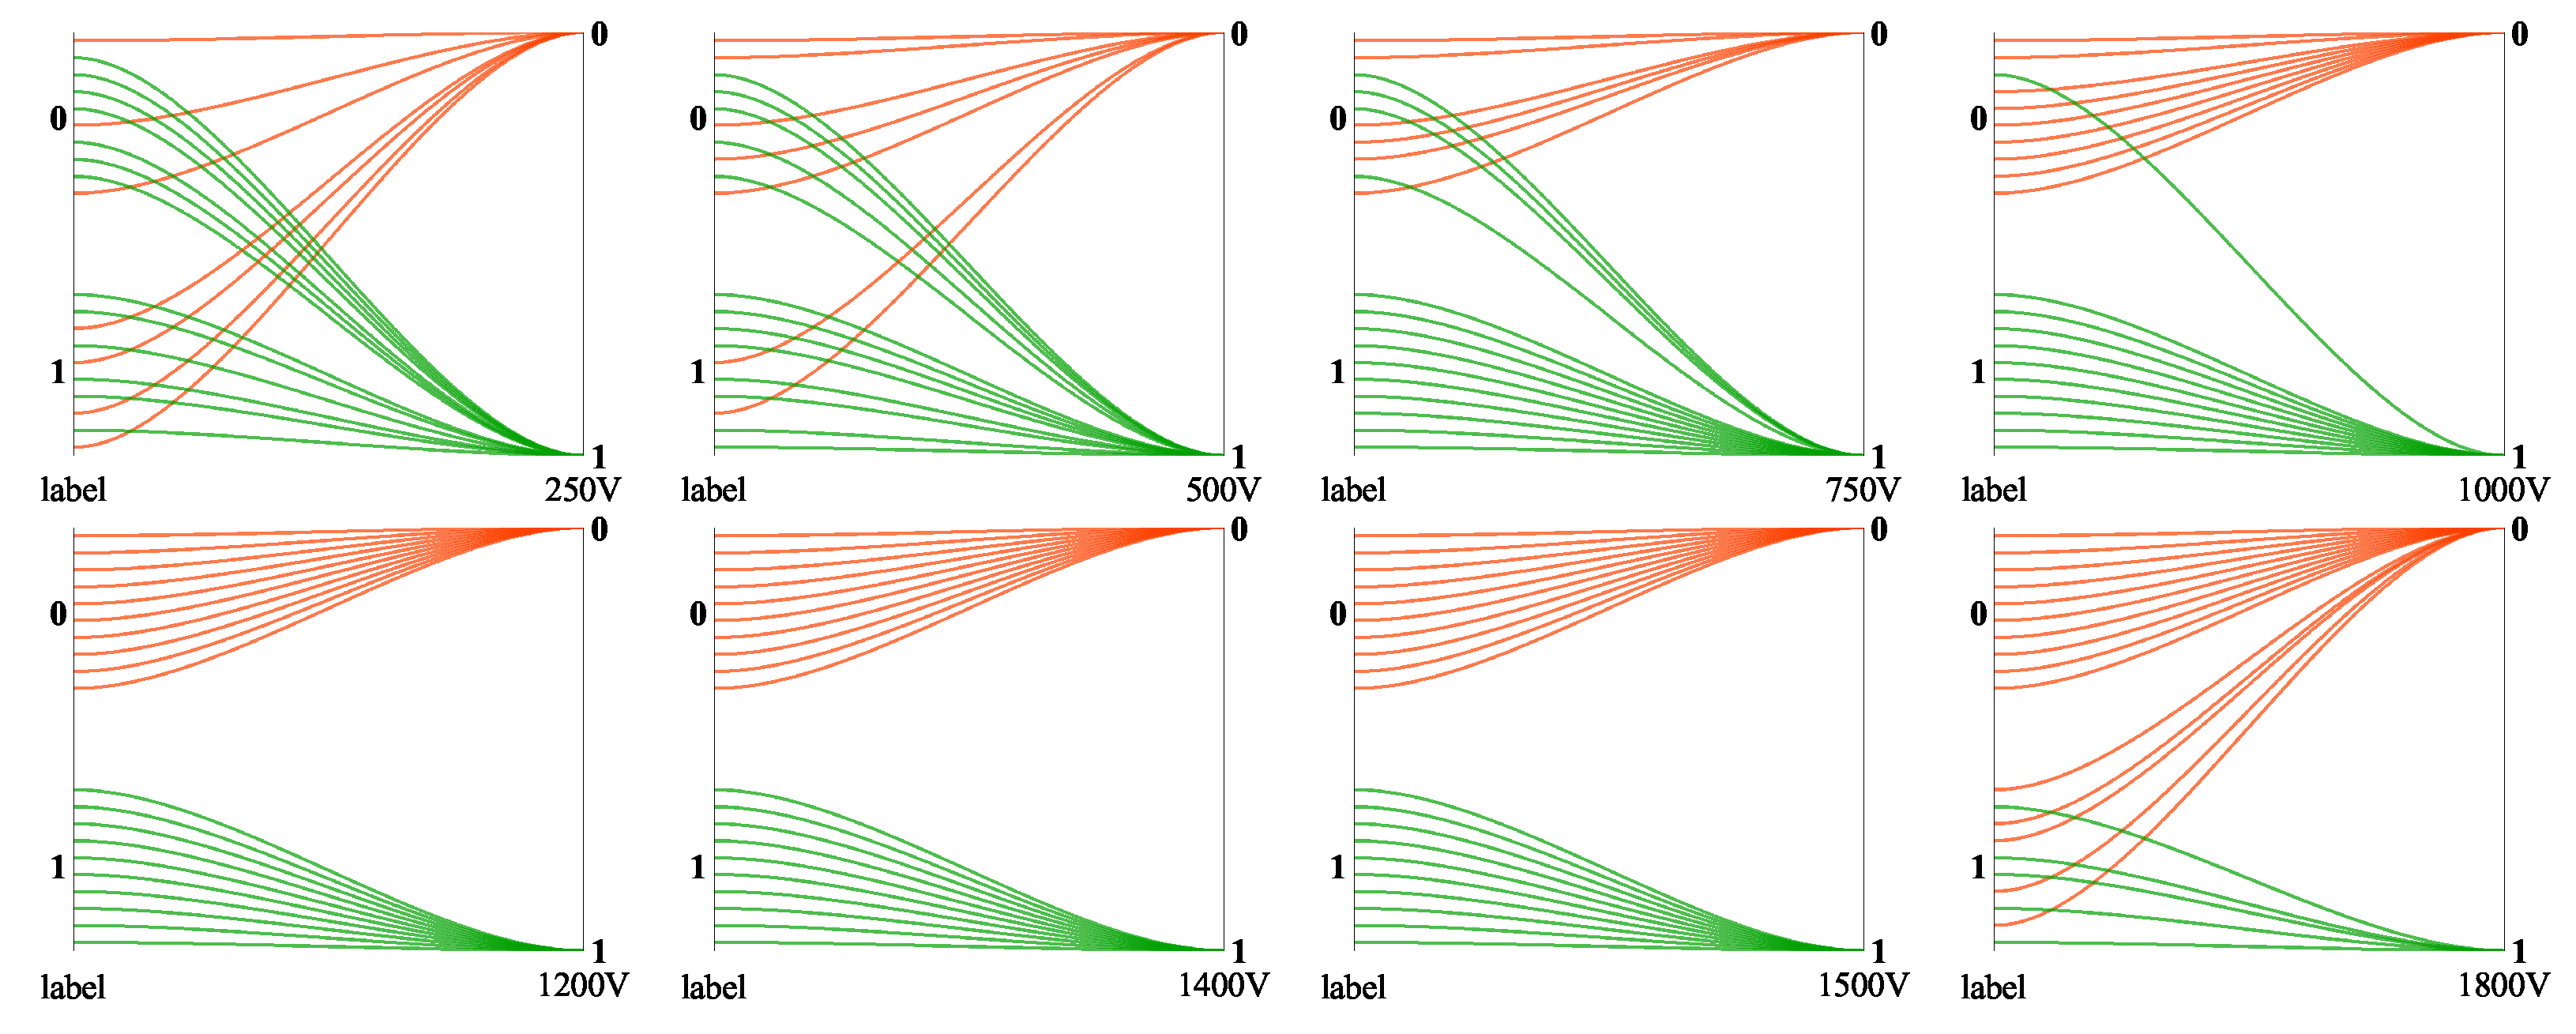
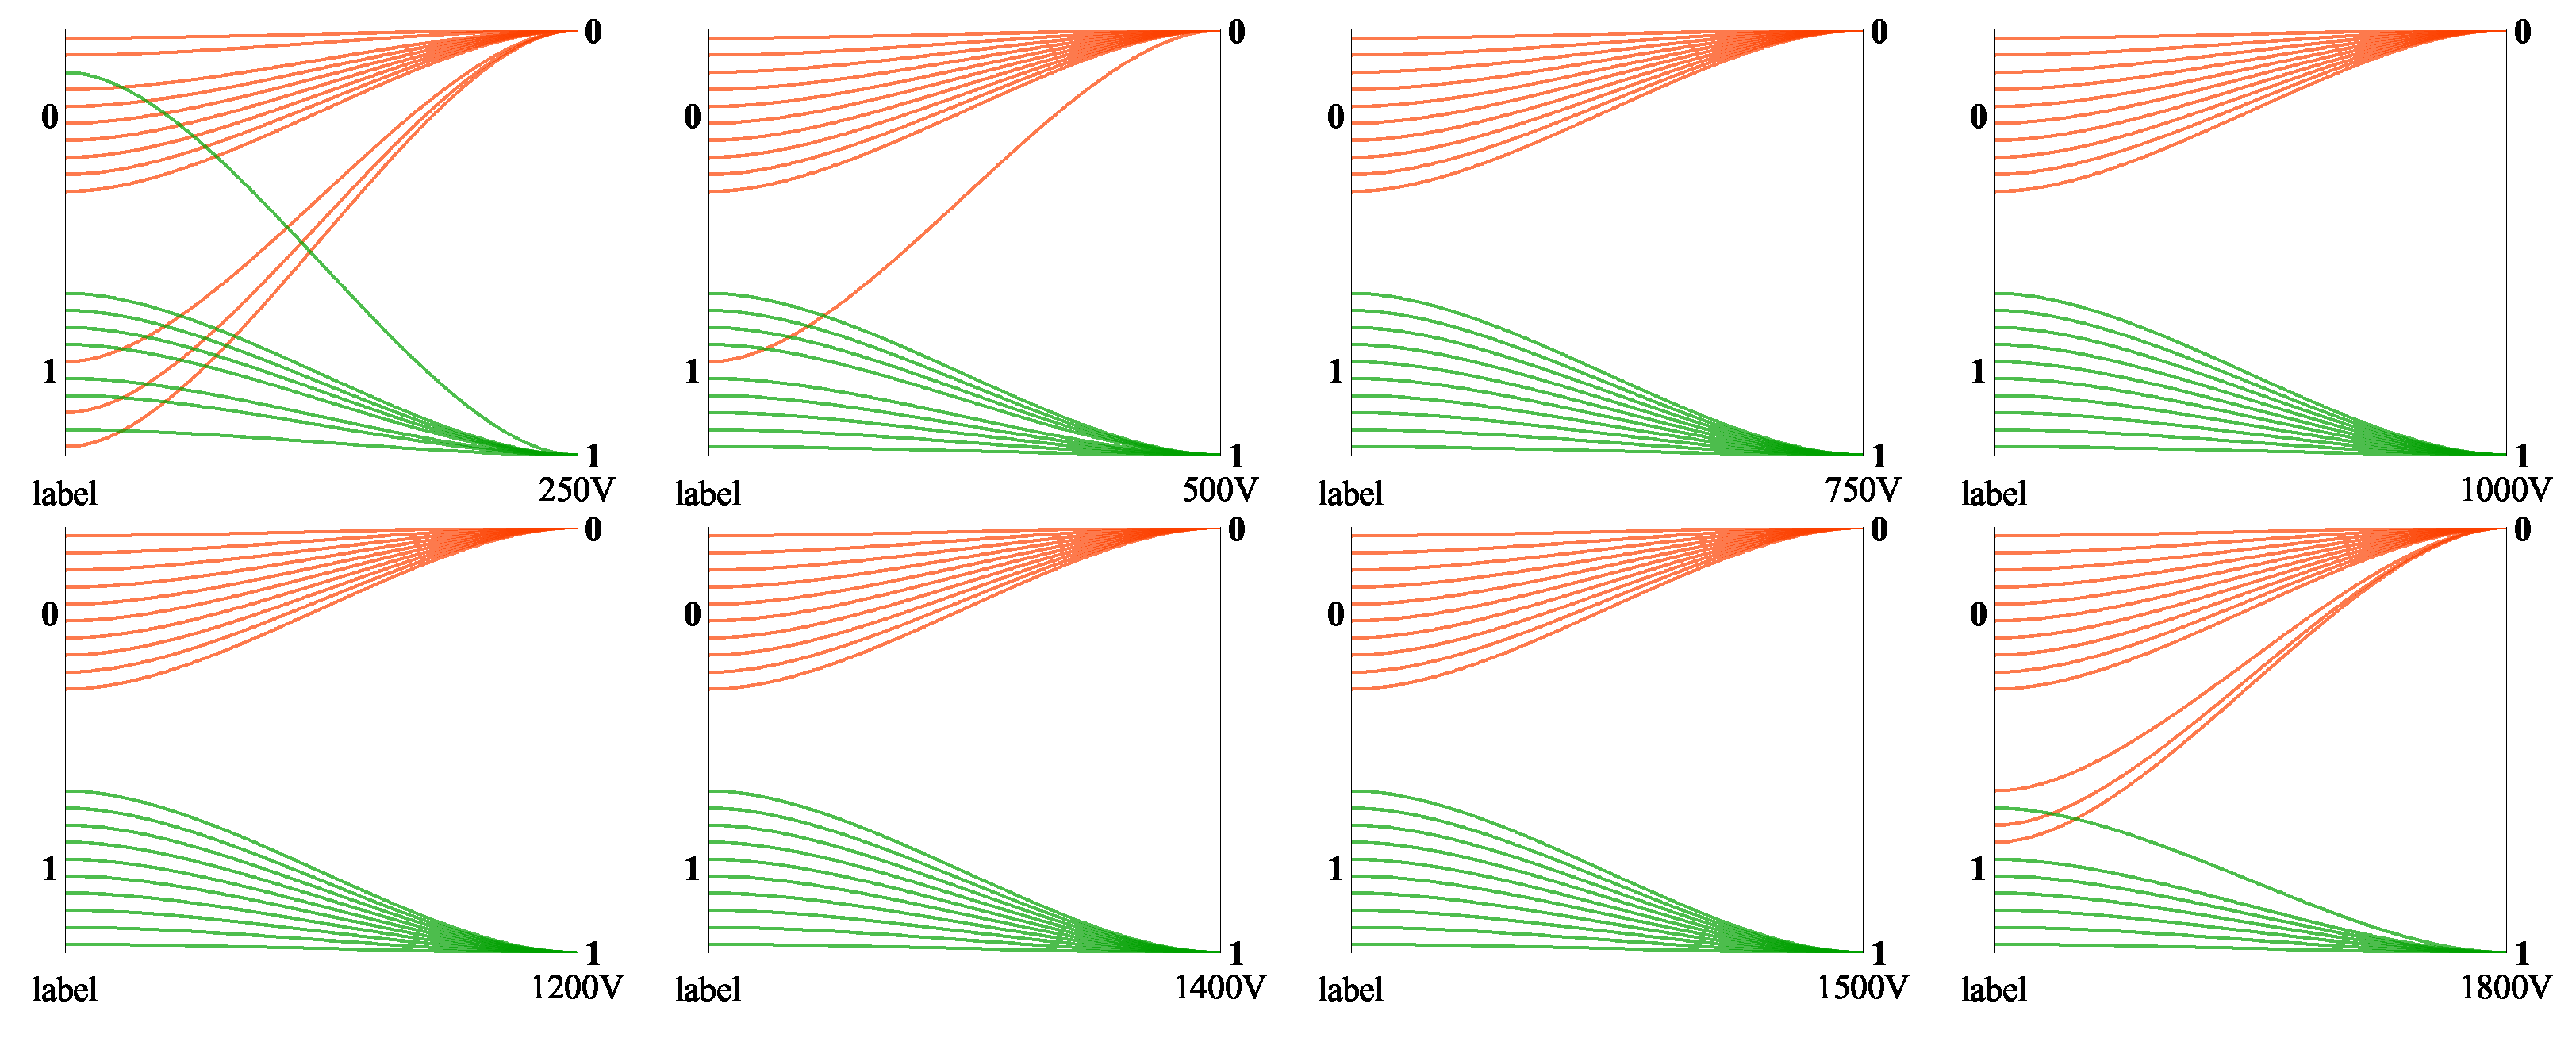
This paper constructs a crack detection system for the electrical characteristics of eggs. With the help of a size recognition device, which automatically adapts the upper electrode position to the size of the egg, the system gives a more detailed and consistent view of the egg’s surface, resulting in a more representative collected signal. Given the limitations of disorder, mutation, nonlinearity, and time discontinuity of microcurrent signals, the reliability of signal features dominates the performance of the ultimate classification model. This paper suggests an electrical-based nondestructive detection model for microcracks in poultry eggs, which employs wavelet scattering transform to extract features. Wavelet scattering transform can effectively avoid the loss of valid information and produce a signal representation insensitive to small changes in the input signal. This paper discusses the feature extraction mechanism of wavelet scattering by visualizing the output results of the scattering feature process. Finally, the study feeds the acquired feature vector into the deep learning network for classification. The following are the conclusions that can be drawn from our experiments. The microcurrent signal has unpredictable and sudden transient characteristics. The wavelet scattering transform utilized to extract signal features and develop the corresponding matrix shows a distinguished capacity to collect signals with apparent differentiation and ensure satisfactory results. In this paper, we implement this feature extraction approach combined with appropriate classifiers to discuss the classification of egg microcurrent signals. The results show that WST+1DCNN has the best performance, and the average ACC, P, R, F1, and MCC obtained are 99.4393%, 99.2523%, 99.6226%, 99.4357%, and 98.8819%, respectively. In addition, we set the eggs’ class-imbalanced dataset and the duck egg dataset to verify the performance and universality. Finally, we conduct experiments on egg detection at different voltages. The novel feature extraction and detection method proposed in this paper can reduce the sensing voltage from 1500 V to 500 V and obtain higher detection accuracy on lower signal-to-noise data, dramatically reducing the risk of damage to hatching eggs from high-voltage electricity. In the future, the main direction of our research is how to achieve higher precision in egg crack detection under lower-voltage conditions, which specifically includes the following several aspects. The first is how to improve the shape of the brush so that it can cover a larger area of the eggshell during rotation and reduce the amount of missed area. An increase in the contact region means that we can realize the distinction at lower voltage, as it can also obtain enough current accumulation values in the crack regions. Secondly, at the algorithm level, we hope to extract more abundant and high-dimensional current features in the crack region and improve the existing algorithm to make it more representative. Finally, multi-sensor fusion is also one of our directions. We speculate that an algorithm based on current features combined with image features or acoustic features can have higher accuracy than an algorithm based on single-current features.

Author Contributions

Conceptualization, C.S. and C.Z. (Changsheng Zhu); methodology, C.S., C.Z. (Changsheng Zhu) and Y.C.; software, Y.C., Y.W. and C.Z. (Changsheng Zhu); validation, C.S., C.Z. (Changsheng Zhu), C.Z. (Chun Zhang), J.Y. and Y.C.; formal analysis, C.S., C.Z. (Chun Zhang), J.Y., Y.C., Y.W. and X.J.; investigation, C.S., Y.C., X.J. and Y.W.; resources, C.S. and J.Y.; data curation, Y.C., Y.W. and X.J.; writing—original draft preparation, C.S., C.Z. (Changsheng Zhu), Y.C. and Y.W.; writing—review and editing, C.S., C.Z. (Chun Zhang), C.Z. (Changsheng Zhu), Y.C., Y.W., X.J. and J.Y.; visualization, Y.C., Y.W. and X.J.; supervision, C.S., C.Z. (Chun Zhang), C.Z. (Changsheng Zhu) and J.Y. All authors have read and agreed to the published version of the manuscript.

Funding

This research was funded by the Tai’an Science and Technology Innovation Development Plan (No. 2021GX050 and No. 2020GX055), by the National Natural Science Foundation of China (52275262).

Institutional Review Board Statement

Not applicable.

Data Availability Statement

The data presented in this study are available on demand from the corresponding author at (cs.zhu@sdust.edu.cn).

Conflicts of Interest

The authors declare no conflict of interest.

References

  1. Reu, K.D.; Grijspeerdt, K.; Messens, W.; Heyndrickx, M.; Uyttendaele, M.; Debevere, J.; Herman, L. Eggshell factors influencing eggshell penetration and whole egg contamination by different bacteria, including Salmonella enteritidis. Int. J. Food Microbiol. 2006, 112, 253–260. [Google Scholar] [CrossRef] [PubMed]
  2. Munoz, A.; Dominguez-Gasca, N.; Jimenez-Lopez, C.; Rodriguez-Navarro, A.B. Importance of eggshell cuticle composition and maturity for avoiding trans-shell Salmonella contamination in chicken eggs. Food Control 2015, 55, 31–38. [Google Scholar] [CrossRef]
  3. Mansoory, M.S.; Ashtiyani, M.; Sarabadani, H. Automatic Crack Detection in Eggshell Based on SUSAN Edge Detector Using Fuzzy Thresholding. Mod. Appl. Sci. 2011, 5, 117. [Google Scholar] [CrossRef] [Green Version]
  4. Wang, S.C.; Ren, Y.L.; Chen, H.; Xiong, L.R.; Wen, Y.X. Detection of cracked-shell eggs using acoustic signal and fuzzy recognition 2004. Trans. CSAE 2004, 20, 130–133. [Google Scholar]
  5. Lin, H.; wen Zhao, J.; sheng Chen, Q.; rong Cai, J.; Zhou, P. Eggshell crack detection based on acoustic response and support vector data description algorithm. Eur. Food Res. Technol. 2009, 230, 95–100. [Google Scholar] [CrossRef]
  6. Chen, C.; Qiang, M.; Cai, J.; Zhang, S.; Sun, L. Design of On-line Detection System for Poultry Eggshell Crack. Agric. Eng. 2020, 10, 22–27. [Google Scholar]
  7. Kertész, I.; Zsom-Muha, V.; András, R.; Horváth, F.; Németh, C.; Felföldi, J. Development Of A Novel Acoustic Spectroscopy Method For Detection Of Eggshell Cracks. Molecules 2021, 26, 4693. [Google Scholar] [CrossRef]
  8. Deng, X.; Wang, Q.; Chen, H.; Xie, H. Eggshell crack detection using a wavelet-based support vector machine. Comput. Electron. Agric. 2010, 70, 135–143. [Google Scholar] [CrossRef]
  9. Bao, G.; Jia, M.; Xun, Y.; Cai, S.; Yang, Q. Cracked egg recognition based on machine vision. Comput. Electron. Agric. 2019, 158, 159–166. [Google Scholar]
  10. Turkoglu, M. Defective Egg Detection Based On Deep Features And Bidirectional Long-Short-Term-Memory. Comput. Electron. Agric. 2021, 185, 106152. [Google Scholar] [CrossRef]
  11. Zhao, Z.X.; Luo, Y.F.; Huang, X.B.; Yuan, K.; Huang, Y.; Cao, Y.Y. Research on Online Detection of Broken Eggs Based on Machine Vision and YOLOv4. Mod. Agric. Equip. 2022, 43, 8–16. [Google Scholar]
  12. Hu, X. An Antomatically-Inspecting Method for Ampoule Sealing Quality. J. Zhuzhou Inst. Technol. 1997, 11. Available online: https://www.cnki.com.cn/Article/CJFDTotal-ZZGX199704001.htm (accessed on 19 March 2023).
  13. Yan, Z.; Ren, D.; Chen, R.; Gao, Y.; Fu, X. Research on Large Infusion Plastic Bottle Leakage Detection Technology Based on High Voltage Discharge. Machinery 2018, 45, 19–21,72. [Google Scholar]
  14. Shi, C.; Wang, Y.; Zhang, C.; Yuan, J.; Cheng, Y.; Jia, B.; Zhu, C. Nondestructive Detection of Microcracks in Poultry Eggs Based on the Electrical Characteristics Model. Agriculture 2022, 12, 1137. [Google Scholar] [CrossRef]
  15. Li, J.; Ke, L.; Du, Q.; Ding, X.; Chen, X.; Wang, D. Heart Sound Signal Classification Algorithm: A Combination Of Wavelet Scattering Transform And Twin Support Vector Machine. IEEE Access 2019, 7, 179339–179348. [Google Scholar] [CrossRef]
  16. Al-Taee, A.A.; Khushaba, R.N.; Zia, T.; Al-Jumaily, A. Feature Extraction Using Wavelet Scattering Transform Coefficients for EMG Pattern Classification. In Lecture Notes in Computer Science, Proceedings of the 34th Australasian Joint Conference on Artificial Intelligence, Sydney, NSW, Australia, 2–4 February 2022; Springer: Cham, Switzerland, 2022; Volume 13151, pp. 181–189. [Google Scholar]
  17. Hui, L.; Yongkang, L.; Fang, G.; Wenyang, M.; Wenhao, C. Transmission line fault diagnosis based on wavelet scattering with BiLSTM. Foreign Electron. Meas. Technol. 2021, 40, 165–172. [Google Scholar]
  18. Wen, J.-H.; Tan, L.-H. Image Retrieval Based on Wavelet Scattering Network. J. Guangdong Univ. Technol. 2019, 36, 63–67,80. [Google Scholar]
  19. Fan, X.; Cheng, J.; Wang, Y.; Li, S.; Yan, B.; Zhang, Q. Automatic Events Recognition in Low SNR Microseismic Signals of Coal Mine Based on Wavelet Scattering Transform and SVM. Energies 2022, 15, 2326. [Google Scholar] [CrossRef]
  20. Buriro, A.B.; Ahmed, B.; Baloch, G.; Ahmed, J.; Shoorangiz, R.; Weddell, S.J.; Jones, R.D. Classification of alcoholic EEG signals using wavelet scattering transform-based features. Comput. Biol. Med. 2021, 139, 104969. [Google Scholar] [CrossRef]
  21. Liu, Z.; Yao, G.; Zhang, Q.; Zhang, J.; Zeng, X. Wavelet Scattering Transform For Ecg Beat Classification. Comput. Math. Methods Med. 2020, 2020, 3215681. [Google Scholar] [CrossRef]
  22. Yu, Y.; Samali, B.; Rashidi, M.; Mohammadi, M.; Nguyen, T.N.; Zhang, G. Vision-based concrete crack detection using a hybrid framework considering noise effect. J. Build. Eng. 2022, 61, 105246. [Google Scholar] [CrossRef]
  23. Yu, Y.; Liang, S.; Samali, B.; Nguyen, T.N.; Zhai, C.; Li, J.; Xie, X. Torsional capacity evaluation of RC beams using an improved bird swarm algorithm optimised 2D convolutional neural network. Eng. Struct. 2022, 273, 115066. [Google Scholar] [CrossRef]
  24. Hu, B.; Liu, J.; Zhao, R.; Xu, Y.; Huo, T. A New Fault Diagnosis Method for Unbalanced Data Based on 1DCNN and L2-SVM. Appl. Sci. 2022, 12, 9880. [Google Scholar] [CrossRef]
  25. Le, B.T.; Le, T.C.; Luu, T.H.T.; Ho, D.D.; Huynh, T.C. Fault Assessment in Piezoelectric-Based Smart Strand Using 1D Convolutional Neural Network. Buildings 2022, 12, 1916. [Google Scholar] [CrossRef]
  26. Ismail Fawaz, H.; Forestier, G.; Weber, J.; Idoumghar, L.; Muller, P.A. Deep Learning for Time Series Classification: A Review. Data Min. Knowl. Discov. 2019, 33, 917–963. [Google Scholar] [CrossRef] [Green Version]
  27. Zhao, B.; Lu, H.; Chen, S.; Liu, J.; Wu, D. Convolutional neural networks for time series classification. J. Syst. Eng. Electron. 2017, 28, 162–169. [Google Scholar] [CrossRef]
  28. Karim, F.; Majumdar, S.; Darabi, H.; Chen, S. LSTM Fully Convolutional Networks for Time Series Classification. IEEE Access 2018, 6, 1662–1669. [Google Scholar] [CrossRef]
  29. Oyallon, E.; Mallat, S.; Sifre, L. Generic Deep Networks with Wavelet Scattering. arXiv 2013, arXiv:1312.5940. [Google Scholar]
  30. Bruna, J.; Mallat, S. Invariant Scattering Convolution Networks. IEEE Trans. Pattern Anal. Mach. Intell. 2013, 35, 1872–1886. [Google Scholar] [CrossRef] [Green Version]
  31. Wiatowski, T.; Bölcskei, H. A Mathematical Theory of Deep Convolutional Neural Networks for Feature Extraction. IEEE Trans. Inf. 2018, 64, 1845–1866. [Google Scholar] [CrossRef] [Green Version]
  32. Hochreiter, S.; Schmidhuber, J. Long Short-Term Memory. Neural Comput. 1997, 9, 1735–1780. [Google Scholar] [CrossRef]
  33. Siami-Namini, S.; Tavakoli, N.; Namin, A.S. The Performance Of Lstm And Bilstm In Forecasting Time Series. In Proceedings of the 2019 IEEE International Conference on Big Data (Big Data), Los Angeles, CA, USA, 9–12 December 2019; pp. 3285–3292. [Google Scholar]
  34. Lv, W.; Lv, Y.; Guo, J.; Ma, J. A Lane-Changing Decision-Making Model of Bus Entering considering Bus Priority Based on GRU Neural Network. Comput. Intell. Neurosci. 2022, 2022, 4558946. [Google Scholar] [CrossRef]
  35. Gu, J.; Wang, Z.; Kuen, J.; Ma, L.; Shahroudy, A.; Shuai, B.; Liu, T.; Wang, X.; Wang, G.; Cai, J.; et al. Recent advances in convolutional neural networks. Pattern Recognit. 2018, 77, 354–377. [Google Scholar] [CrossRef] [Green Version]
  36. Eren, L.; Ince, T.; Kiranyaz, S. A Generic Intelligent Bearing Fault Diagnosis System Using Compact Adaptive 1D CNN Classifier. J. Signal Process. Syst. 2019, 91, 179–189. [Google Scholar] [CrossRef]
  37. Priyadarshini, I.; Cotton, C. A novel LSTM–CNN–grid search-based deep neural network for sentiment analysis. J. Supercomput. 2021, 77, 13911–13932. [Google Scholar] [CrossRef]
  38. Jurman, G.; Riccadonna, S.; Furlanello, C. A Comparison Of Mcc And Cen Error Measures In Multi-Class Prediction. PLoS ONE 2012, 7, e41882. [Google Scholar] [CrossRef] [Green Version]
  39. Sun, K.; Zhang, W.; Pan, L.; Tu, K. Recognition of a Cracked Hen Egg Image Using a Sequenced Wave Signal Extraction and Identification Algorithm. Food Anal. Methods 2018, 11, 1223–1233. [Google Scholar] [CrossRef]
  40. Wang, H.; Mao, J.; Zhang, J.; Jiang, H.; Wang, J. Acoustic feature extraction and optimization of crack detection for eggshell. J. Food Eng. 2016, 171, 240–247. [Google Scholar] [CrossRef]
  41. Purahong, B.; Chaowalittawin, V.; Krungseanmuang, W.; Sathaporn, P.; Anuwongpinit, T.; Lasakul, A. Crack Detection of Eggshell using Image Processing and Computer Vision. J. Phys. Conf. Ser. 2022, 2261, 012021. [Google Scholar] [CrossRef]
  42. Sun, K.; Ma, L.; Pan, L.; Tu, K. Sequenced wave signal extraction and classification algorithm for duck egg crack on-line detection. Comput. Electron. Agric. 2017, 142, 429–439. [Google Scholar] [CrossRef]
  43. Sun, L.; Feng, S.; Chen, C.; Liu, X.; Cai, J. Identification of eggshell crack for hen egg and duck egg using correlation analysis based on acoustic resonance method. J. Food Process Eng. 2020, 43, e13430. [Google Scholar] [CrossRef]
Figure 1. Schematic diagram of capacitor system composed of electrode and egg body in poultry egg crack detection method based on egg electrical characteristic model [14]. d 1 and d 2 represent the thickness of the upper and lower layers of the eggshell; ε l represents the dielectric constant of egg liquid; and ε r represents the relative dielectric constant, which represents the dielectric or polarization physical parameter of the dielectric material.
Agriculture 13 00730 g001
Figure 2. Discharge principle and experimental setup. (a) Schematic diagram of poultry egg crack detection system based on real-time electrical characteristics. (b) The nondestructive detecting device based on electrical characteristics of eggs used in this paper.
Agriculture 13 00730 g002
Figure 3. Comparison of current signal changes between cracked and intact eggs, where the abscissa is the sampling point, and the ordinate is the microcurrent. (a) A cracked egg sample. (b) An indistinguishable cracked egg sample. (c) An intact egg sample. (d) Micro-current signal of sample (a). (e) Micro-current signal of sample (b). (f) Micro-current signal of sample (c).
Agriculture 13 00730 g003
Figure 4. Research ideas for a non-destructive detection algorithm based on electrical characteristics of microcracks.
Agriculture 13 00730 g004
Figure 5. Principle of wavelet scattering transform. (a) Framework of wavelet scattering network. (b) Structure of wavelet scattering transform.
Agriculture 13 00730 g005
Figure 6. The principle of wavelet scattering characteristic parameters used in this paper. (a) The first filter bank with 8 wavelets per octave. (b) The second filter bank with 1 wavelet per octave. (c) The Littlewood-Paley sums of the filter banks. (d) The real and imaginary parts of the coarsest-scale wavelet from the first filter bank.
Agriculture 13 00730 g006
Figure 7. Comparison of wavelet scattering characteristics of cracked eggs and intact eggs. (a) The 0th scattering output of Figure 3e of cracked egg sample. (b) The 0th scattering output of Figure 3f of intact egg sample. (c) Scattering coefficients for 8 time windows of Figure 3e of cracked egg sample. (d) Scattering coefficients for 8 time windows of Figure 3f of intact egg sample.
Agriculture 13 00730 g007
Figure 8. Comparison of sample features extracted using wavelet scattering transform. (a) Variation in detail of hard-to-capture microcrack sample signals. (b) Extraction of 8 time windows of feature information for such cracked eggs using WST, where eight different colors lines in the figure represent the information of the eight time windows. (c) Extraction of 8 time windows of feature information for intact eggs using WST, where eight different colors lines in the figure represent the information of the eight time windows.
Agriculture 13 00730 g008
Figure 9. Comparison of ablation study results. (a) Results comparison using wavelet scattering transform versus without wavelet scattering transform methods. (b) Comparison of the results of the combination of the number of wavelets per octave of the filter bank.
Agriculture 13 00730 g009
Figure 10. Crack size distribution of cracked duck eggs.
Agriculture 13 00730 g010
Figure 11. Crack detection results of eggs with different voltages by existing method [14]. Where, 0 in the figure represents cracked eggs, and 1 in the figure represents intact eggs; The green line indicates that the tested sample is classified as intact eggs, and the orange line indicates that the tested sample is classified as cracked eggs.
Agriculture 13 00730 g011
Figure 12. Crack detection results of eggs with different voltages by the method proposed in this paper. Where, 0 in the figure represents cracked eggs, and 1 in the figure represents intact eggs; The green line indicates that the tested sample is classified as intact eggs, and the orange line indicates that the tested sample is classified as cracked eggs.
Agriculture 13 00730 g012
Table 1. The number of egg samples used by the electrical characteristic crack detection system to obtain a microcurrent signal.
LabelCountPercent
Cracked18752.5281
Intact16947.4719
Table 2. Experimental results of electrical signal classification algorithm based on wavelet scattering transformation feature.
MethodsACCPRF1MCCTraining Time (s)Inference Time (s)
Existing Method [14]97.3832%97.3577%98.0984%97.7210%95.5056%6.79060.0009
WST+LSTM97.9439%98.4761%97.3585%97.9119%95.8971%11.46900.0028
WST+Bi-LSTM98.5047%99.6154%97.3585%98.4725%97.0355%13.38800.0029
WST+GRU99.2523%98.8819%99.6226%99.2488%98.5115%12.05740.0036
WST+1DCNN99.4393%99.2523%99.6226%99.4357%98.8819%13.27140.0033
Table 3. Comparison of inference time between the proposed method and other crack detection techniques.
AuthorDetection ModeInference Time (s)
Sun et al. [39]Vision-based1.65 ± 0.50
Wang et al. [40]Acoustic-based0.2
Purahong et al. [41]Vision-based0.08
Sun et al. [42]Vision-based0.98 ± 0.06
Sun et al. [43]Acoustic-based0.281
Proposed MethodElectrical-based0.0033
Table 4. Comparison of the results of the dataset used in the existing method [14].
Existing Method [14]Proposed Method
ACC99.0435%99.3913%
P99.2331%99.6911%
R99.0769%99.2308%
F199.1529%99.4601%
MCC98.0598%98.7649%
Table 5. Method performance and versatility experiments.
Imbalanced DatasetDuck Egg Dataset
ACC99.4444%99.6169%
P97.9798%99.4949%
R98.8889%99.7416%
F198.3570%99.6139%
MCC98.0788%99.2423%
Disclaimer/Publisher’s Note: The statements, opinions and data contained in all publications are solely those of the individual author(s) and contributor(s) and not of MDPI and/or the editor(s). MDPI and/or the editor(s) disclaim responsibility for any injury to people or property resulting from any ideas, methods, instructions or products referred to in the content.

