Article

A 10-Year Ecological Monitoring of Soils and Triticum aestivum in the Impact Zone of a Power Station

1
Academy of Biology and Biotechnology Behalf D.I. Ivanovskyi, Southern Federal University, 344090 Rostov-on-Don, Russia
2
Agrochemical Center “Rostovsky”, 346735 Rostov-on-Don, Russia
*
Author to whom correspondence should be addressed.
Agriculture 2023, 13(3), 722; https://doi.org/10.3390/agriculture13030722
Submission received: 21 January 2023 / Revised: 16 March 2023 / Accepted: 17 March 2023 / Published: 21 March 2023
(This article belongs to the Special Issue Remediation of Heavy Metals-Contaminated Soils)

Abstract

:
Based on 10 years of environmental monitoring located around the emission zone of an electricity supplier, the main regularities have been studied for the content of heavy metals (HMs), such as Pb, Cd, Zn, Cu, Ni, Mn, and Cr, and 16 priority polycyclic aromatic hydrocarbons (PAHs) in the soils of agricultural landscapes and their accumulation in Triticum aestivum. It has been shown that one of the most significant factors for the pollutants accumulation in soils and plants was the prevailing wind direction on the territory and atmospheric transfer of the dust particles of the enterprise with adsorbed pollutants. As the content of pollutants in the soil increased, their accumulation in Triticum aestivum increased with each season to a level exceeding maximum permissible concentrations (MPC), especially for Pb, Cd, and benzo[a]pyrene (BaP). The unambiguous influx of pollutants from the soil into the roots and further into the aboveground organs of the plant was typical only for Mn, Cr, and BaP, and the accumulation of other studied pollutants can be explained by their foliar influx. It has been established that Triticum aestivum was a more tolerant plant with respect to heavy metals pollution than PAHs.

1. Introduction

The National Security and Development Strategies provide an effective policy framework for environmental protection. The directive includes large-scale environmental surveys on the content and forms of various conventional and emerging pollutants along with the assessment criteria for their comprehensive reconnaissance [1]. Efficient management of natural and anthropogenic system contamination with hazardous pollutants is among the most severe challenges of the 21st century [2,3,4,5,6]. Many inorganic and organic compounds are categorized as environmental pollutants that pose a direct threat to human health and disrupt the functioning and degrade the quality of both ecosystem and its individual components [7]. The most hazardous conventional soil pollutants include PAHs, pesticides, organohalides, polychlorinated dibenzo-n-dioxins, dibenzofurans, polychlorinated biphenyls, radionuclides, HMs, and metalloids [8,9,10].
Largely, the nature of pollution in a particular geographical area is determined by enduring anthropogenic activities. For example, HM input is associated with the extraction of minerals, metallurgical operations, thermal power plants functioning, production of electronic components, textiles, woodworking, and vehicle exhaust emissions [8]. PAH and petroleum compound input into the soil is associated with the extraction, transportation, and processing of fossil fuels, primarily power plants, and the impact of road and rail transport, energy, petrochemistry, and the production of building materials [11,12,13]. At the same time, mainly chrysene, pyrene, and fluoranthene accumulate in the soils of the impact zones of thermal power plants during oil spills and oil products, as well as under the influence of vehicles, and heavier compounds, such as, BaP, benzo[k]fluoranthene, benzo[b] fluoranthene, and dibenzo[a]anthracene [12]. Population growth naturally leads to the intensification of industrial production, which leads both to an increase in the anthropogenic load and to the complex synergistic impact of many pollution sources on landscape components. The result of such complex contamination is the appearance of combined contamination with a mixture of various pollutants.
Current efforts are devoted towards the remediation of combined soil contamination caused by the simultaneous exposure of various HM and PAH compounds for several reasons [14,15,16,17,18,19,20,21]. Firstly, the most significant sources of pollutants, such as transport, fuel and energy companies, are widespread. Secondly, the pollution can be traced in the soils of any landscape, even in the remotest regions of the world [22]. Thirdly, the resistance of these substances to degradation in soils makes it possible to assess the duration and intensity of anthropogenic impact. Lastly, HMs and PAHs are characterized not only by toxic effects on living organisms, but also by their serious mutagenic, teratogenic, and carcinogenic effects [23]. One of the most dangerous pollutants is BaP, a carcinogen and mutagen of the first hazard class of compounds [24,25].
Contaminated soils can directly or indirectly pose a threat to living organisms: directly through the negative impact of pollutants on the crops yield and quality and indirectly by accumulating in the human body through the food chain, thereby leading to hazardous health issues. Even a few percent reduction in crop yield due to pollutant exposure can lead to significant long-term losses in crop production and farmer income.
The process of coal burning at thermal power plants results in solid and gaseous products containing various PAH and HM compounds that are released into the atmosphere. The location of agricultural lands near enterprises of the fuel and energy complex leads to progressive processes of technogenic soil pollution, as well as to impacts on the elemental composition of plants as a result of the root and foliar pathways of pollutants. The decrease in the quality and yield of agricultural crops due to the impact of PAHs and HMs is economically unprofitable, and most importantly, environmentally unsafe due to the direct entry of pollutants into the human body through the food chain. Food importers are currently developing standards for the permissible limits of HMs and PAHs in various food products and restricting the import of produce contaminated with these pollutants. Hence, it is vitally important to regularly monitor the soils and plants of agricultural fields subjected to combined contamination with HMs and PAHs. In this study, the long-term monitoring of various pollutants, including HMs and PAHs, in agricultural lands located within the impact zone of the thermal power plant Novocherkassk Power Station (NPS) was carried out. The content of HMs and PAHs in the soils of agricultural landscapes and Triticum aestivum plants was studied over a 10-year research period.

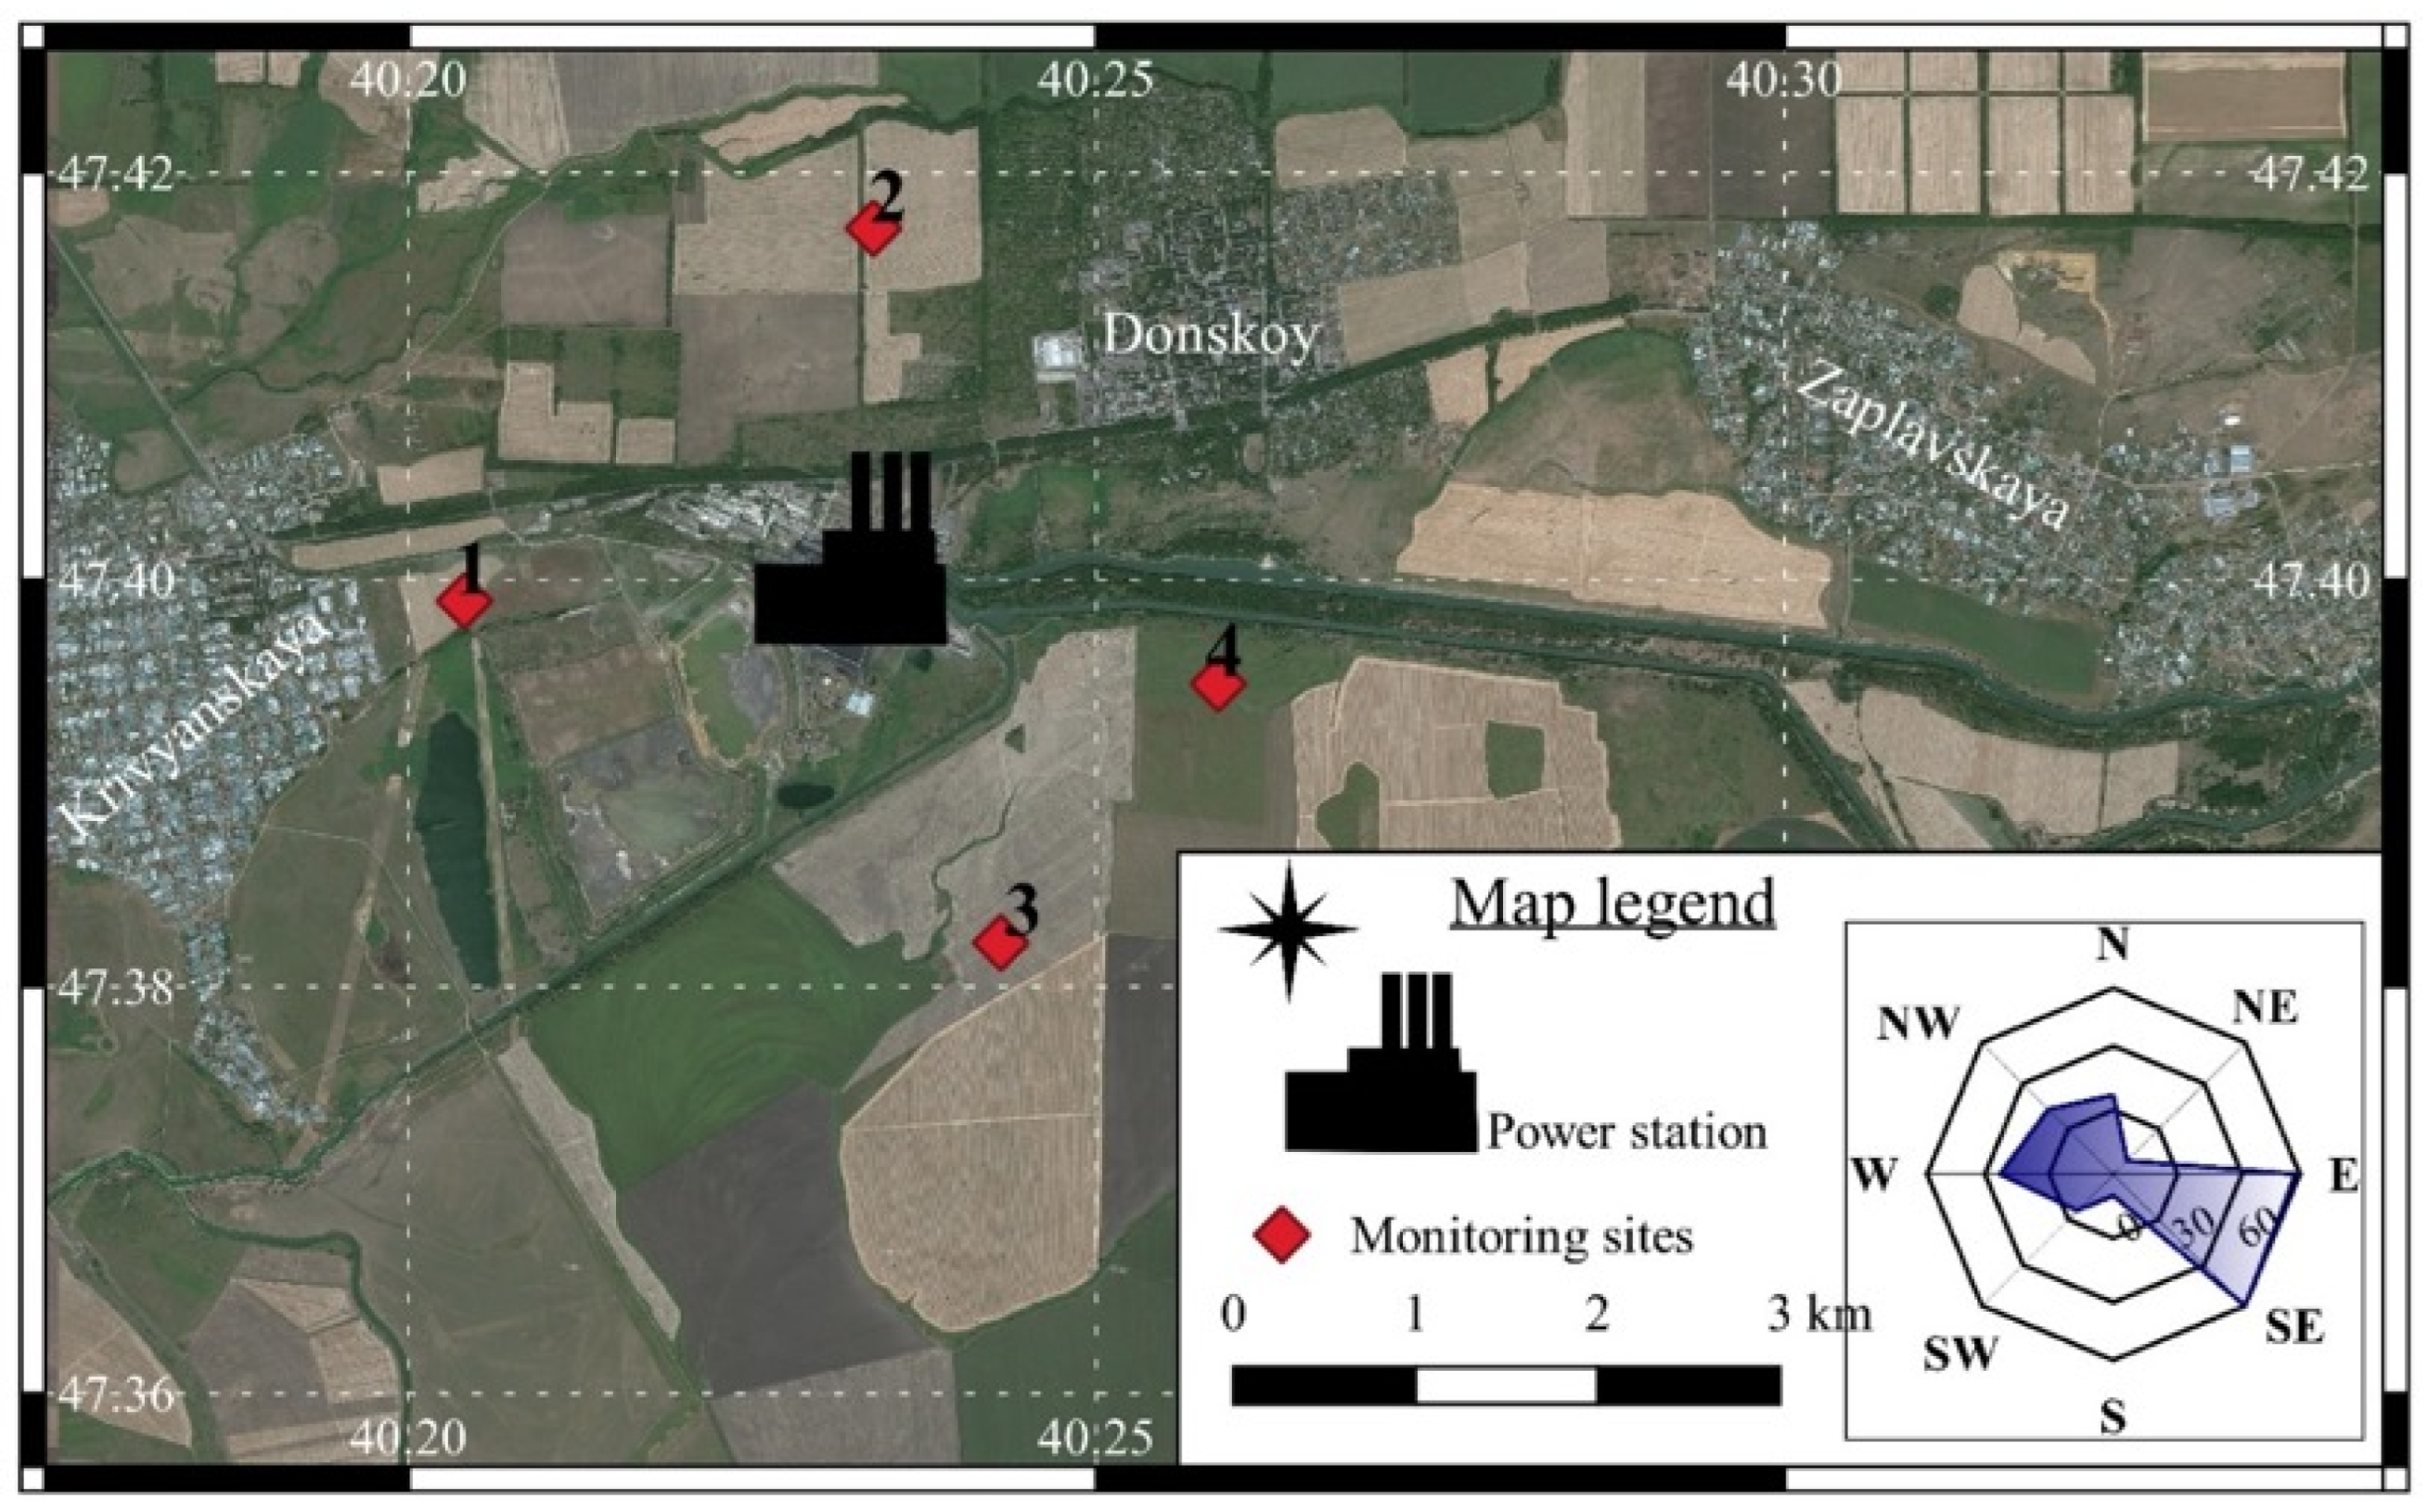
2. Materials and Methods
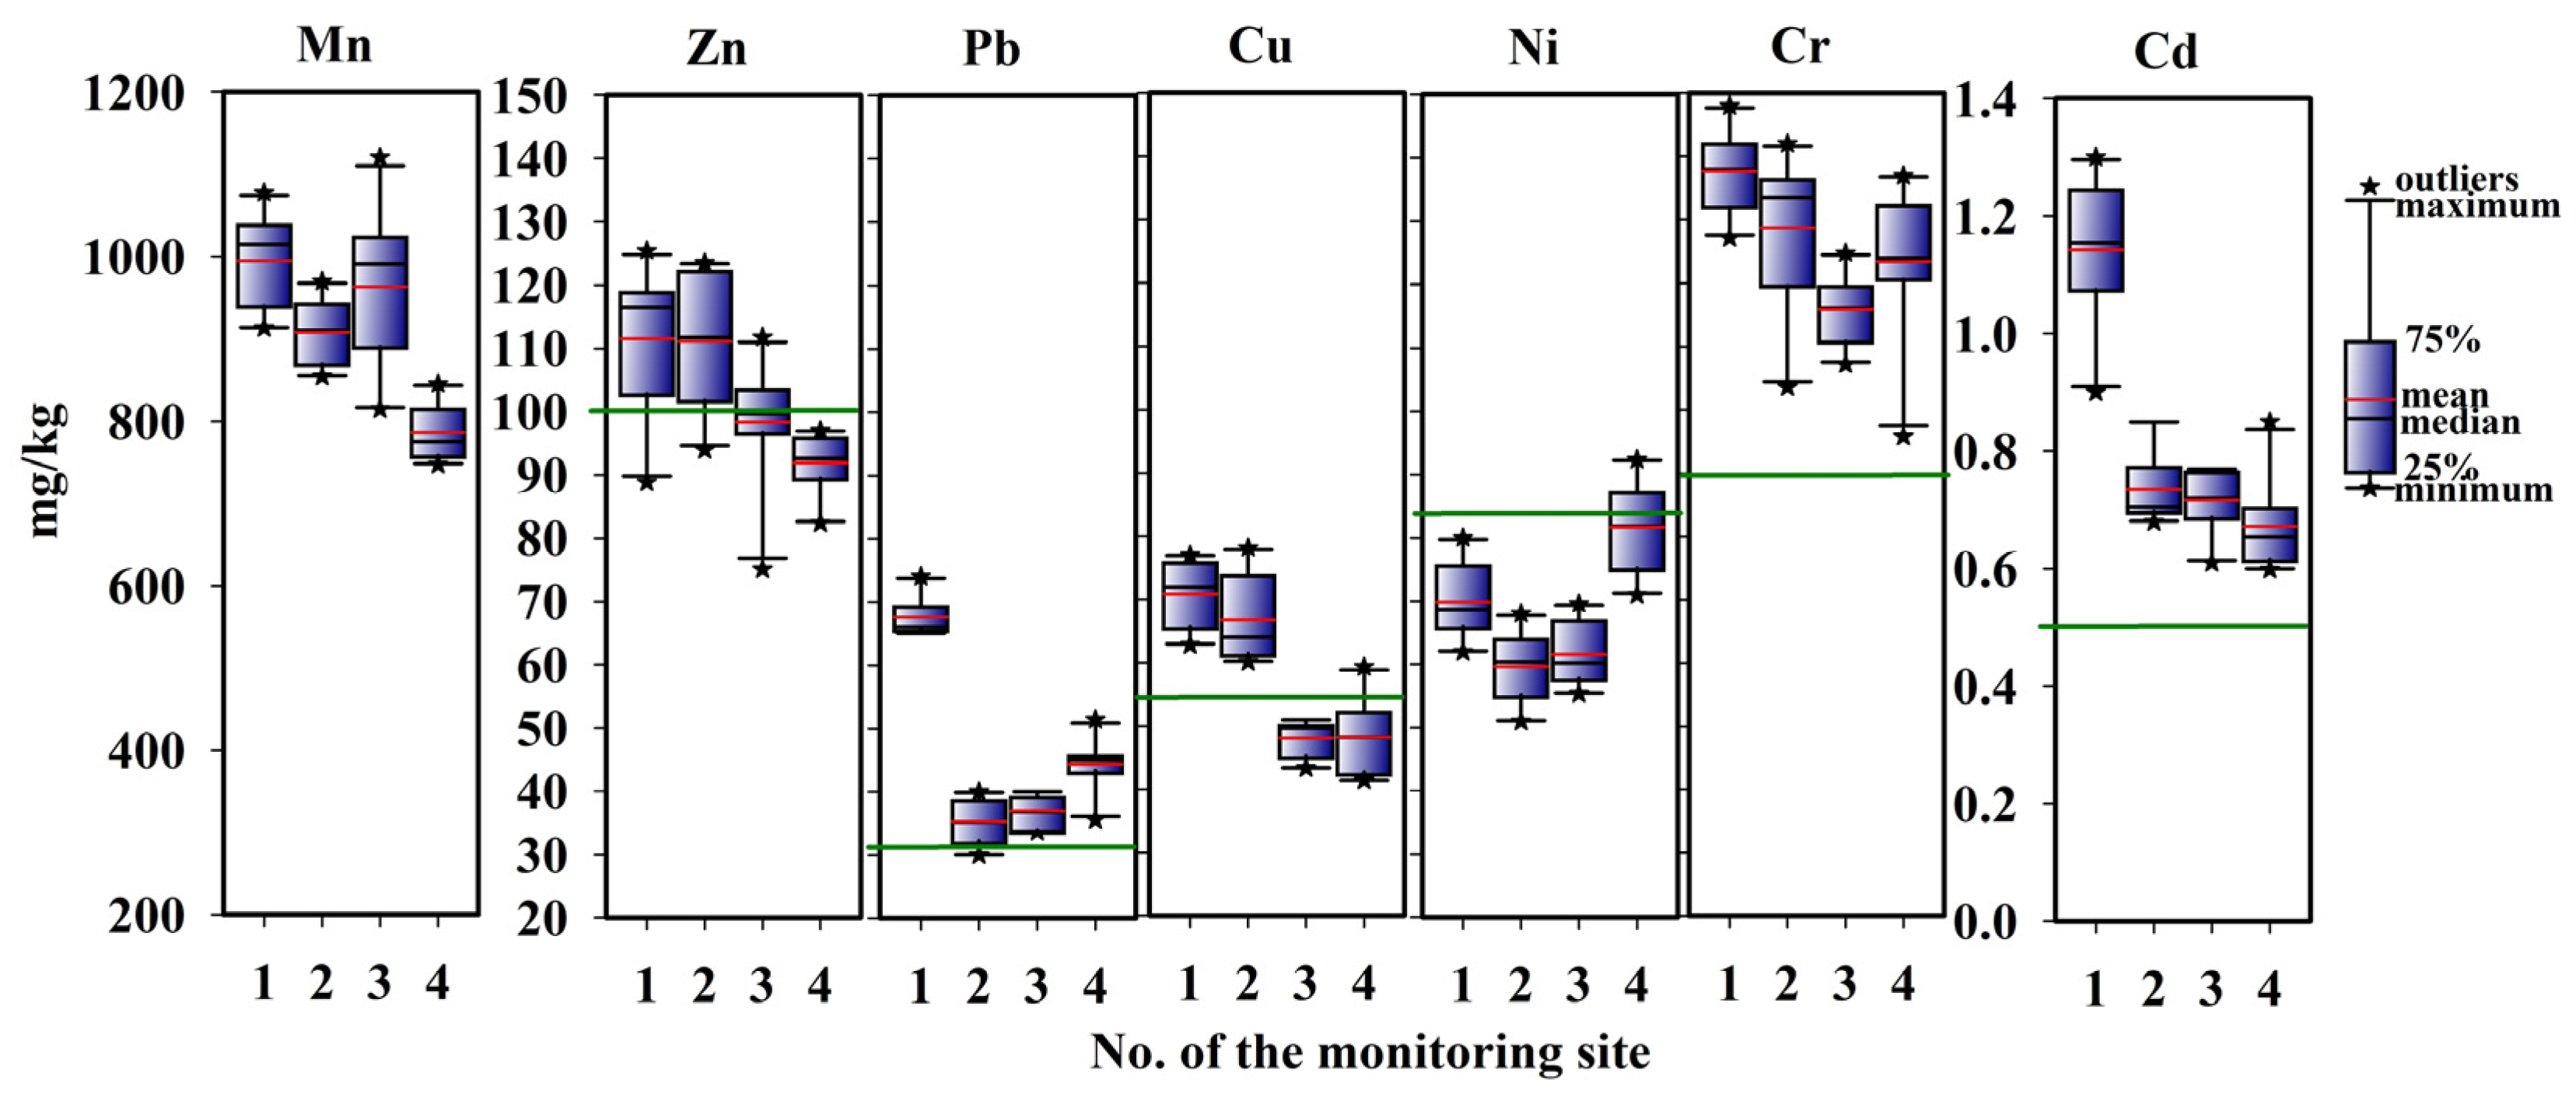
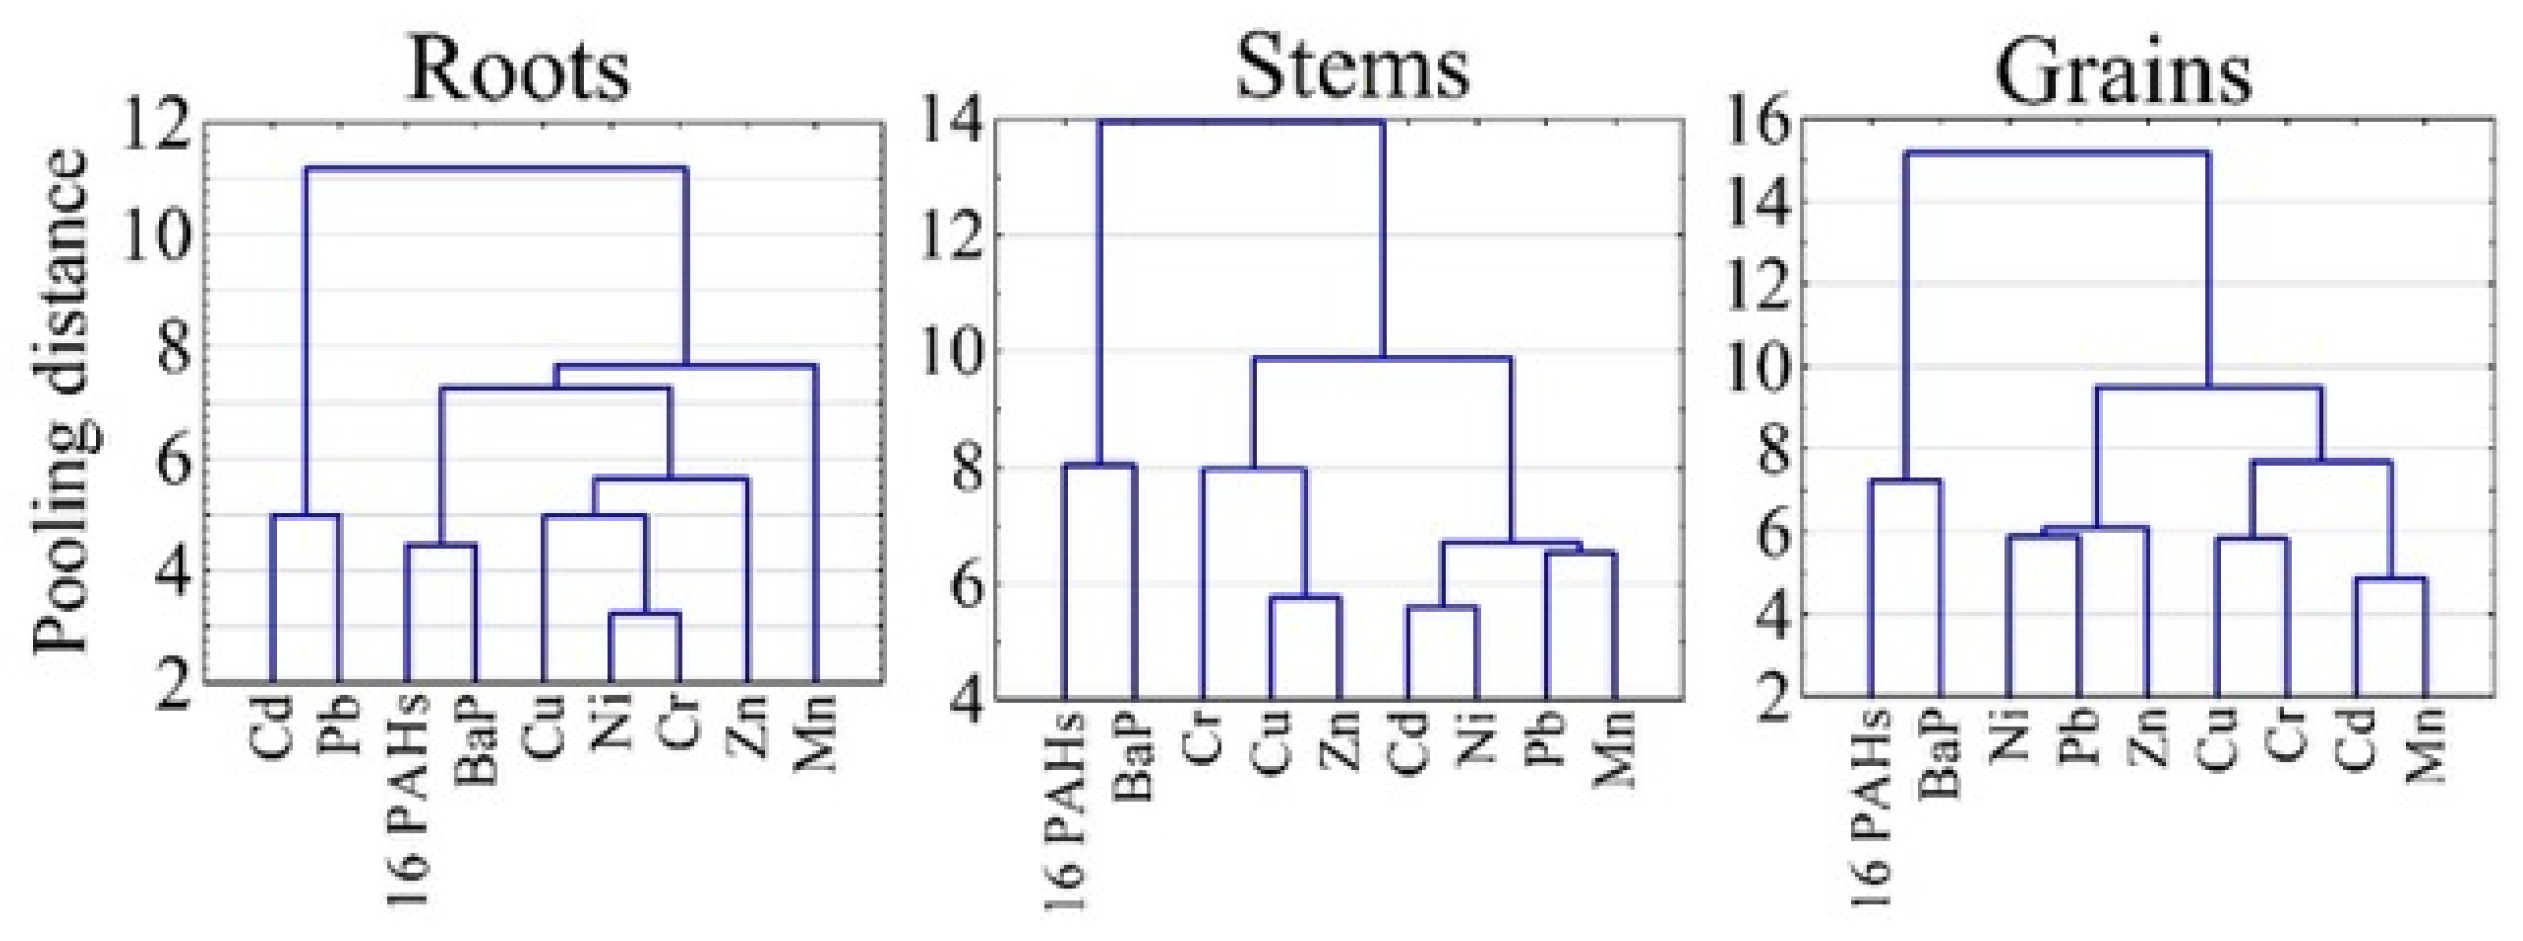
Monitoring sites were located up to 2.2 km radius in different directions from the branch of Novocherkassk Power Station (NPS), the largest fuel and energy complex in the Rostov Region (Figure 1) [26]. Despite the close location to NPS, within 2.5 km from the station, there were fields sown with oilseeds and cereal crops. This led to the choice of monitoring sites where common wheat (Triticum aestivum) was regularly cultivated. According to the data of long-term meteorological studies, the north-western wind direction prevails in the region under study, causing the greatest distribution of atmospheric emissions from the enterprise. Plants were sampled annually during the 2012–2021 period in the first ten days of July. The crop was in the phase of full ripeness, since it is precisely during this phase that maximum broadcasting of organic pollutants was performed [27,28]. The plants were divided into three parts: roots, stems, and grains for the analysis. The grains were separated from the ear by hand for further analysis. Along with plants, samples of ordinary carbonate chernozem (Haplic Chernozem) were collected, with the following physical and chemical properties: humus content 3.6–4.2%; pH 7.4–7.7; physical clay 50.6–56.3%; silt 40.4–44.6%; CaCO3 0.5–1.1%; EKO 31–36 cmol kg−1, exchangeable cations (cmol kg−1): Ca2+ 31.0–34.2; Mg2+ 5.1–6.3; Na+ 0.03–0.06.
The HMs such as Mn, Zn, Cu, Cr, Pb, Cd, and Ni, presented in the NPS emissions, were determined in plant and soil samples. The total content of HMs in the soil samples was determined by X-ray fluorescence method using X-ray spectrometer (Spectroscan MAX-GV, SPECTRON Ltd., Saint-Petersburg, Russia). The exchangeable form of the metals were extracted into solution with 1 N ammonium acetate buffer (NH4Ac) at pH 4.8 (soil:solution ratio = 1:5, extraction time 18 h) and measured with an atomic absorption spectrophotometer (KVANT 2-AT, Kortec Ltd., Moscow, Russia) [29,30].
Mineralization of plant samples was carried out by dry ashing method according to [31]. Extraction of HMs from ash was carried out with a 20% HCl solution followed by determination on an atomic absorption spectrometer (KVANT 2-AT, Kortec Ltd., Moscow, Russia).
The extraction of PAHs from soil and plants samples was carried out with n-hexane (ultragrade, 99% pure, Sigma-Aldrich, Munich, Germany) [32,33]. The pre-interfering lipid fraction was removed by saponification of 1 g of soil with a 2% KOH alcohol solution. The PAHs in the extract were quantified by high performance liquid chromatography using Agilent 1260 HPLC (Agilent, Santa Clara, CA, USA) with simultaneous fluorescence and ultraviolet detection (Agilent 1260, Waldbronn, Germany, 2015) according to ISO standard requirements [34]. During laboratory experiments, the concentrations of 16 priority PAHs were determined (U.S.E.P. Agency 2009): naphthalene, phenanthrene, anthracene, acenaphthene, acenaphthylene, fluorene, pyrene, chrysene, benzo[a]anthracene, fluoranthene benzo[b]fluoranthene, benzo[k]fluoranthene, BaP, and benzo[g,h,i]perylene. A total content of 16 PAHs were analyzed.
The content of HMs and PAHs in common wheat (Triticum aestivum) was analyzed in comparison with the MPC for raw food materials and food products such as “Grain (seeds), flour and cereals, and bakery products” [35]. To assess the level of the soil contamination, a number of standards were used for comparison with the MPC for Mn, Pb, and BaP [36] and for Ni, Cu, Zn, and Cd [37], and standards adopted from Canada [38] were used for Cr, since standard values for this indicator are currently unavailable in Russia. The total content of PAHs in the soil was estimated based on the classification of agricultural land proposed by Maliszewska-Kordybach [39]. In addition, the results of the HM and PAH total content evaluation were compared with corresponding values in Haplic Chernozem located on the virgin land of the background territory for the dry steppe zone (Table 1).
To assess the resistance of reed plants under conditions of technogenic pollution with HM and PAH, the accumulation coefficient (AC) and the translocation factor (TF) of plants were calculated. The AC represents the ratio of the concentration of the pollutant in the dry mass of a plant to the content of its exchangeable forms in the soil [40]. The TF1 value allows assessment of the barrier functions of a plant under pollution and is defined as the ratio of the pollutant concentration in the stems to the concentration in the roots [41]. Additionally, for assessment of the pollutant’s translocation intensity from stem to grains, TF2 was calculated as the ratio of the pollutant’s concentration in the grain to their concentration in the stems.
Statistical analysis of the obtained results, as well as the compilation of graphic material, was carried out using STATISTICA 10 and Sigmaplot 12.5.

3. Results

It was observed that the maximum technogenic load was in the soil samples from monitoring sites No. 1 (2.0 km W) and No. 2 (1.5 km N). The highest concentration of HMs and PAHs were observed in the soils of the aforementioned plots, which is especially significant for the soil of plot No. 1 (H) (Figure 2, Figure 3 and Figure 4) over the entire monitoring period.
Over this 10-year period of monitoring studies, we observed that, on average, the total content of all HMs exceeded the background concentrations of elements in the soil except for Ni. Despite the excess, the concentration of HMs in the soil of agricultural fields decreased, with a similar tendency in the series of the background territory, i.e., Mn > Cr > Zn > Ni > Cu > Pb > Cd. The concentration of Pb, Cr, and Cd exceeded the MPC in the soils of all monitoring sites, while for Zn and Cu, MPCs were exceeded only in sites located in the priority western and northern directions from the power plant (No. 1 and No. 2). Concentrations of Mn and Ni above that of the MPCs was not detected in any monitoring sites throughout the entire period of study (Figure 2).
Overall, the distribution patterns of HM exchangeable forms had similar tendencies in the total concentration of elements in the soil of agricultural fields (Figure 3). However, MPC was exceeded by HM exchangeable forms only in the monitoring site No. 1 for Pb, Cu, Cr, and Cd throughout the entire study period, which indicated the technogenic origin of the established concentrations for these elements. The decreasing order of the HMs mobile forms content somewhat differed from their total content: Mn > Zn > Cr > Pb > Cu > Ni > Cd. In contrast, an increase in the amount of Pb and Cu was observed in the existing series of exchangeable forms.
The concentration of BaP and the total amount of 16 priority PAHs exceeded the background values throughout the study. At the same time, the highest concentration of polyarenes was observed for the soil of monitoring site No. 1 (2.0 km W), which was subjected to the greatest technogenic load due to its location in the prevailing wind direction and minimal distance from the enterprise. For the entire period of monitoring studies, the content of BaP on average exceeded the MPC by more than 16 times. The total concentration of 16 priority PAHs in soil from monitoring site No. 1 (2.0 km W) corresponded to heavily polluted soils. Soils from site no. 2 (1.5 km N) corresponded to polluted ones, according to the classification proposed by Maliszewska-Kordybach [40]. Finally, soils from site no. 3 (2.2 km S) and no. 4 (2.1 km E) related to the category of polluted and slightly polluted soils, respectively (Figure 4). Grouping by soil pollution with the total amount of 16 priority PAHs was determined based on data from [39].
During the observation period, the concentration of almost all the studied pollutants increased in soils (Table 2). Significant increase was also found in the concentration of exchangeable forms of Pb, Cu, Ni, Cd, as well as BaP in the soils from monitoring site No. 1, located on the windward side of the NPS. The soils from monitoring sites No. 2 and No. 3 were characterized by an increase in the content of only exchangeable Pb, Zn, Cu, and BaP (Table 2).
The accumulation of HMs and PAHs in various organs of common wheat (Triticum aestivum) reflected the pollutants content in the soil. The highest concentrations of HMs and PAHs were observed in plants growing on monitoring site no. 1 (W), where the MPC in wheat grain exceeded for Zn, Cu, Pb, and Cd by 1.6, 2.1, 19.8, and 6.0 times, respectively (Table 3). Site No. 4 was characterized by the lowest content of most HMs in wheat plants, which can be attributed to its remoteness from the emission source (2.1 km) compared to sites no. 1 and no. 2 and the location of this point on the leeward side of the NPS. The consistency of data obtained confirms the anthropogenic origin of the increased concentrations of elements in plants. On average, over the entire observation period, Pb, Cd, and BaP concentrations exceeded the MPC in wheat grains regardless of the sampling location, as well as Zn and Cu in plants from monitoring site no. 1 (W) (Table 3).
Correlations between the content of pollutants in the soil and in the wheat were found (at p < 0.05) (Table 4). A significant correlation was observed between the content of Mn, Cr, and BaP in the soil and various plant parts. The results demonstrated a significant correlation of Zn and Pb between soil and root, as well as between soil and the stem. For other studied pollutants, including Cu, Ni, and Cd, as well as 16 priority PAHs, significant relationships can be traced only between the concentrations in soil and roots. In this case, the lack of significant correlations indicates either the presence of a selective element-static barrier on the path of pollutant migration in the soil–roots–stems–grain system or foliar input of HMs and PAHs into the aboveground organs of wheat.
Relationships between the absorption of pollutants during the period of plant growth and the duration of exposure to the pollutant were determined (Table 5). It was shown that as one approaches the source of emission, the relationship between the content of pollutants in plants increases, which is more typical for roots.
Determination of the significance in the Triticum aestivum barrier mechanisms preventing the pollutants migration in the soil–root–stem–grain system, as well as the analysis of the HM and PAH redistribution coefficients (AC) between the soil and various plant organs, was carried out. The accumulation of pollutants in plants and the intensity of their migration from the soil to the grains were different for various types of contaminants: inorganic and organic, and HMs and PAHs, respectively. The AC of Mn, Ni, and Cr was characterized by relatively lower values and did not depend on the proximity to the emission source. The redistribution coefficients of elements in the root–stem (TF1) and stem–grain (TF2) systems were lower than those in the soil–root system (Figure 5) Overall, the values of TF1 and TF2 for various HMs in wheat (Triticum aestivum) were at par with each other. However, there was an increased variability in the intensity of Pb and Cu accumulation, which may be correlated with their content increasing in the soil over the monitoring period (Table 3, Figure 5). In this case, the PAHs migration intensity into common wheat organs was lower than that of HMs. The redistribution coefficients of PAH AC, TF1, and TF2 were below 1. The redistribution coefficients of the 16 PAHs total content decreased in the following order: soil–root (AC) > root–stem (TF1) > stem–grain (TF2). A similar trend was also observed for BaP accumulation in wheat (Triticum aestivum) from monitoring site No. 1, while for plants from other monitoring sites, TF1 values slightly exceeded AC, which might be due to the lower technogenic load and subsequently a reduced barrier function (Figure 5).
Using clustering of the data obtained over a 10-year monitoring period, pollutant groups were identified that have similar patterns of migration in the soil–roots–stems–grains system under a technogenic load emerging from a point emission source (Figure 6). According to the pollutant’s accumulation nature in the roots, two clusters were identified. The first cluster represented by HMs did not perform vital physiological functions (viz. Cd and Pb), while the second cluster represented all other studied pollutants, including PAHs. More importantly, the content of the HMs exceeded the MPC in grains (Table 3).
Based on the results of the pollutants accumulation in the stems, two clusters were identified. Similar results were obtained by clustering the content of pollutants in the grains. For the above-ground parts of the plant, two clusters were identified, the first of which was represented by organic pollutants, while the second was represented by inorganic pollutants (Figure 6).

4. Discussion

For the study area, the greatest accumulation of pollutants in the W and N directions was due to the prevailing wind direction, which was previously discussed in studies performed for soils located around emission sources [42,43,44,45]. Categorically, higher PAH content was observed in soils located in the vicinity of power stations [20,46]. Due to the continuous mutually exclusive processes of accumulation and destruction of PAHs in the environment, their concentration in the soil characterizes the intensity of the emission source over time [32,47,48,49,50]. Interestingly, the increase in the mobility of HMs in soils are most likely a consequence of continuous exposure to atmospheric emissions from the power station. Similarly, an increase in the concentration of Pb, Zn, Cu, and Cd was observed during a fifteen-year monitoring of agricultural soils located near areas with heavy industrialization [51]. Soil contamination with Cd, Pb, and Zn has been extensively reported near smelters, power plants, and highways [20,52,53]. These elements can be considered as the indicators for diagnosing the ecological state of soils [52]. The increase in the content of BaP in soils over a 10-year monitoring period was primarily a consequence of an increase in the intensity of the technogenic load from a point source, such as thermal power plant NPS. The above-mentioned hypothesis was validated by the change in the strategy of soil self-purification through microbiological degradation to the process of “soil aging”, i.e., stable sorption of PAHs by the organic–mineral matrix [48,54,55,56]. Nadal et al. also observed an increase in the content of PAHs in the soils of the impact zones over time near chemical and petrochemical plants [57].
It should be noted that, for wheat plants, predominant accumulation of only PAHs was observed in the roots, while HMs were accumulated to a greater extent in the stems and grains. Consequently, there was a long-term multi-element contamination of wheat plants with HMs. However, the total concentration of elements accumulated in the plant was relatively low and did not characterize wheat (Triticum aestivum) as an accumulator or hyperaccumulator of HMs. Hyperaccumulators include plants that actively absorb excessively large amounts of one or more HMs from the soil. Under conditions of soil pollution, hyperaccumulators accumulate 100–1000 times more HMs in shoot and leaf tissues than plants that do not belong to this class [58]. Within the same family, different plant species may exhibit similar tolerance to HM pollution [59,60]. As part of the Poaceae family, southern reed can be classified as a hyperaccumulator [33] Despite wheat (Triticum aestivum) belonging to the Poaceae family, it does not have typical features for increased accumulation of HMs in comparison with other species. This was also confirmed in previous studies on this area regarding the accumulation of HMs by plants Artemisia austriaca Pall., Achillea nobilis L., and Ambrosia artemisiifolia L. [26,41]. Consequently, the accumulation of HMs exceeding the MPC, especially for elements that are not essential for catalyzing physiological functions in wheat (viz. Cd and Pb), is primarily due to the intensity of the technogenic load from the emission source [58]. The same may be endorsed for the accumulation of PAHs in plants. This is especially pronounced for the carcinogen of the first hazard class BaP. Artificial soil contamination of Haplic Chernozem by BaP in the amount of 20 ng g−1 led to disorientation in the root architecture in spring barley (Poaceae family), which subsequently led to losses in yield and quality of the cultivated crop [61].
A significant correlation between the content of Mn, Cr, Zn, Pb, and BaP in the soil and roots, as well as between the soil and aboveground parts of wheat, indicates the migration of these pollutants directly from the soil into the plant. At the same time, the absence of such correlation for Cd, Cu, Ni indicates either the presence of a selective element-static barrier on the path of pollutant migration in the soil–roots–stems–grain system or foliar input of HMs and PAHs into the aboveground organs of wheat. There is also a correlation between the absorption of pollutants during the phenological phases of plant ontogenesis and the duration of exposure to pollutants, since it is only during the growing season that it is transferred from the soil to the aboveground part of the plant [62,63].
The obtained AC values indicated a significant influx of Cd, Cu, Zn, and Pb into the roots of wheat from mobile forms in the soil (Figure 3). Simultaneously, the AC values for these elements increased depending on the proximity of plants cultivated near the emission source; in descending order, No. 1 > No. 2 > No. 3 > No. 4. This trend of pollutant accumulation in the roots indicated that their entry into the root part of wheat was more intense at a lower level of technogenic load due to the absence of the barrier function. The AC of Mn, Ni, and Cr was characterized by relatively lower values and did not depend on the proximity to the emission source. The lower values of TF1 and TF2 are indicating the presence of a definite barrier for limiting HM migration in the root–stem–grain system. The increased variability of the Pb and Cu redistribution coefficients with comparable median values of TF1 and TF2 for different HMs, which was most likely due to an increase in the level of technogenic load over the time. In addition, their accumulation in the aboveground organs may also be attributed to regular foliar exposure to these HMs. At the same time, the increased AC depending on the proximity of plants to the emission source indicated that their entry into the root part of wheat was more intense at a lower level of technogenic load due to the absence of the barrier function.
The less intense migration of PAHs into plant organs compared to the HMs was due to their lower water solubility [24,64] and indicated the presence of element-static barriers to the migration of soil–root–stem–grain pollutants. Higher values of AC from the sum of the 16 priority PAHs than that of individual BaP exposure may also be attributed to the presence of an individual compound with a higher solubility among the 16 priority PAHs composition (naphthalene, fluorene, phenanthrene, anthracene, acenaphthene, acenaphthylene, pyrene, chrysene, fluoranthene, and benzo[a]anthracene) than BaP [24].
According to cluster analysis, HMs (Cd, Pb) that do not perform physiologically important functions in the plant were combined into a separate group. The presence of Cd in the plant system often interferes with vital biochemical processes including membrane transport, protein binding, and interactions with other elements viz. Ca [65]. Moreover, Pb is an antagonist of Cd, as its uptake provokes an increased accumulation of Ca and Mg in plant tissues [66,67]. Most likely, two mutually exclusive processes occur inseparably from each other, regulating the supply of both metals to the roots, while other elements and PAHs migrated in the roots of wheat without significantly affecting the accumulation of each other through diffusion [65,68].
The intensity of HM and PAH migration from the root to the stem and further to the grain is primarily due to their solubility, which was also evidenced by the results of cluster analysis, namely, the association of PAHs into a group isolated from HMs.

5. Conclusions

An increase in the level of technogenic load on the soils and plants located near a large power station over time (10 years) was observed for Haplic Chernozem soil and common wheat (Triticum aestivum). An accumulative effect of emissions from the thermal power plant was reflected in the concentrations of Pb, Zn, Cu, and BaP in soils and plants sampled from the exposed territory. At the same time, the highest technogenic load was recorded in the soil and plant samples from monitoring site No. 1 (2.0 km W), located on the windward side of the emission source. The proximity of agricultural land to the power station significantly contributed to the accumulation of Pb, Cd, and BaP in wheat grains in concentrations exceeding the MPC levels. An increased concentration of pollutants was also observed in the wheat stem over the period. The active presence of plant barrier mechanisms on the soil–root–stem–grain migration pathways was also observed. Barrier functions of common wheat were more significant for PAHs than for HMs, especially on the root–stem and grain–stem migration pathways. Finally, it was demonstrated that soil was not the only primary source of PAHs and HMs entry into plant tissues, but the regular foliar exposure through emissions of the power station, especially in the windward direction, also led to significant accumulation in the plant tissues.

Author Contributions

Conceptualization, V.C. and T.M.; methodology, D.N., A.B. (Anatoly Barakhov) and M.B.; software, Y.L.; formal analysis, T.D., S.M. and Y.L.; investigation, A.B. (Andrey Barbashev) and N.C.; data curation, S.M., Anatoly Barakhov, V.R. and M.B.; writing—original draft preparation, V.C.; writing—review and editing, T.M., O.N. and S.S.; visualization, T.D.; supervision, S.S. and T.M. All authors have read and agreed to the published version of the manuscript.

Funding

The study was supported by the Russian Science Foundation (project No. 22-77-10097) at the Southern Federal University.

Institutional Review Board Statement

Not applicable.

Data Availability Statement

The data presented in this study are available on request from the corresponding author. The data are not publicly available due to privacy restrictions.

Conflicts of Interest

The authors declare there is no conflict of interest in this work.

References

  1. Siromlya, T.I.; Zagurskaya, Y.V.; Bayandina, I.I. The Elemental Composition of Hypericum Perforatum Plants Sampled in Environmentally Different Habitats by the Example of West Siberia. Botanica Pacifica 2020, 9, 127–132. [Google Scholar] [CrossRef]
  2. Brusseau, M.L.; Pepper, I.L.; Gerba, C.P. Environmental and Pollution Science, 3rd ed.; Elsevier: London, UK, 2019; p. 662. [Google Scholar]
  3. Diamond, M.L.; de Wit, C.A.; Molander, S.; Scheringer, M.; Backhaus, T.; Lohmann, R.; Arvidsson, R.; Bergman, Å.; Hauschild, M.; Holoubek, I.; et al. Exploring the planetary boundary for chemical pollution. Environ. Int. 2015, 78, 8–15. [Google Scholar] [CrossRef] [PubMed] [Green Version]
  4. McCrink-Goode, M. Pollution: A global threat. Environ. Int. 2014, 68, 162–170. [Google Scholar] [CrossRef]
  5. Muralikrishna, I.V.; Manickam, V. Environmental Management: Science and Engineering for Industry; Elsevier: Kidlington, UK, 2017; p. 664. [Google Scholar]
  6. Trevors, J. What is a global environmental pollution problem? Water Air Soil Pollut. 2010, 210, 1–3. [Google Scholar] [CrossRef] [Green Version]
  7. Rodríguez-Eugenio, N.; McLaughlin, M.; Pennock, D. Soil Pollution: A Hidden Reality; FAO: Rome, Italy, 2018; p. 142. [Google Scholar]
  8. Bini, C.; Bech, J. PHEs, Environment and Human Health. In Potentially Harmful Elements in the Environment and the Impact on Human Health; Springer Science+Business Media: Dordrecht, The Netherland, 2014; p. 467. [Google Scholar]
  9. Chen, M.; Xu, P.; Zeng, G.; Yang, C.; Huang, D.; Zhang, J. Bioremediation of soils contaminated with polycyclic aromatic hydrocarbons, petroleum, pesticides, chlorophenols and heavy metals by composting: Applications, microbes and future research needs. Biotechnol. Adv. 2015, 33, 745–755. [Google Scholar] [CrossRef]
  10. Meuser, H. Contaminated Urban Soils; Springer Science & Business Media: Dordrecht, The Netherland, 2010; Volume 18. [Google Scholar]
  11. Kuppusamy, S.; Thavamani, P.; Venkateswarlu, K.; Lee, Y.B.; Naidu, R.; Megharaj, M. Remediation approaches for polycyclic aromatic hydrocarbons (PAHs) contaminated soils: Technological constraints, emerging trends and future directions. Chemosphere 2017, 168, 944–968. [Google Scholar] [CrossRef]
  12. Tsibart, A.; Gennadiev, A. Polycyclic aromatic hydrocarbons in soils: Sources, behavior, and indication significance (a review). Eurasian Soil Sci. 2013, 46, 728–741. [Google Scholar] [CrossRef]
  13. Yunker, M.B.; Perreault, A.; Lowe, C.J. Source apportionment of elevated PAH concentrations in sediments near deep marine outfalls in Esquimalt and Victoria, BC, Canada: Is coal from an 1891 shipwreck the source? Org. Geochem. 2012, 46, 12–37. [Google Scholar] [CrossRef]
  14. Błońska, E.; Lasota, J.; Szuszkiewicz, M.; Łukasik, A.; Klamerus-Iwan, A. Assessment of forest soil contamination in Krakow surroundings in relation to the type of stand. Environ. Earth Sci. 2016, 75, 1–15. [Google Scholar] [CrossRef] [Green Version]
  15. Bourotte, C.L.; Sugauara, L.E.; DE Marchi, M.R.; Souto-Oliveira, C.E. Trace metals and PAHs in topsoils of the University campus in the megacity of São Paulo, Brazil. An. Acad. Bras. Cienc. 2019, 91, e20180334. [Google Scholar] [CrossRef] [Green Version]
  16. Cachada, A.; Pereira, E.; da Silva, E.F.; Duarte, A. Sources of potentially toxic elements and organic pollutants in an urban area subjected to an industrial impact. Environ. Monit. Assess. 2012, 184, 15–32. [Google Scholar] [CrossRef]
  17. Ciarkowska, K.; Gambus, F.; Antonkiewicz, J.; Koliopoulos, T. Polycyclic aromatic hydrocarbon and heavy metal contents in the urban soils in southern Poland. Chemosphere 2019, 229, 214–226. [Google Scholar] [CrossRef] [PubMed]
  18. De Nicola, F.; Baldantoni, D.; Sessa, L.; Monaci, F.; Bargagli, R.; Alfani, A. Distribution of heavy metals and polycyclic aromatic hydrocarbons in holm oak plant–soil system evaluated along urbanization gradients. Chemosphere 2015, 134, 91–97. [Google Scholar] [CrossRef] [PubMed]
  19. Nikolaeva, O.; Rozanova, M.; Karpukhin, M. Distribution of traffic-related contaminants in urban topsoils across a highway in Moscow. J. Soils Sediments 2017, 17, 1045–1053. [Google Scholar] [CrossRef]
  20. Peng, C.; Ouyang, Z.; Wang, M.; Chen, W.; Li, X.; Crittenden, J.C. Assessing the combined risks of PAHs and metals in urban soils by urbanization indicators. Environ. Pollut. 2013, 178, 426–432. [Google Scholar] [CrossRef] [PubMed]
  21. Wang, C.; Yang, Z.; Zhang, Y.; Zhang, Z.; Cai, Z. PAHs and heavy metals in the surrounding soil of a cement plant Co-Processing hazardous waste. Chemosphere 2018, 210, 247–256. [Google Scholar] [CrossRef]
  22. Abakumov, E.V.; Tomashunas, V.M.; Lodygin, E.D.; Gabov, D.; Sokolov, V.T.; Krylenkov, V.A.; Kirtsideli, I.Y. Polycyclic aromatic hydrocarbons in insular and coastal soils of the Russian Arctic. Eurasian Soil Sci. 2015, 48, 1300–1305. [Google Scholar] [CrossRef] [Green Version]
  23. Schwarzbauer, J.; Jovančićević, B. Organic Pollutants in the Geosphere. In Fundamentals in Organic Geochemistry; Springer International Publishing AG: Cham, Switzerland, 2018; p. 186. [Google Scholar]
  24. ATSDR. Minimal Risk Levels (MRLs) List. Electronic Data. Agency for Toxic Substances and Disease Registry. 2020. Available online: https://www.atsdr.cdc.gov/mrls/mrllist.asp#15tag (accessed on 20 July 2020).
  25. Smith, C.; Perfetti, T.; Garg, R.; Hansch, C. IARC carcinogens reported in cigarette mainstream smoke and their calculated log P values. Food Chem. Toxicol. 2003, 41, 807–817. [Google Scholar] [CrossRef]
  26. Mandzhieva, S.S.; Minkina, T.M.; Chaplygin, V.A.; Motuzova, G.V.; Sushkova, S.N.; Bauer, T.V.; Nevidomskaya, D.G. Plant contamination by heavy metals in the impact zone of Novocherkassk Power Station in the south of Russia. J. Soils Sediments 2015, 16, 1383–1391. [Google Scholar] [CrossRef]
  27. Kashin, V.; Ubugunov, L. Accumulation features of microelements in the grain of wheat grown in Western Transbaikalia. Agrokimiya 2012, 4, 68–76. [Google Scholar]
  28. Minkina, T.; Motuzova, G.; Mandzhieva, S.; Nazarenko, O. Ecological resistance of the soil–plant system to contamination by heavy metals. J. Geochem. Explor. 2012, 123, 33–40. [Google Scholar] [CrossRef]
  29. Minkina, T.; Motuzova, G.; Mandzhieva, S.; Nazarenko, O.; Burachevskaya, M.; Antonenko, E. Fractional and group composition of the Mn, Cr, Ni, and Cd compounds in the soils of technogenic landscapes in the impact zone of the Novocherkassk Power Station. Eurasian Soil Sci. 2013, 46, 375–385. [Google Scholar] [CrossRef]
  30. Minkina, T.M.; Nazarenko, O.G.; Motuzova, G.V.; Mandzhieva, S.S.; Burachevskaya, M.V. Group composition of heavy metal compounds in soils of agrocenoses polluted by aerosol emissions from the Novocherkassk State District Power Plant. Agrochemistry 2011, 6, 68–77. [Google Scholar]
  31. GOST 26657-85; Feed, Compound Feed, Compound Feed Raw Materials. Methods for Determining the Content of Phosphorus: Moscow, Russia, 1985.
  32. Sushkova, S.; Minkina, T.; Tarigholizadeh, S.; Antonenko, E.; Konstantinova, E.; GÜLSER, C.; Dudnikova, T.; Barbashev, A.; Kizilkaya, R. PAHs accumulation in soil-plant system of Phragmites australis Cav. in soil under long-term chemical contamination. Eurasian J. Soil Sci. (EJSS) 2020, 9, 242–253. [Google Scholar] [CrossRef]
  33. Sushkova, S.; Minkina, T.; Tarigholizadeh, S.; Rajput, V.; Fedorenko, A.; Antonenko, E.; Dudnikova, T.; Chernikova, N.; Yadav, B.K.; Batukaev, A. Soil PAHs contamination effect on the cellular and subcellular organelle changes of Phragmites australis Cav. Environ. Geochem. Health 2020, 43, 2407–2421. [Google Scholar] [CrossRef]
  34. ISO 13877-2005; Soil Quality-Determination of Polynuclear Aromatic Hydrocarbons—Method Using High-Performance Liquid Chromatography. ISO: Geneva, Switzerland, 2005.
  35. SanPiN 2.3.2.560-96; Hygienic Requirements for Quality and Safety Food Raw Materials and Foodstuffs. RussianGost: Alief, TX, USA, 1996.
  36. GN 2.1.7.2041-06.2.1.7; Soil, Cleaning of Populated Areas, Production and Consumption Waste, Sanitary Protection of the Soil. Maximum Allowable Concentrations (MPC) of Chemicals in Soil. Hygienic Standards. Federal Center for Hygiene and Epidemiology of Rospotrebnadzor: Moscow, Russia, 2006; p. 15.
  37. GN 2.1.7.2511-09; Approximately Permissible Concentrations (AEC) of Chemical Substances in Soil: Hygienic Standards. Federal Center for Hygiene and Epidemiology of Rospotrebnadzor: Moscow, Russia, 2009; p. 10.
  38. Cepa, C.E.P.A. Canadian Soil Quality Guidelines for the Protection of Environmental and Human Health; Canadian Council of Ministers of the Environment: Winnipeg, MB, Canada, 1999. [Google Scholar]
  39. Maliszewska-Kordybach, B. Polycyclic aromatic hydrocarbons in agricultural soils in Poland: Preliminary proposals for criteria to evaluate the level of soil contamination. Appl. Geochem. 1996, 11, 121–127. [Google Scholar] [CrossRef]
  40. Mandzhieva, S.S.; Minkina, T.M.; Burachevskaya, M.V.; Kravtsova, N.E.; Chaplygin, V.A.; Lutsenko, E.K.; Sushkova, S.N.; Sherstnev, A.K. Features of nutrient uptake by spring barley grain at the contamination of chernozem with zinc and lead. Middle East J. Sci. Res. 2014, 22, 859–863. [Google Scholar]
  41. Chaplygin, V.; Minkina, T.; Mandzhieva, S.; Burachevskaya, M.; Sushkova, S.; Poluektov, E.; Antonenko, E.; Kumacheva, V. The effect of technogenic emissions on the heavy metals accumulation by herbaceous plants. Environ. Monit. Assess. 2018, 190, 1–18. [Google Scholar] [CrossRef]
  42. Dragović, R.; Gajić, B.; Dragović, S.; Đorđević, M.; Đorđević, M.; Mihailović, N.; Onjia, A. Assessment of the impact of geographical factors on the spatial distribution of heavy metals in soils around the steel production facility in Smederevo (Serbia). J. Clean. Prod. 2014, 84, 550–562. [Google Scholar] [CrossRef]
  43. Fritsch, C.; Giraudoux, P.; Cœurdassier, M.; Douay, F.; Raoul, F.; Pruvot, C.; Waterlot, C.; de Vaufleury, A.; Scheifler, R. Spatial distribution of metals in smelter-impacted soils of woody habitats: Influence of landscape and soil properties, and risk for wildlife. Chemosphere 2010, 81, 141–155. [Google Scholar] [CrossRef]
  44. Malav, L.C.; Khan, S.A.; Kumar, S.; Gupta, N.; Chaudhary, P. Effect of Air Pollutants on Growth and Yield of Rice (Oryza sativa) and Wheat (Triticum aestivum) Crops around the Coal Based Thermal Power Plant. Int. J. Curr. Microbiol. Appl. Sci. 2017, 6, 3151–3165. [Google Scholar] [CrossRef]
  45. Rachwał, M.; Magiera, T.; Wawer, M. Coke industry and steel metallurgy as the source of soil contamination by technogenic magnetic particles, heavy metals and polycyclic aromatic hydrocarbons. Chemosphere 2015, 138, 863–873. [Google Scholar] [CrossRef] [PubMed]
  46. Song, Y.; Wilke, B.-M.; Song, X.; Gong, P.; Zhou, Q.; Yang, G. Polycyclic aromatic hydrocarbons (PAHs), polychlorinated biphenyls (PCBs) and heavy metals (HMs) as well as their genotoxicity in soil after long-term wastewater irrigation. Chemosphere 2006, 65, 1859–1868. [Google Scholar] [CrossRef] [PubMed]
  47. Mazarji, M.; Minkina, T.; Sushkova, S.; Mandzhieva, S.; Fedorenko, A.; Bauer, T.; Soldatov, A.; Barakhov, A.; Dudnikova, T. Biochar-assisted Fenton-like oxidation of benzo[a]pyrene-contaminated soil. Environ. Geochem. Health 2022, 44, 195–206. [Google Scholar] [CrossRef] [PubMed]
  48. Minkina, T.; Vasilyeva, G.; Popileshko, Y.; Bauer, T.; Sushkova, S.; Fedorenko, A.; Antonenko, E.; Pinskii, D.; Mazarji, M.; Ferreira, C.S.S. Sorption of benzo[a]pyrene by Chernozem and carbonaceous sorbents: Comparison of kinetics and interaction mechanisms. Environ. Geochem. Health 2022, 44, 133–148. [Google Scholar] [CrossRef]
  49. Sushkova, S.; Deryabkina, I.; Antonenko, E.; Kizilkaya, R.; Rajput, V.; Vasilyeva, G. Benzo[a]pyrene degradation and bioaccumulation in soil-plant system under artificial contamination. Sci. Total Environ. 2018, 633, 1386–1391. [Google Scholar] [CrossRef]
  50. Sushkova, S.; Minkina, T.; Dudnikova, T.; Barbashev, A.; Mazarji, M.; Chernikova, N.; Lobzenko, I.; Deryabkina, I.; Kizilkaya, R. Influence of carbon-containing and mineral sorbents on the toxicity of soil contaminated with benzo[a]pyrene during phytotesting. Environ. Geochem. Health 2022, 44, 179–193. [Google Scholar] [CrossRef]
  51. Huang, S.; Liao, Q.; Hua, M.; Wu, X.; Bi, K.; Yan, C.; Chen, B.; Zhang, X. Survey of heavy metal pollution and assessment of agricultural soil in Yangzhong district, Jiangsu Province, China. Chemosphere 2007, 67, 2148–2155. [Google Scholar] [CrossRef]
  52. Douay, F.; Pruvot, C.; Roussel, H.; Ciesielski, H.; Fourrier, H.; Proix, N.; Waterlot, C. Contamination of Urban Soils in an Area of Northern France Polluted by Dust Emissions of Two Smelters. Water Air Soil Pollut. 2008, 188, 247–260. [Google Scholar] [CrossRef]
  53. Linnik, V.G.; Minkina, T.M.; Bauer, T.V.; Saveliev, A.A.; Mandzhieva, S.S. Geochemical assessment and spatial analysis of heavy metals pollution around coal-fired power station. Environ. Geochem. Health 2020, 42, 4087–4100. [Google Scholar] [CrossRef]
  54. Gorovtsov, A.V.; Minkina, T.M.; Mandzhieva, S.S.; Perelomov, L.V.; Soja, G.; Zamulina, I.V.; Rajput, V.D.; Sushkova, S.N.; Mohan, D.; Yao, J. The mechanisms of biochar interactions with microorganisms in soil. Environ. Geochem. Health 2020, 42, 2495–2518. [Google Scholar] [CrossRef]
  55. Lamichhane, S.; Krishna, K.B.; Sarukkalige, R. Polycyclic aromatic hydrocarbons (PAHs) removal by sorption: A review. Chemosphere 2016, 148, 336–353. [Google Scholar] [CrossRef]
  56. Rivas, F.J. Polycyclic aromatic hydrocarbons sorbed on soils: A short review of chemical oxidation based treatments. J. Hazard. Mater. 2006, 138, 234–251. [Google Scholar] [CrossRef] [PubMed]
  57. Nadal, M.; Schuhmacher, M.; Domingo, J.L. Long-term environmental monitoring of persistent organic pollutants and metals in a chemical/petrochemical area: Human health risks. Environ. Pollut. 2011, 159, 1769–1777. [Google Scholar] [CrossRef] [PubMed]
  58. Rascio, N.; Navari-Izzo, F. Heavy metal hyperaccumulating plants: How and why do they do it? And what makes them so interesting? Plant Sci. 2011, 180, 169–181. [Google Scholar] [CrossRef] [PubMed]
  59. Dias, A.P.L.; Rinaldi, M.C.; Domingos, M. Foliar accumulation of polycyclic aromatic hydrocarbons in native tree species from the Atlantic Forest (SE-Brazil). Sci. Total Environ. 2016, 544, 175–184. [Google Scholar] [CrossRef]
  60. Kapoor, C.; Chittora, A. Efficient Control of Air Pollution through Plants a Cost Effective Alternatives. J. Clim. Weather Forecast 2016, 4, 2. [Google Scholar] [CrossRef] [Green Version]
  61. Fedorenko, A.G.; Chernikova, N.; Minkina, T.; Sushkova, S.; Dudnikova, T.; Antonenko, E.; Fedorenko, G.; Bauer, T.; Mandzhieva, S.; Barbashev, A. Effects of benzo[a]pyrene toxicity on morphology and ultrastructure of Hordeum sativum. Environ. Geochem. Health 2021, 43, 1551–1562. [Google Scholar] [CrossRef]
  62. Vassilev, A.; Tsonev, T.; Yordanov, I. Physiological response of barley plants (Hordeum vulgare) to cadmium contamination in soil during ontogenesis. Environ. Pollut. 1998, 103, 287–293. [Google Scholar] [CrossRef]
  63. Keller, C.; Hammer, D.; Kayser, A.; Richner, W.; Brodbeck, M.; Sennhauser, M. Root development and heavy metal phytoextraction efficiency: Comparison of different plant species in the field. Plant Soil 2003, 249, 67–81. [Google Scholar] [CrossRef]
  64. Pretorius, T.R.; Charest, C.; Kimpe, L.E.; Blais, J.M. The accumulation of metals, PAHs and alkyl PAHs in the roots of Echinacea purpurea. PLoS ONE 2018, 13, e0208325. [Google Scholar] [CrossRef] [PubMed]
  65. Kabata-Pendias, A.; Mukherjee, A.B. Humans; Springer: Berlin/Heidelberg, Germany, 2007; pp. 67–83. [Google Scholar]
  66. Goncalves, A.C., Jr.; Schwantes, D.; de Sousa, R.F.B.; da Silva, T.R.B.; Guimarães, V.F.; Campagnolo, M.A.; de Vasconcelos, E.S.; Zimmermann, J. Phytoremediation capacity, growth and physiological responses of Crambe abyssinica Hochst on soil contaminated with Cd and Pb. J. Environ. Manag. 2020, 262, 110342. [Google Scholar] [CrossRef] [PubMed]
  67. Wang, C.; Lu, J.; Zhang, S.; Wang, P.; Hou, J.; Qian, J. Effects of Pb stress on nutrient uptake and secondary metabolism in submerged macrophyte Vallisneria natans. Ecotoxicol. Environ. Saf. 2011, 74, 1297–1303. [Google Scholar] [CrossRef] [PubMed]
  68. Kvesitadze, G.; Khatisashvili, G.; Sadunishvili, T.; Ramsden, J.J. Biochemical Mechanisms of Detoxification in Higher Plants: Basis of Phytoremediation; Springer Science & Business Media: Berlin/Heidelberg, Germany, 2006. [Google Scholar]
Figure 1. Location map of monitoring sites of agricultural lands located within the impact zone of the Novocherkassk Power Station.
Agriculture 13 00722 g001
Figure 2. The total concentration of HMs in agricultural fields soil located near the power station over a 10-year monitoring period. Green line is the maximum permissible concentrations (MPC). *—outlier.
Agriculture 13 00722 g002
Figure 3. The concentration of HMs exchangeable forms in the soils of agricultural fields located near the power station over a 10-year monitoring period. Green line is the maximum permissible concentrations (MPC). *—outlier.
Agriculture 13 00722 g003
Figure 4. The content of benzo[a]pyrene and the total amount of 16 priority PAHs in the soils of agricultural fields located near the power station over a 10-year monitoring period. *—outlier.
Agriculture 13 00722 g004
Figure 5. Accumulation coefficient (AC), translocation coefficients of pollutants between at the root-stem (TF1), and stem–grain (TF2) boundary of various pollutants in wheat (Triticum aestivum) over a 10-year monitoring period. *—outlier.
Agriculture 13 00722 g005
Figure 6. Clustering of pollutants in different parts of the plant over a 10-year monitoring period.
Agriculture 13 00722 g006
Table 1. The content of HMs and BaP and 16 priority PAHs total amount (∑16 PAHs) in the soils of the background dry steppe zone of southern Russia.
MnCrNiCuZnPbCdBaP∑16 PAHs
mg kg−1µg kg−1
814.596.561.451.971.727.70.616218
Table 2. Correlation between the content of pollutants in soil and time.
Pollutant№ Monitoring Site
1 (W)2 (N)3 (S)4 (E)
Exchangeable forms of heavy metals
Pb0.770.490.580.01
Zn0.350.450.770.31
Cu0.590.460.560.11
Ni0.79−0.070.28−0.21
Mn0.36−0.180.250.31
Cd0.450.330.330.41
Cr0.320.060.170.18
The total content of heavy metals
Pb−0.100.15−0.070.05
Zn0.35−0.09−0.28−0.05
Cu0.340.400.37−0.07
Ni0.07−0.120.13−0.17
Mn−0.170.06−0.17−0.12
Cd−0.040.420.310.35
Cr−0.31−0.270.31−0.22
PAHs
Sum of PAHs−0.170.06−0.17−0.12
BaP0.650.740.540.27
Note: bold indicates significant correlations obtained as a result of calculating the Spearman correlation coefficient at p < 0.05.
Table 3. Concentration of HMs, BaP, and 16 priority PAHs total amount (∑16 PAHs) in various parts of different parts of wheat sampled from agricultural fields located near the power station (2012–2021).
ParameterMnZnCrCuPbNiCdБaΠ∑16 PAHs
mg kg−1µg kg−1
Root
1 (W)mean56.281.221.021.59.49.80.663.6734.7
min/max42.0/67.061.9/126.616.0/28.012.0/26.97.0/11.67.9/13.90.3/0.844.5/100.5404.8/996.0
2 (N)mean40.555.811.76.012.57.80.715.6392.6
min/max22.0/61.041.3//63.07.7/15.02.7/8.08.4/20.45.7/8.80.4/1.010.4/26.9237.2/545.9
3 (S)mean53.648.97.211.12.73.20.413.4369.6
min/max23.4/71.333.6/77.35.0/8.11.5/14.41.8/3.81.7/4.10.1/0.58.4/26.7223.1/494.1
4 (E)mean20.742.86.63.45.52.80.121.1407.7
min/max11.5/32.232.6/59.15.2/9.81.4/4.83.9/6.52.4/6.40.04/0.212.4/35.6295.8/576.7
Stem
1 (W)mean 60.680.519.524.916.29.10.616.3101.8
min/max36.6/74.252.0/163.39.4/47.76.0/89.52.4/30.14.5/15.00.2/1.09.4/22.866.8/146.4
2 (N)mean37.748.311.65.711.87.70.710.4127.4
min/max18.4/83.332.0/82.16.9/16.02.4/11.05.0/18.23.3/12.80.3/1.16.0/16.974.7/205.7
3 (S)mean47.344.711.312.84.83.10.410.2166.6
min/max31.3/84.929.6/86.22.1/17.02.0/57.30.6/9.12.4/5.80.1/0.86.4/17.180.3/230.1
4 (E)mean20.342.97.63.05.12.80.116.2188.0
min/max9.6/47.914.1/94.53.9/10.61.5/4.63.4/6.52.2/4.00.04/0.48.4/27.6118.5/324.4
Grains
1 (W)mean54.782.820.921.29.98.70.64.171.8
min/max23.7/112.333.3/217.010.7/32.314.0/39.63.5/37.44.7/21.60.3/1.72.5/5.946.1/109.7
2 (N)mean40.448.410.69.812.510.10.62.899.1
min/max14.5/62.427.2/108.45.9/25.81.7/16.02.8/33.81.4/31.20.3/1.62.1/4.149.7/146.5
3 (S)mean46.043.35.710.02.53.20.43.3126.3
min/max26.0/116.521.2/69.94.0/10.72.0/25.71.2/4.02.1/5.70.1/1.52.3/5.855.4/214
4 (E)mean23.243.36.34.09.73.20.24.5139.0
min/max8.6/32.723.8/84.74.0/13.91.5/6.40.8/35.82.1/4.00.04/0.32.2/7.165.8/231.1
MPC-50-100.5-0.11.0-
Note: bold values indicates exceeding MPC.
Table 4. Correlation between the content of pollutants in soil and various parts of wheat plants (Triticum aestivum).
Plant PartSoil
MnZnCrCuPbNiCdBaP∑16 PAHs
Roots0.520.810.870.580.790.510.520.900.81
Stems0.510.480.510.440.510.070.090.670.28
Grain0.540.400.800.340.400.330.220.660.20
Note: bold values indicate significant correlations obtained as a result of calculating the Spearman correlation coefficient at p < 0.001.
Table 5. Relationship between pollutant uptake during plant growth and the duration of pollutant exposure.
Pollutant№ Monitoring Site
1 (W)2 (N)3 (S)4 (E)1 (W)2 (N)3 (S)4 (E)1 (W)2 (N)3 (S)4 (E)
RootStemGrains
Mn0.800.770.500.650.730.660.500.640.540.720.310.65
Zn0.700.530.110.750.700.640.170.710.720.610.070.70
Cr−0.050.78−0.040.70−0.100.310.070.750.120.74−0.270.26
Cu0.75−0.300.780.79−0.22−0.060.370.330.700.130.620.72
Pb0.790.72−0.190.16−0.080.650.14−0.190.710.110.060.06
Ni0.700.570.750.01−0.140.13−0.20−0.010.030.06−0.090.29
Cd0.580.73−0.350.740.600.64−0.300.690.600.60−0.300.55
BaP0.790.250.36−0.160.380.150.20−0.120.300.150.26−0.10
16 PAHs0.720.740.660.320.610.630.510.300.640.660.600.03
Note: bold values indicate significant correlations obtained as a result of calculating the Spearman correlation coefficient at p < 0.001.
Disclaimer/Publisher’s Note: The statements, opinions and data contained in all publications are solely those of the individual author(s) and contributor(s) and not of MDPI and/or the editor(s). MDPI and/or the editor(s) disclaim responsibility for any injury to people or property resulting from any ideas, methods, instructions or products referred to in the content.

