

The Relationship between Financial Literacy and Income Structure of Rural Farm Households: Evidence from Jiangsu, China


College of Economics, Sichuan Agricultural University, Chengdu 611130, China
*
Author to whom correspondence should be addressed.
Agriculture 2023, 13(3), 711; https://doi.org/10.3390/agriculture13030711
Submission received: 20 February 2023
/
Revised: 7 March 2023
/
Accepted: 16 March 2023
/
Published: 18 March 2023
(This article belongs to the Special Issue Effects of Policy and Climate on Farm Structure, Income, Productivity and Food Security)
Abstract
:Improving the income of rural residents is a requirement for poverty alleviation in all countries. Based on China Land Economic Survey (CLES) 2021 data, this paper investigates the homogenous and heterogeneous relations between financial literacy and the income structure of rural farm households. It finds that financial literacy is significantly related to farmers’ income levels, which still holds after the robustness testing. Regarding the structure of household income, financial literacy has a more profound association with farmers’ property income than wage income. Moreover, it has a relatively weak impact on transfer income with significance. Financial literacy has a more significant role in increasing the income of farmers with higher income levels than lower income levels. Moreover, it has different impacts on the income structure of different income groups. Therefore, this paper suggests that the government should co-operate with county-seated financial institutions to provide farmers with regular financial literacy education.
1. Introduction
Issues concerning China’s agriculture and farmers have always been fundamental to the national economy and policymakers because the rural population, which mainly consists of farmers, is enormous, approximately 500 million (36.11%) of the total Chinese population. Despite the overall success of the fight against poverty, issues concerning agriculture, rural areas, and farmers remain prominent. According to the Household Income and Consumption Expenditure in 2021 issued by the National Bureau of Statistics, the per capita disposable income of rural residents in China is only 39% of that of urban residents [1]. In addition, rural residents in China depend on wage income, and the contribution of the net income from the property is limited [2]. Increasing the incomes of rural residents and promoting the farmers’ and rural area residents’ livelihoods are inevitable requirements for steadily advancing the common prosperity of all the people [3,4,5]. Thus, increasing the various incomes of rural residents and improving the welfare of rural households may ensure a more balanced, comprehensive, and higher-level common prosperity.
Financial literacy, referred to as the knowledge and ability people possess to effectively manage financial resources for their lifetime financial well-being [6], has gradually become an essential concept widely recognized internationally as an important tool in household wealth creation. The United States President’s Advisory Committee on Financial Literacy (PACFL) [7] clearly stated that “there are many reasons for the financial crisis, and the lack of financial literacy of consumers is one of the main reasons”. The given definition shows that financial literacy is an essential element in one’s life; thus, national governments give maximum attention to it.
Since the G20 Summit, major economic entities, including China, have gradually clarified the importance of financial literacy in the development of the digital economy and explored effective ways to improve financial literacy. Although, in recent years, Chinese people have gradually awakened their awareness of investment and financing, their basic financial literacy needs to be improved [2]. Moreover, the rapid development of inclusive finance, which is explained as the principle of expanding access to affordable financial services to all individuals and businesses, especially low-income and rural households [8,9], has strengthened the financial literacy of rural residents in China [10]. Consumer Financial Literacy Survey and Analysis Report (2021) released by The People’s Bank of China showed that the index of consumers’ financial literacy in China has improved compared with previous years, which, however, is not satisfactory overall [2]. In addition, the financial literacy of groups with different demographic characteristics shows a certain degree of differentiation. Specifically, the financial literacy of consumers in rural areas is lower than that in urban areas. The high financial illiteracy in rural areas, which affects their risk management skills, may reduce rural residents’ basic perception of financial products and affect their capabilities of agricultural production and operation, investment decision making, and resource allocation for the improvement of welfare. Therefore, the following two questions are asked. ① Does financial literacy have a positive relationship with the income of rural households? ② What is the relationship between financial literacy and rural residents’ income structure?
Previous researchers have shown that some factors, including economic growth [11], economic policy uncertainty [12], rural finance development [13,14], and rural tourism development [15] influence the income of rural households. For example, Zhang et al. [13] found that improvement in the efficiency of rural finance would relieve the internal income inequality in rural area. Gajić. et al. [15] stated that tourism development in rural areas is to provide economic profit to the local population, or extra income, thus improving the quality of life. Increasing residents’ income requires the support of the macroeconomic environment and the positive efforts of micro individuals [16]. From the micro level, the income of rural households is principally affected by human capital [17,18], physical capital [19], social capital [20], financial capital [21], and other micro-foundations. For instance, Cheng et al. [18] stated that human capital, physical capital, financial assets, and nonagricultural employment help to narrow the income gap of rural farmers. Wu et al. [21] showed that the income increasing effect of financial capital is varied with both income stratification and regional differences.
The existing literature shows that the improvement of financial literacy is beneficial to scaling up household wealth [22]. Moreover, a low level of financial literacy may increase the probability of errors in family financial decision making and thus result in the loss of individual wealth [23]. Klapper et al. [24] stated that residents with higher financial literacy are less vulnerable to adverse income shocks and have more unexpended income and more substantial spending power. This indicates that financial literacy can better help people cope with macroeconomic shocks and increase their income. van Rooij et al. [22] found that financial literacy will significantly improve the probability of residents making retirement plans, thereby increasing the scale of family wealth. Moreover, Chinese scholars believe that financial literacy positively correlates with residents’ income level. For instance, Nie et al. [25] adopted the data of the China Household Finance Survey (CHFS) in 2015 and analyzed the impact of financial literacy on Chinese residents’ property income, whose results show that financial literacy has significant positive effects on the acquisition and scale of residents’ property income. Wang et al. [26] found that families with a higher level of financial literacy possess a higher probability of upward income mobility. Tao et al. [27] explored the influences of financial literacy on Chinese household income and its structure, which found that financial literacy positively affects total household income, wage income, and property income but negatively affects transfer income. Zhang and Yin [28] found that the improvement of financial knowledge can not only raise the income level of residents, but also significantly narrow the gap between the wealth of households. Wang et al. [26] held that financial knowledge is significantly and positively correlated with the growth rate of family income, and the increase in financial knowledge is conducive to the transition from low- to high-income families. Empirical research by Li et al. [29] proved that financial knowledge has a significant positive impact on the property income of urban residents. Hu [30] measured the financial literacy of residents from the two aspects of subjective and objective financial literacy. In his view, subjective financial literacy will significantly increase the scale of family real estate and assets and greatly elevate the wealth accumulation level of families through its interaction with education level. In Sub Sahara Africa (SSA), Andoh [31] and Agyei [32] showed that financial literacy has a positive relationship with small and medium enterprises in urban Ghana. In urban south Africa, youth entrepreneurship was positively linked to financial literacy [33].
Through the combing of the literature, it can be seen that financial literacy is associated with household income development. However, special attention on how financial literacy relates to the income structure of rural residents in China is lacking, to the best of our knowledge. Unlike Tao et al. [27], who focus on only one section of income structure (property income), our study considered all aspects of China’s income structures. Given this, the relationship between financial literacy and the income structure of rural households is investigated in this paper using China Land Economic Survey data in 2021 (CLES 2021) to fill the gap. Relevant suggestions are put forward to promote the common prosperity of farmers and rural areas in the future from the financial literacy perspective. The contributions of this article are as follows: first, the association between financial literacy and the income of rural farm households is discussed, and the research on this relationship is enriched. Second, rural farm households’ income structure of different attributes is decomposed to examine the relationship between rural farm households’ financial literacy and different sources of income. Third, rural households are grouped by income level, and the heterogeneous analysis depicting the relationship between financial literacy and the total income, as well as the income structure of rural farm households with different income levels, is analyzed. Further, the relationship between financial literacy and rural farm households’ income and income structure is revealed more comprehensively, providing new empirical evidence and a decision-making basis for raising the income of rural farm households and achieving the goal of common prosperity.
The remainder of this paper is arranged as follows: Part two is material and methods. Part three is results and discussion. Part four is conclusions and policy suggestions.
2. Materials and Methods
2.1. Data Source and Variables Definition
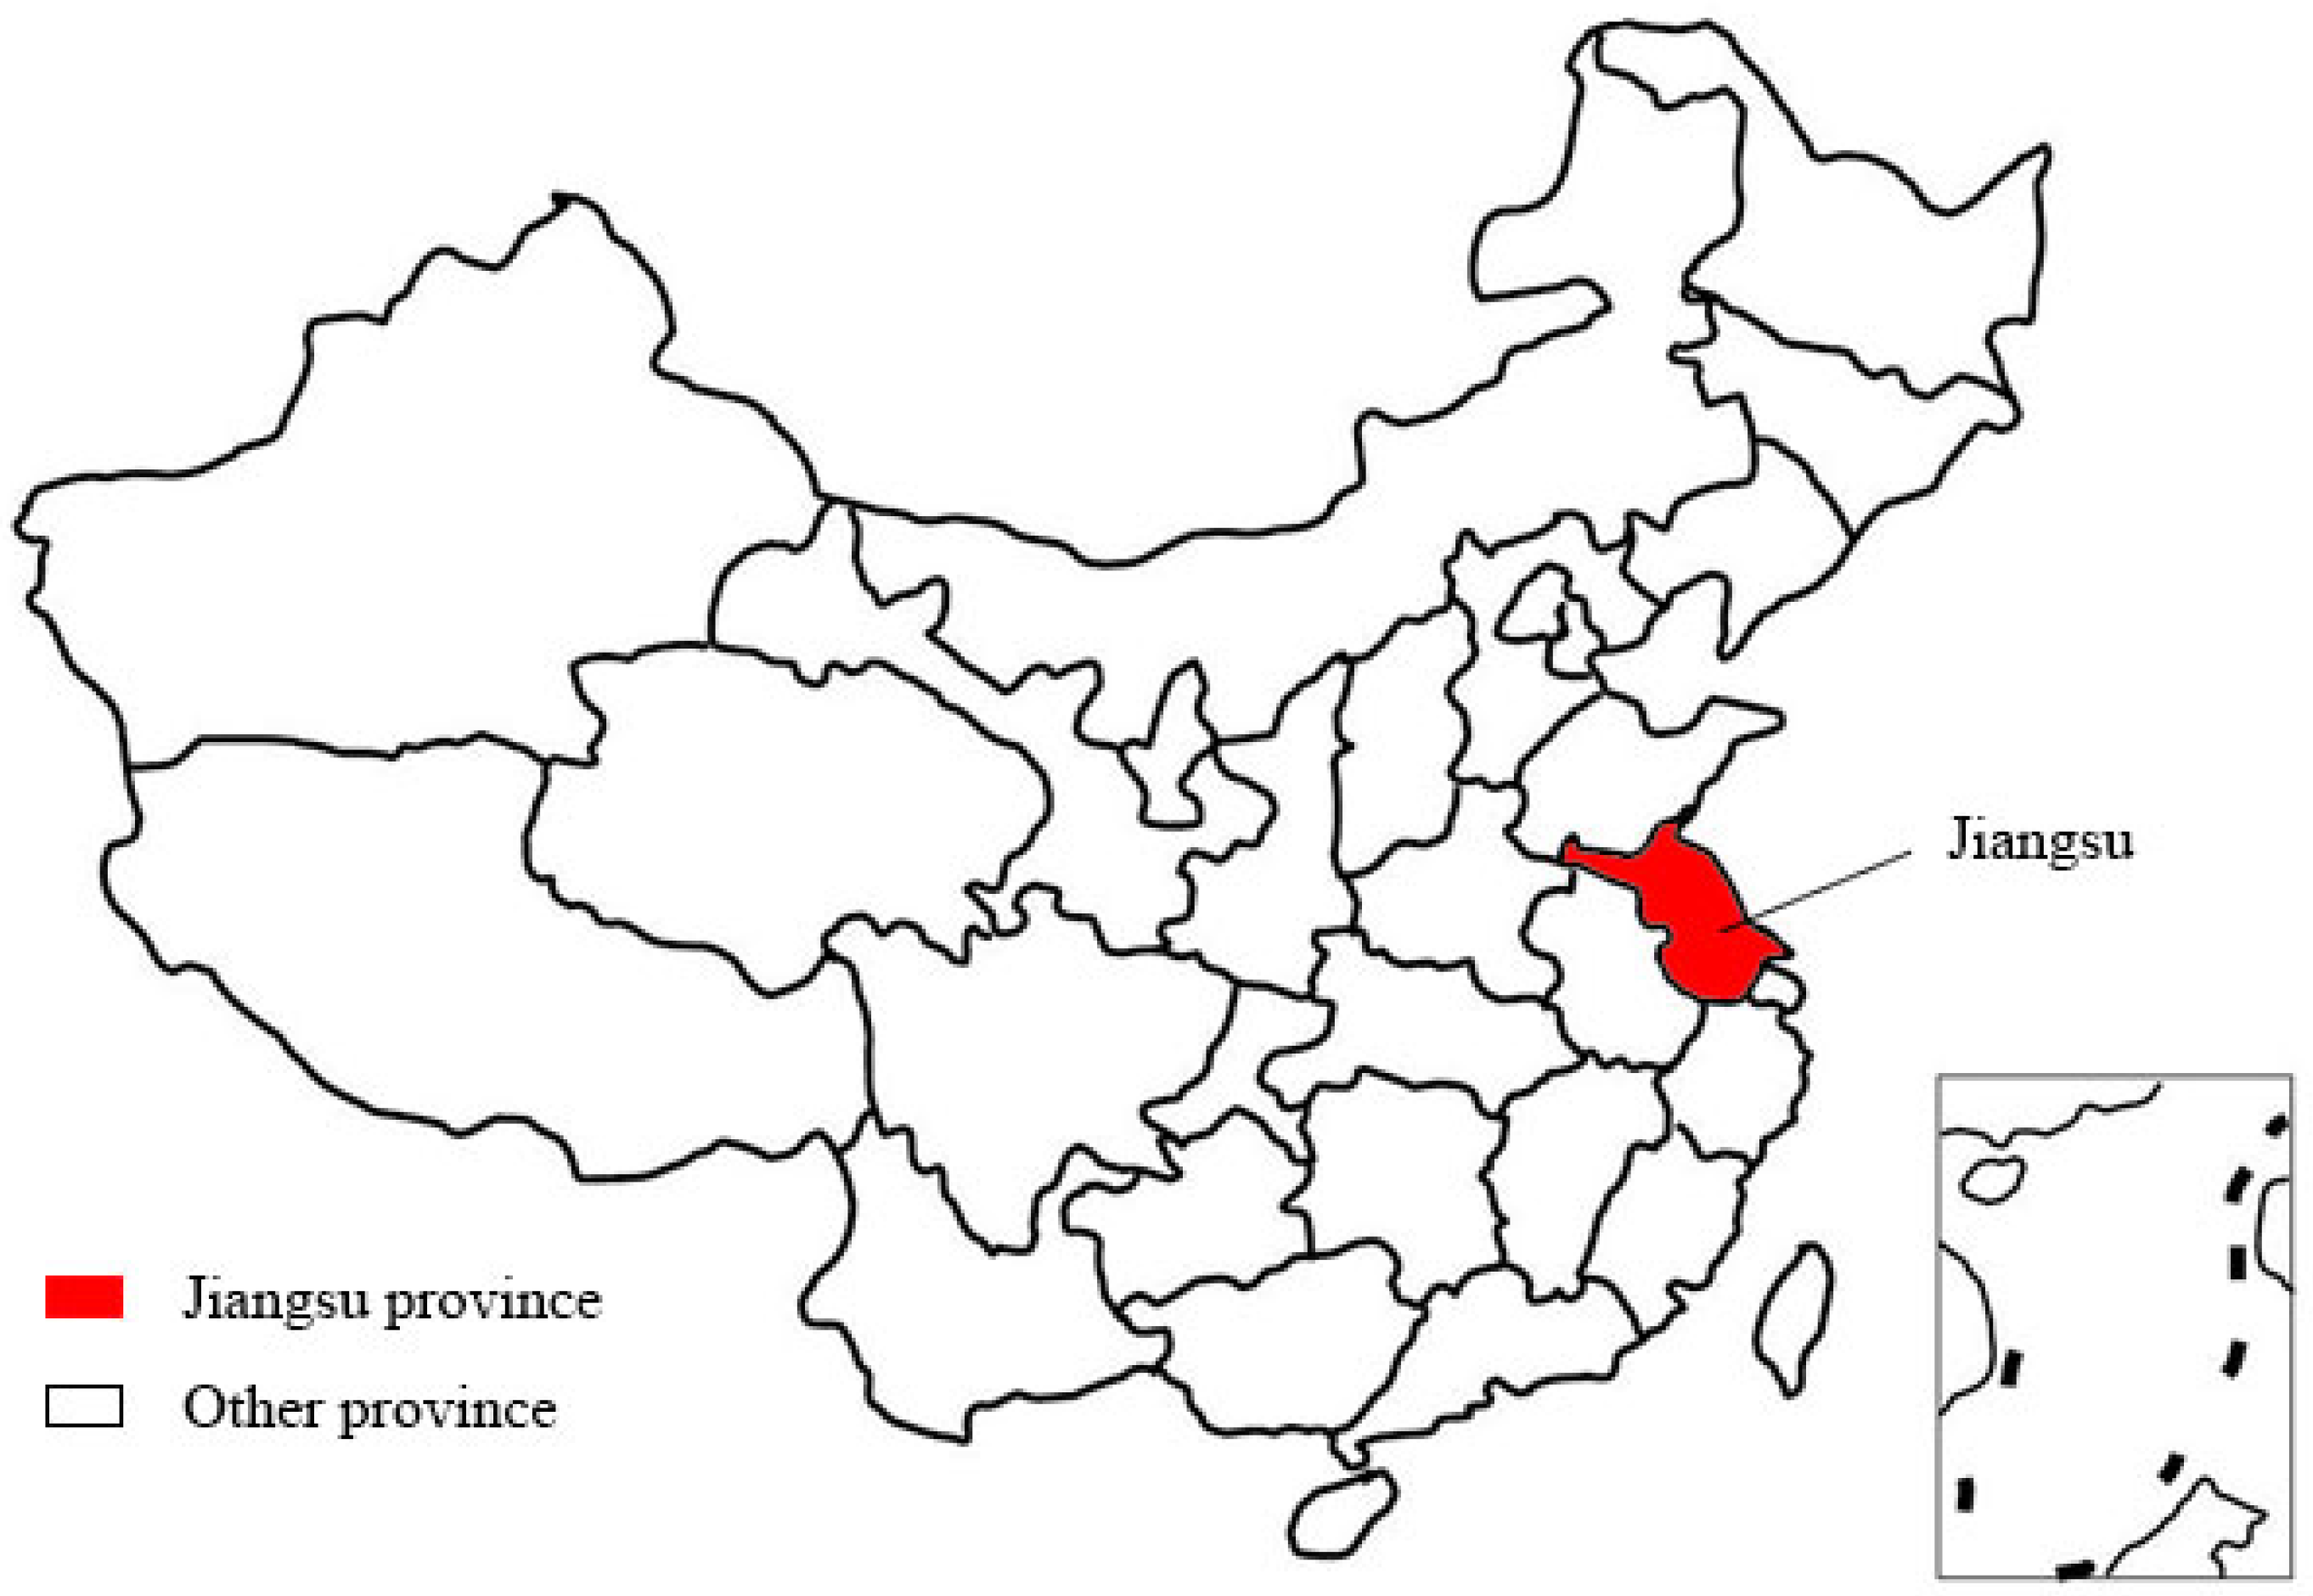
The data in this paper were obtained from the CLES 2021 of “CLES” released by Jin Shanbao Institute for Agriculture & Rural Development, Nanjing Agricultural University. CLES 2021 employed the probability proportional to size (PPS) sampling method, whose scope covered 12 cities, 24 counties, and 48 administrative villages in Jiangsu Province (see Figure A1 in Appendix A). There are five questions in the “section of financial literacy” in the questionnaire. This paper excluded individuals aged below 18 and above 80, with per capita disposable income less than CNY 100, and without key variables. Finally, a total of 1768 samples were included, of which all are households in rural Jiangsu.
2.1.1. Dependent Variable: The Income of Rural Farm Households (lnY)
By referring to the research methods of Liu [34] and Lu and Hong [35], the income level of rural households was measured by their per capita total income from the perspective of the interpretation of statistical indicators. According to the income source, rural households’ income was further divided into agricultural production and operation, wage, property, and transfer income (lnAGCI, lnOPET, lnPRTY, and lnTRSF, respectively). Among them, agricultural production and operation income includes the income obtained from planting, animal husbandry, fishery, forestry and sideline operations, and the total income obtained by rural households through trading agricultural products. Wage income, namely labor remuneration income, is the income farmers obtain by working for units and individuals and selling their labor. Property income is the income generated by capital, technology, management, and other factors, as well as social production and life activities. That is, it is the income obtained from movable (such as bank deposits and negotiable securities) and unmovable property (such as houses, vehicles, and collectables) owned by families. Transfer income refers to a variety of transfer payments from the country, units, and social groups and income transfer between families, mainly including government subsidies, social donations, retirement pensions, donations from relatives and friends, etc.
2.1.2. Explanatory Variable: The Financial Literacy of Rural Farm Households
Klapper et al. [24] defined financial literacy as “the ability to process economic information and make informed decisions on financial planning, wealth accumulation, debts and pensions”. Jappelli and Padula [36] considered financial literacy as a production form of human capital that generates costs and benefits throughout a person’s life. The Organization for Economic Co-operation and Development (OECD) defines financial literacy to be the combination of awareness, knowledge, skills, attitudes, and behavior needed to make reasonable financial decisions and ultimately achieve personal financial well-being, mainly including financial knowledge, attitudes, and behaviors [37]. In this article, financial literacy refers to the ability of individuals to understand terms and issues related to finance. The 2021 CLES included five questions on financial literacy. These questions are related to interest rates, inflation, risk identification, risk diversification, and financial information concerns. We first decided to use the financial literacy score (i.e., 0 to 5), which equals the number of questions correctly answered. Thus, if the respondent gets one question correct, he/she is given 1 and 5 if the respondent gets all five questions correct. However, one deficiency regarding this measure is that answering incorrectly may reveal information on the extent of financial literacy differently from answering “I do not know”. Therefore, we ignored the first measurement and constructed a financial literacy index (using factor scores) as a new measurement for our study to consider such differences, following Xu [10]. As to the first four questions, we thus construct two binary variables generated based on “whether answering the question correctly or not” or “whether understanding the question or not”. The fifth question is also set as a dummy variable. Referring to Zhang et al. [28], the answers with “very concerned”, “quite concerned”, and “concerned” are valued with “1”, while “seldom concerned” and “never concerned” are valued with “0”. As a result, we have nine variables on the five questions. The index is generated through iterated principal component analysis on these nine variables, which takes full advantage of all information in these five questions.
2.1.3. Control Variables
By using the practice of Wu et al. [38] as a reference, three types of micro variables at the household level were selected as control variables: (1) information of householders. The respondents were taken as householders. The information of householders included householder’s age, health status on a scale of 1 to 5 ranging from incapable to excellent, education level expressed by the number of years in school, and marital status. (2) Occupational information: business owner or not and party member or not. (3) Family information: family life satisfaction and the number of household laborers. Meanwhile, the factors affecting the planting decisions of rural households vary from village to village. The influence of different villages among rural households was also controlled in this paper.
To avoid the interference of outliers with the regression results, the per capita income of rural households and agricultural operating, wage, property, and transfer income were processed logarithmically. The specific definitions and descriptive statistical results of the above variables are shown in Table 1.
2.2. Model Building
First, the influence factor model of the income of rural households was constructed:
In Equation (1), explained variable represents the logarithmic value of the per capita income of rural household ; core explanatory variable stands for the financial literacy of rural households themselves (“financial literacy” for short); denotes a set of control variables affecting the planting decisions of rural households, including the personal characteristics of householders, the family endowment of rural households, etc. In the meantime, the factors affecting the planting decisions of rural households are different among different villages. The influence of different villages among rural households was also controlled in this article. refers to the disturbance term of rural households, controlling other unobservable factors affecting the planting decisions of rural households. , , and are model parameters to be estimated.
In addition, the per capita income structure of rural households was classified into agricultural operating, property, transfer, and wage income according to the above discussion. Thus, the influence factor model of four kinds of income of rural households was constructed based on Equations (2)–(5), where explained variables represent the logarithmic values of the per capita agricultural operating income, property income, transfer income, and wage income of the rural household , respectively.
The commonly used estimation method of parameters in Equations (1) to (5) is the ordinary least squares (OLS) of cross-section data, so we adopted it. However, the above analysis may be subject to the interference of endogeneity. First, some control variables are difficult to observe, leading to omission errors. Second, there may be some deviation in the measurement of financial literacy itself, and the respondents’ answers to questions related to financial literacy may be inaccurate, leading to an overestimation of financial knowledge and, thus, underestimating the impact of financial literacy [39,40]. To deal with the bias of financial knowledge on the estimation results, we selected 2SLS [15,23,24]. To solve the endogeneity problem, the method of Song [41] was referenced, and the average financial literacy of other rural households in the same village as the respondents was taken as the instrumental variable of financial literacy. This was based on the following considerations: on the one hand, rural households in the same village can improve their financial literacy through daily learning from other rural households. Therefore, the instrumental variable was positively correlated with the financial literacy of a certain rural household. On the other hand, the average financial literacy of other rural households was not directly related to the planting behavior of individual rural households, meeting correlation conditions.
3. Results and Discussion
3.1. Descriptive Statistics
The study’s descriptive analysis can be seen in Table 1 and Table 2. Table 1 shows that the sample means of the respondents’ age and years of education are approximately 63 and 7 years, respectively. The percentages of the respondents who are male, married, business owners, and members of China’s Communist Party are 92%, 89%, 11%, and 16%, respectively. The average number of household laborers is 2.4. The average incomes from the sample group are the total per capita income of rural households (CNY 9.928), operating income (CNY 4.550), wage income (CNY 1.838), property income (CNY 7.012), and transfer income (CNY 7.525). The average financial literacy index is 0.005.
Table 2 shows the descriptive statistics of answers to questions about financial literacy. It is shown that most respondents lack attention to financial information and construction of financial literacy. The first question measures the capacity to perform a calculation related to interest rates. The second question measures understanding of inflation. The third question is a joint test of knowledge about “stocks” and “stock mutual funds” and of risk diversification because the answer to these questions relies on knowing what a stock is and that a mutual fund is composed of many stocks. The results show that many farmers lacked basic financial knowledge and computing ability, and their financial awareness and ability were weak. The fourth question measures risk diversification. A quarter of respondents realized that diversification can reduce agricultural planting risks. Agricultural experience and life experience played a significant role. The fifth question measures the concerns of financial information. Only a small portion of respondents paid more attention to economic and financial information, indicating that most farmers are not concerned much about the national economy and financial information and may ignore some preferential economic policies issued by the government.
By drawing on the practice of van Rooij et al. [22] and Yin et al. [44], the factor analysis method was adopted to construct the indicators of financial literacy (Table 3). It was considered that individuals offering false and unclear answers exhibited totally different levels of financial literacy, consistent with Lusardi [45] and van Rooij [22]. As a result, the two dummy variables of “whether the question is answered correctly” and “whether the question can be answered” were constructed for each of the first four questions. The last question was also set as a dummy variable. Rural households giving the answers of “very concerned”, “quite concerned”, and “concerned” were assigned with a value of 1, and the rest were assigned with a value of 0. Iterative principal component and factor analyses were carried out based on five questions and nine variables. The factor analysis result shows that the Kaiser–Meyer–Olkin (KMO) result is 0.7056, which is greater than 0.5. This suggests that the sample is suitable for factor analysis.
3.2. Empirical Results
3.2.1. Empirical Impact of Financial Literacy on the Per Capita Income of Rural Households
The regression results of Equation (1) are reported in Table 4. Model 1 is OLS and Model 2 is two-stage least squares (2SLS). Both are suitable for analysis from the perspective of the goodness of model fit. It can be seen from Model 1 that financial literacy was significantly and positively correlated with the per capita income of rural households at the level of 1%, indicating that the higher the financial literacy of rural farm households was, the higher their per capita income would be. Financial literacy has both direct and indirect relations with household income. It directly improves household income by empowering householders to analyze investment decisions to create wealth [30,32,46]. A higher acquisition of financial knowledge to improve financial literacy indirectly enables individuals to enhance their financial decisions to achieve higher income through financial market participation [22,39,47]. Financial market instruments, such as bank account ownership, access to credit, insurance, bonds, stock, and many others, which boost household income, are mainly patronized by financially literate people [39]. Beyond that, householders’ health status and education level, life satisfaction, and the number of household laborers were significantly and positively associated with the per capita income of rural households. The estimation results of two stages using the instrumental variable are reported in Model 2.
The Durbin–Wu–Hausman (DWH) endogeneity test results show that the model rejected the null hypothesis of exogeneity in financial literacy at the level of 1%, thus indicating the existence of endogeneity in Equation (1). The underidentification test on the instrumental variable significantly rejected the null hypothesis, and the result of the weak identification test on the instrumental variable is greater than 10. This suggests that the instrumental variable was valid and not inferior. In addition, the results of Model 2 show that the regression coefficient of financial literacy is 1.312 and significant at the 1% level. This means that financial literacy still had a significant positive impact on the per capita income of rural households after the endogeneity problem was considered, which was consistent with the conclusion of Model 1. This suggests that financial literacy was conducive to improving rural households’ per capita income, and the significance of each control variable was in line with Model 1.
3.2.2. Empirical Impact of Financial Literacy on the Income Structure of Rural Households
The impact of financial literacy on the income structure of different rural households is reported in Table 5. Models 1 to 4, respectively, measured the impact of financial literacy on agricultural operating, property, transfer, and wage income. The empirical results show that financial literacy had a positive and significant impact on property income at the 1% level, transfer, and wage income at the 5% level, as well as a negative yet insignificant impact on agricultural operating income. The results from Models 1 to 4 show that one unit increase in financial literacy may lead to an increase in the per capita property, transfer, and wage income of rural households, all other conditions being equal. This suggests that the increase in property income was most obviously promoted by financial literacy, followed by that of wage and then transfer income. Our findings are similar to the research conclusion of Nie et al. [25], who found that financial literacy played a significant role in promoting residents’ property income acquisition and scale improvement. Rural households with financial literacy are usually equipped with strong abilities in information collection, able to calculate the costs and benefits of agricultural production, and are more likely to participate in the financial market. Thus, they can plan their property and make profits to raise property income. However, probably due to differences in measurement methods, regions, and time, the findings of Tao et al. [27] and our group are not entirely consistent. Tao et al. [27] found that financial literacy has a positive association with total family income, wage income, and property income and a negative effect association with family transfer income. In contrast, we selected data from different regions and performed 2SLS analysis (see Table 5), showing that financial literacy positively links rural households’ transfer income. Rural households can identify and take advantage of favorable policies and subsidies to increase their transfer income. Tao’s study focused on both urban and rural residents’ household income, whereas ours focused on the rural area.
3.2.3. Heterogeneity Test
To verify the differential impact of financial literacy on rural households with different income levels, samples were separated into low- and high-income groups according to the per capita income ranking for the heterogeneity test. The sample data in the top and bottom 50% of per capita income were classified as high- and low-income groups, respectively. The results of the heterogeneity test by income level are shown in Table 6. The heterogeneity test results of the core explanatory variable show that financial literacy associations with high- and low-income groups are different. In terms of total income, the financial literacy of the high-income group had a positive yet insignificant relationship with per capita income, and the coefficient of the financial literacy of the low-income group is 0.466 and significant at the 5% level. This shows that financial literacy is positively related to the income level of high-income rural households. From the perspective of its influence on the income structure of different income groups, financial literacy more significantly promoted the increase in property, wage, and transfer income, which was aligned with the total income of rural households. Moreover, financial literacy positively associated with the property and transfer income of high- and low-income groups and had an even more significant positive relation with their property income. The existing literature shows that improving farmers’ financial literacy can affect rural households’ income. For example, Zhang et al. [48] found that farmers’ financial literacy has a positive relationship with income by improving their attitudes toward financial market participation. He et al. [49] showed that farmers’ financial literacy varied greatly with different genders, ages, income levels, and regions. Moreover, financial literacy has a significant positive relationship with farmers’ credit, financial, and insurance behavior. However, few scholars have examined how financial literacy related to rural households’ income structure, and even fewer discussions on income level. From the angle of agricultural production and operation income, the test results show that financial literacy had a significantly negative relation with the agricultural production and operation income of the low-income group and a negative yet insignificant relation with that of the high-income group. This may be due to the threshold effect of the function of the various factors of financial literacy. Low-income rural households are limited by their reading, mathematical, and understanding literacy and other issues. Therefore, the improvement in the financial literacy of low-income rural households is faced with obstacles. In this way, this study fills the previous gap and adds to the literature on financial literacy–welfare development relationship in rural areas.
3.2.4. Robustness Test
To test the robustness of the above main estimation results, the score totaling method was employed to remeasure the indicators of financial literacy. That is to say, scores were calculated by the number of correct or false answers given by households to the aforesaid five questions, with one point for each correct answer. In the fifth question, rural households answering “very concerned”, “quite concerned”, and “concerned” were considered to have financial information acuity and given one point, while those answering “seldom concerned” and “never concerned” were considered to have no financial information acuity and given “0”. The regression results of the number of correct answers to the questions about financial literacy for each dependent variable are displayed in Table 7, which were in agreement with the above estimation results. That is, the financial literacy represented by score totaling is positively related to the per capita, property, and transfer income of rural households and wage income and negatively yet insignificantly related to agricultural operating income.
4. Conclusions and Policy Suggestions and Limitations
Financial literacy is of great likeness to increasing rural residents’ income and developing the rural economy. In this paper, empirical studies were carried out to obtain the following findings: firstly, the higher the financial literacy of rural households, the more likely they would increase their income. The increase in the property income of rural households was most likely promoted by financial literacy, followed by wage and then transfer income. Secondly, financial literacy had a significant relationship with the income of rural households with higher income levels. Thirdly, financial literacy had a different relationship with the income structure of different income groups, a significant positive relationship with the property, wage, and transfer income of both groups, and the most significant relationship with their property income. Fourthly, our results show that financial literacy had a different relationship with the agricultural production and operation income of the low-income group and that of the high-income group.
The research results of this paper have some implications for policymakers. First of all, financial literacy is an essential human capital. It can be seen from the research results that the improvement of financial literacy is beneficial to increasing the income of farmers and ameliorating their welfare level, and rural residents are in most need of more financial literacy education. On this account, the government should co-operate with county-seated financial institutions to provide farmers with regular financial literacy education. According to educational functions and subjects receiving education, differentiated and adaptive financial education can be carried out on public platforms, such as Rural Primary and Secondary School Campus Education, Vocational and Technical Training Education for Farmers, WeChat, and Micro-video. Meanwhile, a lifelong financial literacy education system focusing on financial knowledge and supplemented by risk education can be established. Second, financial literacy has significantly different effects on rural households with different income levels. As a result, financial institutions should classify rural households with different income levels, target their characteristics in social production and agricultural operation activities, and fully grasp structural factors and functional differentiation in financial literacy education. Moreover, financial institutions should carry out differentiated financial education and financial product supply, construct a better educational ecosystem, and advance the quality and balanced development of financial literacy education in a three-dimensional manner. Finally, it is necessary to strengthen financial supervision in rural areas, popularize the knowledge of financial risks, laws, and regulations to rural households, and ensure the safe operation of the rural financial system. Only in this way can financial literacy be effectively turned into the “gas station” on the way to the income increase of rural households.
The study has some limitations. First, we restricted the study to farmers, but non-farmers are also dwellers in China’s rural areas. Thus, researchers are encouraged to examine this kind of study from non-farmers’ perspectives and see if their conclusion will confirm our study. Second, this study examined the effect of financial literacy on farm household income (an indicator of welfare). However, welfare indicators/components can take various forms, such as consumption, food expenditure, and asset ownership. Future works can focus on the relationship between financial literacy and the suggested segment of welfare indicators. Third, due to data limitations, the questions used to measure financial literacy only included the knowledge acquisition part. We encourage future studies to use more questions that cover financial knowledge, skills, and many others for financial literacy measurement if data are available. Finally, it will be interesting for future works to broadly examine the quantitative heterogeneous relationship between financial literacy and the income structure of rural farm households based on different categories of socioeconomic and demographic factors of the farmers.
Author Contributions
Conceptualization, H.X. and M.A.T.; methodology, H.X. and Y.L.; software, M.A.T. and K.S.; validation, H.X. and M.A.T.; formal analysis, H.X.; investigation, Y.L.; resources, M.A.T.; data curation, Y.L.; writing—original draft preparation, H.X.; writing—review and editing, H.X. and M.A.T.; visualization, H.X.; supervision, M.A.T.; project administration, H.X.; funding acquisition, H.X. All authors have read and agreed to the published version of the manuscript.
Funding
This research was funded by Rural Development Research Center of Sichuan Province (Grant number CR1308). Martinson Ankrah Twumasi is also grateful to the National Social Science Fund of China (Grant No 20AJY011).
Institutional Review Board Statement
Not applicable.
Informed Consent Statement
Not applicable.
Data Availability Statement
The data presented in this study are available within the article. The data can be accessed publicly. Data access link: https://economy.njau.edu.cn/ (accessed on 6 June 2022).
Acknowledgments
We gratefully acknowledge financial support from the Rural Development Research Center of Sichuan Province (Grant No. CR1308) and Sichuan Agricultural University.
Conflicts of Interest
The authors declare no conflict of interest.
Appendix A
Figure A1.
The map of study area.

References
- China National Bureau of Statistics. Communiqué of the Seventh National Population Census; China National Bureau of Statistics: Beijing, China, 2021.
- People’s Bank of China. Survey and Analysis Report on Consumer Financial Literacy; People’s Bank of China: Beijing, China, 2021.
- Siaw, A.; Jiang, Y.; Twumasi, M.A.; Agbenyo, W. The Impact of Internet Use on Income: The Case of Rural Ghana. Sustainability 2020, 12, 3255. [Google Scholar] [CrossRef] [Green Version]
- Twumasi, M.A.; Zheng, H.; Asiedu-Ayeh, L.O.; Siaw, A.; Jiang, Y. Access to Financial Services and Its Impact on Household Income: Evidence from Rural Ghana. Eur. J. Dev. Res. 2022, 1–22. [Google Scholar] [CrossRef]
- Ma, W.; Renwick, A.; Nie, P.; Tang, J.; Cai, R. Off-Farm Work, Smartphone Use and Household Income: Evidence from Rural China. China Econ. Rev. 2018, 52, 80–94. [Google Scholar] [CrossRef]
- Huston, S.J. Measuring Financial Literacy. J. Consum. Aff. 2010, 44, 296–316. [Google Scholar] [CrossRef]
- President’s Advisory Committee on Financial Literacy. Annual Report to the President: Executive Summary; President’s Advisory Committee on Financial Literacy: Washington, DC, USA, 2008. [Google Scholar]
- Demirgüç-Kunt, A.; Klapper, L.; Singer, D.; Ansar, S.; Hess, J. The Global Findex Database 2017: Measuring Financial Inclusion and Opportunities to Expand Access to and Use of Financial Services. World Bank Econ. Rev. 2020, 34, S2–S8. [Google Scholar] [CrossRef]
- Koomson, I.; Villano, R.A.; Hadley, D. Intensifying Financial Inclusion through the Provision of Financial Literacy Training: A Gendered Perspective. Appl. Econ. 2020, 52, 375–387. [Google Scholar] [CrossRef]
- Xu, N.; Shi, J.; Rong, Z.; Yuan, Y. Financial Literacy and Formal Credit Accessibility: Evidence from Informal Businesses in China. Financ. Res. Lett. 2019, 36, 101327. [Google Scholar] [CrossRef]
- Dollar, D.; Kraay, A. Growth Is Good for the Poor. J. Econ. Growth 2002, 7, 195–225. [Google Scholar] [CrossRef]
- Zhang, J.; Hua, J.; Tang, H.; Wu, Y. Economic Policy Uncertainty and Price Fluctuation of Agricultural Products. J. Agrotech. Econ. 2019, 5, 110–122. [Google Scholar] [CrossRef]
- Zhang, J.; Guo, P. Impacts of China’s Rural Financial Development on Internal Income Inequality in Rural Area—Based on VAR Model. J. Agrotech. Econ. 2011, 1, 34–41. [Google Scholar] [CrossRef]
- Hu, X. The Impact of Rural Finance Development on Farmers’ Income Growth in Central China. Res. Rural Financ. 2019, 12, 17–23. [Google Scholar] [CrossRef]
- Gajić, T.; Petrović, M.D.; Radovanović, M.M.; Tretiakova, T.N.; Syromiatnikova, J.A. Possibilities of Turning Passive Rural Areas into Tourist Attractions through Attained Service Quality. Eur. Countrys. 2020, 12, 179–192. [Google Scholar] [CrossRef]
- Ning, G.; Luo, L.; Qi, W. Study on the Contributing Factors of Property Income Inequality. Res. Econ. 2016, 4, 116–128. [Google Scholar]
- Gustafsson, B.; Shi, L. Income Inequality within and across Counties in Rural China 1988 and 1995. J. Dev. Econ. 2002, 69, 179–204. [Google Scholar] [CrossRef]
- Cheng, M.; Shi, Q.; Jin, Y.; Gai, Q. Gaps of Rural Households’ Income and Its Reasons: Model and Empirical Study. Manag. World 2015, 17–28. [Google Scholar] [CrossRef]
- Sun, J.; Yu, S. Physical Capital, Human Capital, Political Capital and Rural Income Inequality: An Empirical Research Based on the 2852 Rural Residents Questionaries from 31 Provinces in China. J. Zhongnan Univ. Econ. Law 2014, 5, 141–149. [Google Scholar]
- Xie, J.-Z.; Wang, W.-T. Social Structure Change Social Capital Transition and Income Inequality in Rural China. China Soft Sci. 2016, 10, 20–36. [Google Scholar]
- Wu, L.; Li, D. The Effects of Financial Capital on Rural Households’Income Under the Background of Precise Poverty Alleviation—From the Perspective of Income Stratification and Regional Differences. J. Agrotech. Econ. 2019, 13, 61–72. [Google Scholar] [CrossRef]
- van Rooij, M.; Lusardi, A.; Alessie, R. Financial Literacy and Stock Market Participation. J. Financ. Econ. 2011, 101, 449–472. [Google Scholar] [CrossRef] [Green Version]
- Stango, V.; Zinman, J. Exponential Growth Bias and Household Finance. J. Finance 2009, 64, 2807–2849. [Google Scholar] [CrossRef]
- Klapper, L.; Lusardi, A.; Panos, G.A. Financial Literacy and Its Consequences: Evidence from Russia during the Financial Crisis. J. Bank. Financ. 2013, 37, 3904–3923. [Google Scholar] [CrossRef]
- Nie, Y.; Hu, Z. Financial Literacy and Households’ Property Income. J. Financ. Econ. 2021, 07, 81–90. [Google Scholar] [CrossRef]
- Wang, Z.; Deng, Y.; Liao, L. Knowledge Changes Fate: Financial Literacy and Micro Income Mobility. J. Financ. Econ. 2016, 12, 111–127. [Google Scholar]
- Tao, W. The Influences of Financial Literacy on Household Income of Urban and Rural Residents: An Empirical Analysis Based OnCFPS Data. Res. Agric. Mod. 2021, 42, 526–536. [Google Scholar] [CrossRef]
- Zhang, H.; Yin, Z. Financial Literacy and Households’ Financial Exclusion in China: Evidence from CHFS Data. J. Financ. Res. 2016, 433, 80–95. [Google Scholar]
- Li, Q.; Zhang, R.; Meng, F. Financial Knowledge and Chinese Urban Resident Property Income. Financ. Econ. Res. 2018, 93–103. [Google Scholar]
- Hu, Z. Financial Literacy and Accumulation of Households Wealth. J. Zhongnan Univ. Econ. Law 2018, 4, 110–117. [Google Scholar] [CrossRef]
- Andoh, F.K.; Nunoo, J.; Darfor, K.N. Sustaining Small and Medium Enterprises through Financial Service Utilization: Does Financial Literacy Matter? J. Bus. Entrep. Dev. 2015, 5, 74–94. [Google Scholar] [CrossRef]
- Agyei, S.K. Culture, Financial Literacy, and SME Performance in Ghana. Cogent Econ. Financ. 2018, 6, 1463813. [Google Scholar] [CrossRef] [Green Version]
- Oseifuah, E.K. Financial Literacy and Youth Entrepreneurship in South Africa. Afr. J. Econ. Manag. Stud. 2010, 1, 164–182. [Google Scholar] [CrossRef]
- Wei, L. Research on “Non-Property Income” Attribute of Housing Rentals and Classification of Resident Income. Res. Stat. 2011, 6, 22–27. [Google Scholar] [CrossRef]
- Lu, C.; Hong, Y. An Analysis of Rural Financial Development and Farmer’s Income Structure in Jiangsu. Commmercial Res. 2013, 6, 181–187. [Google Scholar] [CrossRef]
- Jappelli, T.; Padula, M. Investment in Financial Literacy, Social Security, and Portfolio Choice. J. Pension Econ. Financ. 2015, 14, 369–411. [Google Scholar] [CrossRef] [Green Version]
- OECD. International Survey of Adult Financial Literacy Competencies; OECD: Paris, France, 2016; pp. 1–100. [Google Scholar]
- Wu, K.; Wang, S.; Li, H. How Does Financial Literacy Affect Household Consumption? Financ. Trade Res. 2022, 1, 44–56. [Google Scholar] [CrossRef]
- Ankrah Twumasi, M.; Jiang, Y.; Wang, P.; Ding, Z.; Frempong, L.N.; Acheampong, M.O. Does Financial Literacy Inevitably Lead to Access to Finance Services? Evidence from Rural Ghana. Ciênc. Rural 2022, 52, 1–16. [Google Scholar] [CrossRef]
- Ankrah, M.; Asante, D.; Fosu, P.; Essilfie, G.; Jiang, Y. Residential Renewable Energy Adoption. Does Financial Literacy Matter ? J. Clean. Prod. 2022, 361, 132210. [Google Scholar] [CrossRef]
- Song, Q.; Wu, Y.; Yin, Z. Financial Literacy and Household Borrowing Behavior. J. Financ. Res. 2017, 444, 95–110. [Google Scholar]
- Lusardi, A.; Mitchelli, O.S. Financial Literacy and Retirement Preparedness: Evidence and Implications for Financial Education. Bus. Econ. 2007, 42, 35–44. [Google Scholar] [CrossRef] [Green Version]
- Nanjing Agricultural University. China Land Economic Survey; Nanjing Agricultural University: Nanjing, China, 2021. [Google Scholar]
- Yin, Z.; Song, Q.; Wu, Y. Financial Literacy, Trading Experience and Households Portfolio Choice. Econ. Res. J. 2014, 4, 62–75. [Google Scholar]
- Lusardi, A.; Mitchell, O.S. The Economic Importance of Financial Literacy: Theory and Evidence. J. Econ. Lit. 2014, 52, 5–44. [Google Scholar] [CrossRef] [PubMed] [Green Version]
- Twumasi, M.A.; Jiang, Y.; Ding, Z.; Wang, P.; Abgenyo, W. The Mediating Role of Access to Financial Services in the Effect of Financial Literacy on Household Income: The Case of Rural Ghana. SAGE Open 2022, 12, 1–13. [Google Scholar] [CrossRef]
- Fong, J.H.; Koh, B.S.K.; Mitchell, O.S.; Rohwedder, S. Financial Literacy and Financial Decision-Making at Older Ages. Pacifi-Basin Financ. J. 2021, 65, 101481. [Google Scholar] [CrossRef]
- Zhang, H.; Xiong, X. The Effect Channel and Empirical Test of Rural Residents’ Financial Literacy on Financial Decision-Making—Based on the Survey Data in Shandong Province. J. Huazhong Agric. Univ. Sci. Ed. 2018, 6, 75–85. Available online: https://webvpn.sicau.edu.cn/https/77726476706e69737468656265737421fbf952d2243e635930068cb8/kcms2/article/abstract?v=3uoqIhG8C44YLTlOAiTRKibYlV5Vjs7i0-kJR0HYBJ80QN9L51zrP6mClzo0bk2oW5MlFm5RCutNGq8QAeCqxsnKwND6j_EX&uniplatform=NZKPT (accessed on 6 June 2022).
- He, X.; Kong, R. Financial Literacy, Financial Behavior and Farmer’s Income: Based on Survey Data of Farmers in Shaanxi Province. J. Beijing Technol. Bus. Univ. Soc. Sci. 2019, 34, 1–11. Available online: https://d.wanfangdata.com.cn/periodical/bjgsdxxb-sh201902001 (accessed on 6 June 2022).

Table 1.
Descriptive statistics of variables.
| Types of Variable | Name of Variable | Symbol of Variable | Variable Description and Assignment | Mean | Standard Deviation |
|---|---|---|---|---|---|
| Dependent Variable | Total per capita income of rural households | LnY | Logarithmic value of the sum of the per capita operating, wage, property, and transfer income of rural farm households in 2020 | 9.928 | 1.201 |
| Operating Income | LnAGCI | Logarithmic value of the per capita agricultural operating income of rural farm households in 2020 | 4.550 | 4.276 | |
| Wage Income | LnOPET | Logarithmic value of the per capita wage income of rural farm households in 2020 | 1.838 | 3.075 | |
| Property Income | LnPRTY | Logarithmic value of the per capita property income of rural farm households in 2020 | 7.012 | 2.301 | |
| Transfer Income | LnTRSF | Logarithmic value of the per capita transfer income of rural farm households in 2020 | 7.525 | 4.188 | |
| Core Explanatory Variable | Financial literacy | LIT | Factor analysis | 0.005 | 0.589 |
| Control Variables | Age | AGE | Householder’s age (years old) | 62.772 | 9.914 |
| Gender | GEN | Householder’s gender (1 = male, 0 = female) | 0.923 | 0.267 | |
| Health | HEAL | Householder’s health status (1–5 ranging from unhealthy to very healthy) | 4.031 | 1.085 | |
| Education | EDU | Householder’s years of schooling (years) | 7.403 | 3.612 | |
| Marriage | MARR | Householder’s marital status (1 = married, 0 = unmarried) | 0.886 | 0.318 | |
| Business owner or not | BUSI | Whether a family member starts a business (1 = Yes, 0 = No) | 0.109 | 0.312 | |
| Member of Chinese Communist Party | MEM | Whether a family member is a party member (1 = Yes, 0 = No) | 0.160 | 0.367 | |
| Satisfaction | SAT | Family life satisfaction (1–10 ranging from very dissatisfied to very satisfied) | 7.933 | 1.600 | |
| Laborers | LS | Number of household laborers | 2.473 | 1.441 |
Table 2.
Descriptive statistics of answers to questions about financial literacy.
| Question | Correct | False | DK | ||
|---|---|---|---|---|---|
| Suppose you have 100 yuan and the annual interest rate of banks is 4%. What is the total amount of the five-year principal and interest? | 349 1 19.740% 2 | 53 2.998% | 1366 77.262% | ||
| Suppose you have 100 yuan, the annual interest rate of banks is 5% and the annual inflation rate is 3%. What is the value of products bought now compared with that bought by 100 yuan deposited in a bank for one year? | 85 4.808% | 206 11.652% | 1477 83.540% | ||
| Do you think buying a single stock is riskier than buying a stock fund? | 156 8.824% | 40 2.262% | 1572 88.914% | ||
| Do you think that growing (managing) many crops is generally less risky than growing (managing) one? | 702 39.706% | 304 17.195% | 762 43.099% | ||
| How much are you concerned about economic and financial information? | VC | MC | C | SC | NC |
| 18 (1.02%) | 60 (3.4%) | 131 (7.4%) | 389 (22.0%) | 1170 (66.18%) | |
Source: Lusardi and Mitchell [42] and CLES [43]. Note: DK = respondent indicated “don’t know”. VC = respondent indicated “very concerned”. MC = respondent indicated “much concerned”. C = respondent indicated “concerned”. SC = respondent indicated “seldom concerned”. NC = respondent indicated “never concerned”. 1 The number of people giving corresponding answers. 2 The proportion of people in the total number of people.
Table 3.
Factor analysis KMO.
| Variable | KMO Test Result |
|---|---|
| The question about interest rates can be answered | 0.6803 |
| The question about interest rates is answered correctly | 0.6784 |
| The question about inflation can be answered | 0.8600 |
| The question about inflation is answered correctly | 0.8482 |
| The question about stock funds can be answered | 0.6655 |
| The question about stock funds is answered correctly | 0.6443 |
| The question about investment portfolios can be answered | 0.6412 |
| The question about investment portfolios is answered correctly | 0.6108 |
| Degree of concern about financial information | 0.9684 |
| Total | 0.7056 |
Table 4.
Impact of financial literacy on the per capita income of rural households.
| Variables | Model 1 (OLS) | Model 2 (2SLS) |
|---|---|---|
| LnY | ||
| Financial literacy | 0.238 *** (4.87) | 1.312 *** (3.59) |
| Age | −0.002 (−0.70) | 0.005 (1.07) |
| Gender | −0.041 (−0.37) | 0.016 (0.13) |
| Health | 0.134 *** (4.23) | 0.099 *** (3.03) |
| Education | 0.035 *** (4.00) | 0.000 (0.02) |
| Marriage | −0.080 (−0.76) | −0.099 (−0.89) |
| Business owner or not | 0.948 *** (8.90) | 0.744 *** (5.49) |
| Member of Chinese Communist Party | 0.128 * (1.79) | −0.114 (−0.92) |
| Satisfaction | 0.041 *** (2.95) | 0.034 ** (2.06) |
| Laborers | 0.113 *** (5.41) | 0.126 *** (5.59) |
| Village dummy variable | Controlled | Controlled |
| _cons | 8.656 *** (27.08) | 8.623 *** (25.17) |
| Observation | 1768 | 1768 |
| R2 | 0.200 | −0.041 |
| Prob > F | 0.000 | 0.000 |
| Underidentification test | 12.303 *** | |
| Weak identification test | 103.827 *** | |
Note: standard errors are reported in parentheses; *** p < 0.01, ** p < 0.05, * p < 0.1. The values in brackets in the table are t values.
Table 5.
Impact of financial literacy on income structure.
| Variables | Model1 | Model2 | Model3 | Model4 |
|---|---|---|---|---|
| LnAGCI | LnPRTY | LnTRSF | LnOPET | |
| Financial Literacy | −2.783 (−1.14) | 3.983 *** (3.88) | 1.473 ** (2.46) | 1.975 ** (1.96) |
| Control variable | Controlled | Controlled | Controlled | Controlled |
| Constant | 7.075 *** (4.69) | −1.937 * (−1.89) | 3.307 *** (4.93) | 2.183 ** (2.37) |
| Observation | 1768 | 1768 | 1768 | 1768 |
| R2 | −0.035 | −0.245 | 0.037 | 0.216 |
| Prob > F | 0.000 | 0.000 | 0.000 | 0.000 |
| Underidentification test | 12.302 *** | 12.302 *** | 12.302 *** | 12.302 *** |
| Weak identification test | 103.872 *** | 103.872 *** | 103.872 *** | 103.872 *** |
Note: standard errors are reported in parentheses; *** p < 0.01, ** p < 0.05, * p < 0.1. The values in brackets in the table are t values.
Table 6.
Heterogeneity test by income level.
| LnY | LnAGCI | LnPRTY | LnTRSF | LnOPET | ||||||
|---|---|---|---|---|---|---|---|---|---|---|
| Variables | Low-Income Group | High-Income Group | Low-Income Group | High-Income Group | Low-Income Group | High-Income Group | Low-Income Group | High-Income Group | Low-Income Group | High-Income Group |
| Financial literacy | 0.138 (0.43) | 0.466 ** (2.11) | −6.035 ** (−2.00) | −1.264 (−0.41) | 4.505 *** (3.47) | 2.415 * (1.92) | 0.244 (0.40) | 1.643 * (1.90) | 1.064 (0.66) | 0.619 (0.64) |
| Age | 0.007 * (1.78) | −0.005 (−1.47) | −0.083 *** (−3.17) | −0.104 *** (−3.62) | 0.038 ** (2.17) | 0.045 *** (2.59) | 0.055 *** (6.02) | 0.079 *** (5.13) | 0.006 (0.40) | 0.019 (1.52) |
| Gender | 0.025 (−0.17) | 0.031 (0.37) | −0.723 (−1.11) | 1.950 *** (2.83) | 0.188 (0.72) | −0.576 (−0.92) | −0.032 (−0.10) | −0.039 (−0.10) | −0.027 (−0.05) | −0.767 ** (−2.16) |
| Health | 0.071 ** (2.16) | 0.035 (1.37) | 0.314 ** (2.03) | 0.068 (0.38) | 0.098 (0.96) | −0.086 (−0.64) | 0.033 (0.48) | −0.132 (−1.64) | 0.141 (1.12) | 0.096 (0.78) |
| Education | 0.024 ** (2.25) | 0.019 * (1.79) | 0.151 ** (2.12) | −0.143 (−1.14) | −0.051 (−1.50) | 0.002 (0.03) | 0.035 (1.58) | −0.029 (−0.66) | −0.017 (−0.32) | 0.016 (0.28) |
| Marriage | 0.014 (0.12) | 0.000 (0.00) | 1.123 ** (2.01) | 0.770 (1.49) | 0.434 (1.41) | 1.011 ** (2.02) | 0.102 (0.43) | 0.178 (0.51) | −0.495 (−0.94) | −0.072 (−0.19) |
| Business owner or not | 0.438 *** (4.70) | 0.542 *** (5.76) | 1.340 (1.45) | 2.042 *** (3.03) | −0.560 (−1.18) | 0.448 (0.92) | −0.164 (−0.42) | 0.220 (0.91) | 0.774 (1.20) | −0.294 (−1.05) |
| Member of Chinese Communist Party | −0.038 (−0.45) | −0.043 (−0.49) | 0.647 (0.89) | −0.132 (−0.17) | −0.239 (−0.54) | 0.407 (1.01) | −0.289 (−1.25) | −0.461 (−1.32) | 0.528 (1.23) | 0.801 *** (3.10) |
| Satisfaction | 0.016 (1.07) | −0.006 (−0.44) | 0.083 (0.82) | 0.112 (0.87) | 0.033 (0.56) | 0.107 (1.20) | 0.007 (0.20) | 0.011 (0.23) | 0.020 (0.23) | 0.010 (0.14) |
| Laborers | 0.071 *** (3.32) | −0.010 (−0.53) | −0.210 (−1.43) | −0.095 (−0.60) | −0.073 (−0.78) | −0.314 *** (−2.91) | −0.426 *** (−9.73) | −0.345 *** (−4.46) | 1.343 *** (13.50) | 0.883 *** (8.13) |
| Village dummy variable | Controlled | Controlled | Controlled | Controlled | Controlled | Controlled | Controlled | Controlled | Controlled | Controlled |
| _cons | 7.905 *** (25.27) | 11.024 *** (38.20) | 5.953 *** (3.16) | 8.839 *** (4.27) | −1.499 (−1.13) | −0.645 (−0.43) | 3.766 *** (5.13) | 3.790 *** (3.30) | 2.305 * (1.93) | 5.856 *** (4.49) |
| Observation | 884 | 884 | 884 | 884 | 884 | 884 | 884 | 884 | 884 | 884 |
| R2 | 0.057 | 0.057 | −0.49 | 0.07 | −0.45 | −0.06 | 0.21 | −0.04 | 0.23 | 0.10 |
| Prob > F | 0.0000 | 0.0002 | 0.0033 | 0.0001 | 0.0004 | 0.0000 | 0.0000 | 0.0000 | 0.0000 | 0.0000 |
| Underidentification test | 9.718 *** | 10.648 *** | 9.718 *** | 10.648 *** | 9.718 *** | 10.648 *** | 9.718 *** | 10.648 *** | 9.718 *** | 10.648 *** |
| Weak identification test | 46.561 | 43.427 | 46.561 | 43.427 | 46.561 | 43.427 | 46.561 | 43.427 | 46.561 | 43.427 |
Note: standard errors are reported in parentheses; *** p < 0.01, ** p < 0.05, * p < 0.1.
Table 7.
Robustness test.
| Variables | Model 1 | Model 2 | Model 3 | Model 4 | Model 5 |
|---|---|---|---|---|---|
| lnY | LnAGCI | LnPRTY | LnTRSF | LnOPET | |
| Financial literacy | 0.887 *** (3.48) | −1.881 (−1.11) | 2.691 *** (3.47) | 0.995 ** (2.46) | 1.334 * (1.87) |
| Age | 0.004 (0.85) | −0.090 *** (−4.44) | 0.044 *** (3.17) | 0.070 *** (6.54) | 0.021 * (1.85) |
| Gender | 0.030 (0.23) | 0.476 (1.13) | −0.066 (−0.16) | −0.060 (−0.22) | −0.273 (−0.67) |
| Health | 0.095 *** (2.69) | 0.189 (1.54) | 0.056 (0.64) | −0.040 (−0.68) | 0.238 ** (2.43) |
| Education | −0.009 (−0.49) | 0.036 (0.37) | −0.059 (−1.37) | −0.006 (−0.19) | −0.028 (−0.59) |
| Marriage | −0.107 (−0.90) | 0.901 ** (2.27) | 0.595 * (1.88) | 0.098 (0.44) | −0.562 * (−1.85) |
| Business owner or not | 0.648 *** (4.06) | 2.417 *** (2.83) | −0.030 (−0.05) | 0.154 (0.61) | 0.027 (0.06) |
| Member of Chinese Communist Party | −0.186 (−1.25) | 0.356 (0.48) | −0.185 (−0.41) | −0.507 * (−1.91) | 0.377 (1.04) |
| Satisfaction | 0.047 *** (2.58) | 0.119 (1.45) | 0.106 * (1.68) | 0.043 (1.47) | 0.064 (1.07) |
| Laborers | 0.129 *** (5.35) | −0.131 (−1.13) | −0.083 (−1.03) | −0.335 *** (−7.56) | 1.355 *** (18.83) |
| Village dummy variable | Controlled | Controlled | Controlled | Controlled | Controlled |
| _cons | 7.921 *** (17.53) | 8.564 *** (4.20) | −4.067 *** (−2.81) | 2.519 *** (3.27) | 1.127 (1.03) |
| Observation | 1768 | 1768 | 1768 | 1768 | 1768 |
| R2 | −0.214 | −0.115 | −0.527 | −0.033 | 0.180 |
| Prob > F | 0.000 | 0.000 | 0.000 | 0.000 | 0.000 |
| Underidentification test | 11.689 *** | 11.689 *** | 11.689 *** | 11.689 *** | 11.689 *** |
| Weak identification test | 66.290 *** | 66.290 *** | 66.290 *** | 66.290 *** | 66.290 *** |
Note: standard errors are reported in parentheses; *** p < 0.01, ** p < 0.05, * p < 0.1. The values in brackets in the table are t values.
Disclaimer/Publisher’s Note: The statements, opinions and data contained in all publications are solely those of the individual author(s) and contributor(s) and not of MDPI and/or the editor(s). MDPI and/or the editor(s) disclaim responsibility for any injury to people or property resulting from any ideas, methods, instructions or products referred to in the content. |
© 2023 by the authors. Licensee MDPI, Basel, Switzerland. This article is an open access article distributed under the terms and conditions of the Creative Commons Attribution (CC BY) license (https://creativecommons.org/licenses/by/4.0/).
Share and Cite
MDPI and ACS Style
Xu, H.; Song, K.; Li, Y.; Ankrah Twumasi, M. The Relationship between Financial Literacy and Income Structure of Rural Farm Households: Evidence from Jiangsu, China. Agriculture 2023, 13, 711. https://doi.org/10.3390/agriculture13030711
AMA Style
Xu H, Song K, Li Y, Ankrah Twumasi M. The Relationship between Financial Literacy and Income Structure of Rural Farm Households: Evidence from Jiangsu, China. Agriculture. 2023; 13(3):711. https://doi.org/10.3390/agriculture13030711
Chicago/Turabian StyleXu, Huidan, Kun Song, Yichao Li, and Martinson Ankrah Twumasi. 2023. "The Relationship between Financial Literacy and Income Structure of Rural Farm Households: Evidence from Jiangsu, China" Agriculture 13, no. 3: 711. https://doi.org/10.3390/agriculture13030711
Note that from the first issue of 2016, this journal uses article numbers instead of page numbers. See further details here.