Article

Study on Spatiotemporal Changes of Rural Vulnerability in China’s Southwest Mountainous Provinces from 2000 to 2020 Based on Remote Sensing Image Interpretation: A Case in Yunnan Province

1
Institute of Land & Resources and Sustainable Development, Yunnan University of Finance and Economics, Kunming 650221, China
2
Institute of Targeted Poverty Alleviation and Development, Yunnan University of Finance and Economics, Kunming 650221, China
3
School of Economics, Yunnan University of Finance and Economics, Kunming 650221, China
*
Author to whom correspondence should be addressed.
Agriculture 2023, 13(3), 682; https://doi.org/10.3390/agriculture13030682
Submission received: 14 February 2023 / Revised: 5 March 2023 / Accepted: 8 March 2023 / Published: 14 March 2023
(This article belongs to the Special Issue Agricultural Development Strategies for Less-Favoured Areas)

Abstract

:
The three dimensions of ecological, economic, and social vulnerability in the mountainous countryside are caused by the fragility of the natural ecosystems of the mountains, which overlap with the geographical location of the countryside and are associated with farm production and low productivity. This study conducts a vulnerability evaluation of mountainous rural areas based on the fundamentals of ecological vulnerability in mountainous regions by combining “RS and GIS + multistage land use/land cover change (LUCC) + rural vulnerability evaluation theory and quantitative and practical techniques”. The goal of this project is to establish a comprehensive evaluation system that takes into account the various vulnerability levels in rural areas. It is based on the results of the three phases (2000, 2010, and 2020) of land use/land cover remote sensing images of Yunnan Province. The Delphi approach was used to determine the indicator weights. In order to quantitatively assess the rural vulnerability of 129 counties in Yunnan Province in 2000, 2010, and 2020, as well as to reveal the spatiotemporal characteristics of the rural vulnerability of the entire province in each county from 2000 to 2020, the qualitative comprehensive analysis method and the quantitative multi-index comprehensive evaluation method were organically combined. This paper’s objective is to offer a basis for the strategic planning and management of sustainable rural development and revitalization in mountainous provinces. The findings demonstrate that the ecological, economic, and social vulnerability levels all dramatically decreased over the previous two decades in rural Yunnan Province and its counties. The overall vulnerability of rural areas has been somewhat diminished, with an average annual decline of 1.17% over the past 20 years in the whole province. This demonstrates how the construction and development of rural areas over the past two decades have significantly decreased the overall vulnerability of rural areas. There are, nevertheless, substantial geographical variations. At present, the levels of ecological, economic, social, and overall vulnerability in rural areas of Yunnan Province are high.

1. Introduction

In the rapid development of China’s industrialization, urbanization, and marketization over the past 40 years, rural development has been impacted accordingly, causing problems such as the overexploitation of resources, a worsening ecological environment, frequent natural disasters, prominent human–land conflicts, intensified urban–rural conflicts, and inadequate rural development, which have led to obvious vulnerabilities in the rural regions. These vulnerabilities have become an essential factor that hinders the smooth implementation of sustainable rural development and revitalization strategies. Therefore, it is crucial to investigate the rural system’s vulnerability and provide countermeasures to lessen it under regional needs.
The concept of “vulnerability” derives from studying natural disasters and poverty [1,2]. In 1981, Timmerman extended vulnerability research to geography [3]. It has also seen extensive usage in various disciplines, including sociology, ecology, and economics. Vulnerability research became a trendy topic and a crucial analytical tool in the fields of sustainability science and global environmental change in 2001 [4]. Science magazine listed the vulnerability of the social and natural systems in particular areas as a critical issue that sustainability scientists should focus on [5]. At present, vulnerability research has become an emerging multidisciplinary and interdisciplinary discipline. With the various research philosophies of many fields, the academic community has not reached a consensus on the concept and framework of vulnerability. Based on the vulnerability of unique regions of rural areas, research on rural vulnerability has been conducted. Rural vulnerability, according to some experts, is the degree of system vulnerability brought on by differences in the sensitivity and adaptability of rural regional systems as a result of interactions between natural and human activities [6]. Based on extensive examination and the study of vulnerability, particularly rural vulnerability, by numerous academics in the past, this study holds that rural vulnerability is a comprehensive indicator of the level of sustainability of a rural regional system, which indicates that the resources and ecological environment that serve as the foundation for rural development are being destroyed as a result of the mutual influence of natural environment changes and human activities and that the overall ecological, economic, and social development of the rural is changing negatively.
The quantitative vulnerability evaluation is the core content of vulnerability research. From the perspective of the research content and data sources of rural area vulnerability evaluation (RAVE), the current research literature can loosely be categorized into four groups. The first is “existing surveys and statistics + quantitative measurement of vulnerability in a given aspect at present circumstances or in a certain year” (Guillaumont [7], 2009; Liu Yi et al. [8], 2010; Dumenu and Obeng [9], 2016; Keshavarz et al. [10], 2017). The second is an “existing surveys and statistics + quantitative measurement of vulnerability level in a given aspect over a period of years” (Rufat [11], 2015; Yang Yanru [12], 2015; Nguyen [13], 2016). The third is the “existing surveys and statistics + quantitative measurement of vulnerability level of the composite system over several years” (Petrosillo [14], 2006; Wen Xiaojin et al. [15], 2016; Yadav [16], 2017). The fourth is the “remote sensing image interpretation (RS and GIS) + quantitative measurement of ecological vulnerability in a given year or years” (Zhang Hongmei [17], 2007; Sahoo et al. [18], 2016; França [19], 2022). From the perspective of a vulnerability evaluation indicator system, various experts and scholars have conducted research from different perspectives, roughly from the “sensitivity–resilience–pressure (SRP) conceptual model” [20], “eco–economic–social” [21], “eco–economic–environment–resource” [22], “pressure–state–response (PSR)” [23], “Vulnerability Scoping Diagram (VSD) model” [24], and ”sensitivity–adaptability” frameworks [25]. These six types of framework systems select for various specific evaluation indicators. Choosing an evaluation method is the essential step in the evaluation process. At present, the main methods used are the set pair analysis method [26], neural network method [27], comprehensive index method [28], main analytic hierarchy process [29], and data envelopment model [30]. With the development of remote sensing technology, it has become very common to use remote sensing technology for research, such as monitoring surface water/ice dynamics and rivers, analysis of agricultural abandonment, etc. [31,32,33]. In recent years, the vulnerability evaluation method based on GIS and RS has been widely used [34,35], and an increasing number of scholars have combined multiple methods and models to evaluate vulnerability [36].
The mountainous regions are significantly interwoven from the perspective of sustainable rural development. This is determined by the inherent vulnerability of the mountain ecosystem itself. For most mountainous areas, rural people are restricted by the ecological, economic, and social conditions of the barren natural resources, which may lead to unreasonable human activities and extensive development, further damaging the ecological environment of the rural area, along with frequent natural disasters and declining income levels, further strengthening the vulnerability of the natural ecological environment, society, and economy. This leads to a cycle of “rural vulnerability → unreasonable development → ecological destruction → social and economic weakness → rural vulnerability”, which highlights the extreme vulnerability of the mountain’s overall eco–economic–social system. For instance, Yunnan Province, which is situated in the mountainous region of China’s southwestern frontier and comprises 94% of its total land area, has a delicate natural environment [37], and the economy remains comparatively stagnant. The province has 129 counties (cities and districts), 88 of which are national rural poverty counties. This makes it the typical mountainous province with the most rural poverty counties nationwide. Regarding the literature, although some researchers have examined the susceptibility of specific mountain ranges (Jing Juanli [38], 2003; Su Weici et al. [39], 2008; Liu Zhengjia et al. [20], 2011), on the whole, these studies were mainly aimed at evaluating ecological vulnerability. At present, we have not seen a comprehensive evaluation of rural system vulnerability based on RS and that have established a suitable, feasible, and easy-to-operate rural vulnerability evaluation system for mountainous areas, which hinders the implementation of rural revitalization strategies and the sustained development of rural systems in mountainous locations.
In view of this, this paper intends to answer a scientific hypothesis through investigation and evaluation: Yunnan, a backward mountainous province with fragile ecological environment and social economy, has not only attached importance to ecological construction and environmental protection, but also strengthened the development of rural social economy in the past 20 years (2000–2020). In theory, protection and development should reduce ecological vulnerability and economic and social vulnerability to a certain extent. However, has it reduced ecological vulnerability and economic and social vulnerability? What are the specific functions and effects? It is urgent to make accurate scientific evaluations. Compared with the previous literature, the novelty of this paper is that it integrates “remote sensing and GIS + multi-phase land use/land cover change + rural vulnerability assessment theory and quantitative practical methods”, and based on the interpretation results of remote sensing images of land use in Yunnan Province in three phases (2000, 2010, 2020), this study quantitatively evaluates the change characteristics and regularity of rural ecological, economic, and social vulnerability and overall vulnerability of Yunnan Province, the most vulnerable mountainous province in the southwestern frontier of China, and its 129 counties from 2000 to 2020. Compared with the existing research results, the main contribution of this paper is to explore and quantitatively reveal the spatiotemporal characteristics and regularity and influence factors of rural ecological, economic, social, and overall vulnerability of vulnerable mountain provinces in the past 20 years for the first time. This can not only promote the sublimation and development of vulnerability assessment research in theory, but also provide basic ideas and methods for promoting rural sustainable development strategies. It is beneficial to further enrich and innovate the theoretical system of rural vulnerability. In reality, we can find a method for qualitative judgment and quantitative analysis of the level of rural vulnerability and its dynamic change trend in mountain areas, and provide the foundation and basis for reducing rural vulnerability, promoting rural sustainable development and rural revitalization strategic planning and management in mountain areas.

2. Materials and Methods

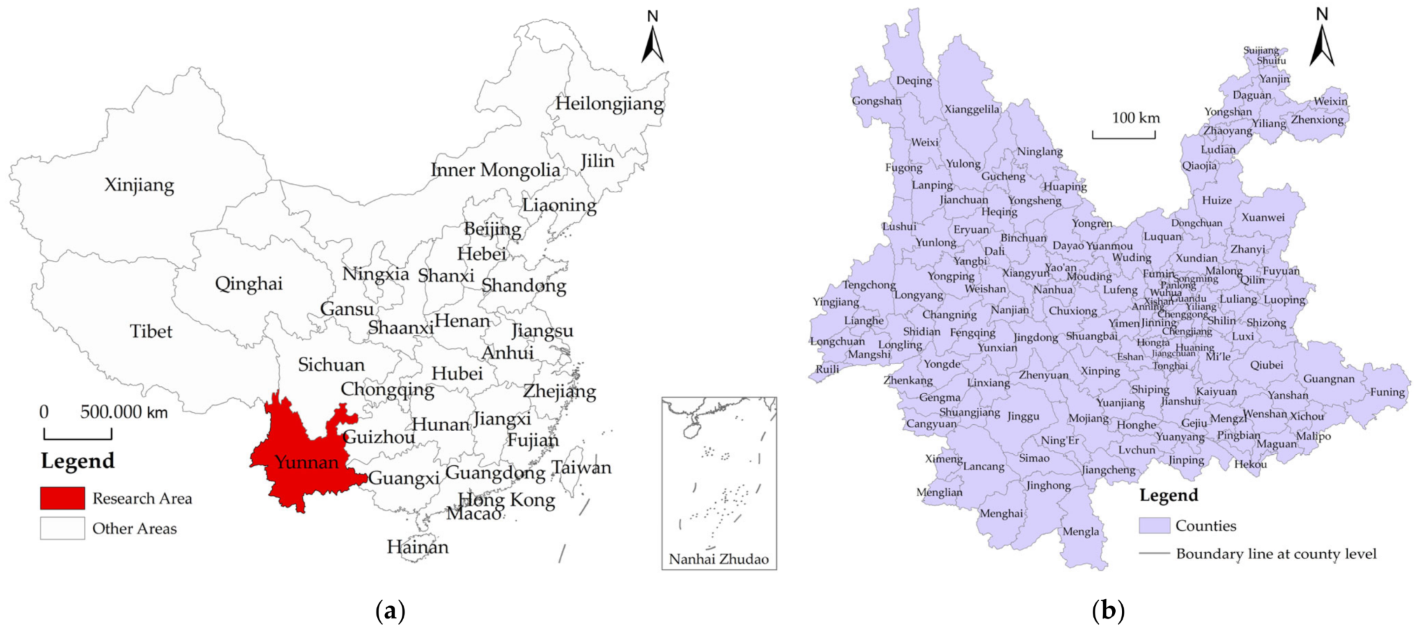
2.1. Overview of the Research Area

The province of Yunnan is located at the border of China. It spans between 21°8′32″ N and 29°15′8″ N and 97°31′39″ E and 106°11′47″ E. It has a typical mountainous setting and is mainly populated by ethnic minorities. It also has an underdeveloped economy. Yunnan Province shares a border with Laos, Myanmar, and Vietnam. It is also one of the most significant provinces in China, with a significant number of ethnic minorities; of the 55 ethnic groups in China, 51 reside in Yunnan Province. A total of 15.6396 million people, or 33.12% of the province’s total population, were members of ethnic minorities as of the end of 2020. The province controlled more than 16 states (cities) as of the year 2020. The province has 129 county-level administrative divisions (Figure 1) [40]. The GDP of Yunnan Province was CNY 2.452190 trillion in 2020, of which the output value of the primary industry was CNY 3.59891 trillion, accounting for 14.68 percent, the output value of the secondary industry was CNY 8.28754 trillion, accounting for 33.80 percent, and the output value of the tertiary industry was CNY 1.263545 trillion, accounting for 51.53 percent. The per capita disposable income of the entire population of Yunnan Province was CNY 23,295, ranking 28th (fourth from the bottom) out of 31 provinces (municipalities and autonomous regions) in China. Among them, the per capita disposable income for rural residents was approximately CNY 12,842. It is also the fourth lowest among the provinces (municipalities and autonomous regions) [41]. The highest point of the province is known as Kawagbo (6740 m), which is the main peak of the Prince Snow Mountain. The lowest point is located at the confluence (76.4 m) of the Nanxi River and the Yuanjiang River in Hekou County. The region is dominated by mountains, which comprise 94% of the province’s land area [42]. Approximately 77% of the province’s land has a slope greater than 15°, while over 40% has a steep slope of more than 25° [43]. In Yunnan Province, over 56% of the counties have a steep slope of more than 25°, accounting for more than 30%, while more than one-fifth of the counties have a steep slope greater than 25°, accounting for more than 50%. Due to the fact of its high and low latitudes and the influence of the monsoon climate, Yunnan has formed the characteristics of a low-latitude mountain monsoon climate with abundant light energy, with small temperature differences between the four seasons, distinct dry and wet seasons, and significant vertical variation. There are many rivers in Yunnan Province, with a total of more than 600 large and small rivers, and more than 80 of them have a drainage area of over a thousand square kilometers. The rivers of the province are divided into six major water systems, namely, the Yangtze, Pearl, Yuanjiang–Red River, Lancang–Mekong, Nujiang–Sarwen, and Irrawaddy Rivers, all of which belong to the outflow water system into the sea.

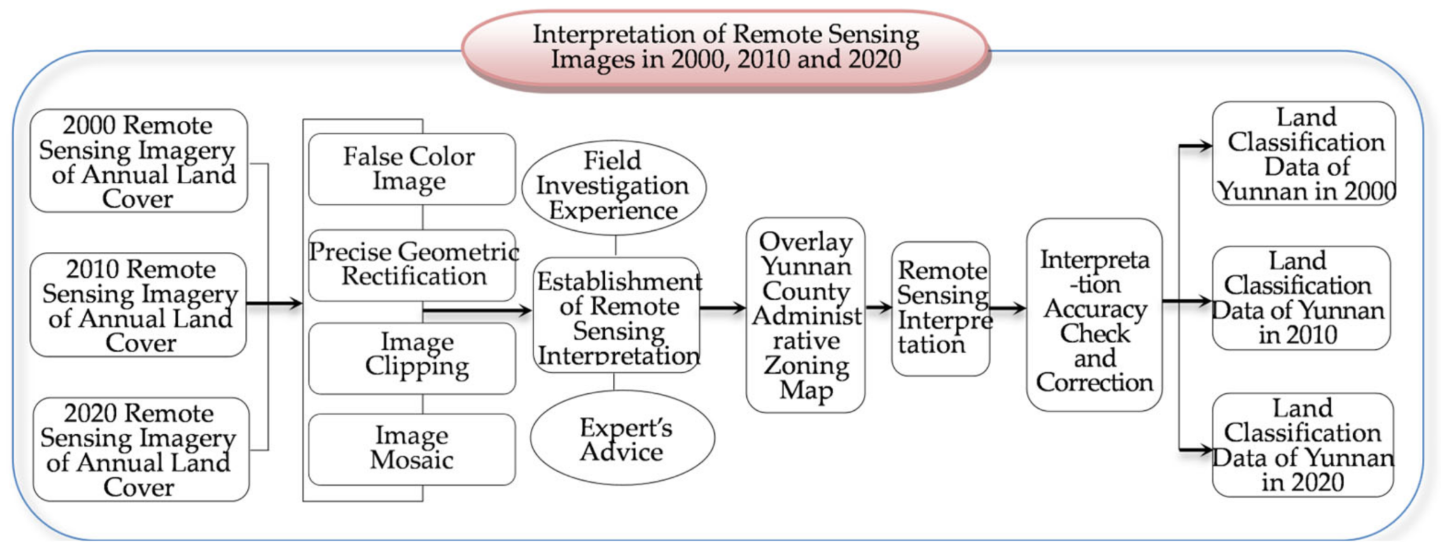
2.2. Data Source and Description

This paper presents three different phases of data from 2000 to 2020 using the website of the Data Center of China Academy of Sciences. The spatial resolution of the images is 30 m × 30 m. Table 1 details the data information of the remote sensing images of three different phases used in this paper.
Yunnan’s LUCC classification system was determined as 6 first-level types and 12 s-level types in reference to the Multiperiod LUCC Remote Sensing Monitoring Data Set (CNLUCC) of China by Xu Xinliang and Liu Jiyuan et al. [44] and the LUCC classification system established by Liu Jiyuan et al. [45,46].
Three phases of vector database of land use/land cover in Yunnan Province were obtained by human–computer interactive land use/cover type interpretation of the three-phase remote sensing images of Yunnan Province with the ArcGIS software environment based on the above unified land use/land cover classification system and combined with remote sensing interpretation flags (Figure 2 and Figure 3).

2.3. Rural Vulnerability Evaluation Method

2.3.1. Indicator System of Rural Vulnerability Evaluation

The evaluation index method created here was primarily used for evaluating regional rural vulnerability. This study used the framework established by Zhang Fengrong and colleagues in 2003 [47] for reference. It categorized the system into three levels (Table 2). These were the primary indicators that were used in the evaluation of the program. They were based on the available data in each county.
It should be emphasized that each indicator value should be translated into a unified requirement that tends to 100, which indicates low vulnerability and high sustainability, and tends to 0, which indicates high vulnerability and low sustainability, in order to enable a comparison and analysis. As a result, passing the system conversion index was also required (Table 2).

2.3.2. Comprehensive Evaluation Method of Rural Vulnerability

In order to assess the overall area of rural vulnerability quantitatively, four quantitative comprehensive evaluation indicators are proposed here, namely, rural ecological vulnerability, rural economic vulnerability, rural social vulnerability, and overall rural vulnerability. This, respectively, reflects the vulnerability levels of the ecological, economic, social, and overall rural systems. The four comprehensive indicators were calculated using the “multiple indicator comprehensive evaluation approach” [53].
  • Calculation methods of rural ecological, economic, social, and overall vulnerability
In short, this method calculates the values of rural ecological, economic, and social vulnerability by weighted average of each evaluation index in Table 3, and calculates the value of rural overall vulnerability according to the weight given by rural ecological, economic, and social vulnerability. The calculation formula of rural ecological, economic, and social vulnerability is:
D = k = 1 n w j k · I k
where D is the collective name of rural ecological vulnerability (DREV−1), rural economic vulnerability (DREV−2), and rural social vulnerability (DRSV), wjk is the weight of the kth evaluation index of the jth vulnerability degree (i.e., DREV−1, DREV−2, or DRSV, the value range is 0~1 and the sum of the weights is 1), Ik is the actual value of the kth evaluation index (the value range is 0–100). The calculation formula of the overall rural vulnerability value is:
D R O V = w 1 · D R E V - 1 + w 2 · D R E V - 2 + w 3 · D R S V
The weight values of DREV−1, DREV−2, and DRSV are represented by w1, w2, and w3, respectively, in Formula (2). The larger the overall vulnerability of the rural system and the poorer the sustainability, the higher the DROV value.
2.
Etermination method and resulting value of the index weight
Principal components analysis, analytical hierarchy process, the Delphi method, and other techniques are the primary ways to estimate the weight. The Delphi approach, among them, is a more widely used technique for determining weight coefficients; it organizes experts into groups and scores the weights of various factors according to their respective conditions. The second and third rounds are then conducted by experts to establish a more uniform and coherent value for the factors.
In November 2022, we gathered 16 experts to assign weights to the indicators of the aforementioned regional rural vulnerability evaluation using the Delphi technique (expert consultation method). Following the necessary processing, we could extract the weights of indicators at all levels (Table 3).

2.3.3. Rural Vulnerability Grading System and Standards

After determining the degree of economic, ecological, social, and overall vulnerability of the study area, a hierarchy of the values for the degree of vulnerability of these factors was graded. The ability to qualify different types of vulnerability, such as economic, ecological, and social, allows researchers to analyze the results thoroughly. This can better provide scientific guidance and a decision-making basis for the implementation of sustainable development strategies in mountainous rural systems. Based on the results of our studies and surveys in various areas of Yunnan, combined with the actual situation of the evaluation index system in this paper, the grading system constructed by Yang Zisheng and Liu Yansui [54] (2007) and Yang Renyi and Du Wanying et al. [37] (2021) was referenced. The degrees of rural ecological, economic, social, and overall vulnerability were divided into five grades (Table 4).

2.4. Analysis Method of Influencing Factors of Rural Vulnerability

2.4.1. Research Methods of Spatial Econometrics

The first law of geography indicates that all things are related to other things, but closer items are more connected than more distant things. Since this paper involves 129 counties (cities and districts) in Yunnan Province, there may be more obvious spatial autocorrelation problems in data analysis. Therefore, it is more appropriate to use the spatial econometrics method to analyze the influencing factors of rural vulnerability. The main steps of establishing the model by using the spatial econometrics method are as follows: establishing the spatial weight matrix; calculating Moran’s index and analyzing the characteristics of spatial agglomeration; modeling and analyzing; conclusion and application. The calculation formula of Moran’s index is as follows:
Moran s   I = n e T W e e T e ( i j w i j ) = i j w i j ( x i x ¯ ) ( y i y ¯ ) S 2 ( i j w i j )
where e denotes the residual matrix; W represents the spatial weight matrix; and S2 represents the variance of the observed value xi.
For different types of data, there are certain differences in model settings. Generally speaking, Spatial Lag Model (SLM), Spatial Error Model (SEM), and Geographically Weighted Regression (GWR) are usually used in the section data. In panel data, other models are more widely used, including Spatial Autoregressive Model with Spatial Autoregressive Disturbances (SARAR), Spatial Error Model (SEM), Spatial Autoregressive Model (SAR), Spatial Durbin Model (SDM), and so on. In addition, SAR and SDM can also be applied to dynamic panels. The generalized spatial panel model can be expressed as follows:
Y i t = τ Y i , t 1 + ρ W i Y t + X i t β + D i X δ + u i + γ t + ε i t ε i t = λ M i ε t + v i t
In formula (4), Yi,t−1 is the first-order delayed terms of the explained variable Yit (i.e., τ ≠ 0 is the spatial dynamic panel model), Wi, Di, and Mi are the ith row of the spatial weight matrix W, D, and M respectively; Xit is the ith column of the explanatory variable matrix; β is the parameter vector to be estimated; δ is the fixed and unknown parameter vector to be estimated; ui is the fixed effect; γt is the time effect; and εit is the residual term. This study uses a static panel model (τ = 0).

2.4.2. Construction of Indicator System of Rural Vulnerability Influencing Factors

The rural vulnerability of Yunnan Province presents a more complex spatiotemporal regularity, which needs to be explored and analyzed more deeply by using spatial econometric models. However, before using the model analysis, it is necessary to build a scientific, reasonable, and feasible indicator system. This study refers to the previous research results and the actual situation of Yunnan Province, and constructs the indicator system of rural vulnerability at the three levels of eco–economic–social, and the overall rural vulnerability impact factors in Yunnan Province from five dimensions of industrial economy, investment expenditure, population structure, ecological environment, and geographical conditions (Table 5).
The impact indicator system selected in this study is shown in Table 6. The raster data source of nighttime light brightness in these indicator systems is DMSP/OLS, and the average brightness of nighttime light in a county is calculated by ArcGIS software. The land area data of different grades of topographic and climate predominance degrees are from the Office of Yunnan Provincial Agricultural Zoning Committee (1987). The data of each land area in the biological abundance index, the data of the NDVI, and the total construction land area in the average construction land area index were obtained from the remote sensing interpretation results. The rest of various economic data were obtained from the Statistical Yearbook of Yunnan Province (2000–2020) and the EPS global statistical data/analysis platform.

3. Results

On the basis of the previous comprehensive evaluation approaches to rural vulnerability, the rural ecological vulnerability (DREV−1), economic vulnerability (DREV−2), social vulnerability (DRSV), and overall vulnerability of the rural system (DROV) of 129 counties were computed in the province for 2000, 2010, and 2020. The rural ecological vulnerability evaluation map (Figure 4) and economic vulnerability evaluation map (Figure 5) for the period 2000–2020 were prepared, as well as a social vulnerability evaluation chart (Figure 6) and overall vulnerability evaluation chart (Figure 7). According to the calculated results, the spatial and temporal evolutions of rural ecological, economic, social, and overall vulnerability can be analyzed.

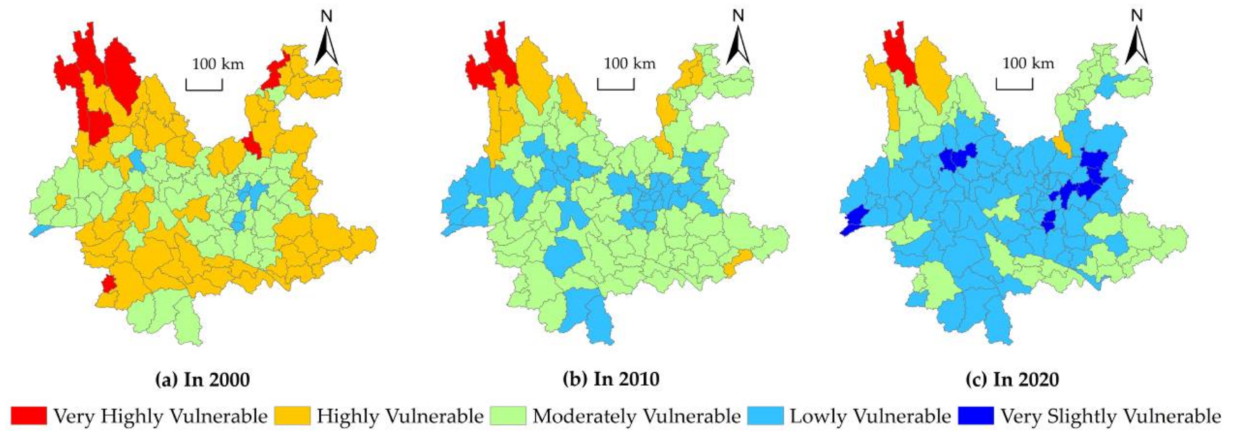
3.1. Evolutionary Characteristics of Rural Ecological Vulnerability in 2000, 2010, and 2020

3.1.1. Evolutionary Characteristics of Rural Ecological Vulnerability in 2000, 2010, and 2020

The changes in the rural ecological vulnerability and the ecological vulnerability level in the province and counties during the research period (2000–2020) are shown in Figure 4, and they mainly presented basic characteristics. At first, the overall rural ecological vulnerability in Yunnan Province gradually decreased from 2000 to 2010, and the ecological vulnerability level decreased from “moderate vulnerability” to “low vulnerability”. The average rural ecological vulnerability of the province was 46.63 in 2000, and it will fall to 40.74 by 2020. This shows that the land ecological environment protection and construction in Yunnan Province have achieved remarkable results during the research period. Secondly, the change in the rural ecological vulnerability in the county from 2000 to 2020 was relatively complicated. It can be seen that in the past 20 years, 81 counties (62.79%) in the province improved, while the ecological vulnerability level of 48 counties (37.21%) did not change.

3.1.2. Spatial Difference Characteristics of Rural Ecological Vulnerability in Yunnan Province

According to the calculated results for 2020, the current average rural ecological vulnerability (DREV−1) of Yunnan Province dropped to 40.74, which means that the overall rural ecological vulnerability of the province has been reduced to a “low vulnerability” level. However, the regional differences in the degree of rural ecological vulnerability in the province were significant. On the whole, the degree of rural ecological vulnerability was lower in the south, southwest, west, and center of Yunnan, while it was higher in the karst areas of northwest, northeast, east, and southeast Yunnan. In terms of the perspective of counties, the degree of rural ecological vulnerability was still high on the whole. A total of 27.90% of the counties in the province were “moderately vulnerable”; Deqin County, Yongshan County, and Qiaojia County in the Jinsha River basin were “highly vulnerable”; and Dongchuan District, known as “debris flow museum”, was still “highly vulnerable”.

3.2. Spatiotemporal Evolutionary Characteristics of Rural Economic Vulnerability

3.2.1. Evolutionary Characteristics of Rural Economic Vulnerability in 2000, 2010, and 2020

It can be seen that the rural economic vulnerability in the province and counties has changed significantly during the research period (2000–2020), as shown in Figure 5. They mainly presented basic characteristics. At first, the rural economic vulnerability of the province decreased in comparatively obvious tendencies, and the DREV−2 value decreased from 60.13 to 40.69 over the past 20 years. Accordingly, the economic vulnerability level of Yunnan Province was reduced from “highly vulnerable” to “lowly vulnerable”, which shows that rural economic development has achieved significant results during the research period (2000–2020). In addition, the distinctions among counties in rural economic vulnerability change were relatively significant. This indicates that over the past 20 years, 118 counties (91.47%) in the province improved, while the economic vulnerability level of 11 counties (8.53%) did not change.

3.2.2. Spatial Difference Characteristics of Rural Economic Vulnerability in Yunnan Province

In 2020, the degree of rural economic vulnerability in Yunnan Province was significantly reduced. The average rural economic vulnerability (DREV−2) in the province was 40.69, which fell to the “low vulnerability” level. In terms of the degree of rural economic vulnerability of every county, the value of rural economic vulnerability (DREV−2) was the highest in Deqin County in northwest Yunnan, which was 71.60, belonging to the “extremely high vulnerability” level. The second were Lushui City, Lanping County, Ninglang County, Weixi County, Gongshan County, Fugong County, and Shangri-La City in the northwest of Yunnan Province, with DREV−2 values of 55 to 65, belonging to the “highly vulnerable” level. There were 26 counties (20.16%) that had rural economic vulnerability at the “moderate vulnerability” level, 61 counties (47.29%) at the “low vulnerability” level, and 34 counties (26.36%) at the “slight vulnerability” level.

3.3. Spatiotemporal Evolutionary Characteristics of Rural Social Vulnerability

3.3.1. Changing Characteristics of Rural Social Vulnerability over the Past 20 Years

The rural social vulnerability in the province and counties also changed significantly during the research period (2000~2020), as shown in Figure 6. Their basic characteristics were as follows: First, the rural social vulnerability of the province has decreased significantly during research period. The DRSV value of the province has decreased from 65.67 in 2000 to 49.50 in 2020. Accordingly, the grade of social vulnerability was reduced from “extremely vulnerable” to “moderately vulnerable”. This shows that the social benefits of rural development in Yunnan Province significantly improved during the research period. In addition, the change in the rural social vulnerability in the county was comparatively complicated. During the research period (2000~2020), the social vulnerability level of 126 counties (97.67%) in the province decreased, while the social vulnerability level of 3 counties (2.33%) did not change.

3.3.2. Spatial Difference Characteristics of Rural Social Vulnerability in Yunnan Province

The average value of the rural social vulnerability (DRSV) of Yunnan Province in 2020 was 49.5, and the rural social vulnerability level was generally “moderately vulnerable”. The difference was relatively vast in terms of the level of rural social vulnerability in each county: Deqin County and Gongshan County in northwest Yunnan had DRSV values of 67.57 and 70.94, respectively, in 2020, and their social vulnerability level was “extremely high vulnerability”. The DRSV value of Lanping County, Weixi County, Lushui City, Ninglang County, Shangri-La City, and Fugong County in northwest Yunnan in 2020 was approximately 55–65, and their social vulnerability level was “highly vulnerable”; 83 counties (64.34%) belonged to the “moderately vulnerable” level; the remaining counties belonged to the “lowly vulnerable” level and the “very slightly vulnerable” level.

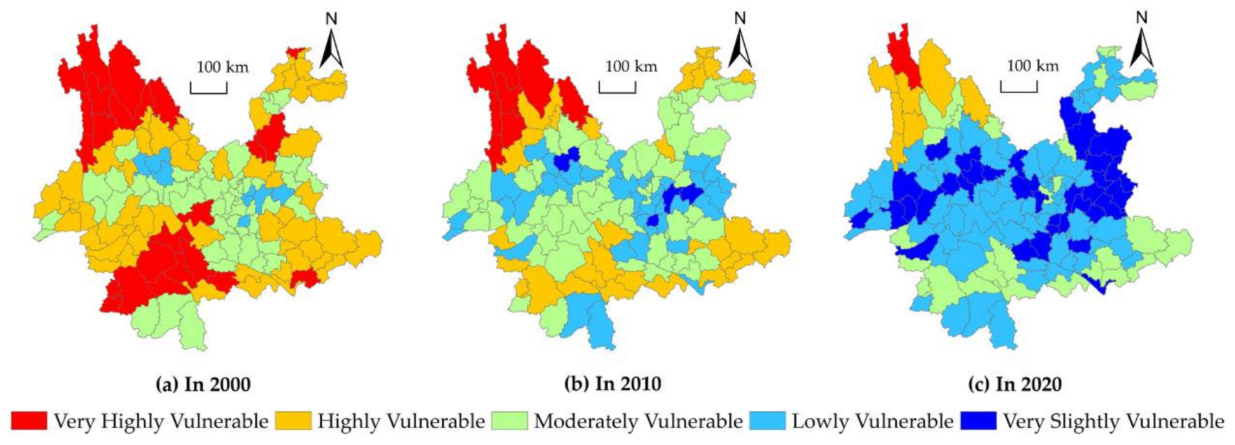
3.4. Temporal and Spatial Evolutionary Characteristics of Rural Overall Vulnerability

3.4.1. Changing Characteristics of Rural Overall Vulnerability over the Past 20 Years

It can be seen that from 2000 to 2020, the overall vulnerability of rural areas in the province and counties changed significantly during the research period (2000–2020), as shown in Figure 7, and they mainly presented basic characteristics.
At first, during the research period, the overall vulnerability of rural areas in total and in all counties decreased. The DROV value of the province decreased from 56.66 in 2000 to 43.35 in 2020, with a decrease of 13.31. From the drop in the value of DROV in all of the counties during the research period, there were 22 counties (accounting for 17.05%) with more than 15, 90 counties (accounting for 69.77%) with an increased value of approximately 10–15, and the other 17 counties (accounting for 13.18%) with an increased value of approximately 5~10.
From the perspective of the decline in the overall rural vulnerability in Yunnan Province as a whole, the average annual decline in the overall rural vulnerability over the past 20 years was 1.17%, higher than the decline in vulnerability, but the ecological aspect was lower than the decline in the economic and social aspects. According to the average annual drop in the DROV value in all counties during the research period, 5 counties (3.88%) reached more than 1.5%, 96 counties (74.42%) had an average annual drop of approximately 1.0~1.5%, and 27 counties (20.93%) had an average annual increase of less than 1.0%.
Due to the obvious annual decline in the overall rural vulnerability over the past 20 years, the overall rural vulnerability level in the whole province changed significantly, from the “high vulnerability” level in 2000 to the “low vulnerability” level in 2020. This shows that it effectively reduced the overall vulnerability of rural areas. It can be seen that over the past 20 years, the overall vulnerability level of 126 counties (97.67%) in the province decreased, while the overall vulnerability level of 3 counties (2.33%) did not change.

3.4.2. Spatial Difference Characteristics of Overall Rural Vulnerability in Yunnan Province

From 2020, the DROV value in total was low. The calculated results indicate that the DROV of Yunnan Province in 2020 was 43.35, which is close to the lower limit of the “moderately vulnerable” level (DROV value was 45). However, it was at the “lowly vulnerable” level. Its essential performance was that the ecological vulnerability, economic vulnerability, and social vulnerability had obvious deficiencies or defects for developing rural vulnerable regions sustainably. The rural resource development and utilization activities and the rural development methods had specific impacts and caused damage to the environment and ecology. On the other hand, the regional differences in the overall vulnerability of rural areas within the province were significant. In general, the overall vulnerability level of the whole province was relatively high in the mountain plain area in northeast Yunnan and the middle and low karst mountains in southeast Yunnan, especially in the alpine plateau canyon area in northwest Yunnan, where the overall vulnerability (DROV) value mostly belonged to the “moderately vulnerable” level and “highly vulnerable” level. The overall vulnerability degree of southern central and southwestern Yunnan were lower than above, and its overall sustainability (DOS) value mostly reached the “lowly vulnerable” level and “moderately vulnerable” level. In terms of the degree of rural vulnerability in each county, 1 of the 129 counties in the province (Deqin County in northwest Yunnan) had an overall rural vulnerability (DROV) value of more than 65, which is the “extremely vulnerable” level, accounting for 0.78%. There were 4 counties (Fugong County, Gongshan County, Shangri-La City, and Dongchuan District) with a DROV value between 55 and 65, belonging to the “highly vulnerable” level, accounting for 3.10%. The overall vulnerability (DROV) of 35 counties was between 45 and 55, which were in the “moderately vulnerable” level, accounting for 27.13%. The overall vulnerabilities (DROV) of 78 counties were between 35 and 45, which are in the “low vulnerability” level, accounting for 60.47%. The overall vulnerability (DROV) of 11 counties was lower than 35, which are in the “slightly vulnerable” level, accounting for 8.53%. Generally speaking, 87.60% of the counties in the province had overall vulnerability levels of “lowly vulnerable” and “moderately vulnerable”, while a few counties reached “highly vulnerable” and “very highly vulnerable”.

3.5. Spatial Autocorrelation Analysis

Before using the spatial econometric model to estimate, it is necessary to do further tests on the spatial correlation of the variables to better judge its spatial correlation characteristics. This paper conducts spatial autocorrelation tests on rural ecological vulnerability, economic vulnerability, social vulnerability, and overall vulnerability index in Yunnan Province, and obtains the average Moran’s I calculation results in 2000, 2010, 2020, and each year (Table 6).
It can be seen from Table 7 that the p value corresponding to all Moran’s I is less than 0.01 in any dimension and at any time point, indicating that the estimated results have passed the significance level test of 1%, indicating that the rural ecological vulnerability, economic vulnerability, social vulnerability, and overall vulnerability indexes in Yunnan Province have more obvious spatial autocorrelation characteristics. Therefore, it is necessary to use spatial econometric models to further explore their influencing factors.

3.6. Analysis of Influencing Factors of Rural Vulnerability

This paper introduces the rural ecological vulnerability, economic vulnerability, social vulnerability, and overall vulnerability index of Yunnan Province into the model as dependent variables, and constructs the index system of influencing factors from five dimensions of industrial economy, investment expenditure, population structure, ecological environment, and geographical conditions, and constructs a spatial econometric model. According to the relevant mathematical analysis, the SEM model is suitable when the rural ecological vulnerability and social vulnerability indexes are taken as dependent variables, the SAR model is suitable when the rural economic vulnerability index is taken as a dependent variable, and the SAC model is suitable when the rural overall vulnerability index is taken as a dependent variable. Therefore, this study constructs a spatial econometric model according to the above test methods. Accordingly, this study reconstructs the optimal spatial econometric model according to the above method, and its estimated results are shown in Table 7.
Table 7. Regression Results of Influencing Factors of Rural Vulnerability.
Items(1) SEM (RE)(2) SEM (FE)(3) SAR (FE)(4) SAC (FE)
Development Level of Primary Industry (X1)0.2744 (0.2919)−13.8929 (0.3775) ***−1.0647 (0.5624) *−4.6832 (0.2698) ***
Development Level of Secondary Industry (X2)0.1285 (0.1372)1.3352 (0.1775) ***−0.2103 (0.2703)0.3985 (0.1178) ***
GDP Per Capita (X4)0.0519 (0.1554)−0.1787 (0.1927)0.2974 (0.3117)0.0241 (0.1266)
Nighttime Light Brightness (X5)−0.1187 (0.146)−0.2316 (0.1878)0.3543 (0.2770)0.0070 (0.1326)
Per Capita Public Financial Expenditure (X7)−0.5862 (0.1702) ***−2.5418 (0.2233) ***−1.6346 (0.4019) ***−1.2917 (0.2858) ***
Urbanization Level (X8)0.0018 (0.0132)0.1496 (0.0194) ***0.0222 (0.0290)0.0626 (0.0127) ***
Per Capita Construction Land Area (X9)0.2590 (0.2330)0.4653 (0.2948)0.8350 (0.4748) *0.4945 (0.1927) **
Population Density (X10)−1.7518 (0.4257) ***−2.4234 (0.7319) ***−4.4089 (1.1063) ***−2.9411 (0.5660) ***
Index of Biological Richness (X11)−0.4171 (0.0195) ***−0.0581 (0.0358)−0.0434 (0.0559)−0.1669 (0.0239) ***
Normalized Difference Vegetation Index (X12)0.5370 (0.4595)−0.5567 (0.5830)−1.7816 (0.7953) **−0.7248 (0.3801) *
Terrain Predominance Degree (X13)−50.2148 (2.7383) ***
Climate Predominance Degree (X14)−25.8135 (2.8885) ***
Parameter ρ 0.5504 (0.0481) ***0.1733 (0.0886) *
Parameter λ0.2530 (0.0973) ***0.2637 (0.0704) *** 0.2180 (0.1151) *
LR Test: Individual Effect 21.99 (0.0245) **33.34 (0.0005) ***13.75 (0.2473)
LR Test: Time Effect −597.67 (1.0000)−312.60 (1.0000)−699.43 (1.0000)
Hausman Test3.74 (0.9584)67.84 (0.0000) ***103.53 (0.0000) ***
Individual EffectNoYesYesYes
Time EffectNoNoNoYes
Within R20.91440.97600.90200.9740
Sample Size387387387387
Note: All the above results are estimated by robust standard error method. *, ** and *** indicate the significance level of 10%, 5%, and 1%, respectively. This study selects optimal models and controls different effects according to Hausman test statistics and LR test statistics, where FE represents fixed effect and RE represents random effect.
In the above four models, the dependent variables X1, X2, X7, X8, X9, X10, X11, X12, X13, and X14 are more significant in one or more models, indicating that they are important factors affecting rural ecological vulnerability, social vulnerability, economic vulnerability, or overall vulnerability. This paper intends to discuss and analyze the above independent variables one by one.
  • The development level of the primary industry (X1). The estimated result of model 2 passed the significance level test of 1%, and the estimated coefficient was −13.8929. The estimated result of model 3 passed the 10% significance level test, and the estimated coefficient is −1.0647. The estimated result of model 4 passed the significance level test of 1%, and the estimated coefficient is −4.6832. The primary industry plays a vital role in the development of rural economy and is the main source of income for rural residents. The increase of the output value of the primary industry helps rural residents to obtain higher economic benefits. With the development of the primary industry, the rural economic conditions will be further improved, thus further reducing the vulnerability of the rural economy. In addition, the development of the primary industry will also help to attract more rural employees, promote the increase of rural residents’ income, and increase food production. To a certain extent, it can not only reduce the vulnerability of rural economy, but also reduce the vulnerability of rural society, thus further reducing the overall vulnerability.
  • The development level of the secondary industry (X2). The estimated result of model 2 passed the significance level test of 1%, and the estimated coefficient was 1.3352. The estimated result of model 4 passed the significance level test of 1%, and the estimated coefficient is 0.3985. The main reason is that the secondary industry is dominated by industry and closely related to the development of cities. With the development of the secondary industry, the income level of its urban residents will be further improved, which may further aggravate the gap between urban and rural income and development. With the full development of the secondary industry, the process of urbanization may be further accelerated, which will inhibit the development of rural industries, and further aggravate the social vulnerability of rural areas. In addition, the development of the secondary industry will absorb a more intensive labor force, which may lead to the loss of some rural labor force and increase the vulnerability of rural society. Due to the development of the secondary industry, rural social vulnerability will increase, and the overall rural vulnerability will also be further deepened.
  • Per capita public financial expenditure (X7). The estimated results of all models passed the significant level test of 1%, and the regression coefficients are significantly negative. This is mainly because the public finance expenditure is not only invested in the urbanization construction, but also a considerable part is used for rural construction and poverty relief, which to a large extent helps to significantly reduce the social and economic vulnerability of rural areas. In addition, the expenditure of public finance can promote the construction and development of rural areas, which is manifested in many ways. Its uses included rural ecological protection and restoration, land remediation, industrial development, infrastructure construction, rural human settlements, and other aspects, which to a large extent can promote ecological, economic, and social sustainable development, and effectively reduce rural ecological, social, and economic vulnerability and overall vulnerability, promoting sustainable rural development.
  • Urbanization level (X8). The estimation results of model 2 and model 4 both passed the 1% significance level test, and the estimated coefficients were 0.1496 and 0.0626, respectively. With the increase of urbanization level, rural labor will be lost, more and more of the labor force will move to larger cities, and the number of employees in rural areas will be reduced, thus increasing the vulnerability of rural society. In addition, with the improvement of urbanization level, the development gap between cities and rural areas may also be further widened, resulting in the widening of the urban–rural income gap, non-grain arable land, population outflow, and other social phenomena, which exacerbates the vulnerability of rural society, thus further increasing the overall vulnerability of rural areas, which is not conducive to the sustainable development of rural areas and the implementation of rural revitalization.
  • Per capita construction land area (X9). The per capita construction land area is also the reflection of urbanization indicators in another perspective. With the increase of the per capita construction land area, its urbanization level will also further increase, thus deepening the rural vulnerability. In addition, with the disorderly expansion of rural settlements in the past 20 years and the growth pattern of urban sprawl, the per capita construction land has increased unabated, and more and more high-quality cultivated land and fertile land are used for urban development and construction as well as the expansion of rural settlements, which to an extent aggravates the vulnerability of rural areas. The estimated results of model 3 and model 4 passed the significance level test of 10% and 5%, respectively, and the estimated coefficients were 0.8350 and 0.4945, respectively. Thus, it can be seen that the excessive urbanization expansion has no positive impact on the economic development of rural areas. On the contrary, it will lead to more negative impacts, which will further increase the overall vulnerability of rural areas.
  • Population density (X10). The estimated results of all models passed the 1% significant level test, and the regression coefficients were −1.7518, −2.4234, −4.4089, and −2.9411, respectively. The reason for this result is closely related to the migration and agglomeration of population. Generally speaking, places with large population density tend to have superior terrain and location conditions; with the development of economy, more and more people will migrate to areas with better economic, social, and environmental conditions, and the population density difference is gradually expanding. For example, with the development of the economy, the main urban area of Kunming and the counties with better economic conditions will attract more and more people. With the increase of the population, these areas will improve in terms of ecological governance and social and economic development, and their education and medical and health conditions will also be relatively perfect, and the rural vulnerability will be significantly reduced. It can be seen that the increase in population density and population migration will significantly alleviate the rural ecological vulnerability, social vulnerability, economic vulnerability, and overall vulnerability.
  • Biological abundance index (X11). The biological abundance index is calculated based on remote sensing interpretation and other methods, and its value reflects the biological richness of a region. Generally speaking, the urbanization of a region often weakens its biological richness, while the protection of the environment and the rational use of land in a region will promote the increase of biological richness. The estimated results of model 1 and model 4 both passed the significance level test of 1%, and the estimated values of coefficients were −0.4171 and −0.1669, respectively. This result is very reasonable, because the biological abundance index is a comprehensive reflection of the ecology and environment of a region. With the increase of biological abundance, its ecological and environmental conditions will also be further improved, and the rural ecological vulnerability will be improved by the environment, further promoting the reduction of the overall rural vulnerability. It can be seen that improving biological richness can effectively improve the rural ecological environment and promote the effective reduction of rural vulnerability.
  • NDVI (X12). NDVI is one of the important parameters reflecting crop growth and nutrient information. The estimated results of model 3 and model 4 passed the significance level test at 5% and 10%, respectively, and the estimated values of coefficients were −1.7816 and −0.7248, respectively. This is because the NDVI can indirectly reflect the crop quality of a region to a certain extent. The increase of the NDVI index indicates that the quality of crop growth has been improved and the yield has increased significantly, which helps rural residents increase production and income, which reduces the vulnerability of rural economy to a certain extent, and then reduces the overall vulnerability.
  • Terrain Predominance Degree (X13) and Climate Predominance Degree (X14). The value range of terrain superiority (X13) and climate superiority (X14) are both from 0 to 1, which are fixed values that do not change with time. If the fixed effect model is used, these indicators will be deleted because they are completely collinear with individual effects. From the estimation results of model 1, the estimation results of terrain and climate are extremely significant, indicating that terrain and climate have a profound and critical impact on rural ecological vulnerability. This is mainly because the areas with poor topographic and climate conditions are mostly karst rocky desertification landform areas, high mountains and steep slopes, or high mountains and valleys areas, such as Nujiang Prefecture and Diqing Prefecture in northwest Yunnan, where the inherent vulnerability and sensitivity of the ecological environment and the restriction of climate conditions on crop growth lead to certain challenges in the development of local resources. In addition, the excessive use of limited land by local rural residents will cause water and soil loss. Ecological destruction and other problems have led to the fragile ecological environment in local rural areas.

4. Discussion

This paper organically integrated the three dimensions of rural ecological, economic, and social vulnerability to conduct an overall evaluation of rural vulnerability. The ecological vulnerability was a more important factor of rural vulnerability in the mountainous areas than in other areas. The level of ecological vulnerability in the mountainous rural regions was an overall reflection of natural environmental conditions, such as terrain and climate, land overdevelopment, resource transformation (renovation) level, and ecological environmental protection level. From the perspective of “congenital” natural conditions, the terrain was the most prominent. The whole province was mainly mountainous. Approximately 77% of the land has a relatively steep slope not less than 15°, and approximately two-fifths of the land area has a steep slope of more than 25°; approximately three-fifths of the counties have steep land of more than 25°, which accounts for more than 30% of counties’ total land area, and more than one-fifth of the counties have steep land of more than 25°, which accounts for half of the counties’ total land area or more [43]. From the perspective of “acquired” human factors, the reason why rural ecological vulnerability in total was high was mainly because much of the land experienced overexploitation and abuse, especially in terms of over-cultivation (containing deforestation reclamation and steep slope cultivation) [54]. Some mountainous regions even had unreasonable land use, resulting in the province’s long-term widespread use of slope farmland, which accounted for a considerable scale. Based on the relative data on the province [55], sloping farmland with slope of 15° to 25° accounted for approximately 27.22%, and steep slope farmland with slope greater than 25° accounted for approximately 18.64%. The data of land suitable for farming can be obtained by land suitability evaluation, which is an effective technical method [56,57,58]. According to the results of the remote sensing images interpretation in 2020, the area of suitable farmland in total (including the suitable existing farmland and the suitable unused farmland) was 4.71 × 10⁶ hectares, and the LSRR value in total was only 12.3%, while the ALRR value in 2020 was 14.0%. Currently, the over-reclaimed area in total was 6.88 × 10⁵ hectares and only 14.6% of the suitable cultivated land area. Each county (city, district) experienced the phenomenon of overexploitation and utilization to varying degrees. The over-cultivation rate of 68.22% for the counties in the province exceeded 10%, and the over-cultivation rate of nearly one-quarter of the counties reached more than 20%, which may be one of the main causes of the overall poor rural ecological environment. On the other hand, some important measures such as the related resources and environment transformation (renovation) have not been implemented effectively, including the following aspects: EIA value was not high and EIR values in approximately two-thirds of the counties were less than 30%. The regional distinctions of the FCR values are obvious, and the FCR values in some counties were below one-fifth. Many counties still had different scales of bare land distribution. The IBR and VES values varied greatly.
The computed results of this study indicate that the rural economic vulnerability in total gradually reduced during the research period. This was primarily because the province attached large significance to agricultural development and rural construction, so a number of economic indicators were raised, such as OVPI, ALP, and CLP. Nevertheless, the development of the rural economy in total was comparatively slow, and the decline in the rural economic vulnerability over the past 20 years was relatively small and restricted by the socioeconomic, scientific, and technological level and ecological environment. At present, most counties still have a high level of rural economic vulnerability, which, in addition to the generally low level of food production, was mainly due to the lower combined land productivity, agricultural land productivity, RPCPI value, GRPCPI value, and OVPI value shared by most counties compared to the higher level counties in the province. Hence, the computed DREV−2 values based on it were somewhat high. According to the relative data [40], the CLP value of the total in 2020 was only approximately three-fifths of that of the whole country, and 68.99% of the total land productivity in 2020 was less than 10,000 CNY/hectare, of which most counties with inferior topography were less than 1800 CNY/hectare; the ALP in total was less than 70% of the whole country, and 69.77% of the counties had ALP values of less than 5000 CNY/hectare in 2020, of which most counties in the mountainous and canyon areas had ALP values of less than 1000 RMB/ha. At present, the regional differences in the degree of rural economic vulnerability in the province are relatively significant because of the regional differences in individual indicators. For example, the rural economy in central Yunnan has developed rapidly. Over the past 20 years, OVPI values and various rural incomes have increased significantly, so the rural economic vulnerability has decreased significantly. As it is restricted by natural conditions, the rural economic development in the mountainous and canyon areas was relatively slow, and the growth rates of OVPI and various rural incomes were far lower than those in central Yunnan. Consequently, their rural economic vulnerability decreased slightly. At present, the rural economic vulnerability of Diqing and Nujiang ranks among the high-value areas.
During the period from 2000 to 2020, the improvement of the rural resources and rural construction activities in the province had, to a large extent, continuously met the needs of the people for survival and development. The vulnerability of rural society was also significantly reduced because of the improvement of some indicators such as the PCDI value. With the growth of the population, the per capita grain output in rural areas also fluctuated, making the decline in the rural social vulnerability smaller. At present, the DRSV in total was still high, which was mainly due to the high population density of rural areas in many counties (cities and districts), the proportion of rural workers, and the values of PCDI, GRDI, and RPYG being low; therefore, the DRSV value was also high, accordingly. With the constant growth of the population, the RPD values in most counties of Kunming, Zhaotong, and Wenshan were relatively large. The PCDI values and other indicators of farmers were significantly lower than for the whole country. In 2020, the PCDI value in total ranked 28th among the 31 provinces in China [41]. The PCDI values in most counties were significantly lower than the national average level. On the other hand, the DRSV values showed obvious spatial distinctions, which were close to the spatial distinctions of the above indexes. For instance, although the rural population in central Yunnan was under more significant pressure and there was less arable land per capita, the PCDI and other indicators were apparently higher than the provincial level, and the DRSV was low. Most counties in Zhaotong City were not only limited by the higher pressure of the population but also underwent the slow development of the rural economy because of the fragile geographical conditions and natural environment. The RRRP and GRDI were low, and the rural society was vulnerable; therefore, the DRSV value was high. Most counties in Nujiang and Diqing are restricted by the terrain of high mountains, plateaus, and canyons. The per capita arable land is smaller, the rural economic development was slow, and the GRDI values were the lowest in the province; thus, their rural social vulnerability (DRSV) values were also in the high-value region. It has been proved that the development of rural characteristic industry is an important way to increase farmers’ income, reduce rural social and economic vulnerability and promote rural sustainable development [59].
The research on rural vulnerability evaluation has evident qualities and innovations compared to the current literature. This study employed remote sensing image interpretation of LUCC to integrate “RS and GIS + multiperiod LUCC + rural vulnerability evaluation theory and quantitative practical approaches”. There are clear advances compared to the previous four categories of study (“existing surveys and statistics + quantitative measurement of vulnerability in a given aspect at present circumstances or in a certain year”, “existing surveys and statistics + quantitative measurement of vulnerability level in a given aspect over a period of years”, “existing surveys and statistics + quantitative measurement of vulnerability level of the composite system over several years”, and “remote sensing image interpretation (RS and GIS) + quantitative measurement of ecological vulnerability in a given year or years”), which are crucial for further expanding and enhancing the theory and evaluation technique system of rural vulnerability. In actuality, this can provide a means to assess and quantitatively examine the degree of rural vulnerability of mountainous areas and their dynamic patterns for Yunnan Province and even comparable mountainous locations. Additionally, it offers a crucial framework and technical support for the management of strategic planning for sustainable development and rural revitalization in mountain areas.

5. Conclusions

Compared with the existing research results, the main contribution of this paper is to explore and quantitatively reveal the spatiotemporal characteristics and regularity and factors of influence of rural ecological, economic, social, and overall vulnerability of vulnerable mountain provinces in the past 20 years for the first time. In the past 20 years, the degree of rural ecological, economic, social, and overall vulnerability in Yunnan Province has changed significantly. The main conclusions are:
(1)
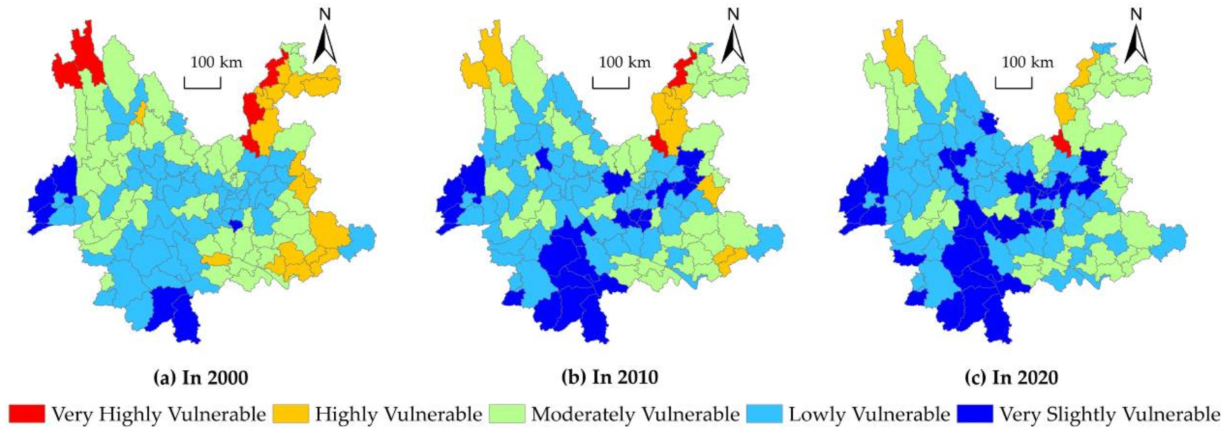
According to the changes in Yunnan Province from 2000 to 2020, the degree of rural ecological vulnerability, economic vulnerability, and social vulnerability have significantly decreased. Accordingly, the overall rural vulnerability has decreased to a certain extent. The average annual decline of the overall rural vulnerability in the province in the past 20 years is 1.17%. In terms of the overall vulnerability level, the province has dropped from the “highly vulnerable” level in 2000 to the “lowly vulnerable” level in 2020. This shows that ecological protection, rural development, and construction in the past 20 years have effectively reduced the overall vulnerability of rural areas.
(2)
From 2000 to 2020, the changes of ecological, economic, social, and overall vulnerability of rural areas in the county are relatively complex. In terms of the change of ecological vulnerability level, 81 counties (62.79%) have improved, while 48 counties (37.21%) have not changed their ecological vulnerability level. In terms of the change of economic vulnerability level, 118 counties (91.47%) have improved, while 11 counties (8.53%) have not changed their economic vulnerability level. In terms of the change of social vulnerability level, 126 counties (97.67%) have improved, while 3 counties (2.33%) have not changed their social vulnerability level. In terms of the change of overall vulnerability level, 126 counties (97.67%) have improved, while the overall vulnerability level of 3 counties (2.33%) has not changed.
(3)
From the current situation (2020), the degree of rural ecological, economic, and social vulnerability in Yunnan Province is relatively high on the whole, so the overall degree of vulnerability is also high. The basic situation reflected by this feature is that the current ecological, economic, and social vulnerabilities in Yunnan Province have obvious deficiencies or shortcomings for the sustainable development of rural areas. Rural resource development and utilization activities and rural development methods have caused certain impacts and damage to the ecological environment, and the economic and social benefits are not high. In the future, it is necessary to vigorously strengthen ecological environment protection and socioeconomic construction.
(4)
The overall vulnerability degree of rural areas in the province varies greatly from region to region. At present, the overall vulnerability degree of the whole province is relatively high in the mountain plateau canyon area, and the middle and low karst mountain areas, with the highest DROV value mostly belonging to the “moderately vulnerability” level and “highly vulnerability” level. The overall vulnerability of southern, southwestern, and central Yunnan is lower than that of the above regions. At present, 87.60% of the counties and villages in the province are of “low vulnerability” and “moderate vulnerability”, while a few counties are of “high vulnerability” and “extremely high vulnerability”.
(5)
The estimation results of the spatial econometric model show that the increase of per capita public financial expenditure, population density, and biological abundance index can significantly reduce the rural ecological vulnerability, and thus promote the reduction of the overall rural vulnerability. In addition, the better the terrain and climate conditions are, the lower the rural ecological vulnerability index is. The increase of the development level of the primary industry, the per capita public finance expenditure, and population density contribute to the reduction of the rural social vulnerability index and will promote the reduction of the overall rural vulnerability index, while the improvement of the development level of the secondary industry and the urbanization level will not be conducive to the reduction of the rural social vulnerability index, and thus will not be conducive to the reduction of the overall rural vulnerability index. The increase of the development level of the primary industry, per capita public finance expenditure, population density, and NDVI contributes to the reduction of the rural economic vulnerability index and will promote the reduction of the overall rural vulnerability index, while the increase of the per capita construction land area is not conducive to the reduction of the rural economic vulnerability index, and thus is not conducive to the reduction of the overall rural vulnerability index.

Author Contributions

Conceptualization, S.Y., R.Y. and Z.Y.; methodology, Z.Y.; software, S.Y.; validation, S.Y., R.Y. and Z.Y.; formal analysis, Z.Y.; investigation, S.Y.; resources, Z.Y.; data curation, S.Y. and Z.Y.; writing—original draft preparation, S.Y., R.Y. and Z.Y.; writing—review and editing, S.Y., R.Y. and Z.Y.; visualization, S.Y.; supervision, Z.Y.; project administration, Z.Y.; funding acquisition, Z.Y. All authors have read and agreed to the published version of the manuscript.

Funding

This research was funded by National Natural Science Foundation of China, grant number: 41261018.

Institutional Review Board Statement

Not applicable.

Informed Consent Statement

Not applicable.

Data Availability Statement

The RS image data in the study were collected from “https://www.resdc.cn/” (accessed on 16 June 2022). The DEM data were collected from “http://www.gscloud.cn” (accessed on 17 May 2022). The county boundaries of Yunnan Province were used from “https://yunnan.tianditu.gov.cn/MapResource” (accessed on 9 March 2022). The economic and social statistical data came from the following website: “https://www.epsnet.com.cn/index.html#/Index” (accessed on 10 November 2022).

Conflicts of Interest

The authors declare no conflict of interest.

References

  1. Turner, B.L.; Kasperson, R.E.; Matson, P.A.; McCarthy, J.J.; Corell, R.W.; Christensen, L.; Eckley, N.; Kasperson, J.X.; Luers, A.; Martello, M.L.; et al. A Framework for Vulnerability Analysis in Sustainability Science. Proc. Natl. Acad. Sci. USA 2003, 100, 8074–8079. [Google Scholar] [CrossRef] [Green Version]
  2. Adger, W.N. Vulnerability. Glob. Environ. Chang. 2006, 16, 268–281. [Google Scholar] [CrossRef]
  3. Timmerman, P. Vulnerability, Resilience and the Collapse of Society. Environ. Monogr. 1981, 21, 164–173. [Google Scholar]
  4. Kasperson, J.X.; Kasperson, R.E. International Workshop on Vulnerability and Global Environmental Change; Stockholm Environment Institute: Stockholm, Sweden, 2001. [Google Scholar]
  5. Kates, R.W.; Clark, W.C.; Corell, R.; Hall, J.M.; Svedlin, U. Environment and development: Sustainability science. Science 2001, 292, 641–642. [Google Scholar] [CrossRef] [PubMed]
  6. Yang, R.; Pan, Y.X. Spatial Patterns, Formation Mechanism and Coping Strategies of Rural Vulnerability in China at the County Level. Acta Geogr. Sin. 2021, 76, 1438–1454. [Google Scholar]
  7. Guillaumont, P. An Economic Vulnerability Index: Its Design and Use for International Development Policy. Oxf. Dev. Stud. 2009, 37, 193–228. [Google Scholar] [CrossRef] [Green Version]
  8. Liu, Y.; Huang, J.Y.; Ma, L. The evaluation of regional vulnerability to natural disasters in China based on DEA model. Geogr. Res. 2010, 29, 1153–1162. [Google Scholar]
  9. Dumenu, W.K.; Obeng, E.A. Climate Change and Rural Communities in Ghana: Social Vulnerability, Impacts, Adaptations and Policy Implications. Environ. Sci. Policy 2016, 55, 208–217. [Google Scholar] [CrossRef]
  10. Keshavarz, M.; Maleksaeidi, H.; Karami, E. Livelihood Vulnerability to Drought: A Case of Rural Iran. Int. J. Disaster Risk Reduct. 2017, 21, 223–230. [Google Scholar] [CrossRef]
  11. Rufat, S.; Tate, E.; Burton, C.G.; Maroof, A.S. Social Vulnerability to Floods: Review of Case Studies and Implications for Measurement. Int. J. Disaster Risk Reduct. 2015, 14, 470–486. [Google Scholar] [CrossRef] [Green Version]
  12. Yang, Y.R.; Wang, S.J.; Chen, X.H. Dynamic Evolution and Control Approaches of Petroleum City’s Economic System Vulnerability: A Case Study of Daqing City. Sci. Geogr. Sin. 2015, 35, 456–463. [Google Scholar]
  13. Nguyen, A.K. Spatial-Temporal Eco-Environmental Vulnerability Evaluation and Its Influential Factors Based on Landsat Data, 1st ed.; AGU: San Francisco, CA, USA, 2016. [Google Scholar]
  14. Petrosillo, I.; Zurlini, G.; Grato, E.; Zaccarelli, N. Indicating Fragility of Socio-ecological Tourism-based Systems. Ecol. Indic. 2006, 6, 104–113. [Google Scholar] [CrossRef]
  15. Wen, X.J.; Yang, X.J.; Wang, Z.Q. Evaluation on the Vulnerability of Social-ecological Systems in a Mountainous City Depending on Multi-targets Adaption. Geogr. Res. 2016, 35, 299–312. [Google Scholar]
  16. Yadav, D.K.; Barve, A. Analysis of Socioeconomic Vulnerability for Cyclone-affected Communities in Coastal Odisha, India. Int. J. Disaster Risk Reduct. 2017, 22, 387–396. [Google Scholar] [CrossRef]
  17. Zhang, H.M.; Sha, J.M. RS and GIS Based Study on Fragirity of Ecological Environment in Fuzhou City. J. Nat. Disasters 2007, 16, 133–137. [Google Scholar]
  18. Sahoo, S.; Dhar, A.; Kar, A. Environmental Vulnerability Evaluation Using Grey Analytic Hierarchy Process Based Model. Environ. Impact Eval. Rev. 2016, 56, 145–154. [Google Scholar] [CrossRef]
  19. França, L.C.d.J.; Lopes, L.F.; Morais, M.S.d.; Lisboa, G.d.S.; Rocha, S.J.S.S.d.; Morais Junior, V.T.M.d.; Santana, R.C.; Mucida, D.P. Environmental Fragility Zoning Using GIS and AHP Modeling: Perspectives for the Conservation of Natural Ecosystems in Brazil. Conservation 2022, 2, 24. [Google Scholar] [CrossRef]
  20. Liu, Z.J.; Yu, X.X.; Li, L.; Huang, M. Vulnerability Evaluation of Eco-environment in Yimeng Mountainous Area of Shandong Province Based on SRP Conceptual Model. Chin. J. Appl. Ecol. 2011, 22, 2084–2090. [Google Scholar]
  21. Sun, P.J.; Xiu, C.L. Coupling Degree Evaluation of the Man-Land Coupling System of the Mining City from the Vulnerability Perspective. Areal Res. Dev. 2010, 29, 75–79. [Google Scholar]
  22. Zhang, L.L.; Zheng, X.Q.; Zhang, C.X.; Lv, Y.Q. Early-warning of Urban Vulnerability in Tangshan City-Based on Variable Weight Model. J. Nat. Resour. 2016, 31, 1858–1870. [Google Scholar]
  23. Blaikie, P.; Cannon, T.; Davis, I.; Wisner, B. At Risk: Natural Hazards, People’s Vulnerability and Disasters, 1st ed.; Routledge: London, UK, 1994. [Google Scholar]
  24. Polsky, C.; Neff, R.; Yamal, B. Building Comparable Global Change Vulnerability Evaluations: The Vulnerability Scoping Diagram. Glob. Environ. Chang. 2007, 17, 472–485. [Google Scholar] [CrossRef]
  25. Wang, S.J.; Wang, Y.C.; Feng, Z.X. Generation Procedure, Mechanism and Degree Research of Economic System Vulnerability of Petroleum Cities—A Case Study of Daqing. Econ. Geogr. 2010, 30, 397–402. [Google Scholar]
  26. Li, B.; Yang, Z.; Su, F. Measurement of Vulnerability in Human-sea Economic System Based on Set Pair Analysis: A Case Study of Dalian City. Geogr. Res. 2015, 34, 967–976. [Google Scholar]
  27. Peng, F.; Han, Z.L.; Yang, J.; Zhong, J.Q. Time-space Differentiation of the Vulnerability of Marine Economy Systems in China’s Coastal Area Based on BP Neural Networks. Resour. Sci. 2015, 37, 2441–2450. [Google Scholar]
  28. Feng, Y.; He, D.M. Trans Boundary Water Vulnerability and Its Drivers in China. J. Geogr. Sci. 2009, 19, 189–199. [Google Scholar] [CrossRef]
  29. Hung, L.S.; Wang, C.; Yarnal, B. Vulnerability of Families and Households to Natural Hazards: A Case Study of Storm Surge Flooding in Sarasota County, Florida. Appl. Geogr. 2016, 76, 184–197. [Google Scholar] [CrossRef]
  30. Zou, L.; Wei, Y.M. Impact Evaluation Using DEA of Coastal Hazards on Social-economy in Southeast Asia. Nat. Hazards 2008, 48, 167–189. [Google Scholar] [CrossRef]
  31. Dastour, H.; Ghaderpour, E.; Hassan, Q.K. A Combined Approach for Monitoring Monthly Surface Water/Ice Dynamics of Lesser Slave Lake Via Earth Observation Data. IEEE J. Sel. Top. Appl. Earth Obs. Remote Sens. 2022, 15, 6402–6417. [Google Scholar] [CrossRef]
  32. Zaghloul, M.S.; Ghaderpour, E.; Dastour, H.; Farjad, B.; Gupta, A.; Eum, H.; Achari, G.; Hassan, Q.K. Long Term Trend Analysis of River Flow and Climate in Northern Canada. Hydrology 2022, 9, 197. [Google Scholar] [CrossRef]
  33. Hazaymeh, K.; Sahwan, W.; Al Shogoor, S.; Schütt, B. A Remote Sensing-Based Analysis of the Impact of Syrian Crisis on Agricultural Land Abandonment in Yarmouk River Basin. Sensors 2022, 22, 3931. [Google Scholar] [CrossRef]
  34. Andrade, M.M.N.; Szlafsztein, C.F. A Socioeconomic and Natural Vulnerability Index for Oil Spills in An Amazonian Harbor: A Case Study Using GIS and Remote Sensing. J. Environ. 2010, 91, 1972–1980. [Google Scholar] [CrossRef]
  35. Karimzadeh, S.; Miyajima, M.; Hassanzadeh, R.; Amiraslanzadeh, R.; Kamel, B. A GIS-based Seismic Hazard, Building Vulnerability and Human Loss Evaluation for the Earthquake Scenario in Tabriz. Soil Dyn. Earthq. Eng. 2014, 66, 263–280. [Google Scholar] [CrossRef]
  36. Mao, Y.H.; Yu, D.L.; Zheng, J.H.; Chang, L.L.; Wang, H.L. Progress and Research of Urban Vulnerability. Environ. Sci. Technol. 2017, 40, 97–103. [Google Scholar]
  37. Yang, R.Y.; Du, W.Y.; Yang, Z.S. Spatiotemporal Evolution and Influencing Factors of Urban Land Ecological Security in Yunnan Province. Sustainability 2021, 13, 2936. [Google Scholar] [CrossRef]
  38. Jing, J.L.; Chen, Z.H.; Hu, C.; Wang, Z.M. Study on Eco-environment Fragile Evaluation of Karst Mountains in Southwest China. Geol. Sci. Technol. Inf. 2003, 22, 95–99. [Google Scholar]
  39. Su, W.C. Eco-environmental Fragility in Guizhou Karst Mountain Region and Its Ecological Rehabilitation. China Environ. Sci. 2000, 20, 547–551. [Google Scholar]
  40. Statistics Bureau of Yunnan Province. Yunnan Statistical Yearbook—2021, 1st ed.; China Statistics Press: Beijing, China, 2021. [Google Scholar]
  41. National Bureau of Statistics of the People’s Republic of China. China Statistical Yearbook: 2008–2021, 1st ed.; China Statistics Press: Beijing, China, 2008–2021. [Google Scholar]
  42. Yang, Z.S.; Zhao, Q.G.; Xin, L. Yunnan Land Resources, 1st ed.; China Science and Technology Press: Beijing, China, 2014. [Google Scholar]
  43. Office of Yunnan Provincial Agricultural Zoning Commission. Land Area of Different Climatic Zones and Slopes in Yunnan Province, 1st ed.; Yunnan Science and Technology Press: Kunming, China, 1987. [Google Scholar]
  44. Xu, X.L.; Liu, J.Y.; Zhang, S.W.; Li, R.D.; Yan, C.Z.; Wu, S.X.; Multi-Period Land Use and Land Cover Monitoring Data Set in China (CNLUCC). Beijing: Resource and Environment Science Registration and Publication System, Institute of Geographic Sciences and Natural Resources Research, Chinese Academy of Sciences. Available online: http://www.resdc.cn/DOI (accessed on 26 December 2018).
  45. Liu, J.Y.; Kuang, W.H.; Zhang, Z.X.; Xu, X.L.; Qin, Y.W.; Ning, J.; Zhou, W.C.; Zhang, S.W.; Li, R.D.; Yan, C.Z.; et al. The Land Use and Land Cover Change Database and Its Relative Studies in China. J. Geogr. Sci. 2014, 24, 195–210. [Google Scholar] [CrossRef]
  46. Kuang, W.H.; Zhang, S.W.; Du, G.M.; Yan, C.Z.; Wu, S.X.; Li, R.D.; Lu, D.S.; Pan, T.; Ning, J.; Guo, C.Q.; et al. Remotely Sensed Mapping and Analysis of Spatio-temporal Patterns of Land Use Change Across China in 2015–2020. Acta Geogr. Sin. 2022, 77, 1056–1071. [Google Scholar]
  47. Zhang, F.R.; Wang, J.; Chen, B.M. Evaluation Index System and Method of Sustainable Land Use, 1st ed.; China Agricultural Press: Beijing, China, 2003. [Google Scholar]
  48. Ministry of Environmental Protection of the People’s Republic of China. Industry Standards for Environment Protection HJ 192-2006: Technical Criterion for Ecosystem Status Evaluation, 1st ed.; China Environmental Science Press: Beijing, China, 2006. [Google Scholar]
  49. Department of Environmental Protection of the People’s Republic of China. National Environmental Protection Standard HJ 192-2015: Technical Criterion for Ecosystem Status Evaluation, 1st ed.; China Environmental Science Press: Beijing, China, 2015. [Google Scholar]
  50. Xie, G.D.; Lu, C.X.; Leng, Y.F.; Zheng, D.; Li, S.C. Ecological Assets Valuation of the Tibetan Plateau. J. Nat. Resour. 2003, 18, 189–196. [Google Scholar]
  51. Yang, Z.S. Study on Land Use Changes and Its Ecological Effects in Different Landform Areas in Yunnan Province Driven by China’s Project of Converting Farmland to Forest, 1st ed.; China Science and Technology Press: Beijing, China, 2011. [Google Scholar]
  52. Yang, Z.S.; Yang, R.Y.; Liu, F.L. Spatio-temporal Evolution and Influencing Factors of Urban-rural Income Gap in Yunnan Province Based on Poverty Classification. Geogr. Res. 2021, 40, 2252–2271. [Google Scholar]
  53. Wang, C.; Ding, Z.W.; Jiang, P.; Pan, X.B. Systematic Review and Perspective of the Application of Multi-index Comprehensive Evaluation Method. Plant Prot. 2022, 48, 187–192. [Google Scholar]
  54. Yang, Z.S.; Liu, Y.S. Study on Eco-Friendly Land Use in Mountainous Areas of China, 1st ed.; China Science and Technology Press: Beijing, China, 2007. [Google Scholar]
  55. Office of the Leading Group of the Third National Land Survey of Yunnan Province, Department of Natural Resources of Yunnan Province, Statistics Bureau of Yunnan Province. Main Data Bulletin of the Third National Land Survey of Yunnan Province, 1st ed.; Yunnan Daily: Yunnan, China, 2021. [Google Scholar]
  56. FAO. A Framework for Land Evaluation, 1st ed.; Food and Agriculture Organization of the United Nations: Rome, Italy, 1976. [Google Scholar]
  57. Yang, Z.S. Land Resources Science; Economic Management Press: Beijing, China, 2021. [Google Scholar]
  58. Yang, R.Y.; Zhong, C.B. Land Suitability Evaluation of Sorghum Planting in Luquan County of Jinsha River Dry and Hot Valley Based on the Perspective of Sustainable Development of Characteristic Poverty Alleviation Industry. Agriculture 2022, 12, 1852. [Google Scholar] [CrossRef]
  59. Yang, R.Y.; Yang, Z.S. Can the Sorghum Planting Industry in Less-Favoured Areas Promote the Income Increase of Farmers? An Empirical Study of Survey Data from 901 Samples in Luquan County. Agriculture 2022, 12, 2107. [Google Scholar] [CrossRef]
Figure 1. Geographic location of the study Aaea. (a) Location of Yunnan Province in China; (b) distribution of 129 counties in Yunnan Province.
Agriculture 13 00682 g001
Figure 2. Remote sensing image interpretation in 2000, 2010, and 2020 in Yunnan Province.
Agriculture 13 00682 g002
Figure 3. Land use/land cover maps of Yunnan Province: (a) 2000; (b) 2010; (c) 2020.
Agriculture 13 00682 g003
Figure 4. Ecological vulnerability evaluation of rural areas in Yunnan Province from 2000 to 2020.
Agriculture 13 00682 g004
Figure 5. Economic vulnerability evaluation of rural areas in Yunnan Province from 2000 to 2020.
Agriculture 13 00682 g005
Figure 6. Social vulnerability evaluation of rural areas in Yunnan Province from 2000 to 2020.
Agriculture 13 00682 g006
Figure 7. Overall vulnerability evaluation of rural areas in Yunnan Province from 2000 to 2020.
Agriculture 13 00682 g007
Table 1. Detailed Information of the Remote Sensing Images of Three Different Phases.
YearRemote Sensing Image DataSpatial Resolution (m)
2000Landsat-TM/ETM remote sensing images from December 1999 to February 200030
2010Landsat-TM remote sensing images from December 2009 to February 201030
2020Landsat-8 remote sensing images from January 2020 to February 202030
Table 2. Rural Vulnerability in Yunnan: Evaluation Indicator System, Computing Approaches, Data Acquisition Techniques, and Evaluation Criteria.
Types of IndicatorsEvaluation IndexesElement IndicatorsComputing Methods and
Explanations
Primary Data Acquisition MethodsOptimal Relative Value
1. Degrees of Rural Ecological Vulnerability Evaluation Indicators (DREV−1)1–1 Index of Mountain Area (IMA)Mountain Area (MLA)IMA = (MAR−Minimum MAR)/Minimum MAR × 100The Second National Land Survey in Yunnan Province Dam Area Special SurveyIt depends on the background of the region. It takes the minimum MAR in Yunnan Province as the relative optimal value.
Total Land Area (TLA)MAR (Mountain Area Rate) = MLA/TLA × 100%
1–2 Index of Steep Slope Area (ISSA)≥25° Steep Slope Area (SSA)ISSA = SSAR/Maximum SSAR × 100Special Survey of Land Area in Different Climatic Zones and Slopes in Yunnan ProvinceConsidering the regional background and rural development needs, the proportion of steep slope area in the province’s relatively largest county is taken as the relative minimum value. The closer the ratio of SSA is to 0, the better the ISSA.
Total Land Area (TLA)SSAR (Steep Slope Area Rate) = SSA/TLA × 100%
1–3 Index of High-Altitude Area (IHAA)High-Altitude Area (HA)IHAA = HAR/Maximum HAR × 100Special Survey of Land Area in Different Climatic Zones and Slopes in Yunnan ProvinceConsidering the regional background and the needs of rural development, the proportion of high-altitude area in the province’s relatively largest county is the relative minimum. The closer the ratio of HA is to 0, the better the IHAA is.
Total Land Area (TLA)HAR (High−Altitude Area Rate) = HA/TLA × 100%
1–4 Index of Over-Reclaimed Rate (IOR)Land Suitable Reclamation Rate (LSRR)IOR = ORR/Maximum ORR × 100Land Suitability EvaluationActual reclamation rate ≤ suitable reclamation rate (i.e., over-reclaimed rate = 0).
Actual Land Reclamation Rate (ALRR)ORR (Over−Reclaimed Rate) = (ALRR−LSRR)/LSRR × 100%Remote Sensing Image Interpretation
1–5 Index of Bare Land Area (IBLA)Bare Land Area (BLA)IBLA = BLAR/Maximum BLAR × 100Remote Sensing Image Interpretation0
Total Land Area (TLA)BLAR (Bare Land Area Rate) = BLA/TLA × 100%
1–6 Index of Effective Irrigated Area of Cultivated Land (IEI)Effective Irrigated Area of Cultivated Land (EIA)IEI = 100−EIR/Maximum EIR × 100Remote Sensing Image InterpretationThe higher the effective irrigation rate of cultivated land, the lower the vulnerability.
Cultivated Area (CA)EIR (Effective Irrigated Rate of Cultivated Land = Paddy Field Area)/CA × 100%
1–7 Index of Forest coverage Rate (IFC)Closed Forest Area (CFA)IFC = FCR/Maximum FCR × 100Remote Sensing Image Interpretation≥67% (Planning for forest coverage in Yunnan Province by 2035).
Total Land Area (TLA)FCR (Forest Coverage Rate) = CFA/TLA × 100%
1–8 Index of Biological Richness Conversion (IBRC)Index of Biological Richness (IBR)IBRC = (Maximum IBRIBR)/(Maximum IBR–Minimum IBR) × 100
IBR = Abio × (Woodland Area × 0.35 + Grassland Area × 0.21 + Waters Area × 0.28 + Cultivated Land Area × 0.11 + Construction Land Area × 0.04 + Unused Land Area × 0.01)/Total Land Area
Abio = 511.2642 [48,49]
Calculate According to the Interpretation Results of Remote Sensing ImagesIt depends on the background of the region. According to the counties in Yunnan Province with the best ecological protection, the relative optimal value was determined.
1–9 Index of Ecosystem Services Value (IESV)Ecological Service Value per Unit Land Area (VES)IESV = (Maximum VES−VES)/(Maximum VES–Minimum VES) × 100
VES is calculated according to Xie Gaodi et al. [50] (2003) and the corresponding estimation method [51]
Calculate According to the Interpretation Results of Remote Sensing ImagesIt depends on the background of the region. The counties with the best value of ecological service were used to determine the relative optimal value.
2. Degrees of Rural Economic Vulnerability Evaluation Indicators (DREV−2)2–1 Index of Comprehensive Land Productivity (ICLP)Comprehensive Land Productivity (CLP)ICLP = (ln (Maximum CLP)–ln (CLP))/(ln (Maximum CLP)–ln (Minimum CLP)) × 100Socioeconomic Statistics and Remote Sensing Image InterpretationIt depends on the background of the region. It takes the county land comprehensive productivity, which is the highest in the province, as the relative optimal value.
National Average Comprehensive Land Productivity (NACLP)CLP = GDP/TLA × 100%.
Because the index data of some years and counties are not stable, the calculation formula is treated as a natural logarithm. IALP, IPOV, IGROV IGRDI, and IRPYG are the index of the growth rate of the rural per capita output value. They are the same, aiming to make each index more stable [52]. It takes 100 when the ICLP value is more than 100.
2–2 Index of Agricultural Land Productivity (IALP)Agricultural Land Productivity (ALP)IALP = (ln (Maximum ALP)–ln (ALP))/(ln (Maximum ALP)–ln (Minimum ALP)) × 100Socioeconomic Statistics and Remote Sensing Image InterpretationIt depends on the background of the region. It takes the maximum ALP in the province as the relative optimal value.
National Average Agricultural Land Productivity (NAALP)ALP = Output Value of Primary Industry/Agricultural Land Area × 100%
2–3 Index of Rural Per Capita Output Value (IPOV)Output Value of Primary Industry (OVPI)IPOV = (ln (Maximum RPCPI)−ln (RPCPI))/(ln (Maximum RPCPI)−ln (minimum RPCPI)) × 100Socioeconomic
Statistics
It depends on the background of the region. It takes the maximum RPCPI in the province as the relative optimal value.
Rural Registered Residence Population (RRRP)RPCPI (Rural Per Capita Output Value of Primary Industry) = OVPI/RRRP
2–4 Index of the Growth Rate of Rural Per Capita Output Value (IGROV)Rural Per Capita Output Value of Primary Industry in Current Year (RPCPIC)IGROV = (ln (Maximum GRPCPI)−ln (GRPCPI))/(ln (Maximum GRPCPI)−ln (Minimum GRPCPI)) × 100Socioeconomic
Statistics
It depends on the background of the region. It takes the maximum GRPCPI in the province as the relative optimal value.
Rural Per Capita Output Value of Primary Industry in the Previous Year (RPCPIP)GRPCPI (Growth Rate of Rural Per Capita Output Value of Primary Industry) = (RPCPIC−RPCPIP)/RPCPIP × 100%
2–5 Index of Proportion of Output Value of Primary Industry (IPIOV)Output Value of Primary Industry (OVPI)IPIOV = (Maximum POVPI−POVPI)/(Maximum POVPI–Minimum POVPI) × 100Socioeconomic
Statistics
It depends on the background of the region. It takes the maximum POVPI in the province as the relative optimal value.
Gross Domestic Product (GDP)POVPI (Proportion of Output Value of Primary Industry) = OVPI/GDP × 100%
2–6 Index of the Yield of Grain Crops per Hectare (IYGC)Total Grain Output (TGO)IYGC = (Maximum GYPUA–GYPUA)/(Maximum GYPUA–Minimum GYPUA) × 100Socioeconomic
Statistics
It depends on the background of the region. It takes the maximum GYPUA in the province as the relative optimal value.
Sown Area of Grain Crops (SAGC)GYPUA (Grain Yield per Unit Area) = TGO/SAGC
3. Degrees of Rural Social Vulnerability Evaluation Indicators (DRSV)3–1 Index of Rural Population Density (IRPD)Rural Registered Residence Population (RRRP)IRPD = (Maximum RPD−RPD)/(Maximum RPD–Minimum RPD) × 100Socioeconomic
Statistics
It depends on the background of the region. It takes the maximum RPD in the province as the relative optimal value.
Rural Land Area (RLA)RPD (Rural Population Density) = RRRP/RLARemote Sensing Image Interpretation
3–2 Index of Proportion of Employees in Rural Areas (IERA)Rural Employees (RE)IERA =(Maximum PRE−PRE)/(Maximum PRE–Minimum PRE) × 100Socioeconomic
Statistics
It depends on the background of the region. It takes the minimum PRE in the province as the relative optimal value.
Rural Registered Residence Population (RRRP)PRE (Proportion of Rural Employees) = RE/RRRP × 100%
3–3 Index of Per Capita Disposable Income of Rural Residents (IDIR)Per Capita Disposable Income of Regional Rural Residents (PCDI)IDIR = (Maximum PCDI−PCDI)/(Maximum PCDI–Minimum PCDI) × 100Socioeconomic
Statistics
It depends on the background of the region. It takes the maximum PCDI in the province as the relative optimal value.
3–4 Index of the Growth Rate of Per Capita Disposable Income of Rural Residents (IGRDI)Per Capita Disposable Income of Rural Residents in Current Year (PCDIC)>IGRDI = (ln (Maximum GRDI)−ln (GRDI))/(ln (Maximum GRDI)−ln (Minimum GRDI)) × 100Socioeconomic
Statistics
It depends on the background of the region. It takes the maximum GRDI in the province as the relative optimal value.
Per Capita Disposable Income of Rural Residents in the Previous Year (PCDIP)>GRDI (Growth Rate of Per Capita Disposable Income of Rural Residents) = (PCDIC–PCDIP)/PCDIP × 100%
3–5 Index of Rural Per Capita Yield of Grain Crops (IRPYG)Rural Registered Residence Population (RRRP)IRPYG = (ln (Maximum RPYG)–ln (RPYG))/(ln (Maximum RPYG)–ln (Minimum RPYG)) × 100Socioeconomic
Statistics
It depends on the background of the region. The relative optimum value is taken to be the highest RPYG in the province.
Total Grain Output (TGO)RPYG (Rural Per Capita Yield of Grain Crops) = TGO/RRRPSocioeconomic Development Planning
Table 3. Weights of the Indicators at All Levels of the Regional Rural Vulnerability Evaluation.
First-Level IndicatorsWeightFirst-Level IndicatorsWeightFirst-Level IndicatorsWeight
DREV−10.38DREV−20.32DRSV0.30
Second-Level IndicatorsWeightSecond-Level IndicatorsWeightSecond-Level IndicatorsWeight
IMA0.15ICLP
IALP
IPOV
IGROV
IPIOV
IYGC
0.18
0.21
0.17
0.12
0.15
0.17
IRPD
IERA
INIR
IGRDI
IRPYG
0.18
0.17
0.30
0.19
0.16
ISSA0.13
IHAA0.10
IOR0.12
IBLA0.08
IEI0.10
IFC0.12
CIBR0.09
IESV0.11
Table 4. Grading System and Standards for rural Ecological vulnerability, economic vulnerability, social vulnerability, and overall vulnerability.
Grade of Each VulnerabilityDREV−1DREV−2DRSVDROV
1. Very Slightly Vulnerable˂35˂35˂35˂35
2. Lowly Vulnerable35~4535~4535~4535~45
3. Moderately Vulnerable45~5545~5545~5545~55
4. Highly Vulnerable55~6555~6555~6555~65
5. Very Highly Vulnerable≥65≥65≥65≥65
Table 5. Index System and Calculation Method of Influencing Factors.
DimensionVariableCalculation MethodNameUnit
Industrial EconomyDevelopment Level of Primary Industryln (output value of primary industry/rural registered residence population)X1CNY/Person
Development Level of Secondary Industryln (output value of secondary industry/urban registered residence population)X2CNY/Person
Development Level of Tertiary Industryln (output value of tertiary industry/total population)X3CNY/Person
GDP Per Capitaln (current year’s GDP/total population)X4%
Nighttime Light Brightnessln (nighttime light + 0.01)X5None
Investment ExpenditureFixed Assets Investment Levelln (total fixed assets investment/total population)X6CNY/Person
Per Capita Public Financial Expenditureln (public finance expenditure/total population)X7CNY/Person
Population StructureUrbanization Level(total population—agricultural population)/total population × 100%X8%
Per Capita Construction Land Arealn (total area of construction land/total population)X9m2/Person
Population Densityln (total population/land area)X10Person/km2
Ecological EnvironmentIndex of Biological RichnessCalculated according to Table 3X11None
Normalized Difference Vegetation Index (NDVI)Average normalized difference vegetation index in the region in the current yearX12None
Geographical ConditionsTerrain Predominance DegreeProportion of land area with slope ≤ 8° × 1 + proportion of land area with slope of 8°~15° × 0.75 + proportion of land area with slope of 15°~25° × 0.5 + proportion of land area with slope of 25°~35° × 0.25 + proportion of water area × 0.9X13None
Climate Predominance DegreeLower thermosphere × 1 + medium warm layer × 0.8 + alpine layer × 0.5 + others × 0.9X14None
Table 6. Moran’s I Calculation Results of Various Types of Rural Vulnerability in Yunnan Province from 2000 to 2020.
DimensionItemsIn 2000In 2010In 2020Annual Average
Ecological VulnerabilityMoran’s I0.450 ***0.441 ***0.445 ***0.450 ***
Z Statistics8.6518.4788.5478.639
p Values0.0000.0000.0000.000
Social VulnerabilityMoran’s I0.531 ***0.521 ***0.465 ***0.530 ***
Z Statistics10.17710.0028.96510.166
p Values0.0000.0000.0000.000
Economic VulnerabilityMoran’s I0.500 ***0.513 ***0.537 ***0.571 ***
Z Statistics9.6069.95610.39011.049
p Values0.0000.0000.0000.000
Overall VulnerabilityMoran’s I0.537 ***0.552 ***0.515 ***0.544 ***
Z Statistics10.28610.6079.92610.461
p Values0.0000.0000.0000.000
Note: *** indicate the significance level of 1%.
Disclaimer/Publisher’s Note: The statements, opinions and data contained in all publications are solely those of the individual author(s) and contributor(s) and not of MDPI and/or the editor(s). MDPI and/or the editor(s) disclaim responsibility for any injury to people or property resulting from any ideas, methods, instructions or products referred to in the content.

