Article

Towards a Low-Cost Comprehensive Process for On-Farm Precision Experimentation and Analysis †

1
Department of Land Resources and Environmental Sciences, Montana State University, Bozeman, MT 59717, USA
2
Gianforte School of Computing, Montana State University, Bozeman, MT 59717, USA
*
Author to whom correspondence should be addressed.
This research work is the part of Paul Hegedus’ Ph.D. Thesis.
Agriculture 2023, 13(3), 524; https://doi.org/10.3390/agriculture13030524
Submission received: 2 December 2022 / Revised: 12 February 2023 / Accepted: 21 February 2023 / Published: 22 February 2023
(This article belongs to the Topic Innovation and Solution for Sustainable Agriculture)
(This article belongs to the Section Agricultural Systems and Management)

Abstract

:
Few mechanisms turn field-specific ecological data into management recommendations for crop production with appropriate uncertainty. Precision agriculture is mainly deployed for machine efficiencies and soil-based zonal management, and the traditional paradigm of small plot research fails to unite agronomic research and effective management under farmers’ unique field constraints. This work assesses the use of on-farm experiments applied with precision agriculture technologies and open-source data to gain local knowledge of the spatiotemporal variability in agroeconomic performance on the subfield scale to accelerate learning and overcome the bias inherent in traditional research approaches. The on-farm precision experimentation methodology is an approach to improve farmers’ abilities to make site-specific agronomic input decisions by simulating a distribution of economic outcomes for the producer using field-specific crop response models that account for spatiotemporal uncertainty in crop responses. The methodology is the basis of a decision support system that includes a six-step cyclical process that engages precision agriculture technology to apply experiments, gather field-specific data, incorporate modern data management and analytical approaches, and generate management recommendations as probabilities of outcomes. The quantification of variability in crop response to inputs and drawing on historic knowledge about the field and economic constraints up to the time a decision is required allows for probabilistic inference that a future management scenario will outcompete another in terms of production, economics, and sustainability. The proposed methodology represents advancement over other approaches by comparing management strategies and providing the probability that each will increase producer profits over their previous input management on the field scale.

1. Introduction

The challenge of moving toward more sustainable agriculture includes the identification of practices that will simultaneously increase farm profits, promote environmental stewardship, enhance the quality of life of farmers and rural communities, and increase agricultural production [1,2,3]. To achieve sustainability, agricultural practices must recognize the tradeoffs between production, profitability, and environmental impact, regarding agronomic inputs, that are required to increase production while maintaining the resource base on which agriculture relies [4,5]. The tools and technology of precision agriculture (PA) hold great potential for sustainable management through the quantification of the tradeoffs of agronomic inputs on the field scale where input management decisions are made [6,7].
Developed nations have been the primary adopter of precision agriculture tools and technology due to the economy of scale in industrial farm operations, but industrial agriculture in these nations also contributes the most to global agricultural inefficiency and pollution [8,9]. PA is generally regarded as a management approach based on a collection of tools that use spatial information to inform agricultural production practices that could be applied on a subfield scale [10]. These tools include GPS guidance technology, crop yield maps, and decision support tools that draw on the spatial information. PA is often perceived as a replacement of local stakeholder knowledge, giving rise to farmers’ fears of the use of the technology for farmer replacement and the potential of “ecological dystopias” [11,12]. On-farm experimentation (OFE) is an objective mechanism to reduce inaccuracies stemming from small plot research when extrapolated across many miles and to improve upon local trial-and-error-based knowledge by using locally parameterized agroecological models that include local spatial and temporal variation and incorporate and augment the farmers’ knowledge necessary for locally relevant decision making, rather than replacing traditional knowledge [6,13,14]. OFE brings farmer research to the fields on which decisions about agronomic inputs are made and approaches the complexities of agronomic management on a field-specific basis [15].
Crop responses vary over time due to factors such as weather [16], and the response of crops to varying agronomic input rates also varies, indicating the potential for site-specific agronomic management to increase profitability and sustainability [16,17]. OFE shifts the paradigm of agronomic research to “operational research” by using observations from farms rather than from the closest geographic research station to objectively inform management decisions [18,19]. The benefits of OFE have been studied and include increased productivity and profits, and it has shown results in the adoption of sustainable practices simply by increasing the local knowledge of system performance [20,21].
Yet, there is a significant research gap on how OFE and PA can be combined in a way for farmers to apply the knowledge gained from each set of tools and methods into an actionable management strategy that promotes crop production and sustainability. The literature calls for holistic, flexible, and dynamic decision support systems that include ongoing assessments and the strategic monitoring of agroecological monitoring [22]. Decision support systems provide the basis for creating management recommendations; however, the development and adoption of decision aids in agronomic management have been severely lacking in development [23,24]. In this paper, we address the gap in the literature on the development of decision support systems rooted in adaptive management by providing the conceptual underpinnings for a decision support tool that combines PA with OFE. We have developed a framework for generating management recommendations for farmers that focuses on the maximization of crop production and sustainability, called the on-field precision experimentation (OFPE) agricultural management methodology. This flexible methodology specifically quantifies the uncertainty in management outcomes based on local spatial and temporal variability and presents the uncertainty as probabilities of improving upon farmers’ traditional approaches.
The objectives of the OFPE methodology were to (1) use precision agriculture technology to implement on-farm experimentation for the collection of data required to model crop responses to spatially varying agronomic inputs, (2) apply open-source data and data collected from farmers’ operations to develop field-specific crop response models to spatially varying agronomic inputs, (3) create a model-based approach for providing farmers with recommendations for the management of agronomic inputs that quantify spatial and temporal variability, (4) provide farmers with probabilistic outcomes of various management strategies that allow farmers to make data-driven decisions about their field management, and (5) frame the steps of the methodology as a theoretical decision support system that can be repeatedly applied to fields over time. In the sections below, we first begin by outlining the six-step methodology before describing each step in detail. This includes reviewing some basic aspects of PA approaches that are important underpinnings to the novel aspects of the methodology that follow. Then, we describe case studies of research conducted and reported on by the authors of this paper which highlight results from the application of the OFPE methodology. The methodology has been developed and applied over the past 6 years in 30 conventional and organic dryland wheat fields in the Northern Great Plains (NGP) of the United States; however, it has the potential to be adapted and used in any agronomic system.

2. Materials and Methods

2.1. Overview

The goal of the OFPE methodology was to provide crop managers with an approach for generating management recommendations that can aid in decision making to increase production, profit, and sustainability. Management recommendations for farmers using the OFPE methodology were derived and evaluated through a six-step process. The steps are outlined below and are delved into in more detail in the sections below. Currently, all steps of the OFPE methodology are automated and available as an open-source R package called OFPE via GitHub (https://github.com/paulhegedus/OFPE (accessed on 1 January 2020)).
  • Step 1A: first, a database management system was required to facilitate the storage and organization of ecological field-specific data.
  • Step 1B: the development of on-farm experiments was implemented to assess the ecological relationship between the crop, the environment, and the agronomic input of interest.
  • Step 2: PA equipment and technology were used for the application of experiments and the collection of field-specific data [6,16]. Additionally, data from open-source data repositories were gathered.
  • Step 3: on-farm data and data from open-source data repositories were aggregated together on a grid across each field to create analysis-ready datasets for ecological modeling.
  • Step 4: statistical and machine learning models that characterize the ecological interactions among crop responses, the environment (topographic, weather, and edaphic features), and experimentally varied agronomic inputs were trained with data aggregated from on-farm and internet-available open sources, such as remote sensing data from satellites.
  • Step 5A: Simulations were uniquely used to predict the probability of outcomes under spatial and temporal variable conditions to generate agronomic input recommendations while considering uncertainty in future weather and economic conditions. Historic weather data were sampled to emulate potentially anomalous futures given that weather conditions were used as independent variables in the crop response functions [25].
  • Step 5B: based on predetermined goals and modeled crop responses across simulations, optimized input rates were identified on a site-specific basis.
  • Step 5C: management outcomes, ranging from farmers’ traditionally selected rates to site-specific optimized rates, were evaluated and presented to farmers and crop managers as a probabilistic output, crucially leaving decisions about future management in the hands of the farmers themselves.
  • Step 6: Part of the field was then prescribed the newly selected optimization strategy, and part was left in experimental blocks for continued understanding of the temporal variation seen across years. Over time, areas reserved for experimental blocks were reduced to increase field optimization and farmer profit.
While we recognize that Steps 1–3 are elementary and common steps in many PA approaches, we have described them in this paper because, although not novel themselves, when combined with the other steps they make up the novel OFPE methodology.
The OFPE methodology was developed on dryland winter wheat systems in Montana, USA, with the objective of optimizing top-dress nitrogen fertilizer rates based on maximizing farmer profits and minimizing nitrogen fertilizer use. The method has since been tested in other places, in other rotation systems, and with other inputs such as certified organic fields to identify optimized cash crop and cover crop seeding rates based on maximizing profit from wheat grain yields. The adoption of the OFPE methodology by the Data-Intensive Farm Management (DIFM) project trials in eight states and multiple countries [26] demonstrates the flexibility and adaptability of the approach, as the field-specific nature of the methodology relies only on data from a specific field and performs model selection to identify the form that best characterizes crop responses in a specific field [27].
Five principles distinguish the OFPE methodology from other agronomic decision-making approaches. First, experiments are intended to inform management on the field where OFPE was conducted under the assumption that field history can have a significant impact on response to inputs [16]. Second, all variables used to predict crop responses are from open-source or farmer-owned data that are available up to the time of an input application decision [25]. Third, predictive ecological models built specifically for each field evolve as new data are collected in subsequent years capturing temporal dynamics due to weather and economic variability [27]. Fourth, the manager can simulate management outcomes given different previous weather (precipitation and temperature), price, and cost conditions associated with the previous 20 years, so all economic variables associated with a farm are linked with weather variables from each year. Thus, a crop manager can simulate the conditions most closely matching the current conditions, or they may explore a possible range of outcomes under different assumed conditions (e.g., projected climate change). Finally, the manager can use the simulations to compare different management application approaches (site-specific variable rate application, model-selected uniform rate application, a farmer-selected uniform rate, or application of the minimum rate possible) and determine the probability (based on uncertainty of outcomes) that site-specific management will produce a higher return on investment compared to other approaches.

2.2. Step 1A—Database Management Preparation

The deployment and development of the OFPE methodology centers around a data management system that stores and facilitates the organization of the spatiotemporal data collected by PA equipment and satellites. Prior to the implementation of the OFPE methodology, a database was created to contain farm and field information, such as boundaries, grain yield, grain protein, agronomic input, and remotely sensed data. The development of the OFPE methodology in this work used a secure PostgreSQL spatial database housed on a cloud-based virtual machine to store farm and field information from farmer collaborators. A key component of the OFPE methodology was gathering open-source data that was expected to have an ecological relationship with crop yield or quality. In our case, vegetation index data, weather variables, and soil characteristics were gathered from freely available repositories and used as predictors in crop response functions and for simulating outcomes in different years. This database also contained all of the open-source, on-farm, and as-applied data gathered from experimental fields. The data management system serves as the keystone of the “ecosystem” needed for digitally informed agriculture [26].

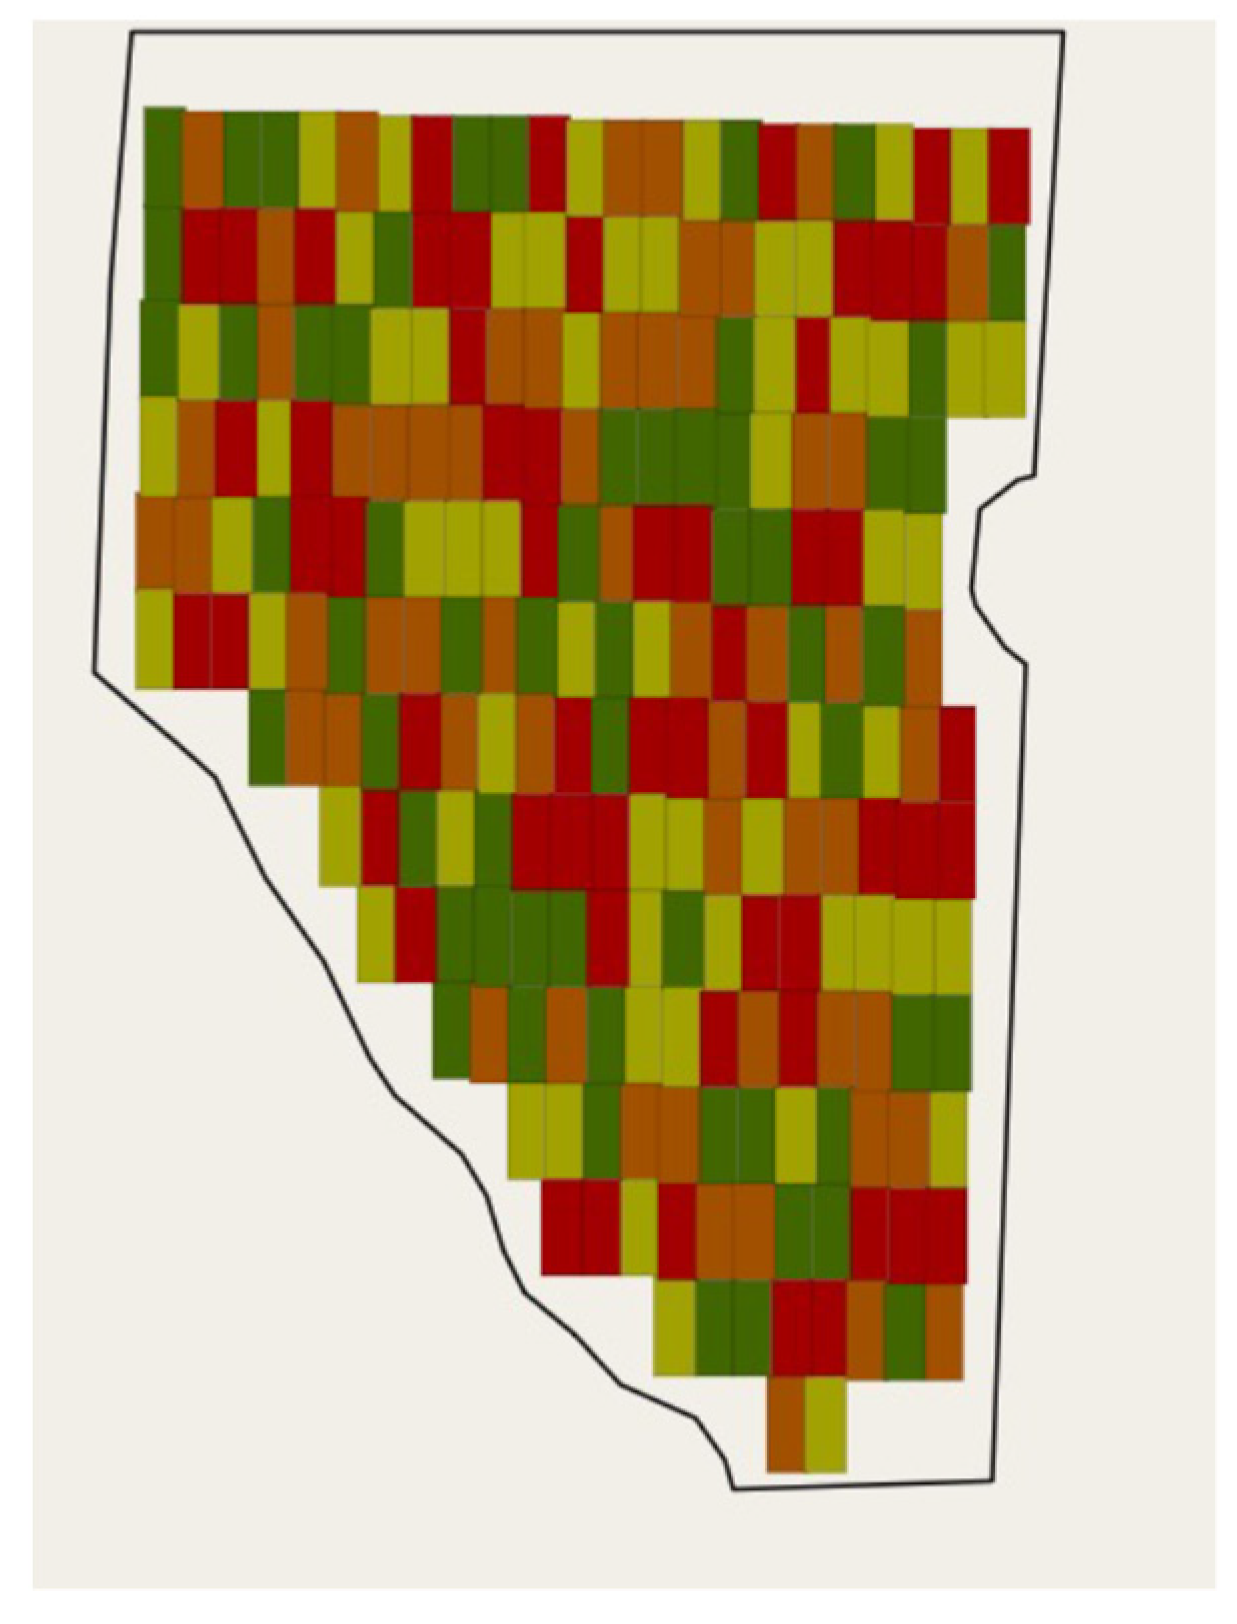
2.3. Step 1B—Experimentation

The first step in the OFPE methodology was the generation of field-specific experiments. Experiments can be generated in any design selected by the user in the OFPE methodology, to be flexible to context-specific research objectives, and to comply with restrictions due to farm equipment. To identify the optimal input rates, experiments should attempt to apply each experimental rate representatively across the entire field and in some cases across previous crop responses as blocks of rates to capture potential subfield variation in crop responses. Experimentally varying agronomic inputs, such as nitrogen fertilizer or crop seeding rate, underpin the OFPE methodology by generating the datasets required for modeling field-specific crop responses [26]. OFE using PA technology can take many forms, ranging from the random assignment of agronomic input rates stratified on previous data, such as yield, to more structured experimental designs [28]. The best practices of OFPE include trial plots that exceed 120 m to allow equipment to change rates between plots and widths equivalent to at least two equipment passes to generate statistically qualified designs [29,30]. Farmers and crop managers can design experiments using the OFPE methodology online via an open-source web application created by the authors (http://trialdesign.difm-cig.org, accessed on 1 January 2021)).
Prior research has indicated that repeated PA-based experimentation in dryland Montana systems for 6–8 years was necessary to fully parameterize (capture temporal variability) Bayesian empirical models of grain yield and grain protein concentration responses to experimentally varied nitrogen fertilizer rates [31]. However, the number of years that experimentation is required for may vary by field, depending on the uncertainty introduced by climate change and shifting temporal trends in precipitation and temperature [32]. A backlog of experimental data from years with a diverse range of weather conditions increases the likelihood that a given model can accurately simulate the uncertainty in crop responses in unknown conditions of future years [27].
Initial experiments in a field with the OFPE methodology require experiments that cover an adequate range of agronomic input rates from which a relationship between crop responses and the input can be identified. Beyond the representation of rates, initial experiments should also spatially represent the entire field (Figure 1).
We hypothesize that as experimentation is repeated on a given field, the range of rates represented each year, as well as the amount of the field covered in experimental rates, can be minimized to diminish the influence of experimentation on management while retaining statistical relevance. Yet, the minimization of the experimental area while retaining statistical efficacy of the experiments continues to be an open research question. After experiments were designed for a given field, they were reviewed by the farmer to incorporate any agronomic adjustments they may have wished to make.

2.4. Step 2—Data Collection

The second step in the OFPE process involved data collection from farms and open internet sources. The field experimental design map was given to a farmer for application, typically using variable rate application (VRA) technology, was read by their input machine (e.g., seeder, sprayer, etc.), and the rates were applied accordingly. The application data were downloaded from the equipment and imported into the data management system to account for differences between the prescription and actual application due to practical limits on machinery. After harvest, crop response data were gathered from monitors mounted on combines. Crop response data included yield monitor data but can also include other crop response metrics, such as crop quality and grain protein concentration.
With the aim of supporting a low-cost decision support system, the OFPE methodology only utilized data collected from normal farm operations and data available from open sources. This means that the OFPE process did not require data that came at an additional cost in terms of time or money. Thus, in addition to data collected on farms, data from open-source data repositories were utilized to provide field-specific information not gathered from farmers’ equipment. These data included information about the crop or environment which were useful prior to input application as they provided current field conditions such as water availability, crop condition, and weed presence. Multiple open-source data repositories provide easily accessible environmental data, such as Google Earth Engine [33]. Examples of supplementary data collected from Google Earth Engine include vegetation index, water index, and topographic, weather, and soil characteristic data (Table 1).
An important aspect of the OFPE methodology was the temporal constraint placed on covariate data. All farmers face a point in time at which decisions about inputs must be made. With modern satellite data collected at a weekly or daily resolution, farmers now have access to current data up to the time of an application decision without additional cost. Thus, temporal data used in crop response models of the OFPE methodology were collected up to the decision point (e.g., mid-crop growth period before top-dress nitrogen fertilizer application) to maximize the amount of information available at the time of decision making [25].

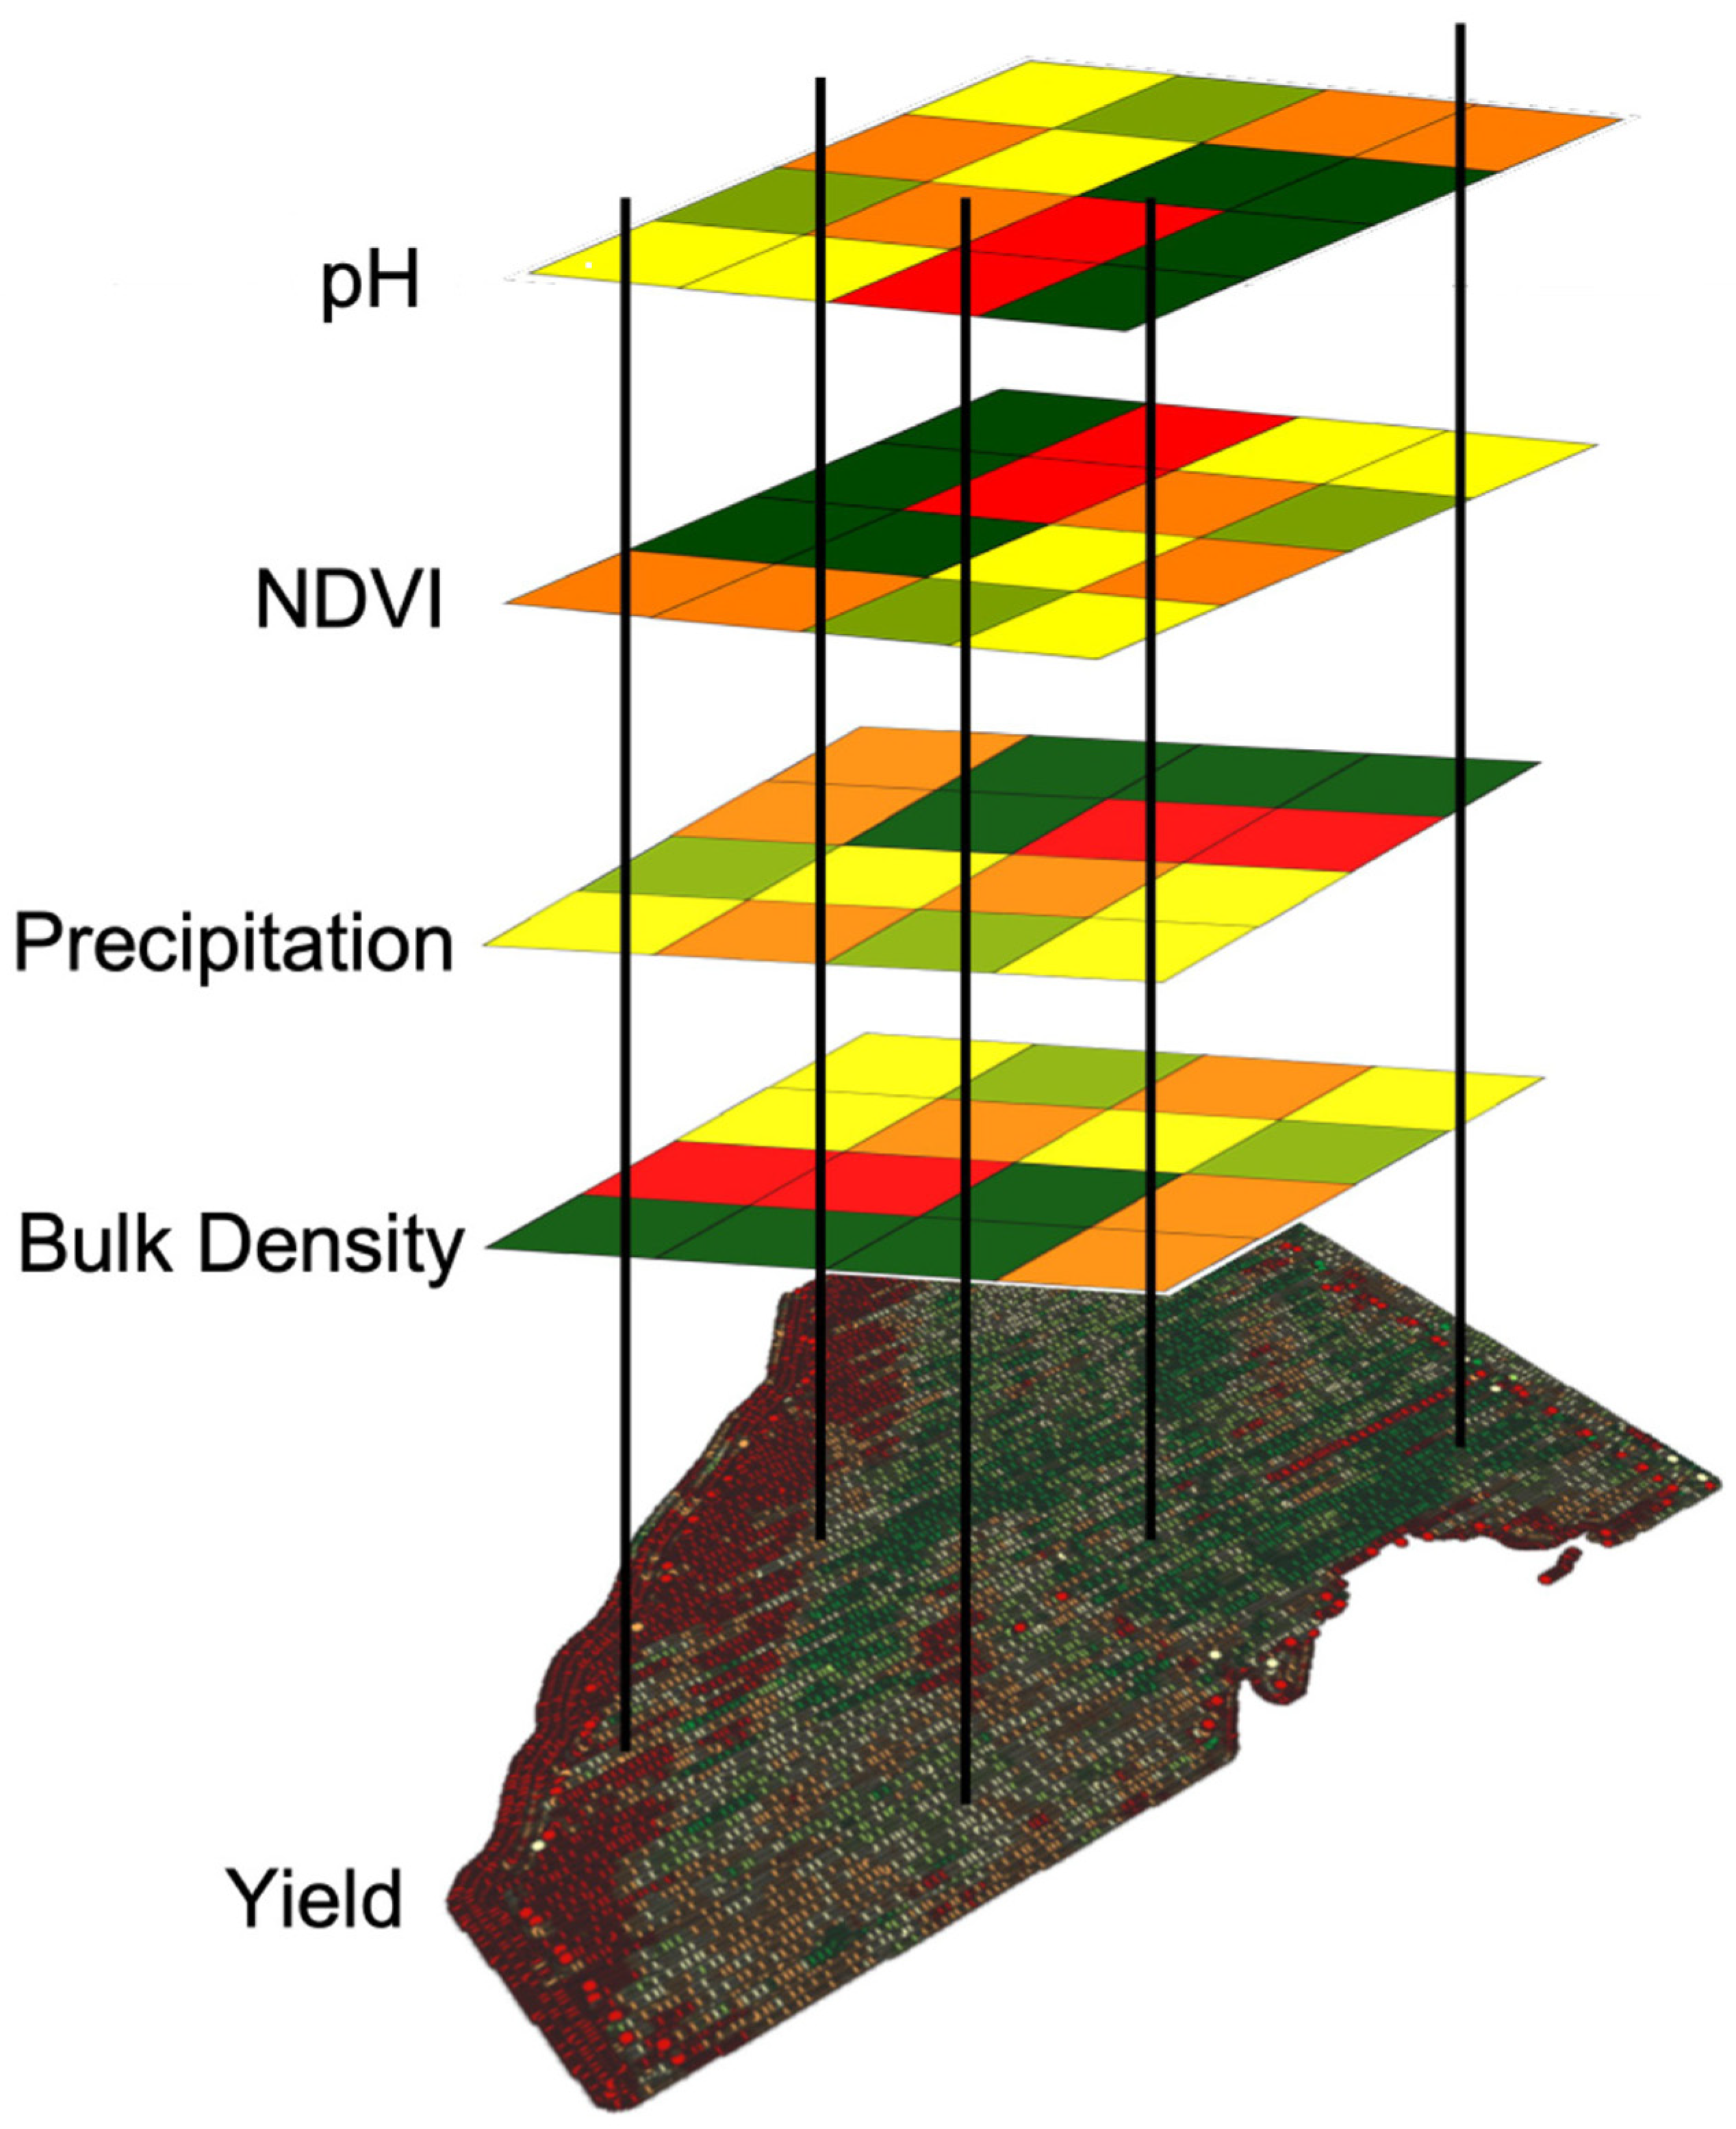
2.5. Step 3—Data Aggregation

The on-farm and remotely sensed data had to be combined into georeferenced datasets before analysis (Figure 2). During this aggregation process, the data required rectifying variation in the resolution of data from disparate sources because differences in resolutions between data can introduce uncertainty [34,35]. The resolution of covariate data collected from satellite sensors ranged from 10 m for some vegetation index data to 1 km for weather data such as precipitation and growing degree days. On the other hand, the temporal resolution of grain yield and protein measurements was 3 and 10 s, respectively, with spatial resolution across fields thus depending on the velocity and cutter bar width of the harvester. The OFPE methodology was developed using a scale of 10 m for data aggregation, though users of the methodology would have the power to decide on the scale appropriate for their system based on their machinery size. The 10 m scale was the smallest resolution at which open-source data in the development process were gathered, meaning that no upscaling of open-source data was required. Variability is lost when smoothing over space; thus, the 10 m scale was selected to minimize the loss of information when taking the median of multiple observations in one grid cell. A caveat is that many of the open-source datasets used were collected or calculated at resolutions greater than 10 m. We recognize that uncertainty was introduced when using coarse resolution data at the 10 m scale because information about fine scale variation in those data was missing. No attempts at downscaling were made as downscaling is beyond the scope of this paper, though this topic represents an area in which future research could benefit the OFPE project.

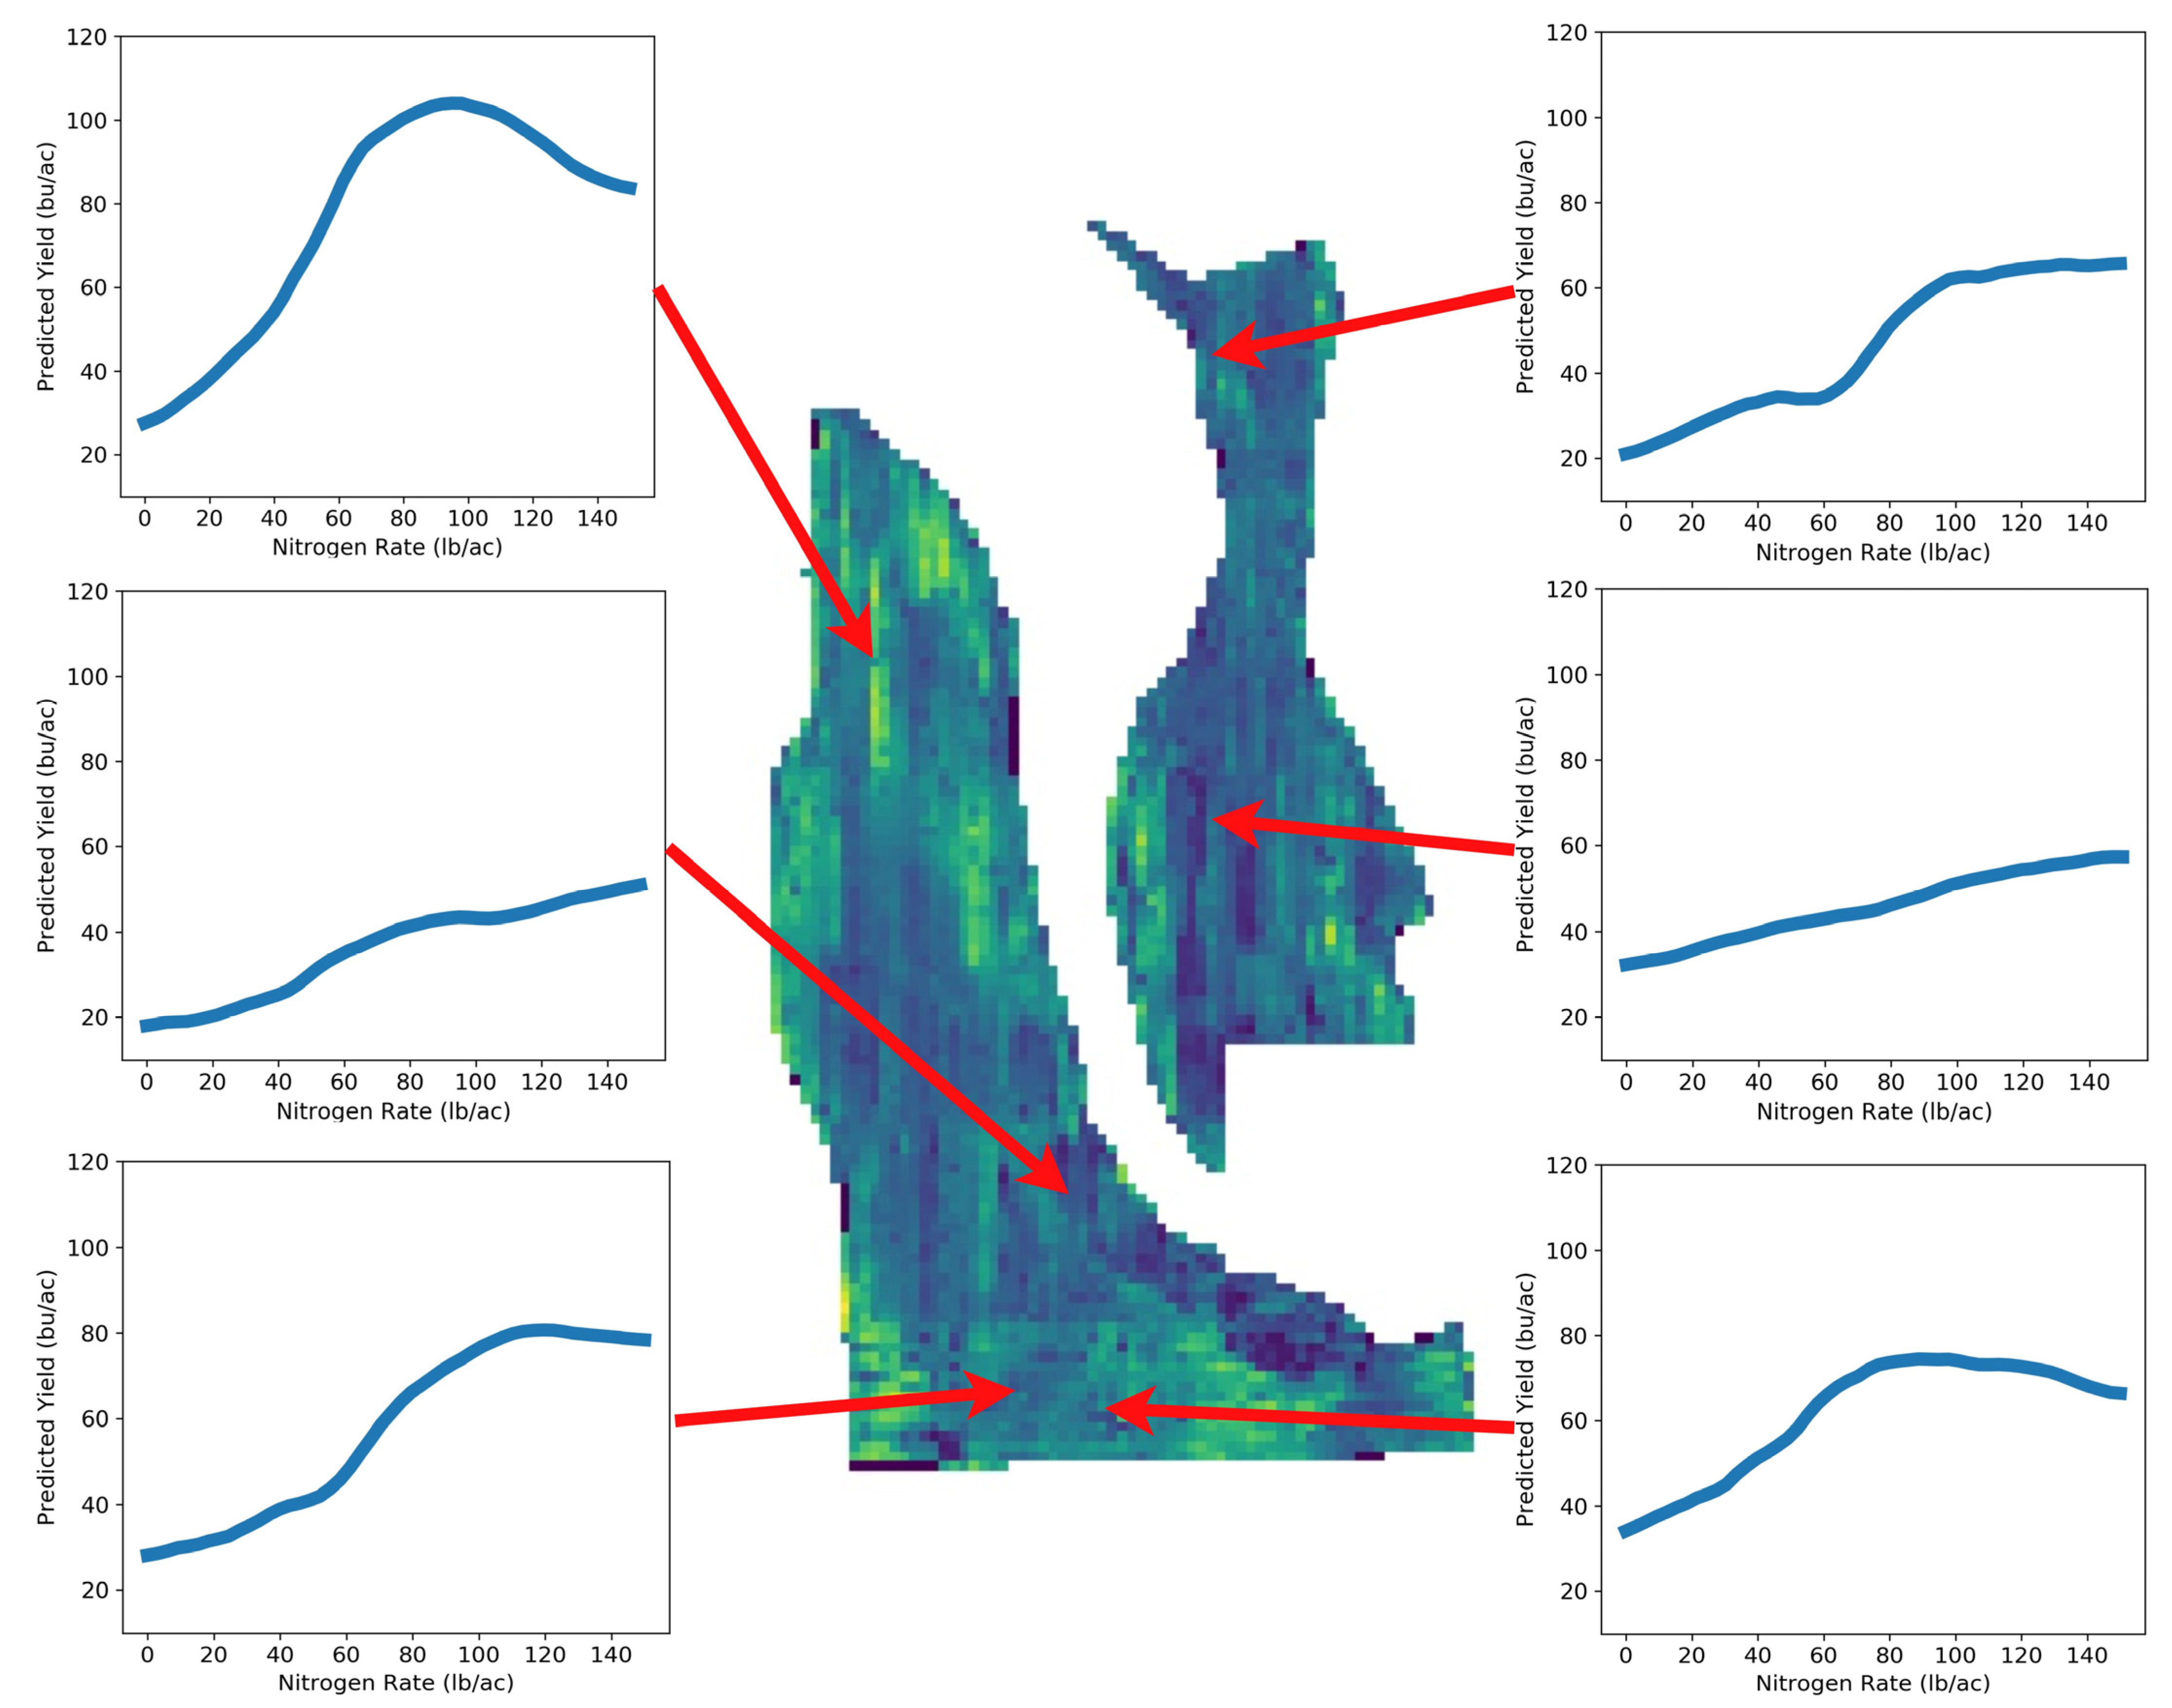
2.6. Step 4—Data Analysis

Crucial to the OFPE methodology was the development of ecological models that were used to characterize the relationships between the observed crop responses, experimentally varied agronomic inputs, and the remotely sensed environmental variables. Though it has long been studied, no consensus approach has been developed that adequately captures spatial and temporal variability when modeling crop responses to agronomic inputs [36,37]. The minimization of uncertainty related to the characterization of crop responses to agronomic inputs requires model selection performed on a trial-by-trial basis, as the form of a model appropriate for one field is not always consistent with neighboring fields, or even the same field in different years [38]. Additionally, when modeling crop responses, the bias–variance tradeoff must be considered. Crop responses to varying agronomic input can have a high degree of heteroskedasticity and assumptions of a specific functional form or shape increase uncertainty and lead to models with reduced prediction accuracy compared to models that do not assume a specific shape for the data [27]. Increased predictive power translates into greater confidence in probabilities of management outcomes and the suggestion of optimized input rates [25,27].
The OFPE project has considered multiple crop response model types for experimental nitrogen fertilizer among other inputs. These have included non-linear models assuming a logistic form, non-linear models assuming a beta function [39], generalized additive models, random forest regression, Bayesian multiple linear regression models, and Bayesian non-linear models [31]. These sets of models were used in a selection process to determine the model type that best predicted crop responses in each field. The models listed are not exhaustive but are meant to represent a spectrum of approaches with different underlying assumptions about the approach. Different models may be incorporated into the OFPE methodology and current research includes the exploration of other machine learning approaches such as AdaBoost, stacked autoencoders, and convolutional networks [40,41,42].

2.7. Step 5A—Optimization

Crop response models were necessary to find optimum agronomic input rates because the optima could not be found directly via experimentation. At any given point in a field, only one experimental rate can be applied, meaning that the true “optimum” was not observable [43]. The optima thus must be identified via models in which crop responses are predicted under a range of experimental rates. The definition of an optimum rate, and whether single or multi-objective optimization was required, varied based on the judgement of the user of the OFPE methodology and the agronomic system.
One example of a single-objective optimization includes a scenario where a barley farmer using nitrogen fertilizer and selling to a brewer requires low protein content to minimize the haziness of the beer. In this case, the optimum fertilizer rate for a given location in a field is the rate that minimizes grain protein concentration. Another example of single-objective optimization is a farmer growing wheat for an export market that requires high protein content. The optimum fertilizer rate for a given location in the field is identified in this case as the rate that maximizes grain protein concentration. Optimization goals can also vary in the metric of interest. In most systems, the motivation for farmers is not quality (e.g., protein content), but maximization of grain weight relative to costs, which leads to profit. Corn or soybean systems require identifying optimum input rates that simply maximize net return, or the price received for their yield minus expenses. In the dryland winter wheat systems of Montana, farmers receive a premium or dockage based on grain protein that is added or subtracted from the base price received for wheat, making profit maximization more complex, while remaining a single-objective optimization problem [44]. When farmer profits are the primary goal, an optimum nitrogen fertilizer rate is the rate at which farmer net return is maximized and the cost of higher fertilizer rates is not compensated by an increase in revenue.
While individual farmers typically pursue net profit as their broad objective, the future of agriculture requires an emphasis on sustainability which is often translated as the minimization of inputs that can pollute (e.g., nitrogen fertilizer). The OFPE methodology creates the infrastructure for farmers to move beyond the considerations of profits and consider sustainable environmental stewardship as well with multi-objective optimization. While nitrogen is a major macronutrient for crops, contributing to yield and protein, NGP soils are subject to soil acidification and nitrate loss in the forms of leaching and denitrification due to excess nitrogen fertilizer use [45,46]. Thus, sustainable agriculture requires defining an optimum nitrogen fertilizer rate based on the tradeoff between profit and environmental quality. One approach for assessing the environmental impacts of nitrogen fertilizer requires models that estimate nitrogen use efficiency on a subfield scale to inform crop managers on the potential of nitrogen loss and its cost [47]. In this case, an optimum could be considered as the nitrogen fertilizer rate at which net return is maximized and the value of nitrogen lost from a system (contributing to acidification or leaching) is minimized.
To gain insight into how minimizing nitrogen application influences farming profitability, a multi-objective approach was implemented, taking both net return maximization and nitrogen application minimization into account. The nitrogen minimization objective was a naïve approach only aiming to reduce the pounds of fertilizer per acre applied to farmers’ fields, assuming total nitrogen applied is positively related to pollution potential. The implemented algorithm found a set of solutions balancing the two objectives, which allowed us to analyze the change in the net return of solutions focusing on reduced fertilizer [48].

2.8. Step 5B—Simulation

Unpredictable weather and economic conditions induce uncertainty to any management recommendation, since the optimal agronomic input rate at a given point in a field may change depending on any variation in weather condition [25]. The optimum recommendation under one weather condition may not be appropriate for another, and a field manager can only take a best guess at what the weather will be like in a future year. Further uncertainty is introduced when considering the unpredictability of future economic conditions. Optimum inputs at one price point will not match another. Simulation is an important aspect of decision support systems because it allows users of the OFPE methodology to assess how potential management strategies perform under an array of possible future conditions (Figure 3).
The OFPE methodology can be adapted to assess a range of different management strategies to compare against site-specific management, such as applying a uniform rate selected by the farmer, a full-field uniform optimized rate, or even zero rates of the agronomic input (in the case of fertilizer or herbicide, for example). This provides users flexibility in how to manage their land and data-driven insight into how management options compare. Again, due to the flexibility in the OFPE methodology, the user can select any management option they desire.
To generate a management recommendation for an upcoming year given the uncertainty due to weather and linked economic variables, the OFPE methodology requires users to select a year from the past that they expect would be representative of the upcoming year. This produces a management recommendation that represents the user’s best guess at how weather will behave in the year their management is applied. However, a user is not limited to selecting a year from the past that they expect to coincide with weather in the upcoming year. Instead, years from the past can also be selected randomly or non-sequentially to emulate a future anomalous year. After selecting a year to simulate, the remotely sensed data from that year were used to predict crop responses under the simulated conditions using the selected field-specific model. Forecasted crop responses in the new conditions were then made at every location in the field for a range of experimental rates.
Economic uncertainty was addressed in the second layer of the simulation. In this layer, economic conditions from the years selected were iteratively sampled and used to calculate net return. At each iteration of the simulation, optimized rates based on net return at each location in the field were identified, as well as the net return from the other strategies. Random sampling of the different years was repeated for a given number of iterations, typically >1000, and the optimum management outcomes were tracked and evaluated after the simulation of different management scenarios was completed. The iterations provided a distribution of economic outcomes based on the economic conditions of the past that were tied to the weather years selected in the first step of the simulation. These distributions were what were used for a probabilistic comparison of management outcomes.
The flexibility in the OFPE methodology allowed users to define the degree to which uncertainty was incorporated in the simulation. For instance, a user could tweak the OFPE methodology’s simulation settings depending on their certainty about future weather conditions. A user could run the simulation using the same conditions as the prior year, or if a user was less certain about future weather conditions, they could use simulations to compare management outcomes from years with varying weather conditions. This ability will be ever more important as farmers continue to grapple with increasing weather variability caused by climate change. In terms of economic uncertainty, if a farmer knows the cost of their input and price received for the crop prior to applying management, they could run the simulation with a fixed economic scenario rather than generating probabilistic outcomes from the Monte Carlo simulation. Empowering farmers and users of the OFPE methodology to apply simulation modeling when making data-driven management decisions is a novel concept that PA and simple OFE have not addressed and therefore represents an advance in the concept of locally gained knowledge.

2.9. Step 5C—Evaluation

As optimum agronomic inputs cannot be empirically evaluated, because only one input rate can be applied at any given point in the field at any given time, the crop response models’ fit in the fourth step of the OFPE methodology was crucial for evaluating the profitability and sustainability of optimum rates and rates of different management strategies. Site-specific optimum rates were found by using crop response models to make site-specific predictions under varying agronomic input rates, but the model was also required to predict the site-specific crop responses under a farmer’s traditionally selected uniform rate, and any other selected management strategy. The OFPE methodology evaluated different strategies in probabilistic terms, where at each iteration of the simulation, the mean net returns of each strategy were compared. Given a strategy of interest, such as a site-specific approach, the number of times that the strategy yielded a higher net return, or other metric of interest, compared to the other strategies, was recorded and divided by the total number of iterations simulated. In this way, farmers were provided with the probability that a given management strategy outcompeted another management strategy. The farmer then had the choice of selecting from any of the management strategies, leaving the ultimate decision about management up to them. While presented with a site-specific and full-field optimized strategy, the farmer could elect to continue with their status quo if they liked the odds of that strategy outperforming the optimized approaches.

2.10. Step 6—Decision Making

The final steps of the OFPE methodology occurred after the farmer was confronted with probabilistic outcomes from the simulations. After the farmer selected their strategy, they chose the extent to which experimentation and optimization rates were distributed across their field. These were represented as three possible routes: full deployment of their selected strategy (optimized or not), full experimentation, or a mix of both. In option one, a farmer could adopt and apply their selected management strategy. In option two, the farmer could begin the OFPE process again with another full field experiment. In option three, a farmer could elect to adopt and apply the selected strategy in combination with further experimentation. In the third case, experimental rates were distributed spatially across the field at a lower density than full experimentation. Note that determining the density and location of experimental plots represents a further optimization problem and is currently being studied. While the first option is available to farmers, continued experimentation through the second or third approach is highly recommended for two reasons. First, experimentation is crucial for increasing the statistical power of the field-specific crop response models, and second, as more data are gathered, models can be refined for updating management recommendations.

3. Results

The OFPE methodology was applied in various systems (organic and conventional) for managing inputs in rain-fed agroecosystems of the NGP as a proof of concept. In total, 30 fields across the United States and Canada were managed using OFPE principles. Each step of the process was completed across multiple years in geographically distributed fields. To display the flexibility and applicability of the OFPE methodology, four use-cases are briefly highlighted below. We would like to emphasize that all references and results in the sections below are from the authors of this manuscript and are included to highlight evidence of the OFPE methodology in practice and in theory.

3.1. Application of On-Farm Precision Experimentation in Conventional Wheat Systems

In conventional systems, the OFPE methodology was applied to winter wheat fields where the management directive was to optimize nitrogen fertilizer rates based on the maximization of profit and minimization of the risk of nitrogen pollution. The results from this research indicated that in 100% of the fields across three simulated weather conditions, the OFPE management strategy produced site-specific optimized rates that improved net returns compared to the application of a farmer-selected uniform fertilizer rate [45,49]. In 50% of fields, the site-specific fertilizer rates from OFPE optimization reduced the total amount of nitrogen fertilizer applied to fields compared to a strategy applying a farmer-selected uniform nitrogen fertilizer rate [49]. These results suggested that while site-specific management had a high probability of generating increased profits for farmers, the probability that site-specific management reduced nitrogen fertilizer use was equivalent to a flip of a coin. However, one could also argue that by site-specifically applying the nitrogen to maximize net return and nitrogen use efficiency, more of the total nitrogen was taken up by the crop and thus less was available as a pollutant compared to a uniform application of the same total amount across the field. This indicated that site-specific fertilizer approaches that directly account for sustainability-focused objectives in the decision process not only improve net return but also reduce environmental impacts.

3.2. Application of On-Farm Precision Experimentation in Organic Systems

All steps of the OFPE methodology were conducted on five organic farms across Montana, as well as one farm in Manitoba, Canada. The OFPE methodology was applied, where the management directive was to optimize the seeding rates of both nitrogen fixing green manure cover crops and subsequent wheat cash crops for maximized net returns. Variable-rate site-specific management from the OFPE optimization typically outcompeted other management strategies, though in several instances a single uniformly applied optimum rate was found to be as likely to produce the greatest net return as optimized variable rates across the field [50]. Optimum seeding rates were found to be considerably lower than the chosen farmer rates. Further research in this area will be to develop the OFPE methodology in organic systems as a multiple objective optimization situation to maximize annual net returns while simultaneously minimizing current and future weed pressures. A series of different cover and cash crops including barley, wheat, oats, hemp, and peas were tested, highlighting the versatility of the OFPE method in creating optimums for any farm input.

3.3. Application of On-Farm Precision Experimentation for Improving Agronomic Modeling

The iterative process of the OFPE methodology becomes a monitoring mechanism resulting in improved agroecological models because the methodology creates a data environment for the application of modern analytical methods. For example, initial modeling efforts demonstrated the potential of machine learning approaches for spatially explicit modeling of the functional relationship between nitrogen fertilizer and crop yield [16]. Building on these initial approaches, we presented a novel convolutional neural network (CNN) architecture called Hyper3DNetReg [42].
The Hyper3DNetReg architecture was tested using data collected from the OFPE methodology’s application in Montana to tackle the yield prediction problem as a two-dimensional regression task. This approach took a two-dimensional multi-channel input raster and, unlike previous approaches, outputted a two-dimensional raster where each output pixel represented the predicted yield value of the corresponding input pixel. Experimental results showed that the Hyper3DNetReg models improved predictions over other traditional and more recent machine learning methods such as 3-D CNNs, random forest, AdaBoost, and multiple linear regression [42]. This implied that the Hyper3DNetReg network modeled the mapping from the feature space to the yield value space better than other approaches did.
Furthermore, by using the Hyper3DNetReg model considering all admissible nitrogen fertilizer rates, we could automatically generate non-parametric N-response curves that were specific to each location of the field. Ultimately, this increased the predictive capacity of the models given the spatial and temporal variability encountered [42]. The initial results using two different winter wheat fields showed that different regions of the field had different responses to the N fertilizer (Appendix A) and allowed for the further refinement of approaches to identify site-specific input management. This research would not have been possible without the data infrastructure created by the OFPE methodology, demonstrating that the methodology proposed in this paper not only benefits practical management for farmers but also increases the research and development of PA as a science.

3.4. Application of On-Farm Precision Experimentation for Conservation

The OFPE methodology has also been applied to enhance environmental quality and conserve on-farm biodiversity. Two farms in Montana that practiced OFPE management principles were used to assess plant and insect diversity as a proof of concept that small uncropped areas can increase on-farm biodiversity [51]. Site-specific data collected from the OFPE cycle were used to identify consistently low-yielding areas within a field that, when taken out of production, served as ecological refugia. Crop response models from the OFPE methodology were integrated with ecological data on plant, insect, and landscape diversity to assess the potential tradeoffs of removing land from production and conserving it as habitats [6]. We hypothesized that beneficial ecosystem services such as pollination or pest predation would be increased adjacent to areas with higher plant and insect diversity (i.e., ecological refugia). A linear regression of diversity as a function of distance from uncropped areas demonstrated that plant diversity declined significantly with distance from uncropped areas and into the crop field on both farms (p-value 0.13 and p-value = 0.011). In addition, insect diversity declined significantly with distance from uncropped areas and into the crop field (p-value < 0.0005). Biodiversity data were integrated with data collected using the OFPE methodology in a random forest model [51]. The model indicated that distance from the uncropped area was the most important explanatory variable for yield and that yield decreased significantly with distance from the uncropped area (p-value < 0.0001). Managing for on-farm biodiversity may generate a suite of beneficial ecosystem services such as enhanced pest suppression, weed seed predation, and crop pollination, though accompanying negative impacts may include increased pest habitat, weed pressure, and yield reduction [52,53,54,55]. The tradeoff analysis weighed the potential costs of lower yields and exacerbated pest issues against the potential benefits of saved input costs and enhanced ecosystem services. The application of the OFPE methodology to on-farm precision conservation enabled stakeholders to quantify the environmental benefits and agronomic impacts of patch habitat within production fields. Without the field-specific knowledge gained from managing the fields using the OFPE methodology, farmers would not be able to identify, or easily assess, areas to create ecological refugia that benefit crop production. The OFPE methodology’s application in conservation was key to clarifying the relationship between on-farm biodiversity and yield, and to inform agronomic decisions that affect environmental quality and net return and aid in environmental quality and farm sustainability.

4. Discussion

Applications of the OFPE methodology indicated significant increases in local knowledge that could be included in field-specific management. Site-specific management recommendations created from the OFPE methodology were always more profitable than farmers’ status quo management and showed potential for reducing agronomic pollution. The OFPE methodology goes beyond practical management for farmers by providing the data infrastructure needed for crucial advances in crop modeling, which will further improve management recommendations. Additionally, the flexibility in the utilization of the OFPE methodology has been shown to benefit conservation practices in fields that promote agroecological management to advance sustainability goals. The case studies and results found by the authors of this paper have demonstrated the efficacy of the OFPE methodology as a decision support system in real farmers’ fields.
Only around 10% of farmers with PA technology use variable rate applications and the lack of decision support tools is one of the main barriers to adoption [23,24]. PA decision support has mostly focused on producing maps of crop yield or, on the other end of the spectrum, mechanistic models that require extensive parameterization not available to farmers [56,57]. Decision support systems are central to making management recommendations for agronomic inputs by facilitating the collection and analysis of crop response and remote sensing information from farms and open-source datasets. A farmer with PA technology benefits from decision support systems that facilitate the organization, storage, and translation of data to management recommendations [1,23,58]. The OFPE methodology facilitates all of the processes via the six steps of the methodology and provides a novel solution to the research gap surrounding the development of decision support aids in the literature. We have presented a methodology that connects the research from experimental design and deployment to data analysis, simulation, and the assessment of results that directly supports producer decision making in a field.
An important example of how decision support systems are impacted by using the OFPE methodology is by automatically generating N-response curves. The shape of N-response curves is traditionally used to estimate the economic optimum nitrogen rate (EONR), which is defined as the nitrogen rate beyond which there is no actual profit for the farmers [59]. In Figure A1, we depicted how we generated N-response curves with different shapes for different regions of the field. This is significant and novel in the sense that N-response curves are traditionally fitted using parametric response functions with a fixed shape, assuming plateau-type, quadratic, or exponential behavior [60,61]. We argue that fitting a single N-response curve for an entire field implies that the field is homogeneous and behaves similarly at every location. What is more, traditional approaches assume that the yield response can be modeled as a linear combination of the effect of multiple covariates, implying that the shape of the N-response curve is not influenced by other covariates. In contrast, by using the OFPE approach, we are able to generate non-parametric N-response curves that took into account the information from all possible covariates. This allowed us to produce N-response curves that were specific to each location. This also allowed us to study how different covariates influenced the shape of the N-response curves across the field.
As a big data industry, PA is overcoming prior barriers to adoption surrounding the management and analysis of data by attracting significant investment and interest in agronomic data analytics and software development [62,63,64]. However, open-source decision support systems, such as the OFPE methodology, that use data that farmers generate, or can obtain for free, are important ways to spur adoption by preventing farmers from having to pay to make informed decisions. Though the OFPE methodology may not immediately be adopted by farmers due to the data infrastructure and digital requirements, it provides the logical underpinning of a decision support system for farmers in the form of an open source or low-cost software and can be used as a framework for future software.
The OFPE methodology could benefit farmer cooperatives by facilitating empirically driven adaptive management, where field-specific agronomic input decisions are generated and updated from iterative analyses of experimental data gathered in the given field [65,66,67]. While increasing the adoption of variable rate technology remains a challenge, providing and training farmers and crop consultants on our low-cost decision support system can remove barriers to adoption surrounding the price associated with managing and exploiting field-specific data (https://www.youtube.com/watch?v=uRdaKmabnk4 (accessed on January 1 2022)). While full automation of PA technology and tools could result in removing the farmer from the decision process, the OFPE methodology was purposefully designed as a decision aid that augments rather than replaces farmer knowledge of field-specific performance obtained through a range of learning approaches. Critically, a farmer’s local knowledge of their fields is integrated into the OFPE methodology so that agrarian livelihoods are supplemented, not threatened, by technology.

5. Conclusions

The on-farm precision experimentation methodology provides farmers with a novel methodology to harness the data and tools from precision agriculture to inform management decisions related to inputs and conservation. The on-farm precision experimentation methodology addresses the challenge of implementing applied management with minimal disruption of stakeholder practices while drawing on historic knowledge about the field. Additionally, the methodology successfully bridges the gap between agronomic research and agricultural management while addressing the unique constraints of individual farmers’ fields. The flexibility and adaptability of the methodology mean that it can be adapted to optimize agronomic inputs based on any reasonable user-defined criteria, as shown by the case studies presented. The on-farm precision experimentation methodology has been utilized by the Data-Intensive Farm Management project in over 150 fields across five countries to generate site-specific agronomic input recommendations, demonstrating the ease of adoption by farmers and the broad applicability of the methodology to work across different agroecosystems.

Author Contributions

P.B.H. provided conceptualization, methodology, visualization, writing of the original draft, and reviewing and editing. B.M. provided conceptualization, methodology, supervision, funding acquisition, and reviewing and editing. J.S. provided methodology, funding acquisition, and reviewing and editing. G.M.-L. provided visualization and reviewing and editing. S.L., H.D. and A.P. provided reviewing and editing. All authors have read and agreed to the published version of the manuscript.

Funding

This research was supported by a WSARE Graduate Student Fellowship titled “Nitrogen Fertilizer Management Based on Site-Specific Maximized Profit and Minimized Pollution” (award number GW19-190), a USDA-NIFA-AFRI Food Security Program Coordinated Agricultural Project, titled “Using Precision Technology in On-farm Field Trials to Enable Data-Intensive Fertilizer Management” (accession number 2016-68004-24769), the USDA-NRCS Conservation Innovation Grant from the On-farm Trials Program, titled “Improving the Economic and Ecological Sustainability of US Crop Production through On-Farm Precision Experimentation” (award number NR213A7500013G021), the Montana Fertilizer Advisory Council (MFAC) from 2016–2021, and an MREDI grant (51040-MUSR12015-02).

Institutional Review Board Statement

Not Applicable.

Informed Consent Statement

Not applicable.

Data Availability Statement

Data supporting this research are sensitive and not publicly available due to requests from the farmer collaborators. The data contain geographic data that can be tied to farmers’ properties, as well as yield and net return information that are related to their livelihoods. Other data are gathered from open sources online but are also geographically tied to farmers’ land and even with geographies anonymized would still reflect the defining characteristics of the farmers’ properties. All data are available to qualified researchers from Montana State University by contacting Paul Hegedus (paulhegedus@montana.edu) or Bruce Maxwell (bmax@montana.edu) in the Department of Land Resources and Environmental Sciences. If data are requested, users will be subject to sharing and use restrictions to protect the privacy of the farmer collaborators.

Acknowledgments

The authors thank the team members of the On-Field Precision Experiment (OFPE) project for their comments throughout the development of this work and members of the Data-Intensive Farm Management (DIFM) project for their collaboration and financial support.

Conflicts of Interest

The authors declare the following financial interests/personal relationships which may be considered as potential competing interests: Bruce Maxwell reports that financial support was provided by the Montana Fertilizer Advisory Council. Bruce Maxwell reports a relationship with USDA-NIFA-AFRI that includes funding grants. Bruce Maxwell reports a relationship with USDA-NRCS that includes funding grants. Paul Hegedus reports a relationship with USDA WSARE that includes funding grants. Paul Hegedus reports a relationship with NSF EPSCoR that includes funding grants. Sasha Loewen reports a relationship with USDA WSARE that includes funding grants. Hannah Duff reports a relationship with USDA WSARE that includes funding grants.

Appendix A

Figure A1. Example of the type of N-response curves generated for different regions of a rain-fed winter wheat field.
Agriculture 13 00524 g0a1

References

  1. Foley, J.A.; Ramankutty, N.; Brauman, K.A.; Cassidy, E.S.; Gerber, J.S.; Johnston, M.; Mueller, N.D.; O’Connell, C.; Ray, D.K.; West, P.C.; et al. Solutions for a Cultivated Planet. Nature 2011, 478, 337–342. [Google Scholar] [CrossRef] [Green Version]
  2. Tilman, D.; Balzer, C.; Hill, J.; Befort, B.L. Global Food Demand and the Sustainable Intensification of Agriculture. Proc. Natl. Acad. Sci. USA 2011, 108, 20260–20264. [Google Scholar] [CrossRef] [Green Version]
  3. National Institute of Food and Agriculture (NIFA). Sustainable Agriculture. 2022. Available online: https://nifa.usda.gov/topic/sustainable-agriculture (accessed on 8 February 2022).
  4. Antle, J.M.; Capalbo, S.M. Agriculture as a Managed Ecosystem: Policy Implications. J. Agric. Resour. Econ. 2002, 27, 1–15. [Google Scholar]
  5. Antle, J.M.; Valdivia, R.O. Trade-off Analysis of Agri-Food Systems for Sustainable Research and Development. Q Open 2021, 1, qoaa005. [Google Scholar] [CrossRef]
  6. Duff, H.; Hegedus, P.B.; Loewen, S.; Bass, T.; Maxwell, B.D. Precision Agroecology. Sustainability 2022, 14, 106. [Google Scholar] [CrossRef]
  7. Kanter, D.R.; Musumba, M.; Wood, S.L.R.; Palm, C.; Antle, J.; Balvanera, P.; Dale, V.H.; Havlik, P.; Kline, K.L.; Scholes, R.J.; et al. Evaluating Agricultural Trade-Offs in the Age of Sustainable Development. Agric. Syst. 2018, 163, 73–88. [Google Scholar] [CrossRef]
  8. Schimmelpfennig, D.; Lowenberg-DeBoer, J. Farm Types and Precision Agriculture Adoption: Crops, Regions, Soil Variability, and Farm Size. SSRN Electron. J. 2020, 1–38. [Google Scholar] [CrossRef]
  9. West, P.C.; Gerber, J.S.; Engstrom, P.M.; Mueller, N.D.; Brauman, K.A.; Carlson, K.M.; Cassidy, E.S.; Johnston, M.; Macdonald, G.K.; Ray, D.K.; et al. Leverage Points for Improving Global Food Security and the Environment. Food Secur. 2014, 345, 325–328. [Google Scholar] [CrossRef] [Green Version]
  10. Robert, P. Characterization of soil conditions at the field level for soil specific management. Geoderma 1993, 60, 57–72. [Google Scholar] [CrossRef]
  11. Altieri, M.A.; Nicholls, C.I. Agroecology and the Reconstruction of a Post-COVID-19 Agriculture. J. Peasant Stud. 2020, 47, 881–898. [Google Scholar] [CrossRef]
  12. Daum, T. Farm Robots: Ecological Utopia or Dystopia? Trends Ecol. Evol. 2021, 36, 774–777. [Google Scholar] [CrossRef]
  13. Cook, S.; Evans, F. An On-Farm Experimental philosophy for farmer-centric innovation. In Proceedings of the 14th International Conference on Precision Agriculture, Montreal, QC, Canada, 24–27 June 2018. [Google Scholar]
  14. Luschei, E.C.; Van Wychen, L.R.; Maxwell, B.D.; Bussan, A.J.; Buschena, D.; Goodman, D. Implementing and conducting on-farm weed research with the use of GPS. Weed Sci. 2001, 49, 536–542. [Google Scholar] [CrossRef]
  15. Lacoste, M.; Cook, S.; Mcnee, M.; Gale, D.; Ingram, J.; Bellon-maurel, V.; Macmillan, T.; Sylvester-bradley, R.; Kindred, D.; Bramley, R.; et al. On-Farm Experimentation to Transform Global Agriculture. Nat. Food 2022, 3, 11–18. [Google Scholar] [CrossRef]
  16. Hegedus, P.B.; Maxwell, B.D. Rationale for Field-Specific on-Farm Precision Experimentation. Agric. Ecosyst. Environ. 2022, 338, 108088. [Google Scholar] [CrossRef]
  17. Trevisan, R.G.; Bullock, D.S.; Martin, N.F. Spatial Variability of Crop Responses to Agronomic Inputs in On-Farm Precision Experimentation. Precis. Agric. 2021, 22, 342–363. [Google Scholar] [CrossRef]
  18. Cook, S.; Cock, J.; Oberthür, T.; Fisher, M. On-Farm Experimentation. Better Crops 2004, 97, 17–20. [Google Scholar]
  19. Maxwell, B.D.; Luschei, E.C. Justification for Site-Specific Weed Management Based on Ecology and Economics. Weed Sci. 2005, 53, 221–227. [Google Scholar] [CrossRef] [Green Version]
  20. Kyveryga, P.M. On-Farm Research: Experimental Approaches, Analytical Frameworks, Case Studies, and Impact. Agron. J. 2019, 111, 2633–2635. [Google Scholar] [CrossRef] [Green Version]
  21. Bullock, D.S.; Mieno, T.; Hwang, J. The Value of Conducting On-Farm Field Trials Using Precision Agriculture Technology: A Theory and Simulations. Precis. Agric. 2020, 21, 1027–1044. [Google Scholar] [CrossRef]
  22. Prost, L.; Martin, G.; Ballot, R.; Benoit, M. Key research challenges to supporting farm transitions to agroecology in advanced economies. A review. Agron. Sustain. Dev. 2023, 43, 11. [Google Scholar] [CrossRef]
  23. Capmourteres, V.; Adams, J.; Berg, A.; Fraser, E.; Swanton, C.; Anand, M. Precision Conservation Meets Precision Agriculture: A Case Study from Southern Ontario. Agric. Sys. 2018, 167, 176–185. [Google Scholar] [CrossRef]
  24. McBratney, A.; Whelan, B.; Ancev, T.; Bouma, J. Future Directions of Precision Agriculture. Precis. Agric. 2005, 6, 7–23. [Google Scholar] [CrossRef]
  25. Hegedus, P.B.; Maxwell, B.D. Constraint of Data Availability on the Predictive Ability of Crop Response Models Developed from On-farm Experimentation. In Proceedings of the 15th International Conference on Precision Agriculture, Minneapolis, MN, USA, 28 June 2022. [Google Scholar]
  26. Bullock, D.S.; Boerngen, M.; Tao, H.; Maxwell, B.; Luck, J.D.; Shiratsuchi, L.; Puntel, L.; Martin, N.F. The Data-Intensive Farm Management Project: Changing Agronomic Research through on-Farm Precision Experimentation. Agron. J. 2019, 111, 2736–2746. [Google Scholar] [CrossRef] [Green Version]
  27. Hegedus, P.B.; Maxwell, B.D.; Mieno, T. Assessing performance of empirical models for forecasting crop responses to variable fertilizer rates using on-farm precision experimentation. Precis. Agric. 2022, 1–28. [Google Scholar] [CrossRef]
  28. Peerlinck, A.; Sheppard, J.; Pastorino, J.; Maxwell, B.D. Optimal Design of Experiments for Precision Agriculture Using a Genetic Algorithm. In Proceedings of the IEEE Congress on Evolutionary Computation (CEC), Wellington, New Zealand, 10–13 June 2019. [Google Scholar]
  29. Rzewnicki, P.E.; Thompson, R.; Lesoing, G.W.; Elmore, R.W.; Francis, C.A.; Parkhurst, A.M.; Moomaw, R.S. On-Farm Experiment Designs and Implications for Locating Research Sites. Am. J. Altern. Agric. 1988, 3, 168–173. [Google Scholar] [CrossRef]
  30. Gauci, A.; Fulton, J.P.; Linsey, A.; Shearer, A.; Barker, D.; Hawkins, E. Limitations of Yield Monitor Data to Support Field-scale Research. In Proceedings of the 15th International Conference on Precision Agriculture, Minneapolis, MN, USA, 28 June 2022. [Google Scholar]
  31. Lawrence, P.G.; Rew, L.J.; Maxwell, B.D. A Probabilistic Bayesian Framework for Progressively Updating Site-Specific Recommendations. Precis. Agric. 2015, 16, 275–296. [Google Scholar] [CrossRef]
  32. Whitlock, C.; Cross, W.; Maxwell, B.; Silverman, N.; Wade, A. 2017 Montana Climate Assessment. Bozeman and Missoula MT: Montana State University and University of Montana, Montana Institute on Ecosystems. 2017, 318. Available online: https://montanaclimate.org/chapter/title-page (accessed on 15 September 2020).
  33. Gorelick, N.; Hancher, M.; Dixon, M.; Ilyushchenko, S.; Thau, D.; Moore, R. Google Earth Engine: Planetary-Scale Geospatial Analysis for Everyone. Remote Sens. Environ. 2017, 202, 18–27. [Google Scholar] [CrossRef]
  34. Fritsch, M.; Lischke, H.; Meyer, K.M. Scaling Methods in Ecological Modelling. Methods Ecol. Evol. 2020, 11(11), 1368–1378. [Google Scholar] [CrossRef]
  35. Blöschl, G.; Sivapalan, M. Scale Issues in Hydrological Modelling: A Review. Hydrol. Process. 1995, 9, 251–290. [Google Scholar] [CrossRef]
  36. Paccioretti, P.; Bruno, C.; Gianinni Kurina, F.; Córdoba, M.; Bullock, D.S.; Balzarini, M. Statistical Models of Yield in On-Farm Precision Experimentation. Agron. J. 2021, 113, 4916–4929. [Google Scholar] [CrossRef]
  37. Anselin, L.; Bongiovanni, R.; Lowenberg-DeBoer, J. A Spatial Econometric Approach To The Economics of Site-Specific Nitrogen Management. Am. J. Agric. Econ. 2004, 86, 675–687. [Google Scholar] [CrossRef]
  38. Thöle, H.; Richter, C.; Ehlert, D. Strategy of Statistical Model Selection for Precision Farming On-Farm Experiments. Precis. Agric. 2013, 14, 434–449. [Google Scholar] [CrossRef]
  39. Yin, X.; Goudriaan, J.; Lantinga, E.A.; Vos, J.; Spiertz, H.J. A Flexible Sigmoid Function of Determinate Growth. Ann. Bot. 2003, 91, 361–371. [Google Scholar] [CrossRef]
  40. Peerlinck, A.; Sheppard, J.; Senecal, J. AdaBoost with Neural Networks for Yield and Protein Prediction in Precision Agriculture. In Proceedings of the IEEE International Joint Conference on Neural Networks (IJCNN), Budapest, Hungary, 14–19 July 2019. [Google Scholar]
  41. Morales, G.; Sheppard, J.; Peerlinck, A.; Hegedus, P.B.; Maxwell, B.D. Generation of Site-Specific Nitrogen Response Curves for Winter Wheat using Deep Learning. In Proceedings of the 15th International Conference on Precision Agriculture, Minneapolis, MN, USA, 28 June 2022. [Google Scholar]
  42. Morales, G.; Sheppard, J.; Hegedus, P.B.; Maxwell, B.D. Improved Yield Prediction of Winter Wheat Using a Novel Two-Dimensional Deep Regression Neural Network Trained via Remote Sensing. Sensors 2023, 23, 489. [Google Scholar] [CrossRef]
  43. Tanaka, T.S.T.; Kakimoto, S.; Mieno, T.; Bullock, D.S. Comparison between spatial predictor variables for machine learning in site-specific yield response modeling based on simulation study of on-farm precision experimentation. In Proceedings of the 253rd Meeting of the Crop Science Society of Japan, Online, 25 March 2022. [Google Scholar] [CrossRef]
  44. Asaduzzaman Noor, M.; Sheppard, J.; Yaw, S. Mixing Grain to Improve Profitability in Winter Wheat using Evolutionary Algorithms. SN Comput. Sci. J. 2022, 3, 172. [Google Scholar] [CrossRef]
  45. Sigler, W.A.; Ewing, S.A.; Jones, C.A.; Payn, R.A.; Miller, P.; Maneta, M. Water and Nitrate Loss from Dryland Agricultural Soils Is Controlled by Management, Soils, and Weather. Agric. Ecosyst. Environ. 2020, 304, 107158. [Google Scholar] [CrossRef]
  46. Jones, C. Soil Acidification: A Growing Concern for Montana Farmers; Montana Natural Resources Conservation Service: Bozeman, MT, USA, 2018. [Google Scholar]
  47. Hegedus, P.B.; Ewing, S.E.; Jones, C.; Maxwell, B.D. Using spatially variable nitrogen application and crop responses to evaluate crop nitrogen use efficiency. Nutr. Cycl. Agroecosyst. 2022. preprint. [Google Scholar] [CrossRef]
  48. Peerlinck, A.; Sheppard, J. Addressing sustainability in precision agriculture via multi-objective factored evolutionary algorithms. In Proceedings of the 14th Metaheuristics International Conference, Syracuse, Italy, 11 July 2014. [Google Scholar]
  49. Hegedus, P.B.; Maxwell, B.D.; Ewing, S.E.; Bekkerman, A. Development and evaluation of site-specific optimized nitrogen fertilizer management based on maximized profit and minimization of pollution. Precis. Agric. 2022. in preparation. [Google Scholar]
  50. Loewen, S.; Maxwell, B.D. Precision Application of Seeding Rates for Weed and Nitrogen Management in Organic Grain Systems. In Proceedings of the 15th International Conference on Precision Agriculture, Minneapolis, MN, USA, 28 June 2022. [Google Scholar]
  51. Duff, H.; Maxwell, B.D. Ecological Refugia As a Precision Conservation Practice in Agricultural Systems. In Proceedings of the 15th International Conference on Precision Agriculture, Minneapolis, MN, USA, 28 June 2022. [Google Scholar]
  52. Gurr, G.M.; Wratten, S.D.; Luna, J.M. Basic and Applied Ecology Multi-Function Agricultural Biodiversity: Pest Management and Other Benefits. Basic Appl. Ecol. 2003, 4, 107–116. [Google Scholar] [CrossRef]
  53. Isaacs, R.; Tuell, J.; Fiedler, A.; Gardiner, M.; Landis, D. Maximizing Arthropod Mediated Ecosystem Services in Agricultural Landscapes: The Role of Native Plants. Front. Ecol. Environ. 2009, 7, 196–203. [Google Scholar] [CrossRef] [Green Version]
  54. Landis, D. Designing Agricultural Landscapes for Biodiversity Based Ecosystem Services. Appl. Ecol. 2017, 18, 1–12. [Google Scholar] [CrossRef] [Green Version]
  55. Pierpaoli, E.; Carli, G.; Pignatti, E.; Canavari, M. Drivers of Precision Agriculture Technologies Adoption: A Literature Review. Procedia Technol. 2013, 8, 61–69. [Google Scholar] [CrossRef] [Green Version]
  56. Lindblom, J.; Lundström, C.; Ljung, M.; Jonsson, A. Promoting sustainable intensification in precision agriculture: Review of decision support systems development and strategies. Precis. Agric. 2017, 18, 309–331. [Google Scholar] [CrossRef] [Green Version]
  57. Gobbo, S.; Morari, F.; Ferrise, R.; De Antoni Migliorati, M.; Furlan, L.; Sartori, L. Evaluation of different crop model-based approaches for variable rate nitrogen fertilization in winter wheat. Precis. Agric. 2021, 21, 2185–2208. [Google Scholar]
  58. Anwar, M.R.; Liu, D.L.; Macadam, I.; Kelly, G. Adapting Agriculture to Climate Change: A Review. Theor. Appl. Climatol. 2013, 113, 225–245. [Google Scholar] [CrossRef]
  59. Bullock, G.; Bullock, D.S. Quadratic and quadratic-plus-plateau models for predicting optimal nitrogen rate of corn: A comparison. Agron. J. 1994, 86, 191–195. [Google Scholar] [CrossRef]
  60. Watkins, K.B.; Hignight, J.A.; Norman, R.J.; Roberts, T.L.; Slaton, N.A.; Wilson, C.E.; Frizzell, D.L. Comparison of economic optimum nitrogen rates for rice in Arkansas. Agron. J. 2010, 102, 1099–1108. [Google Scholar] [CrossRef]
  61. Kablan, L.A.; Chabot, V.; Mailloux, A.; Bouchard, M.-E.; Fontaine, D.; Bruulsema, T. Variability in corn yield response to nitrogen fertilizer in eastern Canada. Agron. J. 2017, 109, 2231–2242. [Google Scholar] [CrossRef] [Green Version]
  62. Pham, X.; Stack, M. How Data Analytics Is Transforming Agriculture. Bus. Horiz. 2018, 61, 125–133. [Google Scholar] [CrossRef]
  63. Sykuta, M.E. Big Data in Agriculture: Property Rights, Privacy and Competition in Ag Data Services. Int. Food Agribus. Manag. Rev. 2016, 19, 57–74. [Google Scholar]
  64. Sawers, P. Linux Foundation Launches Open Source Agriculture Infrastructure Project. Venture Beat. Available online: https://venturebeat.com/2021/05/05/linux-foundation-launches-open-source-agriculture-infrastructure-project/ (accessed on 27 March 2022).
  65. Haas, C.A.; Frimpong, E.A.; Karpanty, S.M. Ecosystems and Ecosystem-Based Management. In The Sciences and Art of Adaptive Management: Innovating for Sustainable Agriculture and Natural Resources Management; Moore, K.M., Ed.; Soil and Water Conservation Society: Ankeny, IA, USA, 2009; pp. 106–142. [Google Scholar]
  66. Wyeth, P. Sustainable Agriculture and Natural Resource Management in Farm Enterprise Systems. In The Sciences and Art of Adaptive Management: Innovating for Sustainable Agriculture and Natural Resources Management; Moore, K.M., Ed.; Soil and Water Conservation Society: Ankeny, IA, USA, 2009; pp. 60–77. [Google Scholar]
  67. Mueller, J.P.; Finney, D.; Hepperly, P. The Field System. In The Sciences and Art of Adaptive Management: Innovating for Sustainable Agriculture and Natural Resources Management; Moore, K.M., Ed.; Soil and Water Conservation Society: Ankeny, IA, USA, 2009; pp. 25–59. [Google Scholar]
Figure 1. Conceptual diagram of an example experimental layout in the OFPE methodology. Different colors represent different rates of the agronomic input.
Agriculture 13 00524 g001
Figure 2. Conceptual diagram of the aggregation process. Grids with a 10 m resolution were overlayed on each field, and all data collected on farms and from remotely sensed information were aggregated to the centroid of each 10 m grid cell. As-applied or as-planted data were also aggregated to the centroid of grid cells via a spatial intersection of the grid points and the experimental data. The aggregation process resulted in datasets on a 10 m scale for each field, and contained the crop responses, experimental rates, and all remotely sensed covariates. In this example, measurement values for a sample set of cells of remotely sensed raster data (pH, NDVI, precipitation, and soil bulk density) were georeferenced to grain yield points via spatial intersection (represented by the vertical lines).
Agriculture 13 00524 g002
Figure 3. Overview of the OFPE methodology simulation and optimization process. Simulations use the historic local performance of fields to assess the potential for variation in the efficacy of management strategies using a probabilistic format. Simulations begin with the selection of possible weather conditions, typically as a selection from a past weather year (1). Then, the data from that year are used to predict crop responses at every location in the field for a range of agronomic input rates, for example nitrogen fertilizer (2). The OFPE methodology used a bootstrap Monte Carlo simulation approach to propagate uncertainty in weather and economic conditions by repeatedly sampling the different economic scenarios tied to the weather year(s) selected (3). The repeated sampling allowed for the identification of optimum input rates based on economic uncertainty and created a distribution of predicted net returns for the selected years under the varying economic conditions (4). This error propagation provided management outcomes that allowed a probabilistic perspective on the risks in decision making, meaning users of the OFPE methodology received the probability that one management approach provided higher profit or lower environmental damage compared to another management approach.
Agriculture 13 00524 g003
Table 1. Table of covariate data types gathered from Google Earth Engine to create predictive models for crop yield and protein datasets gathered from farms.
Data TypeData SourcesResolutionYears CollectedDescription
Normalized Difference Vegetation Index (NDVI)Landsat 5/7/830 mL5: 1999–2011
L7: 2012–2013
L8: 2014–present
Landsat is an ongoing USGS and NASA collaboration.
Bands (NIR, red)
L5/L7: B4 (NIR) and B3 (red)
L8: B5 (NIR) and B4 (red)
Normalized Difference Water Index (NDWI)Landsat 5/7/830 mL5: 1999–2011
L7: 2012–2013
L8: 2014–present
Landsat is an ongoing USGS and NASA collaboration.
Bands (NIR, MIR)
L5/L7: B2 (MIR) and B4 (NIR)
L8: B2 (MIR) and B5 (NIR)
ElevationUSGS NED~10 m (1/3 arc second), ~23 m (3/4 arc second)1999–presentUSGS National Elevation Dataset. Measured in meters.
AspectUSGS NED~10 m (1/3 arc second), 30 m1999–presentDirection the surface faces, function of neighboring elevations, in radians, and also calculated for each E/W and N/S direction as cosine and sine.
SlopeUSGS NED~10 m (1/3 arc second), 30 m1999–presentRate of change in height from neighboring cells. Measured in degrees.
Topographic Position Index (TPI)USGS NED~10 m (1/3 arc second), 30 m1999–presentMeasure of divots and low spots as a function of neighboring elevation.
PrecipitationDaymetV31 km1999–presentEstimates from the NASA Oak Ridge National Laboratory (ORNL). Measured in mm.
Growing Degree Days (GDDs)DaymetV31 km1999–presentEstimates from the NASA Oak Ridge National Laboratory (ORNL).
Bulk DensityOpenLandMap250 m1999–presentSoil bulk density (fine earth) 10 × kg/m3 averaged over 6 standard depths (0, 0.1, 0.3, 0.6, 1, and 2 m).
Clay ContentOpenLandMap250 m1999–presentClay content in % (kg/kg) averaged over 6 standard depths (0, 0.1, 0.3, 0.6, 1, and 2 m).
Sand ContentOpenLandMap250 m1999–presentSand content in % (kg/kg) averaged over 6 standard depths (0, 0.1, 0.3, 0.6, 1, and 2 m).
pH (phw)OpenLandMap250 m1999–presentSoil pH in H2O averaged over 6 standard depths (0, 0.1, 0.3, 0.6, 1, and 2 m).
Water ContentOpenLandMap250 m1999–presentSoil water content (volumetric %) for 33 kPa and 1500 kPa suctions predicted and averaged over 6 standard depths (0, 0.1, 0.3, 0.6, 1, and 2 m).
Carbon ContentOpenLandMap250 m1999–presentSoil organic carbon content in × 5 g/kg averaged over 6 standard depths (0, 0.1, 0.3, 0.6, 1, and 2 m).
Disclaimer/Publisher’s Note: The statements, opinions and data contained in all publications are solely those of the individual author(s) and contributor(s) and not of MDPI and/or the editor(s). MDPI and/or the editor(s) disclaim responsibility for any injury to people or property resulting from any ideas, methods, instructions or products referred to in the content.

