Article

Integrated Metabolome and Transcriptome Analysis Unveils the Underlying Molecular Response of Panax ginseng Plants to the Phytophthora cactorum Infection

1
Institute of Special Animal and Plant Sciences, Chinese Academy of Agricultural Sciences, 4899 Juye Street, Changchun 130112, China
2
National Germplasm Resources Observation Laboratory Station (Changchun), College of Chinese Medicinal Materials, Jilin Agricultural University, 2888 Xincheng Street, Changchun 130118, China
3
Biology Institute of Jilin Province, 1244 Qianjin Street, Changchun 130012, China
4
College of Traditional Chinese Medicine, Jilin Agricultural Science and Technology University, 1 Xuefu Road, Jilin 132109, China
*
Authors to whom correspondence should be addressed.
Agriculture 2023, 13(2), 509; https://doi.org/10.3390/agriculture13020509
Submission received: 21 January 2023 / Revised: 15 February 2023 / Accepted: 17 February 2023 / Published: 20 February 2023
(This article belongs to the Topic Interaction between Plants and Fungi and Oomycetes)

Abstract

:
Due to at least 3 years of cultivation, Panax ginseng (ginseng) is susceptible to being attacked by pathogens which severely affect its quality and yield. Compared with other diseases of ginseng, Phytophthora blight caused by Phytophthora cactorum (P. cactorum) can spread rapidly and destroy almost the entire plant of ginseng, such as leaves, stems, and roots. However, little research was focused on this area, and how P. cactorum affected the metabolic profile of ginseng is still obscure. In the current study, we conducted a comprehensive analysis of metabolomics and transcriptomics to compare the differences in health and P. cactorum-affected ginseng leaves and stems. Metabolome analysis revealed that 110 and 113 significant differential metabolites were observably disturbed separately in ginseng leaves and stems. Transcriptome analysis demonstrated that 6424 and 9508 genes had remarkable variation in ginseng leaves and stems. Using conjoint analysis, we also revealed the changes in pathways “Alanine, aspartate and glutamate metabolism”, “Glycine, serine and threonine metabolism”, and “Biosynthesis of unsaturated fatty acids” and “Plant hormone signal transduction” in ginseng response to the P. cactorum. The current work provides an overview of the alteration of metabolic profile and gene expression profiles in ginseng leaves and stems in response to P. cactorum affection, which may help to further screen out the mechanism of plant-pathogen interaction at the molecular level.

1. Introduction

Panax ginseng (ginseng) has been well acknowledged for its high medicinal and economic value worldwide. A wide range of biological activities, including antineoplastic, hepatorenal protective, neuroprotective, immunoregulatory, cardioprotective, and antidiabetic activities, was investigated in previous studies [1,2,3,4,5,6]. It is considered that ginseng is prone to face more serious biotic and abiotic stresses in its growing period as a result of physicochemical properties and deterioration of the soil caused by successive cultivation for years [7]. Jilin Province is a major ginseng-producing area in China. According to the investigation, ginseng plant disease mainly includes ginseng Fusarium root rot, ginseng Phytophthora blight, ginseng seedling blight, ginseng rust rot, ginseng gray mold, etc. Among them, the Phytophthora blight generated by Phytophthora cactorum (P. cactorum) widely occurs at various stages of ginseng, which is one of the main diseases of ginseng in adulthood. Phytophthora pathogens are soilborne plant epidemics infecting thousands of plant species, resulting in crop failure and natural ecosystem damage. It has the characteristics of genetic diversity and sexual reproduction. In addition, the dormant resistant spores in the soil also lead to repeated P. cactorum infection [8]. The typical morphological characteristics of ginseng Phytophthora blight are dark-green, water-soaked lesions on leaves and stems (similar to scald with boiling water) and brown rotted roots with yellowish-brown patterns in internal tissues [9,10].
Phytophthora blight can be reinfected repeatedly during the growth period of ginseng. Rainy and humid conditions, high density, poor ventilation, light transmission, soil compaction, and excessive nitrogen fertilizer application are all conducive to the occurrence and epidemic of ginseng Phytophthora blight [11,12]. Contact transmission, including wind and rain and agricultural operations, is the primary way for P. cactorum to spread in the soil. It can spread in a few weeks in the cultivation area and pose a serious threat to the growth, quality, and productivity of ginseng, which causes serious economic losses [13]. Most of the research in studies of ginseng is mainly related to cultivation ages, geographical origins, metabolites, and biological pathways in recent years [14,15,16], while control strategies for Phytophthora diseases are very limited [17]. The study of plant-pathogen interactions of ginseng is still not enough. There is an urgent need to understand the process of plant-pathogen interactions and develop resistant strategies for preventing P. cactorum infection in the ginseng plant.
Existing research recognizes the indispensables role played by metabolites, including amino acids, organic acids, fatty acids, phytohormones, polyamines, and other secondary metabolites in plant defense against various bacterial, fungal, nematode, and viral pathogens [18,19,20]. Metabolomic analyses are appropriate strategies to identify and quantify metabolites of small molecules in the biological system of healthy and diseased plants by UPLC-MS/MS, GS-MS/MS, or NMR-MS/MS together with multivariate statistical analysis and reveal the dynamic process in plants that responds to external stimuli [21,22]. Transcriptomics has provided insight into a comprehensive understanding of how genes are expressed and interconnected for the purpose of a comprehensive understanding of the molecular mechanism underlying the plants when exposed to various stress conditions. There is increasing literature focus on adopting transcriptomics combined with metabolomics analysis to unveil the complex molecular mechanisms in terms of biotic stress, abiotic stress, growth and development, pigmentation differences, etc. [23,24,25].
The present research explores, for the first time, genes and metabolites that are involved in plant-pathogen interaction in ginseng plants exposed to P. cactorum infection. Combined transcriptome and metabolome analysis applied in the current study aimed to investigate the molecular response of ginseng to P. cactorum, which helps better understand the plant-pathogen interaction and accelerates the early detection of ginseng Phytophthora blight by disease-related metabolites. Non-targeted metabolomics analysis based on UPLC Q-TOF/MS was applied to investigate disease-related metabolites (DRMs) in the metabolism process under the stress of P. cactorum in ginseng leaves and stems. Meanwhile, transcriptomics analysis based on RNA-sequencing (RNA-seq) was used to pave the way to seek out the differential expression genes (DEGs). The changes in the DEGs and the pivotal metabolites lead to unusual fluctuations of related pathways, which might explain the molecular mechanism of the stress response. This research helped uncover a systematic framework of cellular and molecular mechanisms manipulated to specify the response in the process of P. cactorum infection in ginseng plants.

2. Materials and Methods

2.1. Chemicals and Methods

Acetonitrile (Merck, Germany); methyl alcohol (Merck, 144282); ammonium acetate (Sigma-Aldrich, USA); formic acid (Fluka, Germany); typhasterol (TY), castasterone (CA), trans-zeatin riboside (tZR), salicylic acid (SA), Gibberellin A3 (GA3), trans-zeatin (tZ), indole-3-acetic acid (IAA), abscisic acid (ABA), and their internal standards (olchemim).

2.2. Plant Materials

The 4-year-old Ginseng plants used in the research were obtained from Ji’an in Jilin province, located in the northeast of China. They are transplanted in plastic plant pots with autoclaved soil and are cultivated under controlled conditions at Jilin Agricultural University (125.418193° E, 43.81698° N). The greenhouse temperature was set at 25/15 °C day/night. Ginseng plants were grown in pots for 8 weeks before infection.
P. cactorum was from Jilin Agricultural University, which is isolated from local ginseng plants. P. cactorum was incubated on V8 juice agar at 25 °C in the dark for 1 week. Refer to the previous method [8], zoospores were harvested and diluted with sterile water to a concentration of 1 × 10⁶/mL and then inoculated on the leaves and stem for 10 days, and the soil drench treatment was carried out simultaneously based on the previous report [13]. Soil moisture conditions are conducive to disease development. Once inoculated with P. cactorum, the plants were misted with sterile water and covered with plastic bags to maintain high relative humidity for 24 h. Then, the ginseng plants were transferred to the greenhouse with natural sunlight at 25/15 °C day/night and 90% relative humidity. Control plants were treated with sterile water. There are 6 pots of ginseng plants in one group, each being recognized as a biological replicate. Fresh leaves and stems were collected from healthy and P. cactorum-attacked ginseng plants, respectively. They were harvested at the same time and rapidly frozen in liquid nitrogen to stop all metabolic activity in the tissues. The above materials were then grouped (Table 1) and stored at −80 °C before sample analysis. Three analytical replicates were prepared for each biological replicate.

2.3. Sample Preparation for Non-Targeted Metabolomics Analysis

After homogenization with liquid nitrogen, 1 mL methanol and acetonitrile aqueous solution (2:2:1, volume ratio) were added to the blade with a weight of 80 mg. After vortexing for 60 sec, the leaves were further extracted with low-temperature ultrasound twice, each time for 30 min, and the protein was precipitated at −20 °C for 1 h [26,27]. Subsequently, the solutions were centrifuged (14,000× g, 4 °C) for 20 min. The supernatant was freeze-dried and kept at −80 °C until further non-targeted metabolomics analysis.
Quality control (QC) samples were a mixture made equivalently of all samples, which is used to evaluate the stability and repeatability of the system.

2.4. UPLC-MS Based Non-Targeted Metabolomics Analysis

A quadrupole time of flight (TOF) mass spectrometer (Triple TOF 6600, AB Sciex, Concord, ON, Canada) equipped with an ultra-performance liquid chromatography (UPLC) system (1290 Infinity LC, Agilent Technologies, Santa Clara, CA, USA) was used to analyze the non-target metabolic spectrum.
The chromatographic separation was carried out on an ACQUITY UPLC BEH Amide column (1.7 µm, 2.1 mm × 100 mm, Waters, Milford, MA, USA) set at 25 °C. Mobile phase A is composed of 25 mM ammonium hydroxide mixed with 25 mM ammonium acetate in water, B is acetonitrile, and the flow rate was set at 0.3 mL/min. The elution gradient for UPLC separation was set as follows: 0–0.5 min, 95% eluent B; 0.5–7 min, eluent B went linearly from 95% to 65%; 7–8 min, eluent B went down to 40%; 8–9 min, eluent B maintained at 40%; 9–9.1 min, eluent B linearly increased from 40% to 95%; 9.1–12 min, eluent B maintained at 95%. QC samples were inserted into the sample queue to monitor and evaluate the stability of the system and the reliability of experimental data [26].
Electrospray ionization (ESI) was used for positive ion and negative ion detection. The parameters were set as follows: ion source gas1: 40 psi, ion source gas2: 80 psi; curtain gas: 30 psi; source temperature: 650 °C; collision energy: 35 ± 15 eV. The production scanning adopted a highly sensitive information-dependent acquisition mode. Isotopes were excluded within 4 Da and 10 candidate ions were monitored per cycle. Data acquisition is segmented by mass range: 50–300 Da, 290–600 Da, 590–900 Da, 890–1200 Da [27].
Raw data were converted to mzXML files by Proteo Wizard. Peak alignment, retention time correction, and peak area extraction were subsequently performed by XCMS software. Metabolites were identified by comparing the accurate mass number matching (<25 ppm) and MS/MS spectra with an in-house database established with authentic standards. After the process of pareto-scaling, multivariate statistical analysis, including principal component analysis (PCA) and orthogonal partial least squares discriminant analysis (OPLS-DA), was operated by SIMCA-P14.1. Univariate statistical analysis and student’s t-test were also obtained between the control group and the disease group.

2.5. Sample Preparation for Quantitative Analysis of Plant Hormones

Plant hormones in ginseng leaves were obtained with different extraction methods because of the trace amount. In this part, the blades were ground in liquid nitrogen, and after adding 30 μL of internal standard solution and 1 mL acetonitrile-water solution (1% formic acid), 100 mg of each sample was vortexed for 2 min. Then, the solutions were left in the dark for 12 h at 4 °C and subsequently centrifuged at 14,000× g for 20 min. 800 μL of the supernatant was collected, dried with nitrogen, redissolved with 100μL acetonitrile-water (1:1, volume ratio), and centrifugated again (14,000× g, 20 min). The supernatant was freeze-dried and kept at −80 °C for further analysis [28].

2.6. UPLC-MS/MS Conditions for Phytohormone Analysis

The chromatographic separation was operated on a Waters ACQUITY UPLC I-class system (waters, Milford, MA, USA). The mobile phase consisted of 0.05% formic acid solution (A) and acetonitrile (B), and the flow rate was set at 0.4 mL/min. The elution gradient for UPLC separation was set as follows: 0–10 min, eluent B linearly raised from 2% to 98%; 10–10.1 min, eluent B returned to 2%; 11.1–13 min, eluent B maintained at 2% [27].
API 5500-Qtrap triple quadrupole mass spectrometer (Applied Biosystem, AB SCIEX, Concord, ON, Canada) with electrospray ionization using multiple-reaction monitoring (MRM) mode was applied to analyze the samples. Specific precursors and fragments of the plant hormones were shown in Supplemental Table S1.
The ion source conditions were set as follows: source temperature 500 °C; ion source gas1:45; ion source gas2:45; curtain gas:30; ion spray voltage floating (ISVF)-4500 V [28].

2.7. RNA Isolation and Transcriptomics Analysis

Total RNA was extracted using the Total RNA Extractor (Trizol) kit (B511311, Sangon, China) according to the manufacturer’s protocol and treated with RNase-free DNase I to remove genomic DNA contamination. RNA integrity was evaluated with a 1.0% agarose gel. Thereafter, the quality and quantity of RNA were assessed using a NanoPhotometer ® spectrophotometer (IMPLEN, Munich, Germany) and a Qubit®2.0 Flurometer (Invitrogen, CA, USA) [29].
A total amount of 2 μg RNA per sample was used as input material for the RNA sample preparations. Sequencing libraries were generated using VAHTSTM mRNA-seq V2 Library Prep Kit for Illumina® following the manufacturer’s recommendations, and index codes were added to attribute sequences to each sample [30]. At last, PCR products were purified (AMPure XP system, Beckman Coulter, Beverly, USA), and library quality was assessed on the Agilent Bioanalyzer 2100 system. The libraries were then quantified and pooled. Paired-end sequencing of the library was performed on the NovaSeq sequencers (Illumina, San Diego, CA, USA) [31].
FastQC (version 0.11.2) was used for evaluating the quality of sequenced data. Raw reads were filtered by Trimmomatic (version 0.36), and clean reads were mapped to the reference genome by HISAT2 (version 2.0) with default parameters. RSeQC (version 2.6.1) was used for statistics of the alignment results. The homogeneity distribution and the genome structure were checked by Qualimap (version 2.2.1). BEDTools (version 2.26.0) was used to statistical analysis the gene coverage ratio [32].
Gene expression values of the transcripts were computed by StringTie (version 1.3.3b). Transcripts per million (TPM) eliminates the influence of gene lengths and sequencing discrepancies to enable direct comparison of gene expression between samples. DESeq2 (version 1.12.4) was used to determine DEGs between the two groups. Genes were considered as DEGs if the expression met the threshold of |log2 (Fold Change)|(|log2 FC|) > 1 and p-value < 0.05. Gene expression differences were visualized by volcano plot [29].
Functional enrichment analyses, including Gene Ontology (GO) and Kyoto Encyclopedia of Genes and Genomes (KEGG), were performed to identify which DEGs were significantly enriched in GO terms or metabolic pathways. GO terms and KEGG pathway with false discovery rate (q-value) < 0.05 were considered as significantly altered.

2.8. Quantitative PCR Assays

The RNA samples obtained in RNA-seq assays were subsequently reverse transcribed using a 2× RealStar Fast SYBR qPCR Mix (GenSTAR, Beijing, China). qPCR was performed on a CFX96 Touch Real-Time PCR Detection System (Bio-Rad, Hercules, CA, USA). The relative gene expression levels were calculated by the 2−ΔΔCT method [33,34]. All experiments were performed in three biological replicates. The primers used for qPCR analysis in this study are listed in Supplementary Table S2.

2.9. Integrated Analysis of Metabolome and Transcriptome

The significantly different genes obtained by transcriptome analysis and the significantly different metabolites obtained by metabolomics analysis were simultaneously mapped to the KEGG pathway database to determine the main biochemical pathways and signal transduction pathways.

2.10. Statistical Analysis

Values represent the mean ± SD (standard deviation). Statistical significance of differences was determined by Student’s t-test or one-way ANOVA with Bonferroni’s post-hoc comparison, where appropriate. Thereby, p-values less than 0.05 were considered significant. SPSS Statistics version 26.0 (IBM Corp., Armonk, NY, USA) was used for statistical analysis.

3. Results

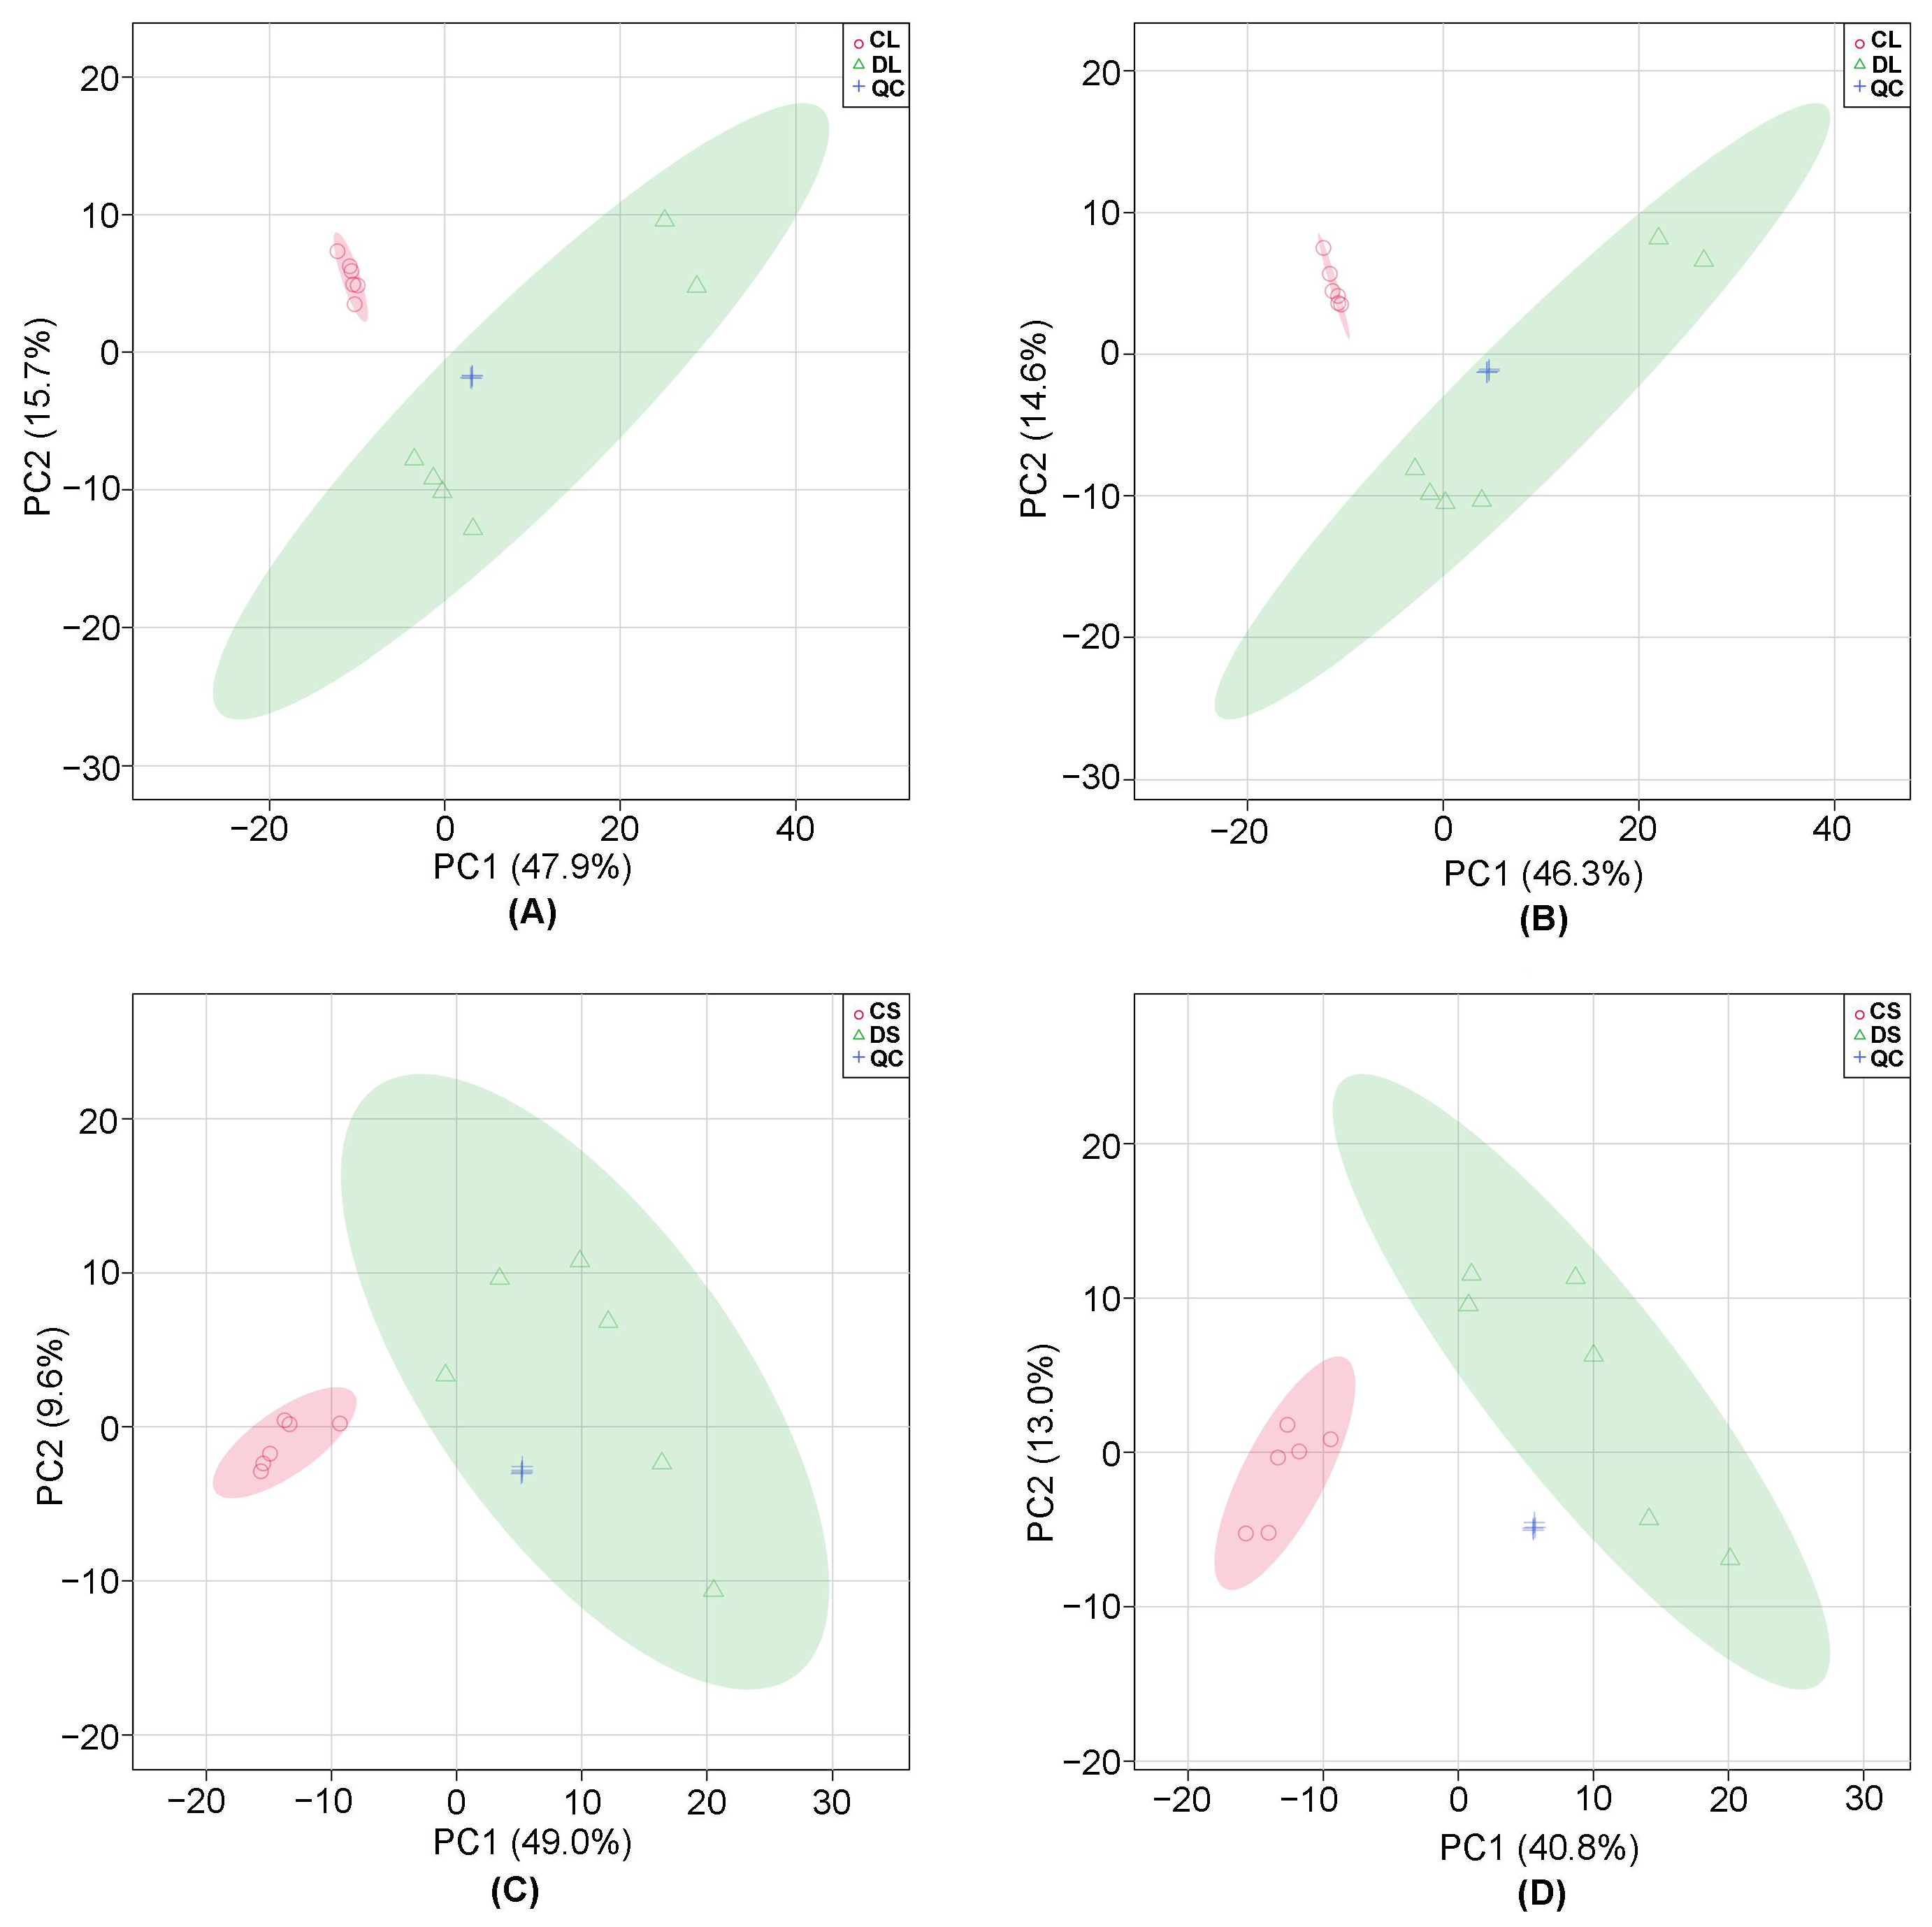
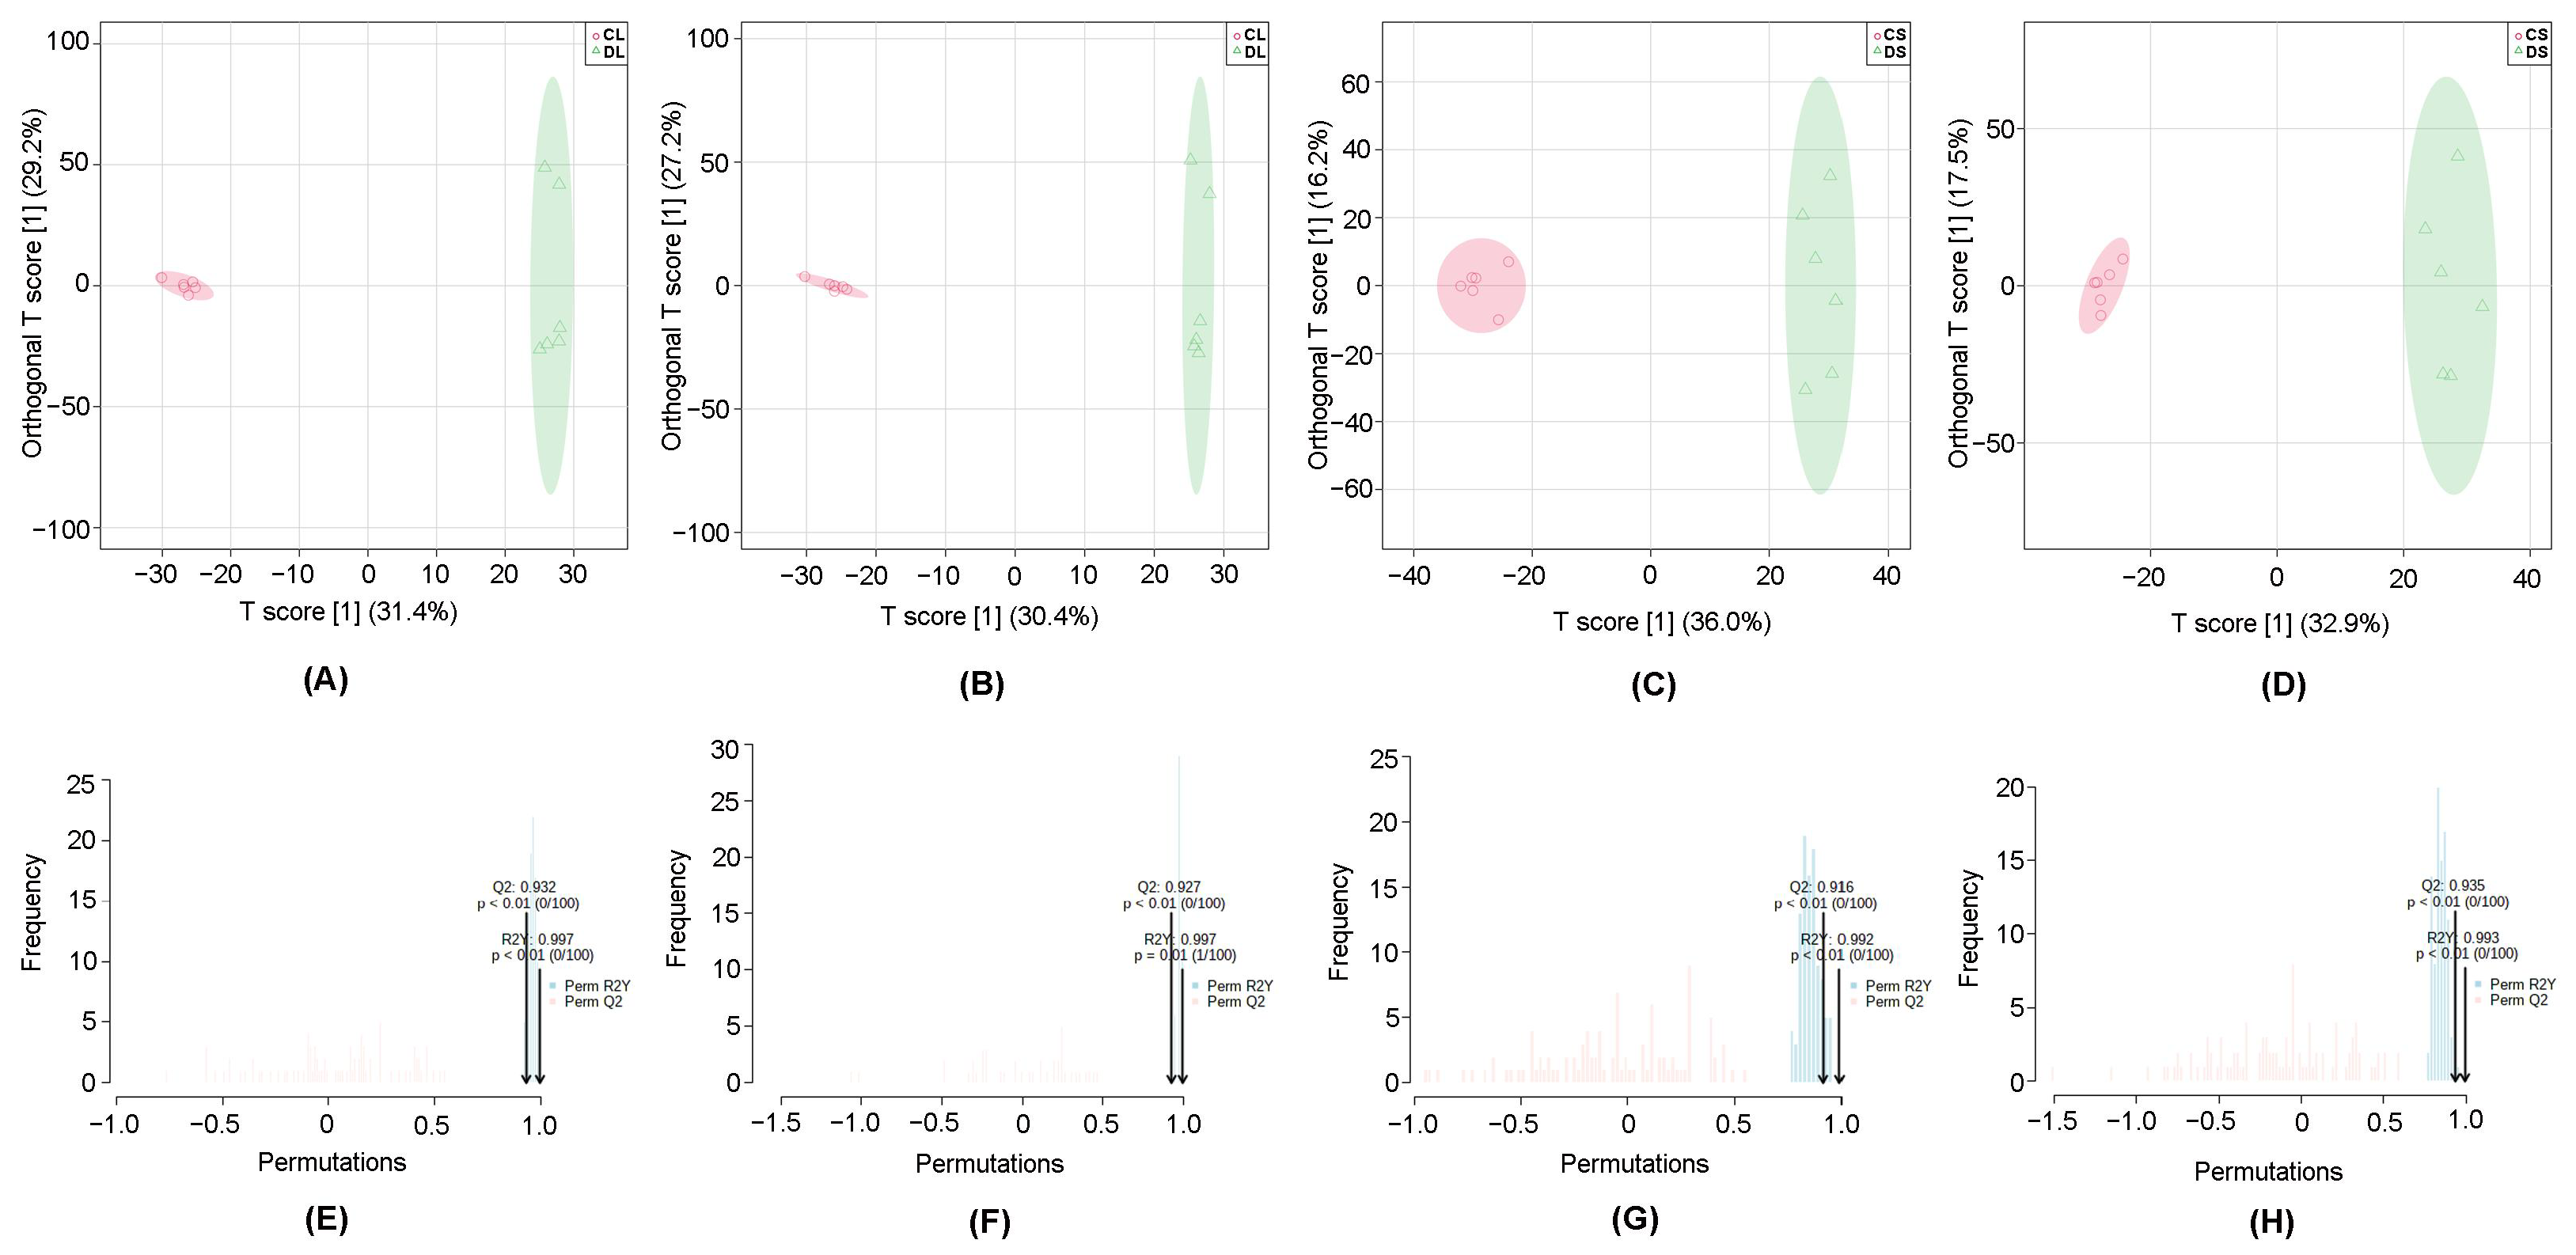
3.1. Multivariate Statistical Analysis

PCA is a popular approach aimed at determining the trends and classification of complex data sets [35]. In this research, PCA models were calculated based on the negative data and positive data to provide an intuitive evaluation of experimental samples and QC samples (Figure 1). The QC samples of both negative and positive ion modes were closely clustered in the middle of the PCA scores plot, which confirmed the repeatability and reliability of the experiment.
OPLS-DA analysis is widely used in omics for diagnosing differences between two groups and recognizing potential biomarkers [36,37]. Therefore, a series of pairwise OPLS-DA was applied to display metabolic variations between the ginseng control tissues and diseased ginseng tissues visually. As is shown in Figure 2A–D, there is an obvious classification in the OPLS-DA model indicating that significant biochemical perturbation occurred between the control and infected groups.
Considering that OPLS-DA is prone to yield scores to generate an excellent class separation with random data [35], permutation tests were carried out, and the p-values were both less than 0.01 under the negative and positive mode, respectively, after 100 permutations, which indicated that the models have good reliability and no over-fitting exits (Figure 2E–H).

3.2. Significant Differences in Metabolites

According to the results of multivariate and univariate statistical significance criteria, variables with variable importance in projection (VIP) >1 within the OPLS-DA project and p-value <0.05 (student’s test) were the significant differential metabolites (SDMs) in ginseng leaves and stems when P. cactorum attacked. It turned out that 110 metabolites (44 in negative mode and 66 in positive mode) in leaves met the above requirements to be the potential biomarkers that highlighted the changes in ginseng leaves attacked by P. cactorum. 91 SDMs, including amino acids, sugars, sugar alcohols, fatty acids, organic acid, purines, pyrimidines, and their derivatives, meet |log2 FC| >1 (Supplemental Table S3). While in ginseng stems, 113 metabolites (52 in negative mode and 61 in positive mode) matched as the SDMs, and 105 SDMs had a great content change according to |log2 FC| >1 (Supplemental Table S4).

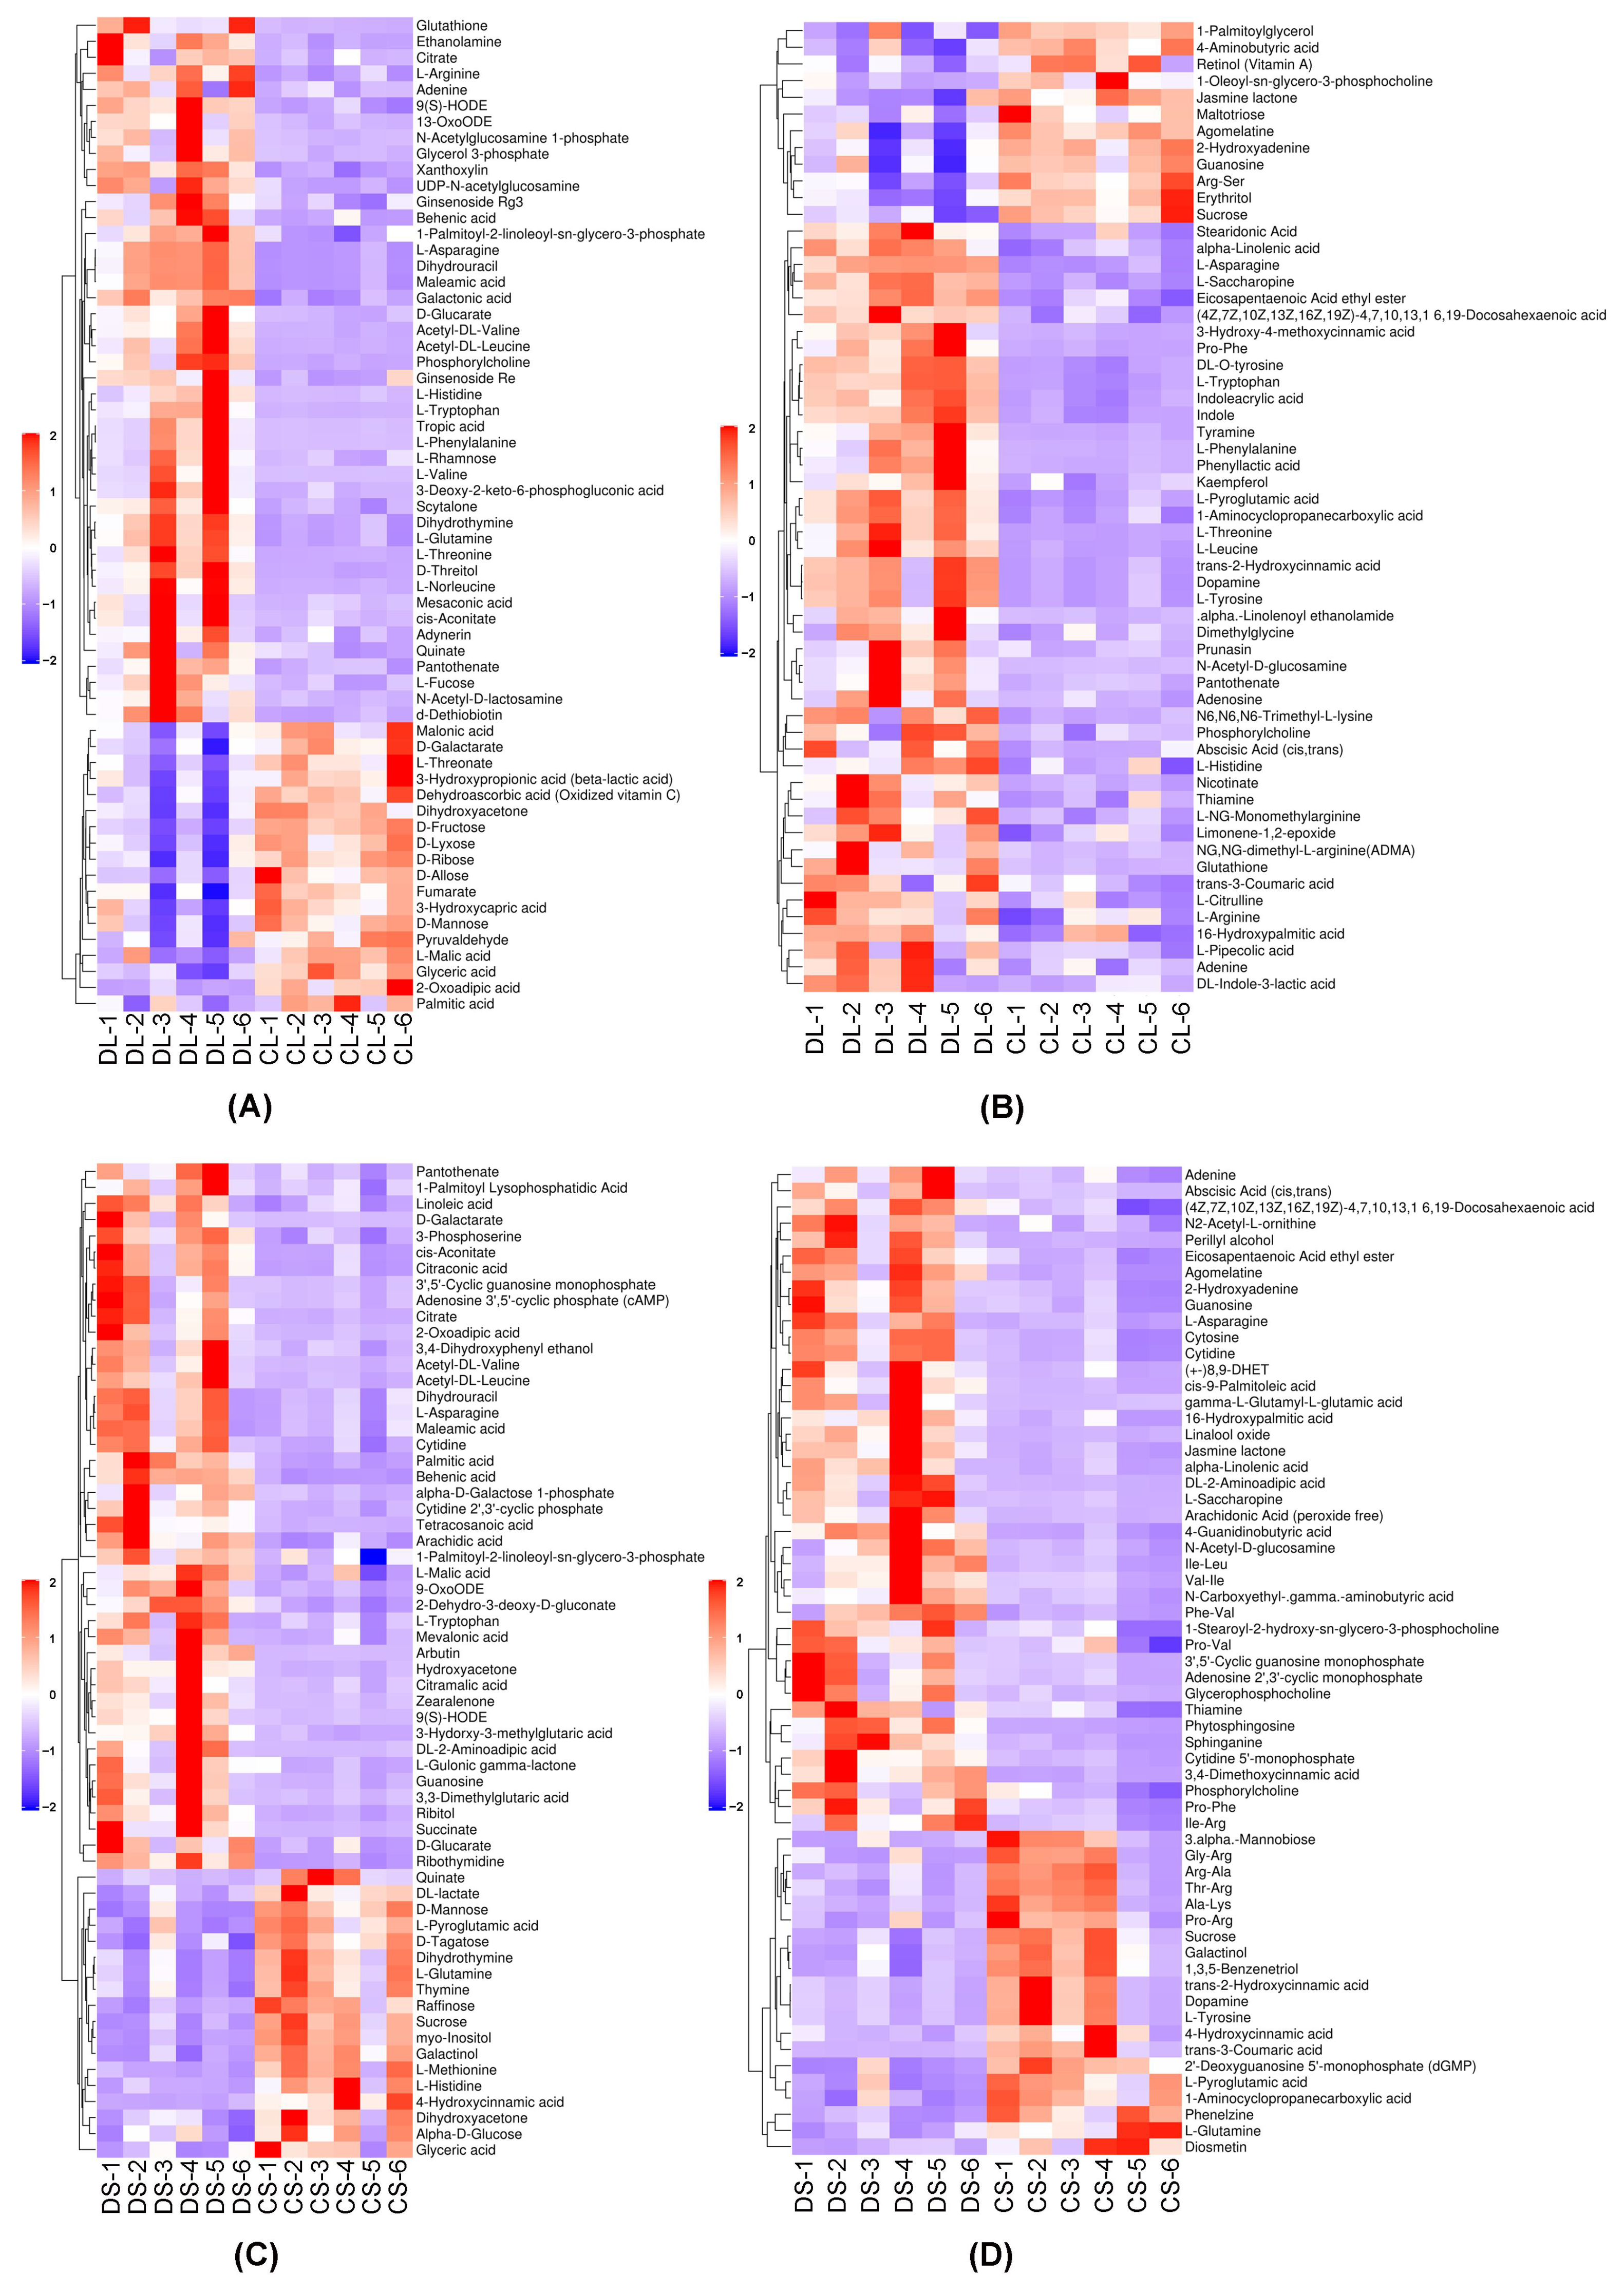
3.3. Heatmap of Differential Metabolites

In order to evaluate the changing trend of metabolites, different peak intensities of metabolites were regarded as change criteria which were standardized by z-score and represented in a grid of colored squares comprehensively and intuitively. The higher expression of differential metabolites was associated with red color, and a lower expression was shown in the form of blue color. In addition, the hierarchical clustering of significant metabolites was established, metabolites with similar characteristics were classified, and related metabolic processes were explored. As shown in Figure 3, the differential metabolites were obviously divided into two different color parts, which demonstrated that there were significant differences between control and diseased samples. In ginseng leaves, carbohydrates were clustered in the same groups and simultaneously had similar expression patterns. In contrast, amino acids, some organic acids, and secondary metabolites mostly up-regulated in the DL group were clustered in the same group with analogical expression. The expression of significant differential metabolites in the stems of ginseng also showed a similar trend.
The Pearson coefficient correlation heatmap displayed in Figure 4 reflects the relationship among the differential metabolites. In pairwise correlation analysis of ginseng leaves and stems, most carbohydrates were positively correlated with each other and negatively associated with amino acids. In addition, amino acids such as phenylalanine, tyrosine, tryptophan, leucine, valine, asparagine, threonine, glutamine, citrulline, and arginine, showed a consistent positive correlation. Due to a close regulatory network of the biosynthesis of amino acids, an interaction effect was speculated to affect plant resistance in the amino acids’ biosynthesis and catabolism pathways. The results of the heatmap indicate that amino acid and carbohydrate metabolites might be closely involved in reaction steps related to the invasion of P. cactorum.

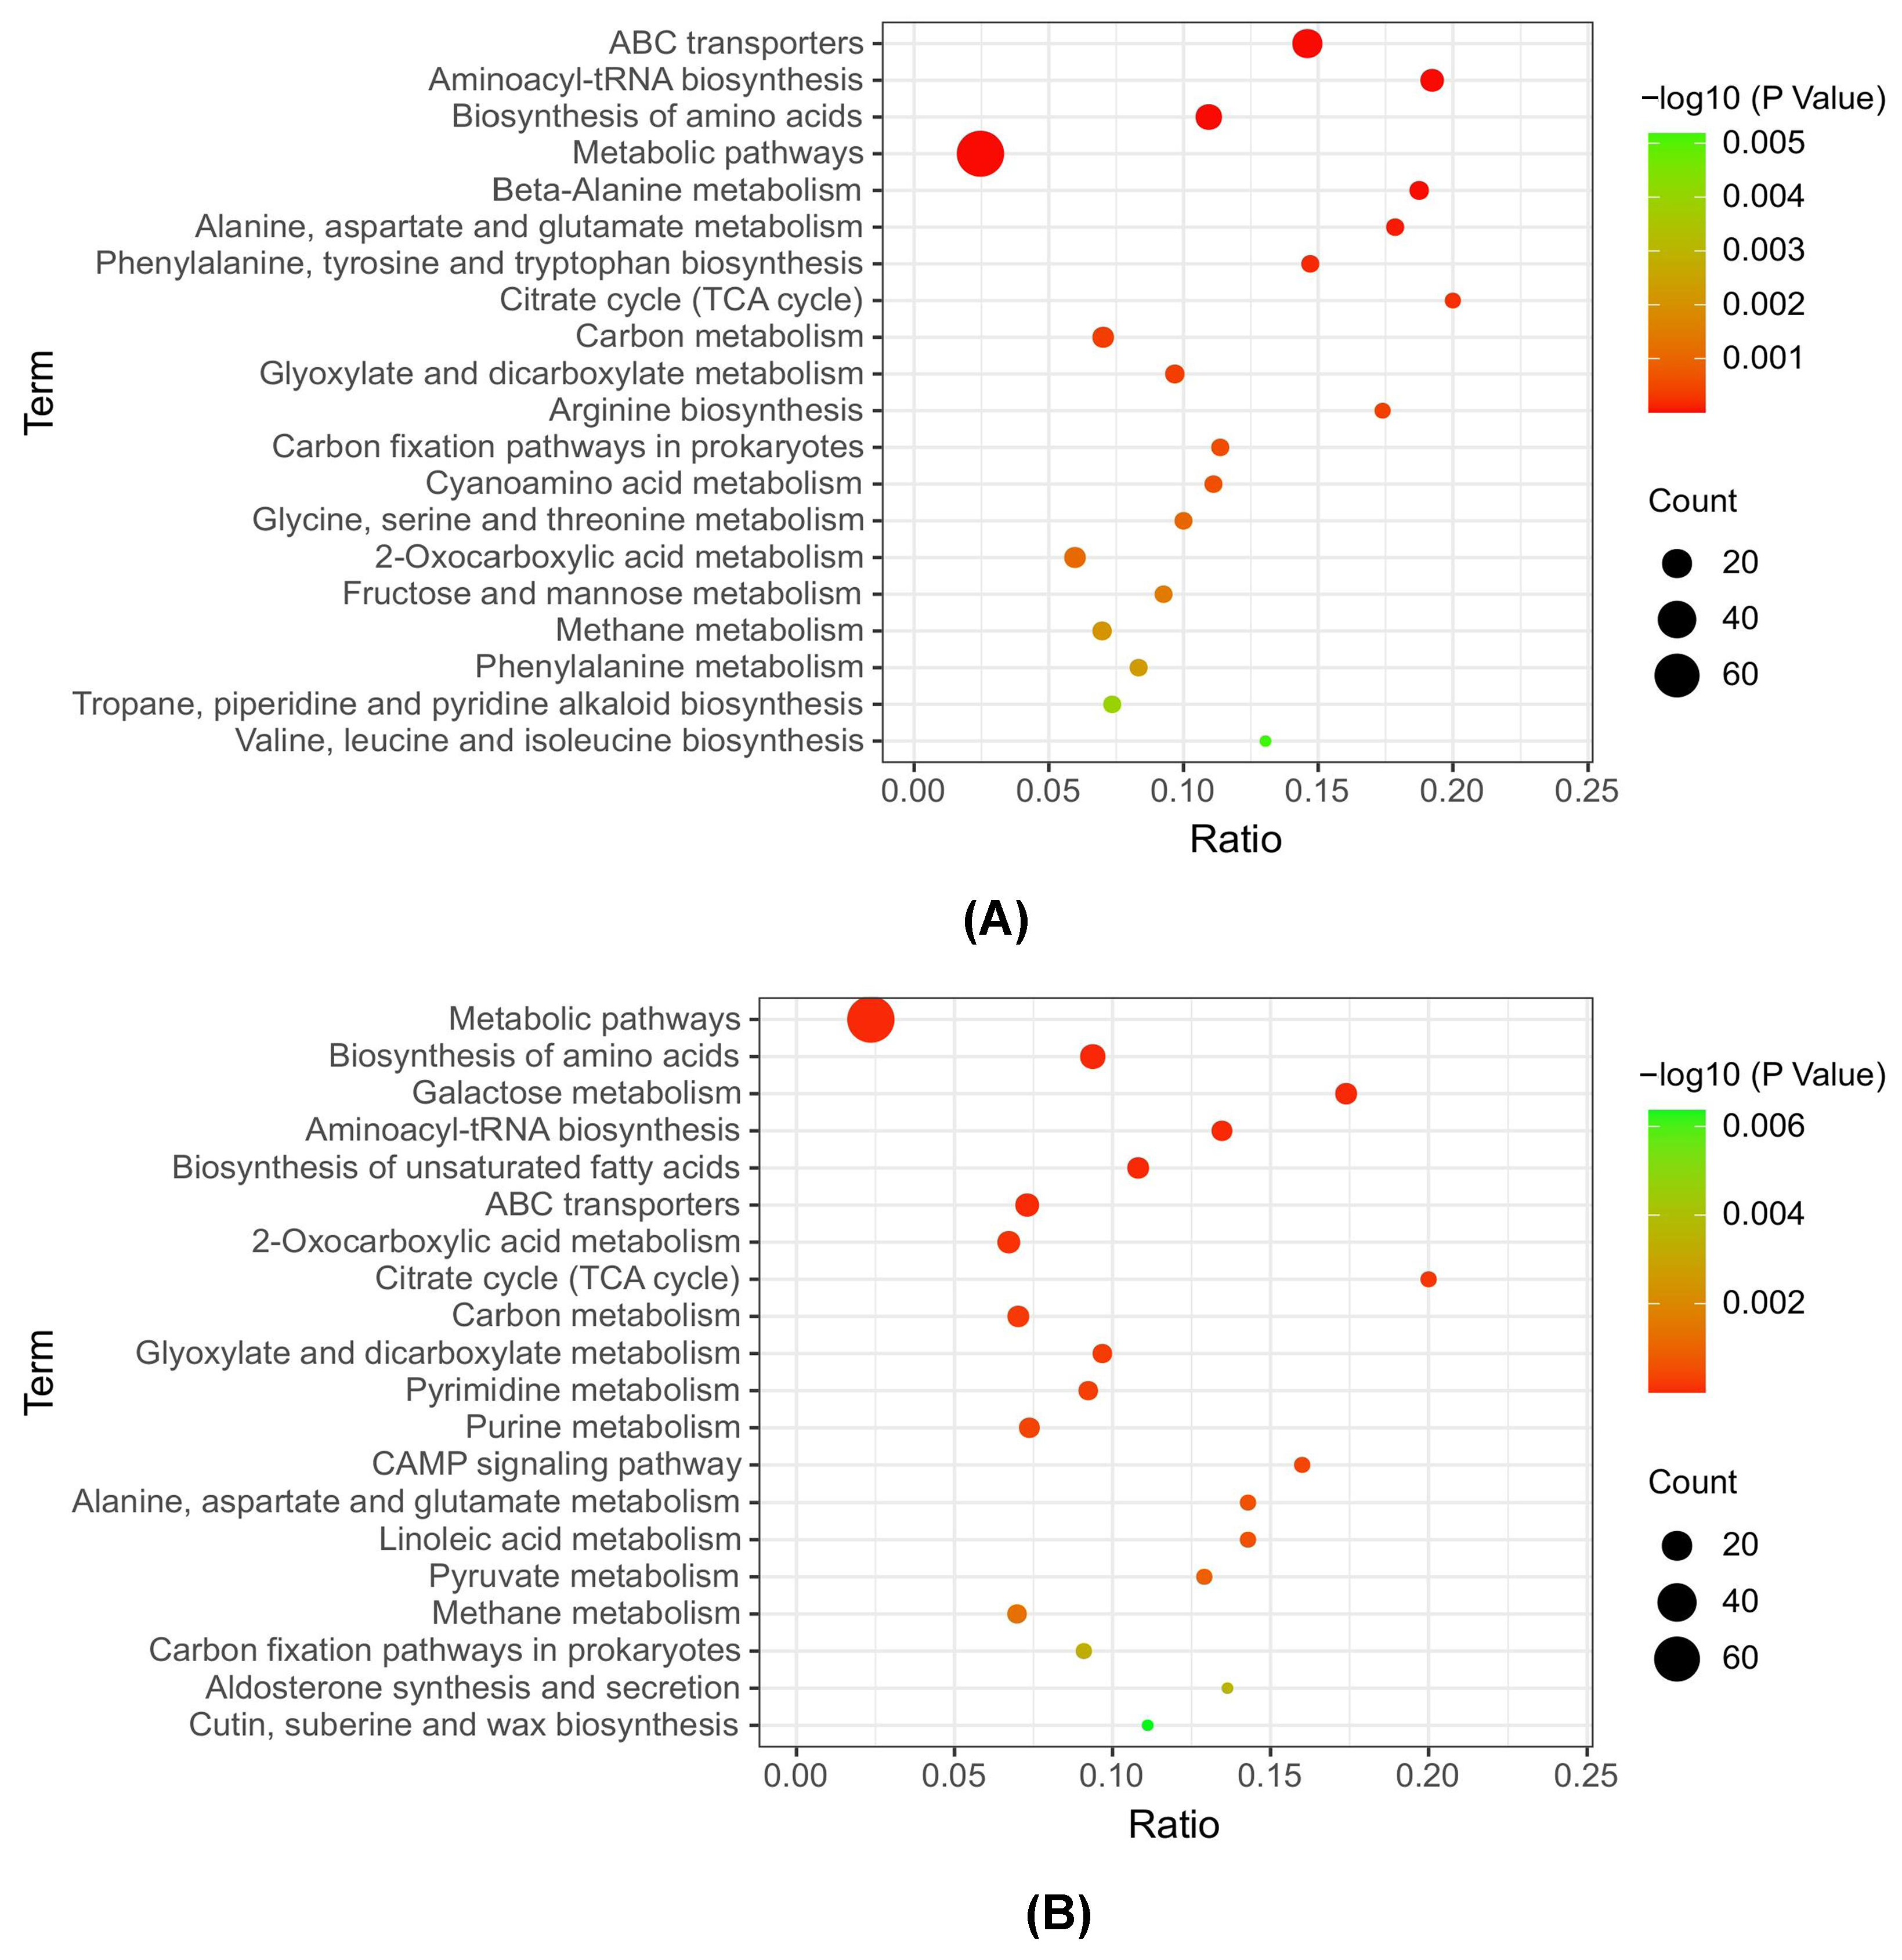
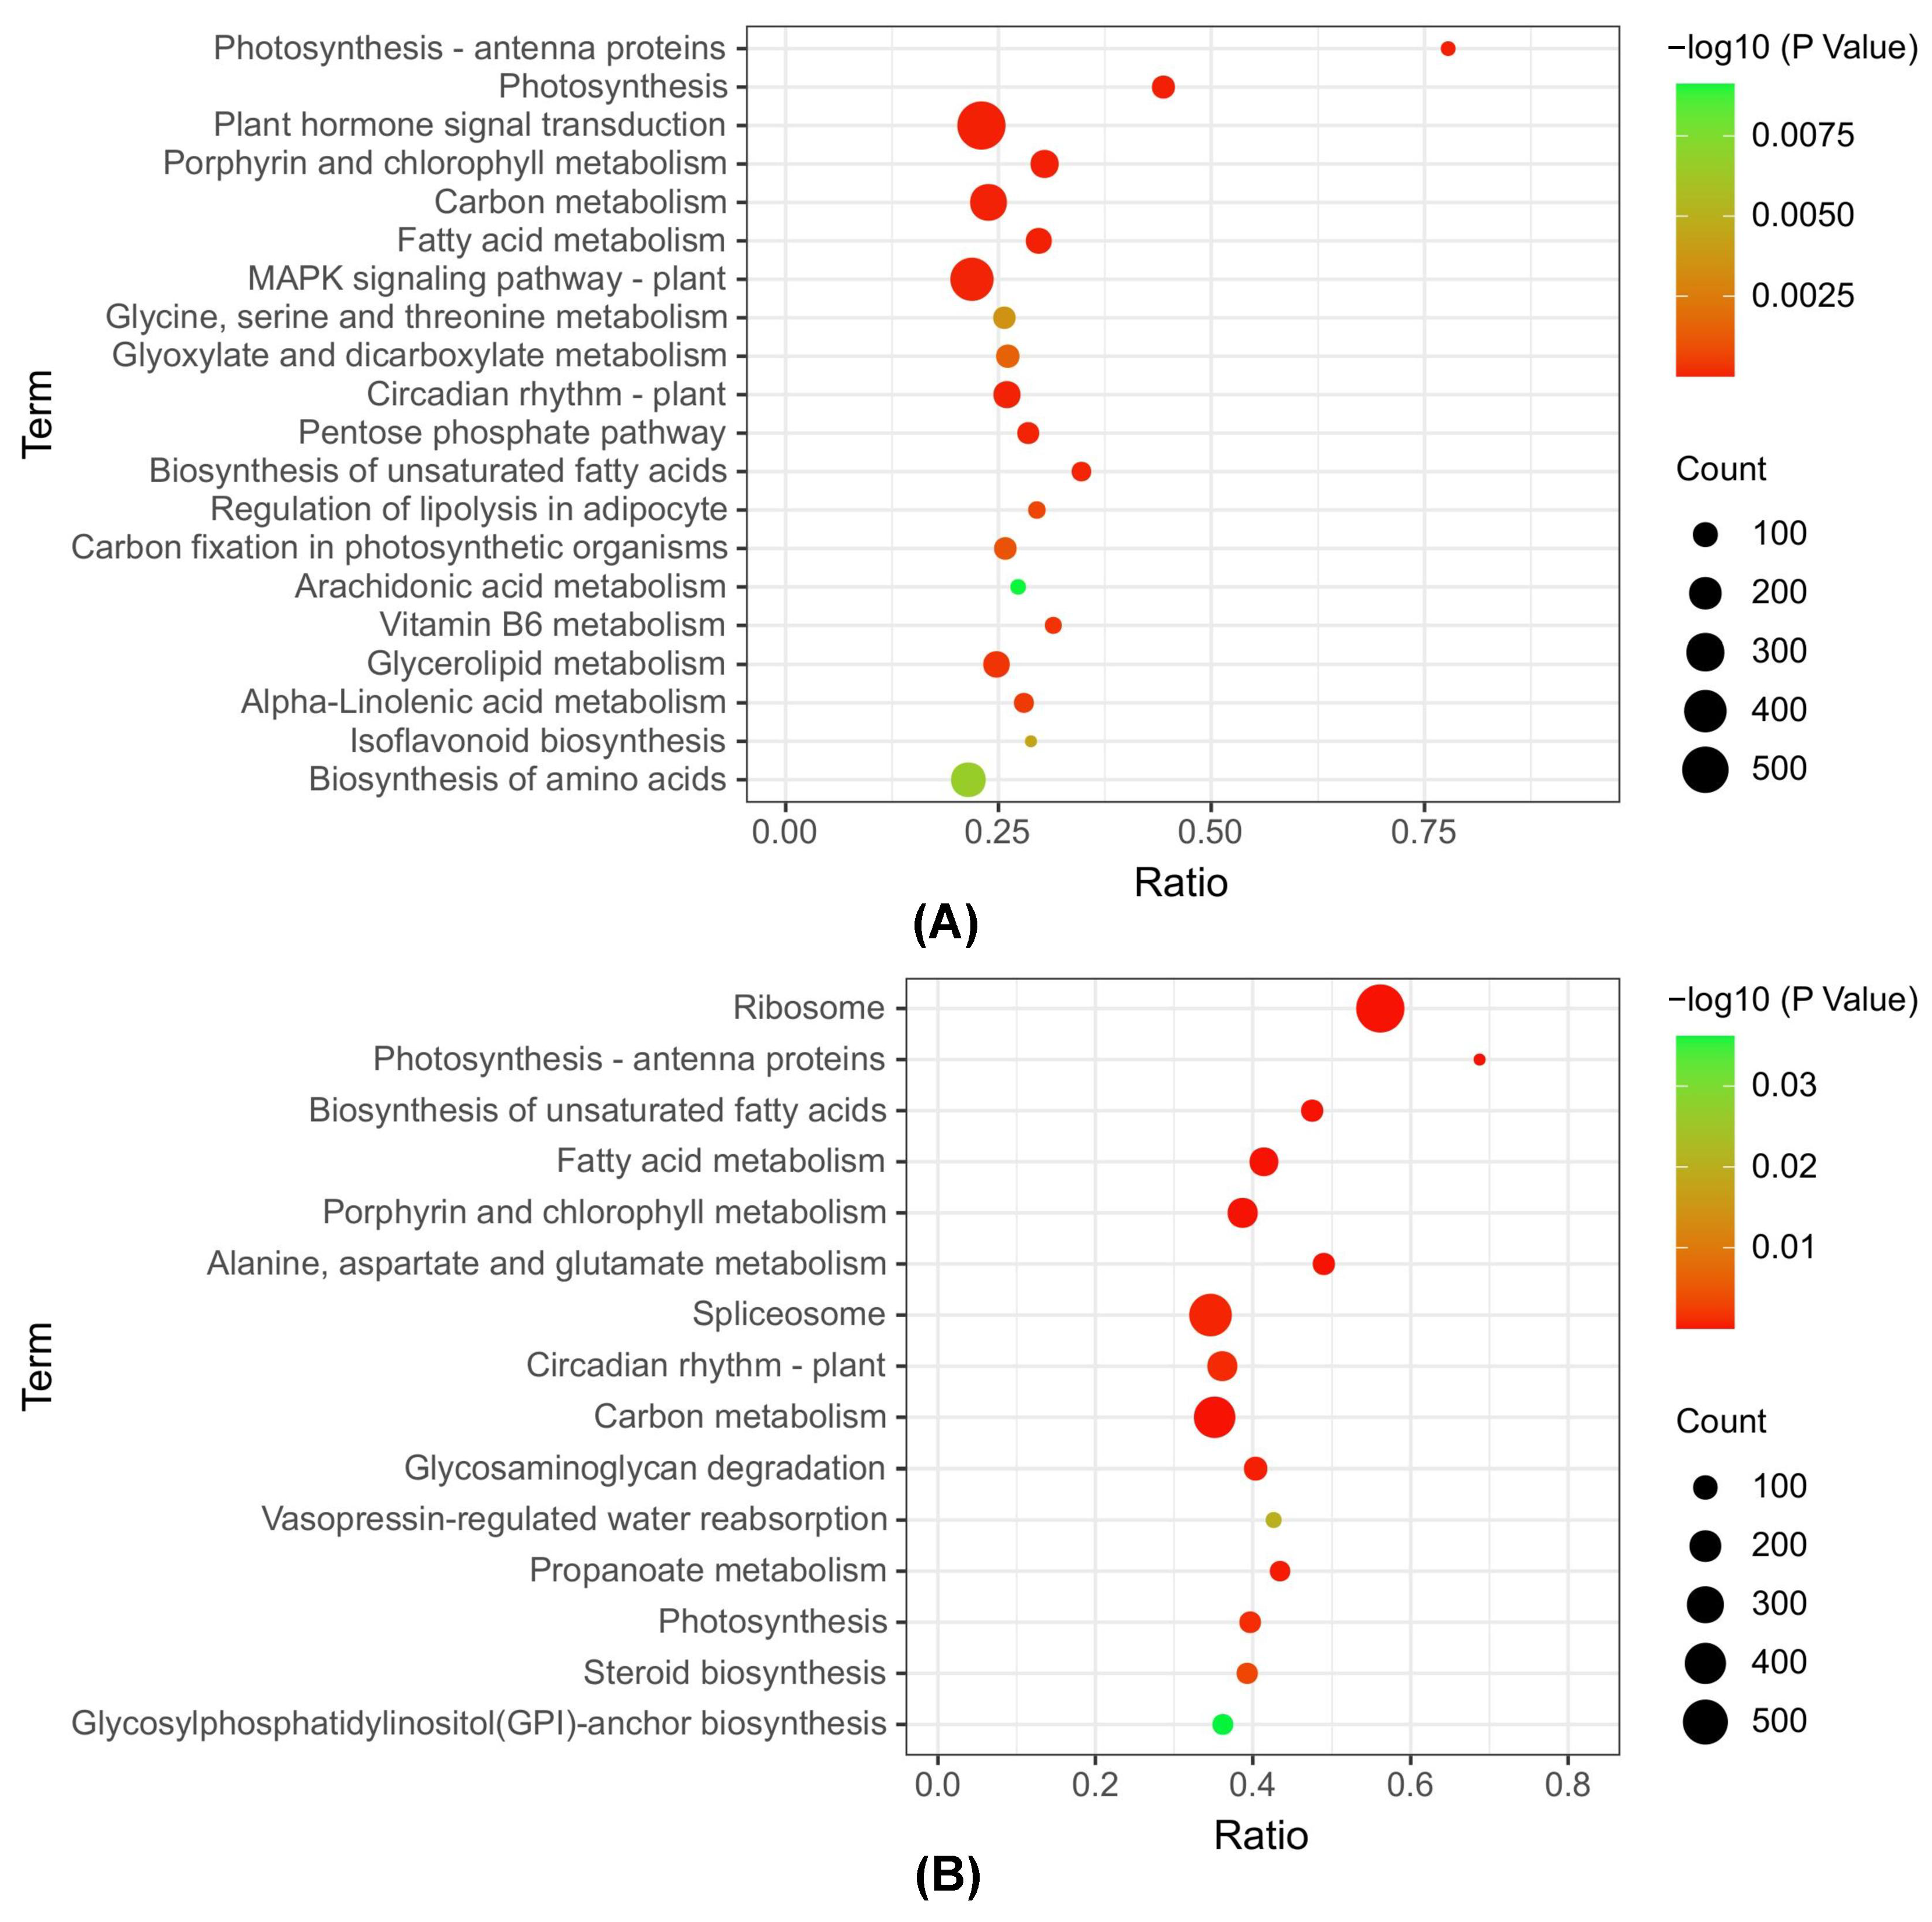
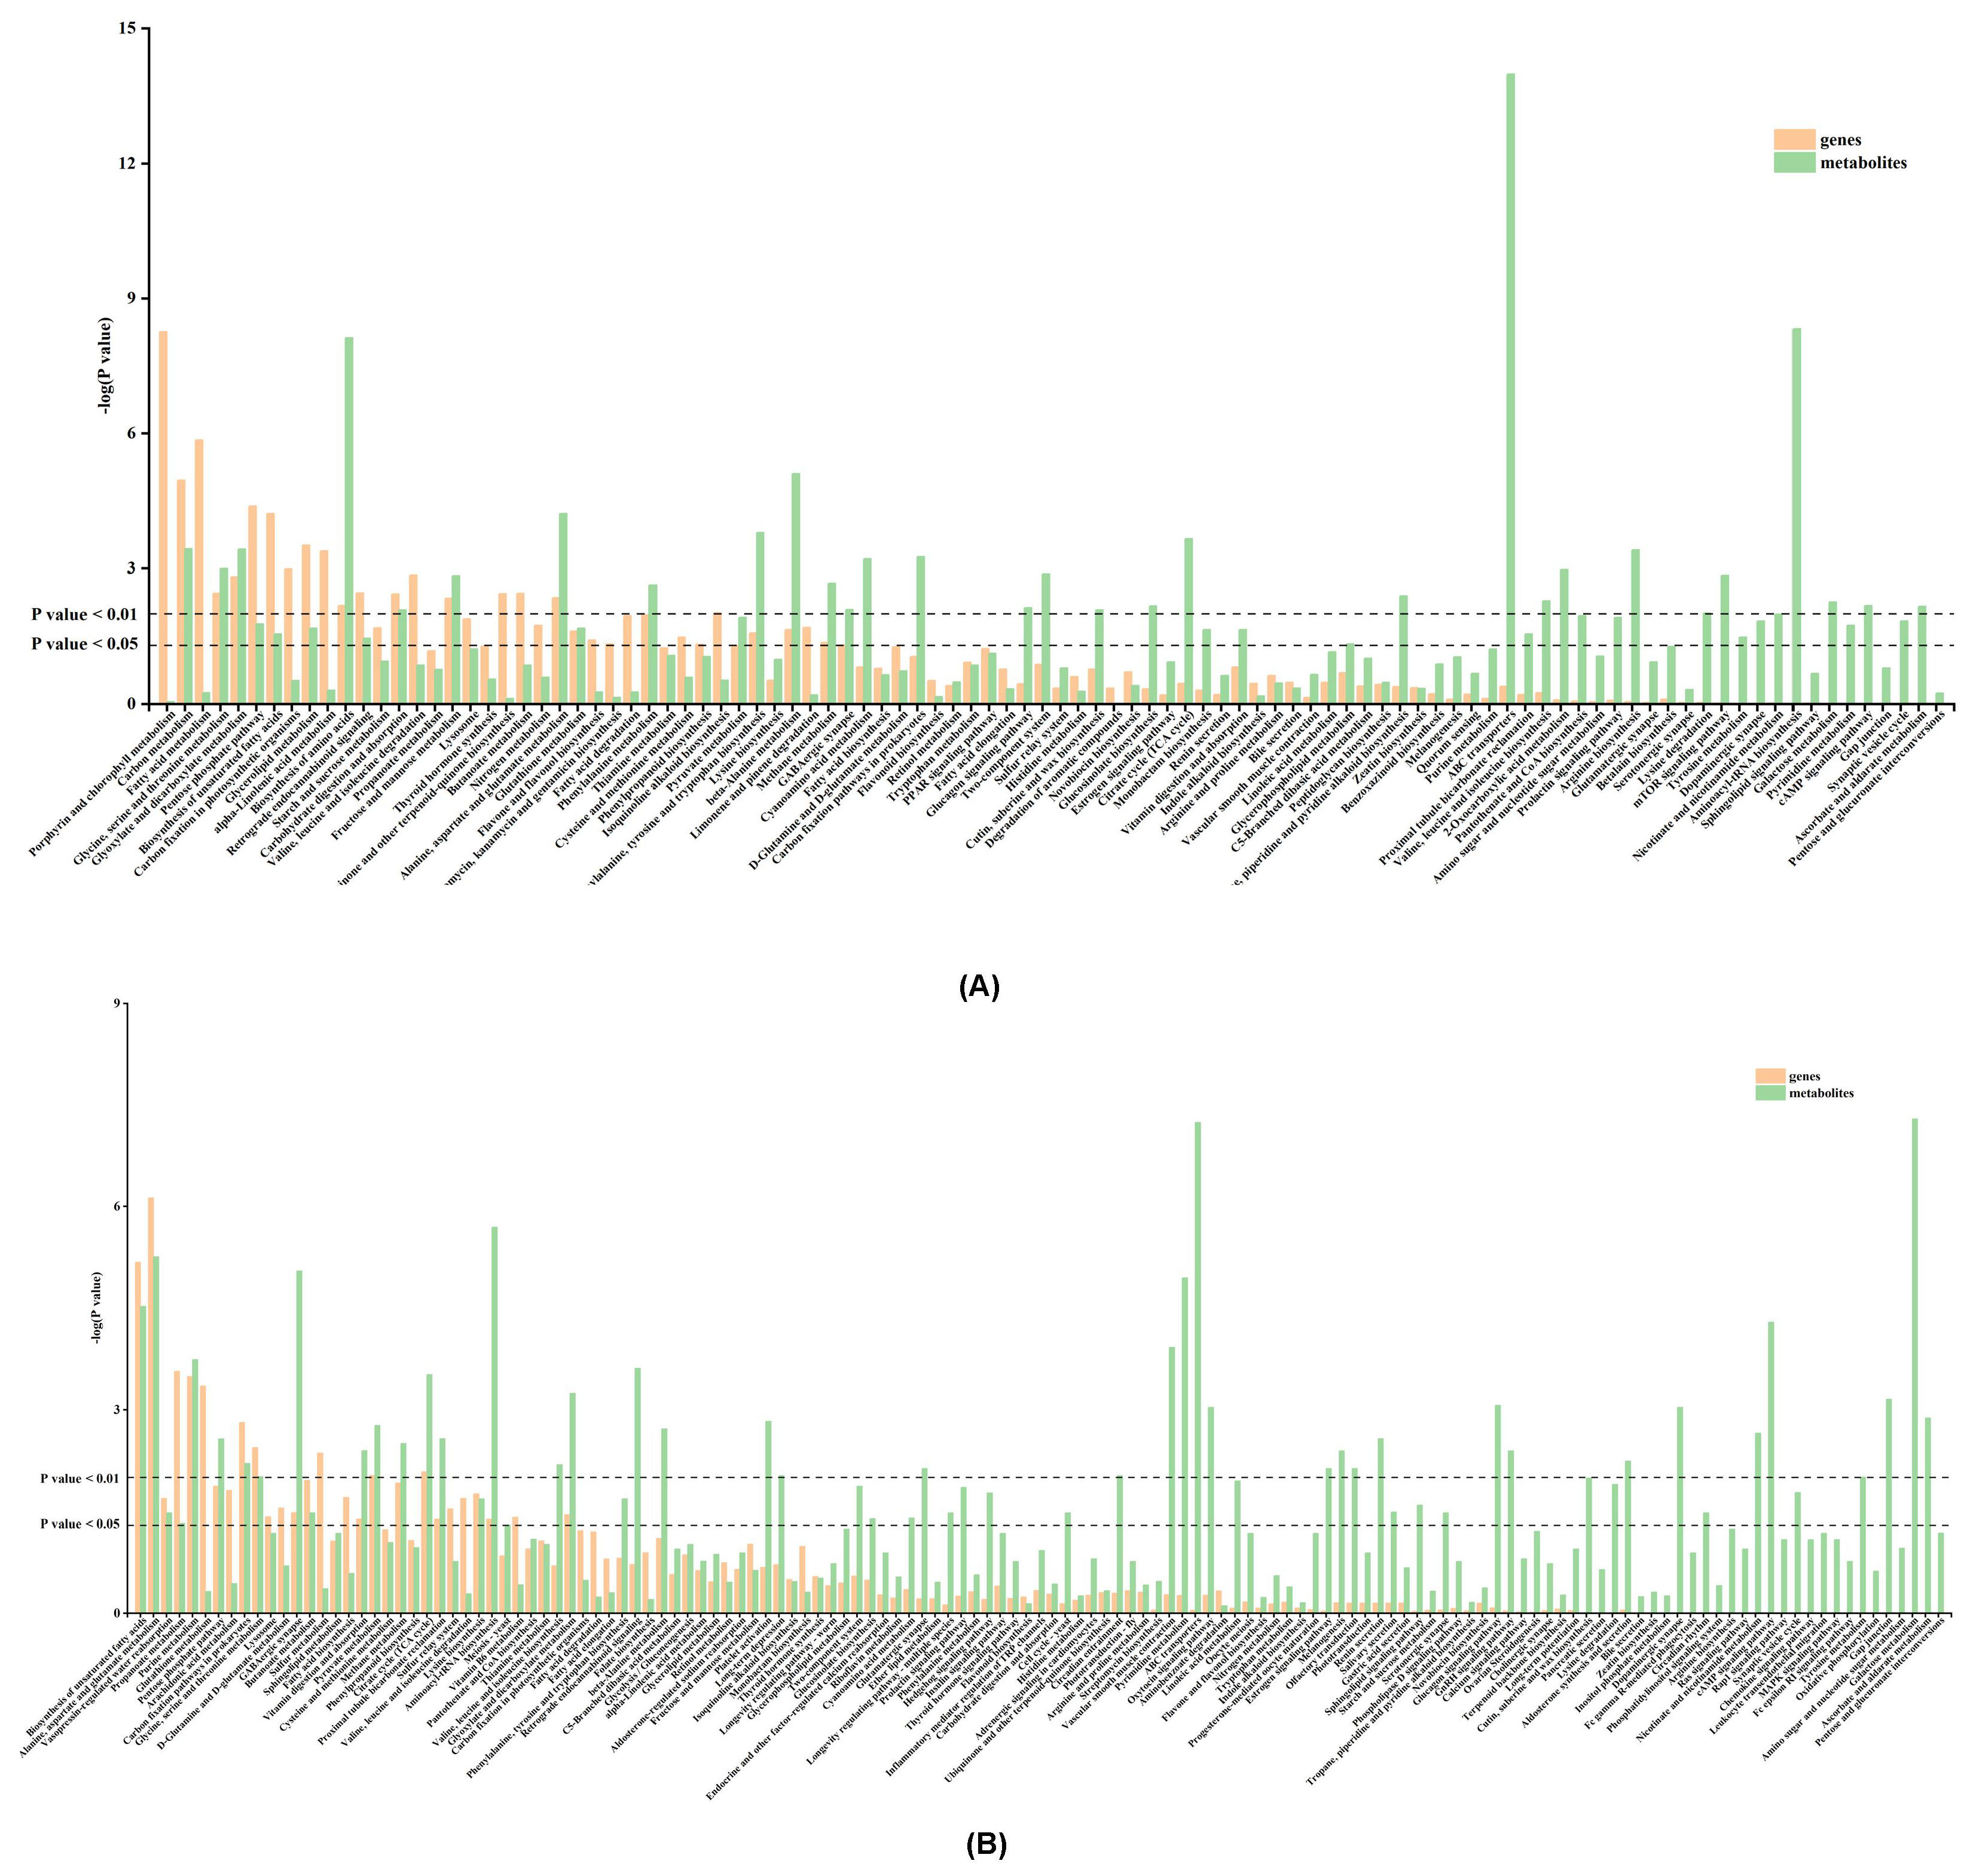
3.4. KEGG Metabolic Pathway Analysis

KEGG database (http://www.genome.jp/kegg/, accessed on 15 October 2022) provides a reference knowledge of molecular interaction/reaction network diagram [38]. Furthermore, KEGG pathway analysis was also carried out, which provided effective information for studying the changes in ginseng leaves and stems infected by P. cactorum. Differentially accumulated metabolites in CL and DL groups were functionally annotated, and the top 20 metabolic enrichment pathways were classified and enriched in Figure 5A. These metabolic pathways are related to amino acid biosynthesis (“Arginine biosynthesis”, “Phenylalanine, tyrosine and tryptophan biosynthesis”, “Valine, leucine and isoleucine biosynthesis”), amino acids metabolism (“Beta-Alanine metabolism”, “Alanine, aspartate and glutamate metabolism”, “Glycine, serine and threonine metabolism”, “Phenylalanine metabolism, Cyanoamino acid metabolism”), lipids metabolism (“Glyoxylate and dicarboxylate metabolism”, “2-Oxocarboxylic acid metabolism”), “Fructose and mannose metabolism”, “ABC transporters”, “Aminoacyl-tRNA biosynthesis”, “Citrate cycle”, “Tropane, piperidine and pyridine alkaloid biosynthesis”. According to the data of pathway enrichment analysis, the most interfered metabolic pathways mainly include amino acids biosynthesis and metabolism, carbohydrate metabolism, and TCA cycle under the attack of P. cactorum. in the DL group. Figure 5B shows the top 20 metabolic enrichment pathways in the DS group, in which lipids metabolism (“Glyoxylate and dicarboxylate metabolism”, “2-Oxocarboxylic acid metabolism”), “ABC transporters”, “Alanine, aspartate and glutamate metabolism”, “Aminoacyl-tRNA biosynthesis” also appeared. Moreover, there have also been marked changes in the “Biosynthesis of unsaturated fatty acids”, “Pyrimidine metabolism, and Purine metabolism” pathways.

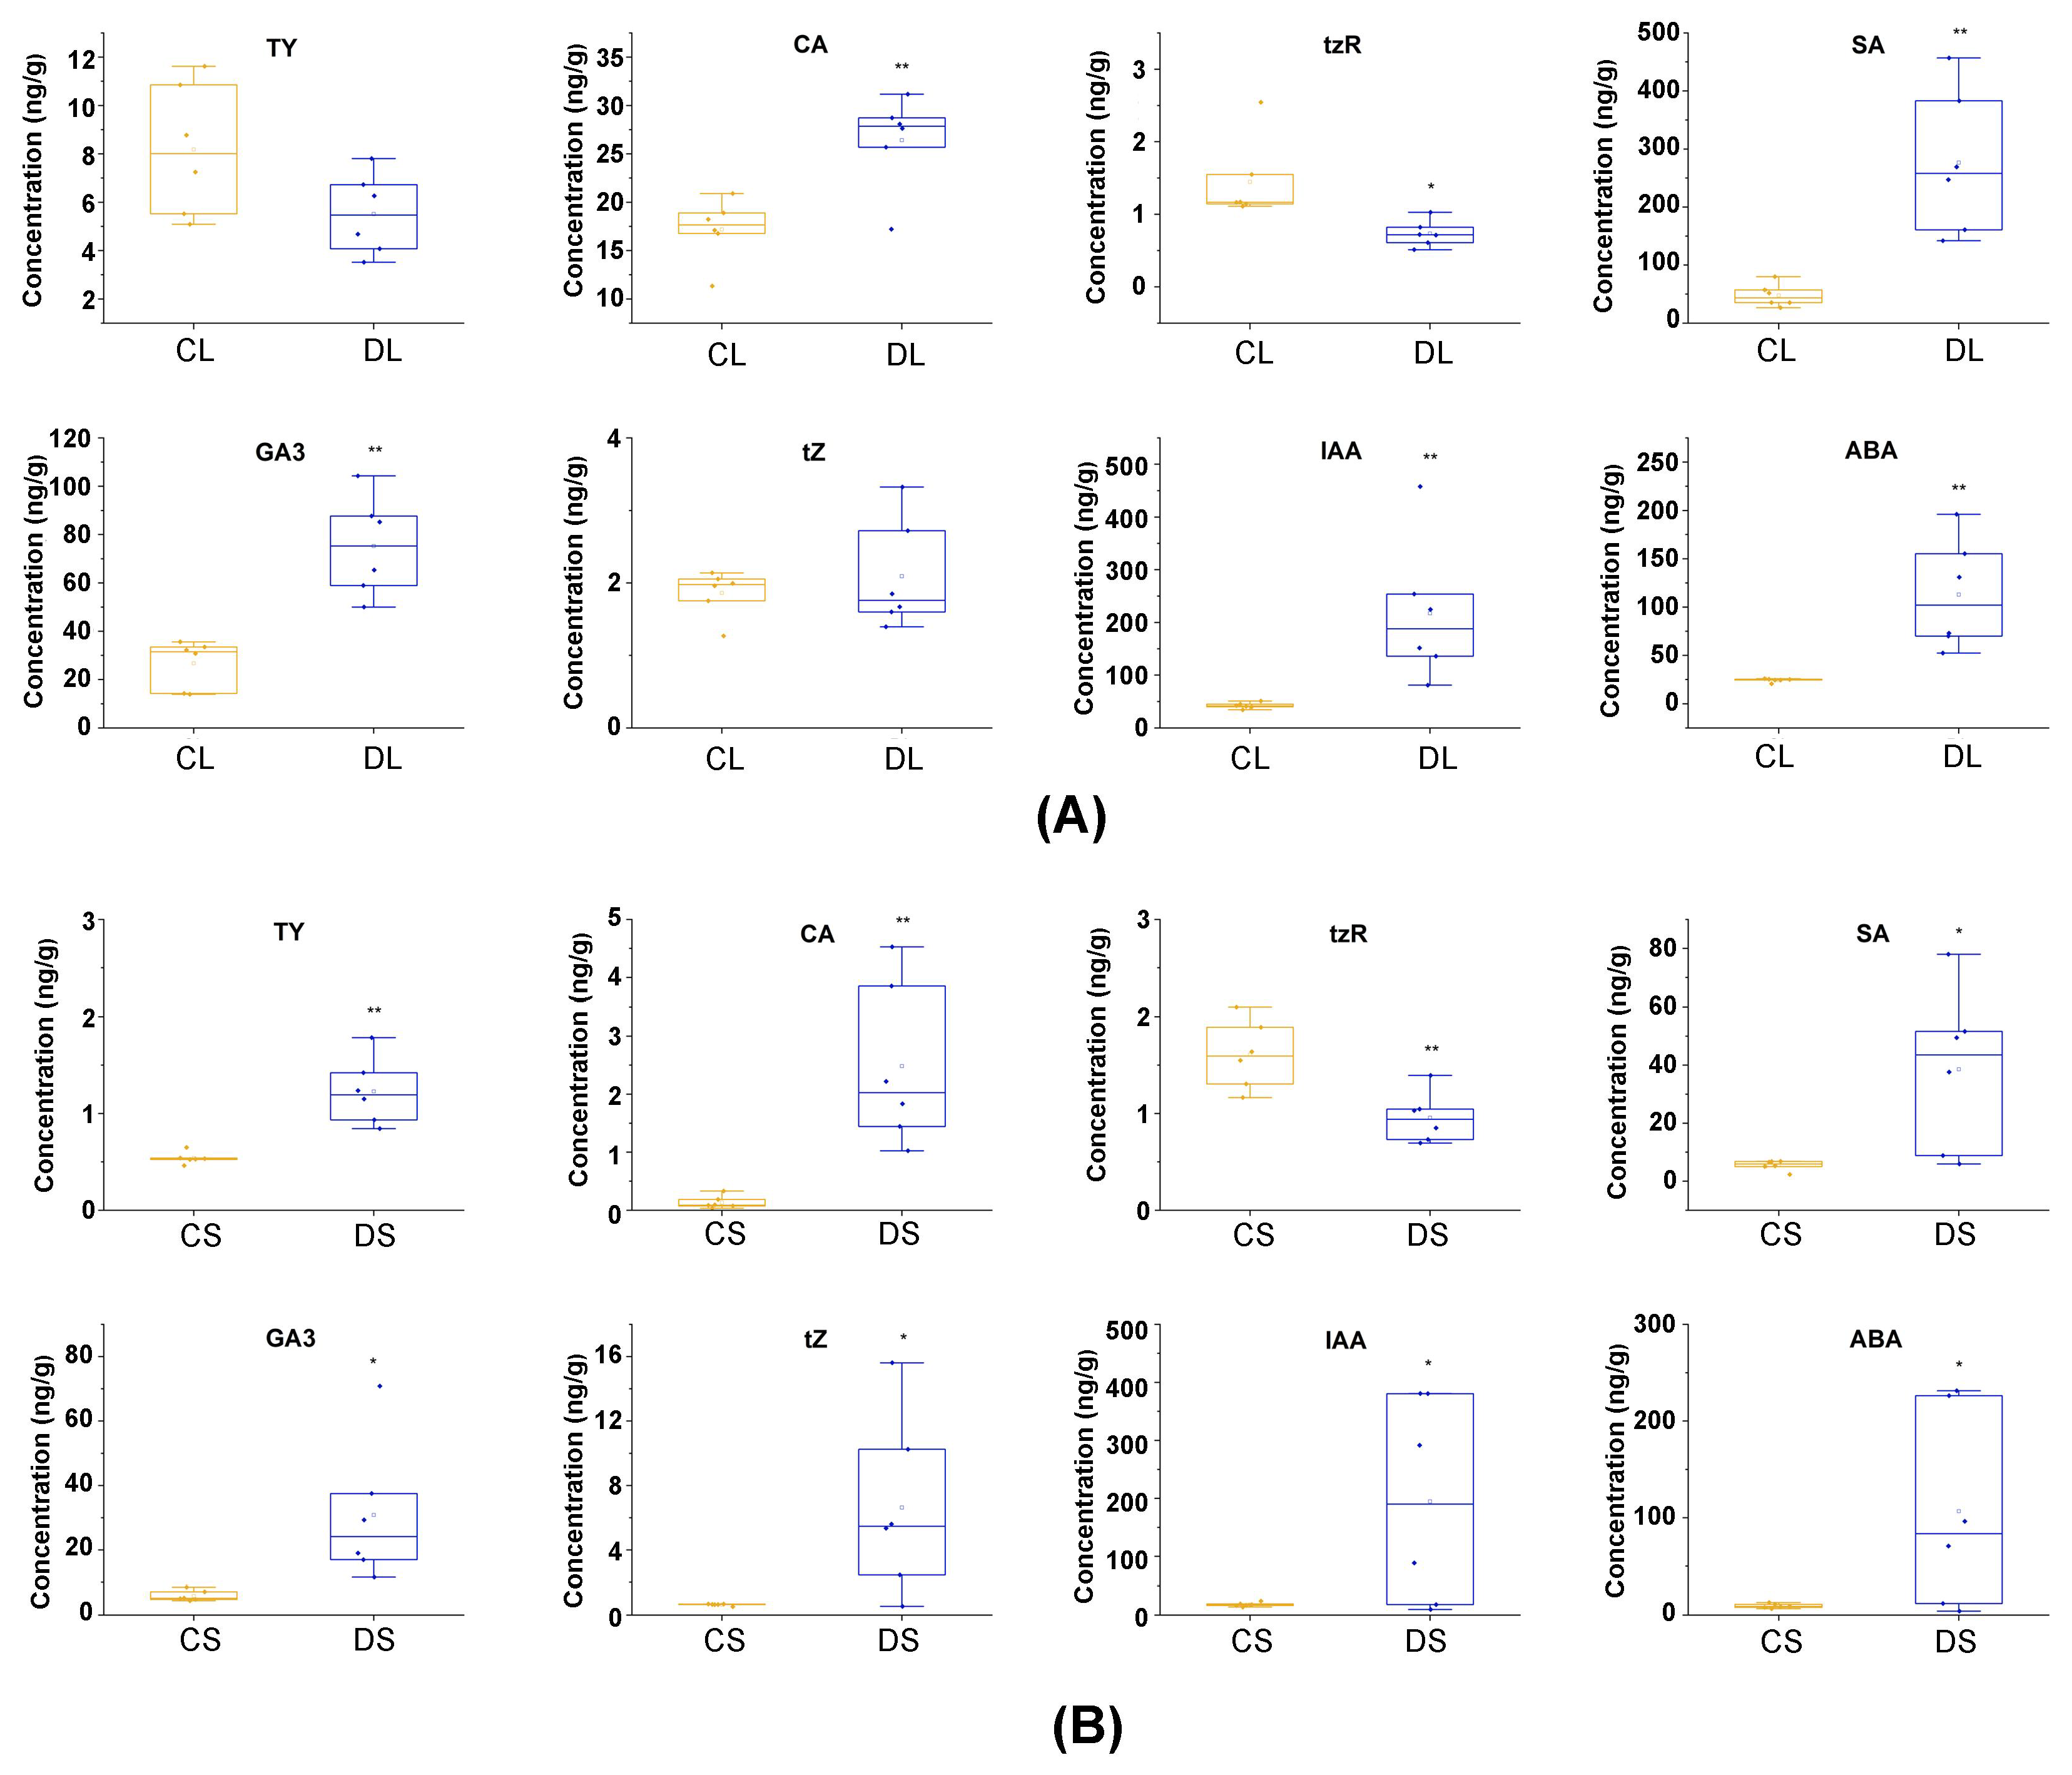
3.5. Quantitative Analysis of Plant Hormones

Phytohormone is a small organic molecule, which is mainly divided into auxin, ABA, brassinosteroids (BRs), cytokinins (CK), SA, ethylene (ET), jasmonic acid (JA), gibberellin (GA) and strigolactones (SL) [39]. Accumulating evidence suggests that phytohormone plays an essential role in the process of overcoming various biotic stress in plants [40,41,42,43].
On account of the low content of plant hormones, UPLC MS/MS with MRM was utilized to observe the concentration changes in the diseased group compared to the control group. TY, CA, tzR, SA, GA3, tZ, IAA, and ABA were detected, and their perturbation levels are shown in Figure 6. In the DL group, the expression of CA, SA, GA3, IAA, and ABA were up-regulated, while the expression of tZR was down-regulated, and there are significant differences between the two groups. In the DS group, the content of TY, CA, SA, GA3, tZ, IAA, and ABA increased compared to the CS group. The expression of tZR in ginseng stems exhibited the same trend as in ginseng leaves.

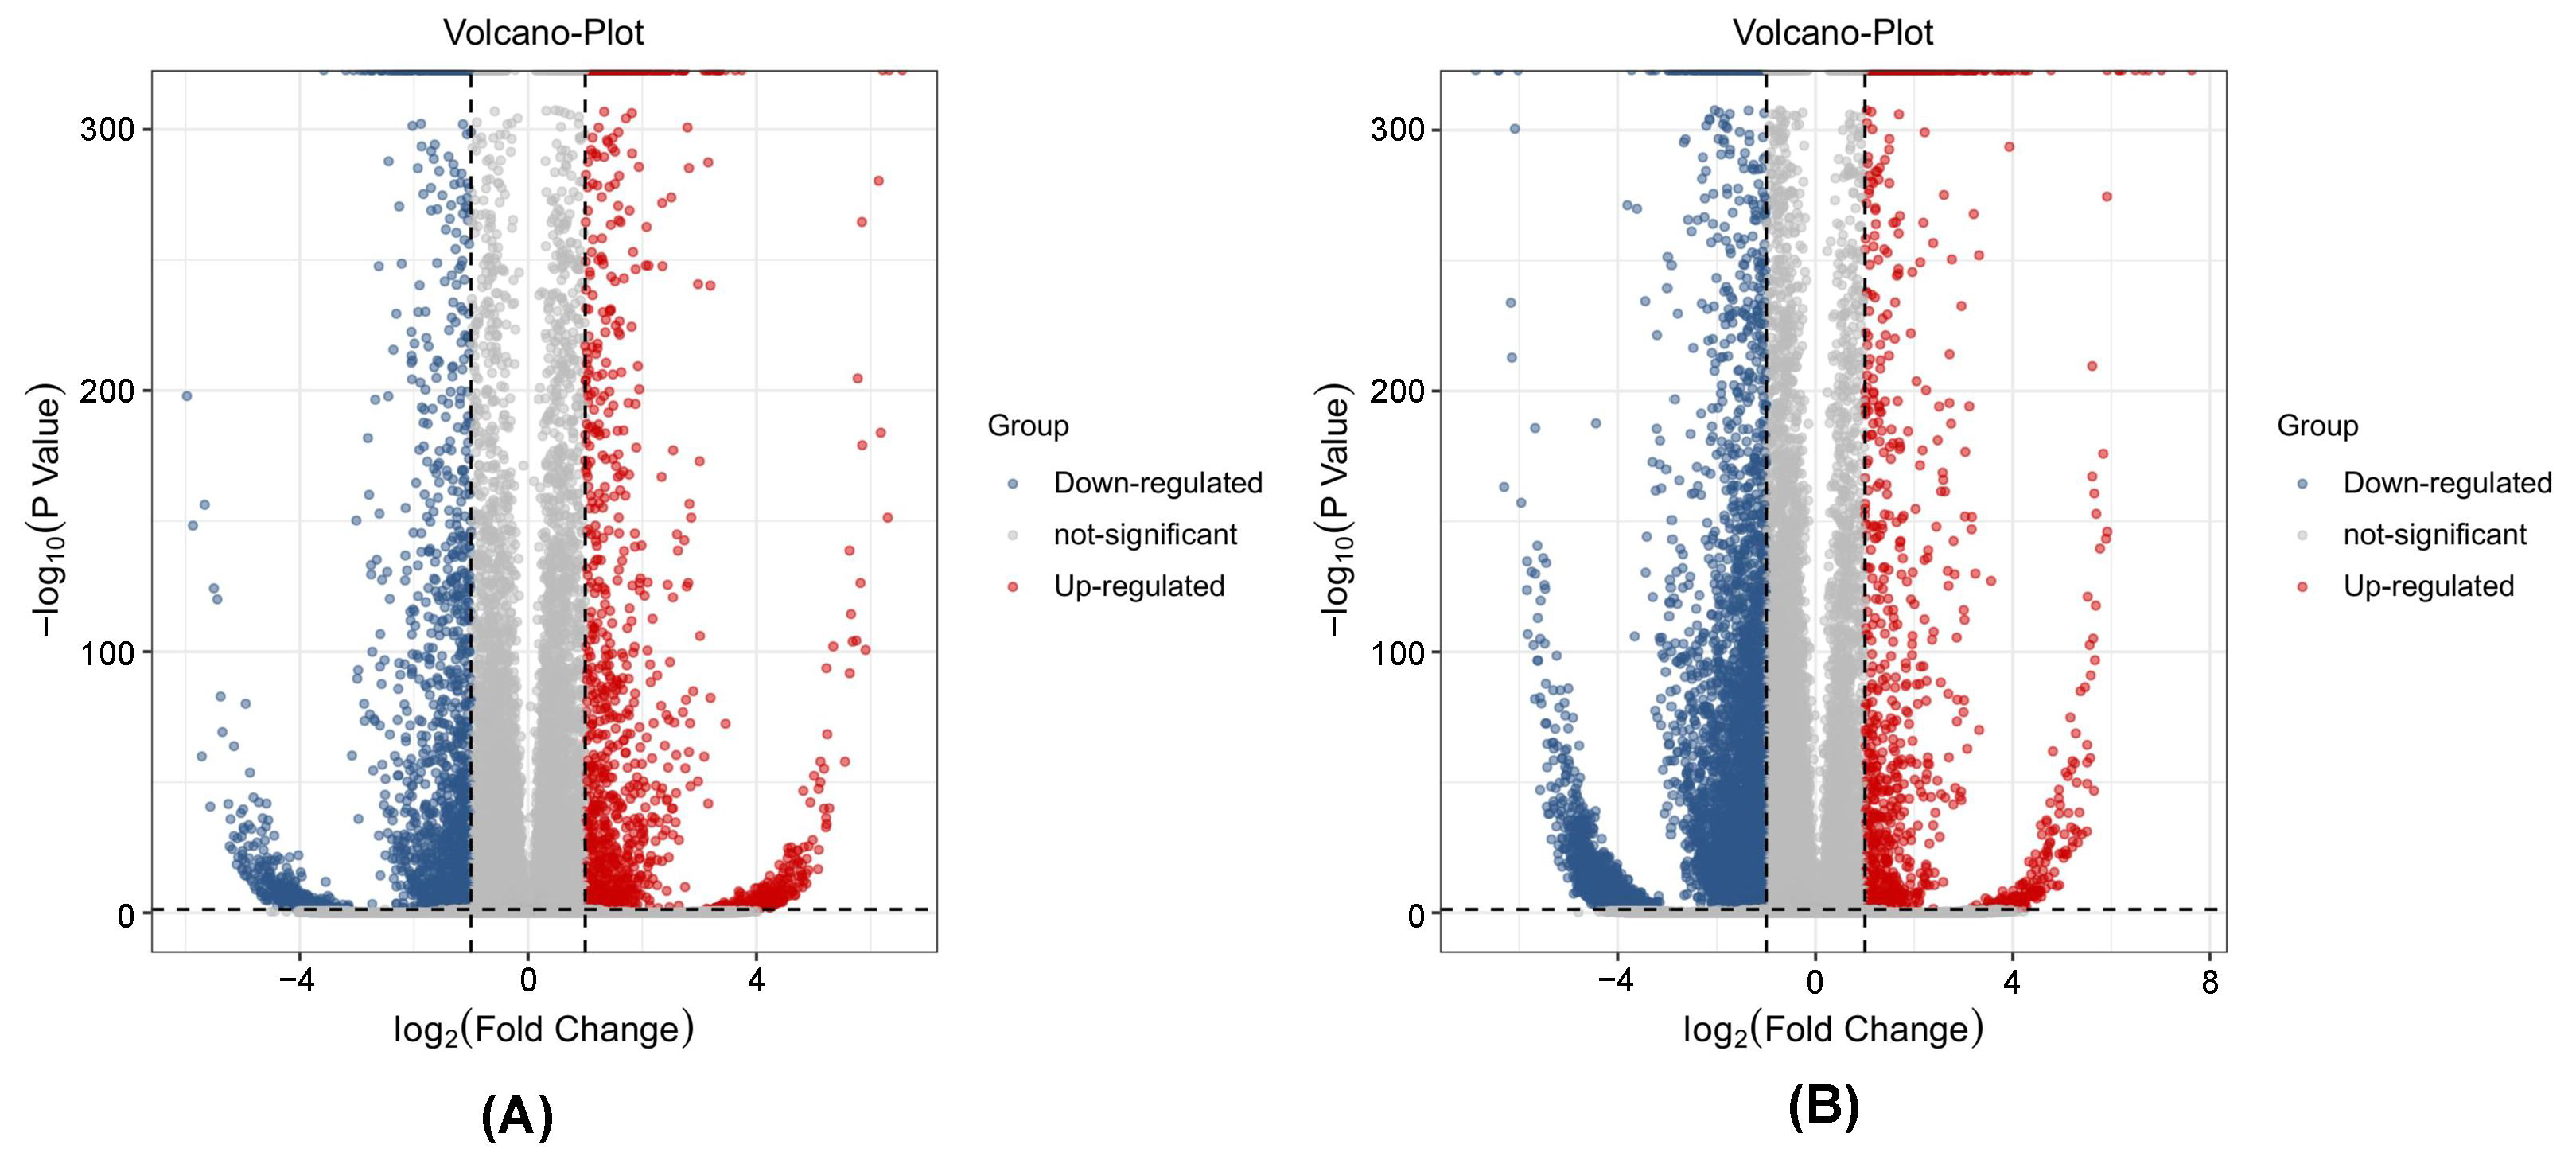
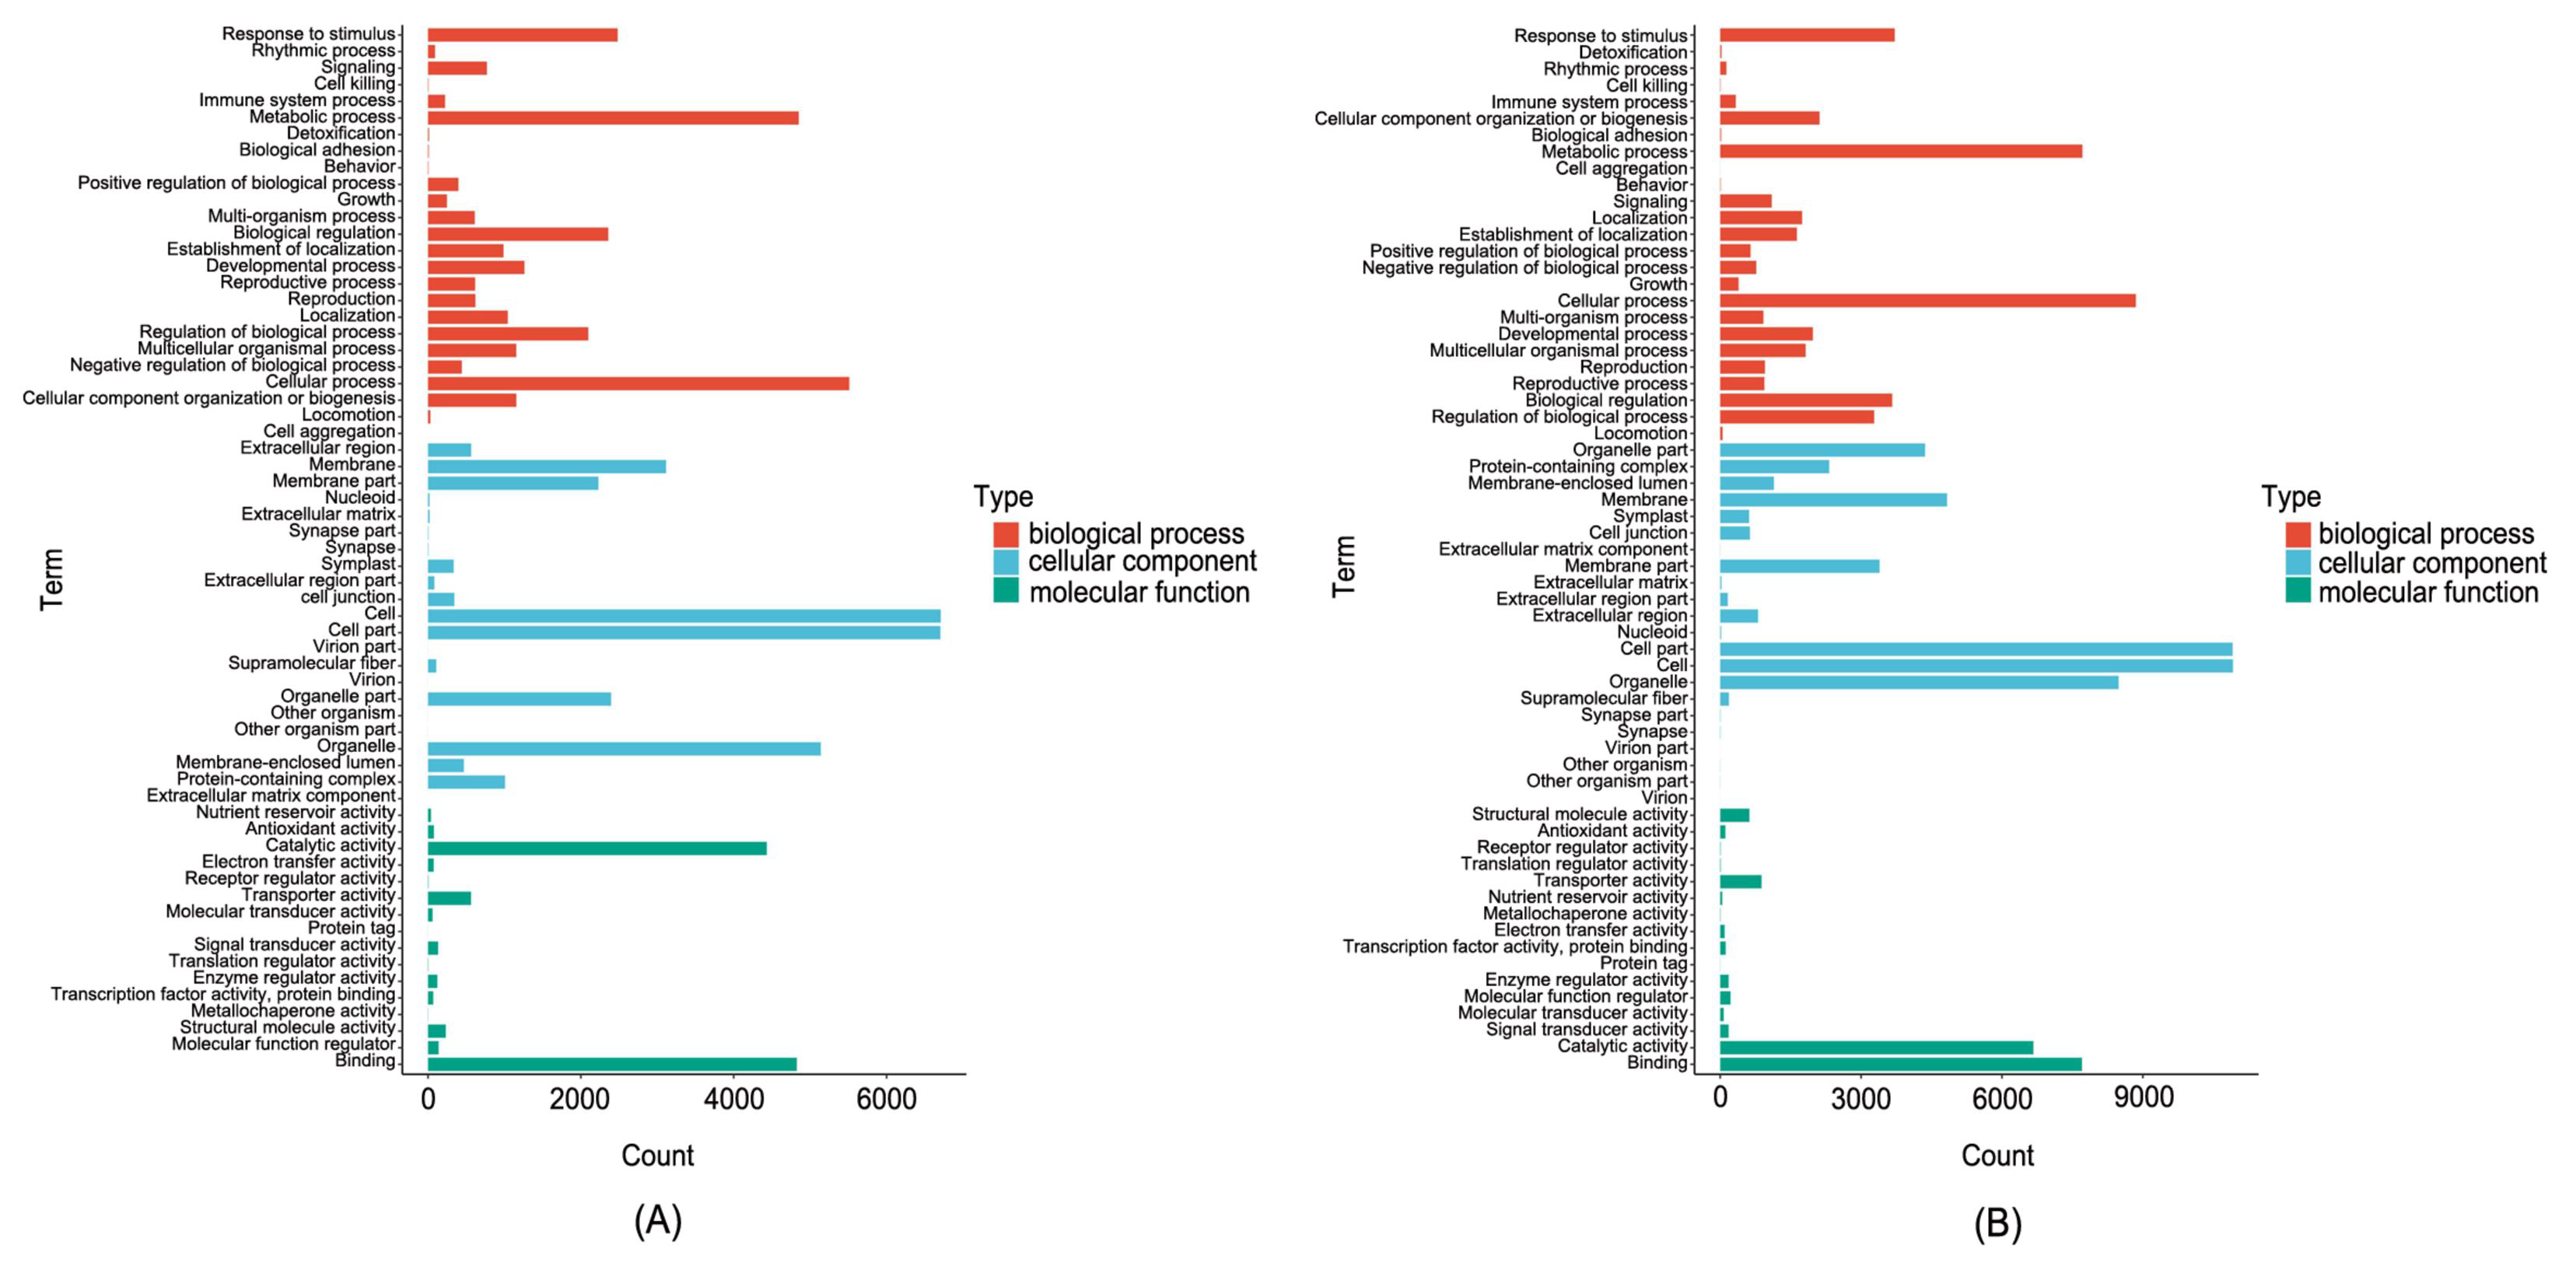
3.6. DEGs Analysis in Ginseng Related to P. cactorum

DEGs in ginseng related to P. cactorum were validated by the volcano plot (Figure 7), in which the criteria were set as p-value < 0.05 and |log2FC| > 1. The results showed that in the DL group, the expression of 5970 genes increased, and that of 9271 decreased. In the DS group, the expression of 4515 genes was upregulated, and 22,106 genes were down-regulated compared with the CS group.
GO provides a framework and set of concepts for describing the functions of gene products from all organisms [44]. To further derive the underlying biochemistry of the host response to the infection, GO was applied to predict the functions of DEGs in the leaves and stems of ginseng. As shown in Figure 8, all the DEGs can be divided into three categories, including biological process (BP), cellular component (CC), and molecular function (MF) in the GO enrichment barplot.
In infected ginseng leaves, we identified the most significantly enriched BP terms, including “cellular process”, “metabolic process”, “response to stimulus”, “biological regulation”, and “regulation of biological process”; In the CC category, the most important GO categories were “cell”, “cell part”, “organelle”, and “membrane”; and in the MF category, the most important GO categories were “binding” and “catalytic activity”. A similar trend was also observed in the stem tissue: the most significantly enriched BPs were “cellular process”, “metabolic process”, “response to stimulus”, and “biological regulation”; The most significantly enriched CCs were “cell”, “cell part”, “organelle”, “membrane”, “organelle part”; The most significantly enriched MFs were “binding”, “catalytic activity”, and “transporter activity”.
KEGG pathway analysis (Figure 9) was also used to present the most significantly involved pathways. Following the annotation of the KEGG pathway, pathways including “Plant hormone signal transduction”, “MAPK signaling pathway-plant”, “Vitamin B6 metabolism”, “Plant-pathogen interaction”, “Biosynthesis of amino acids”, “Photosynthesis-antenna proteins”, “Biosynthesis of unsaturated fatty acids”, “Fatty acid metabolism”, and “Alanine, aspartate, and glutamate metabolism” were thought to be involved in the leaves and stems of ginseng, respectively, in response to the stimulus of P. cactorum.

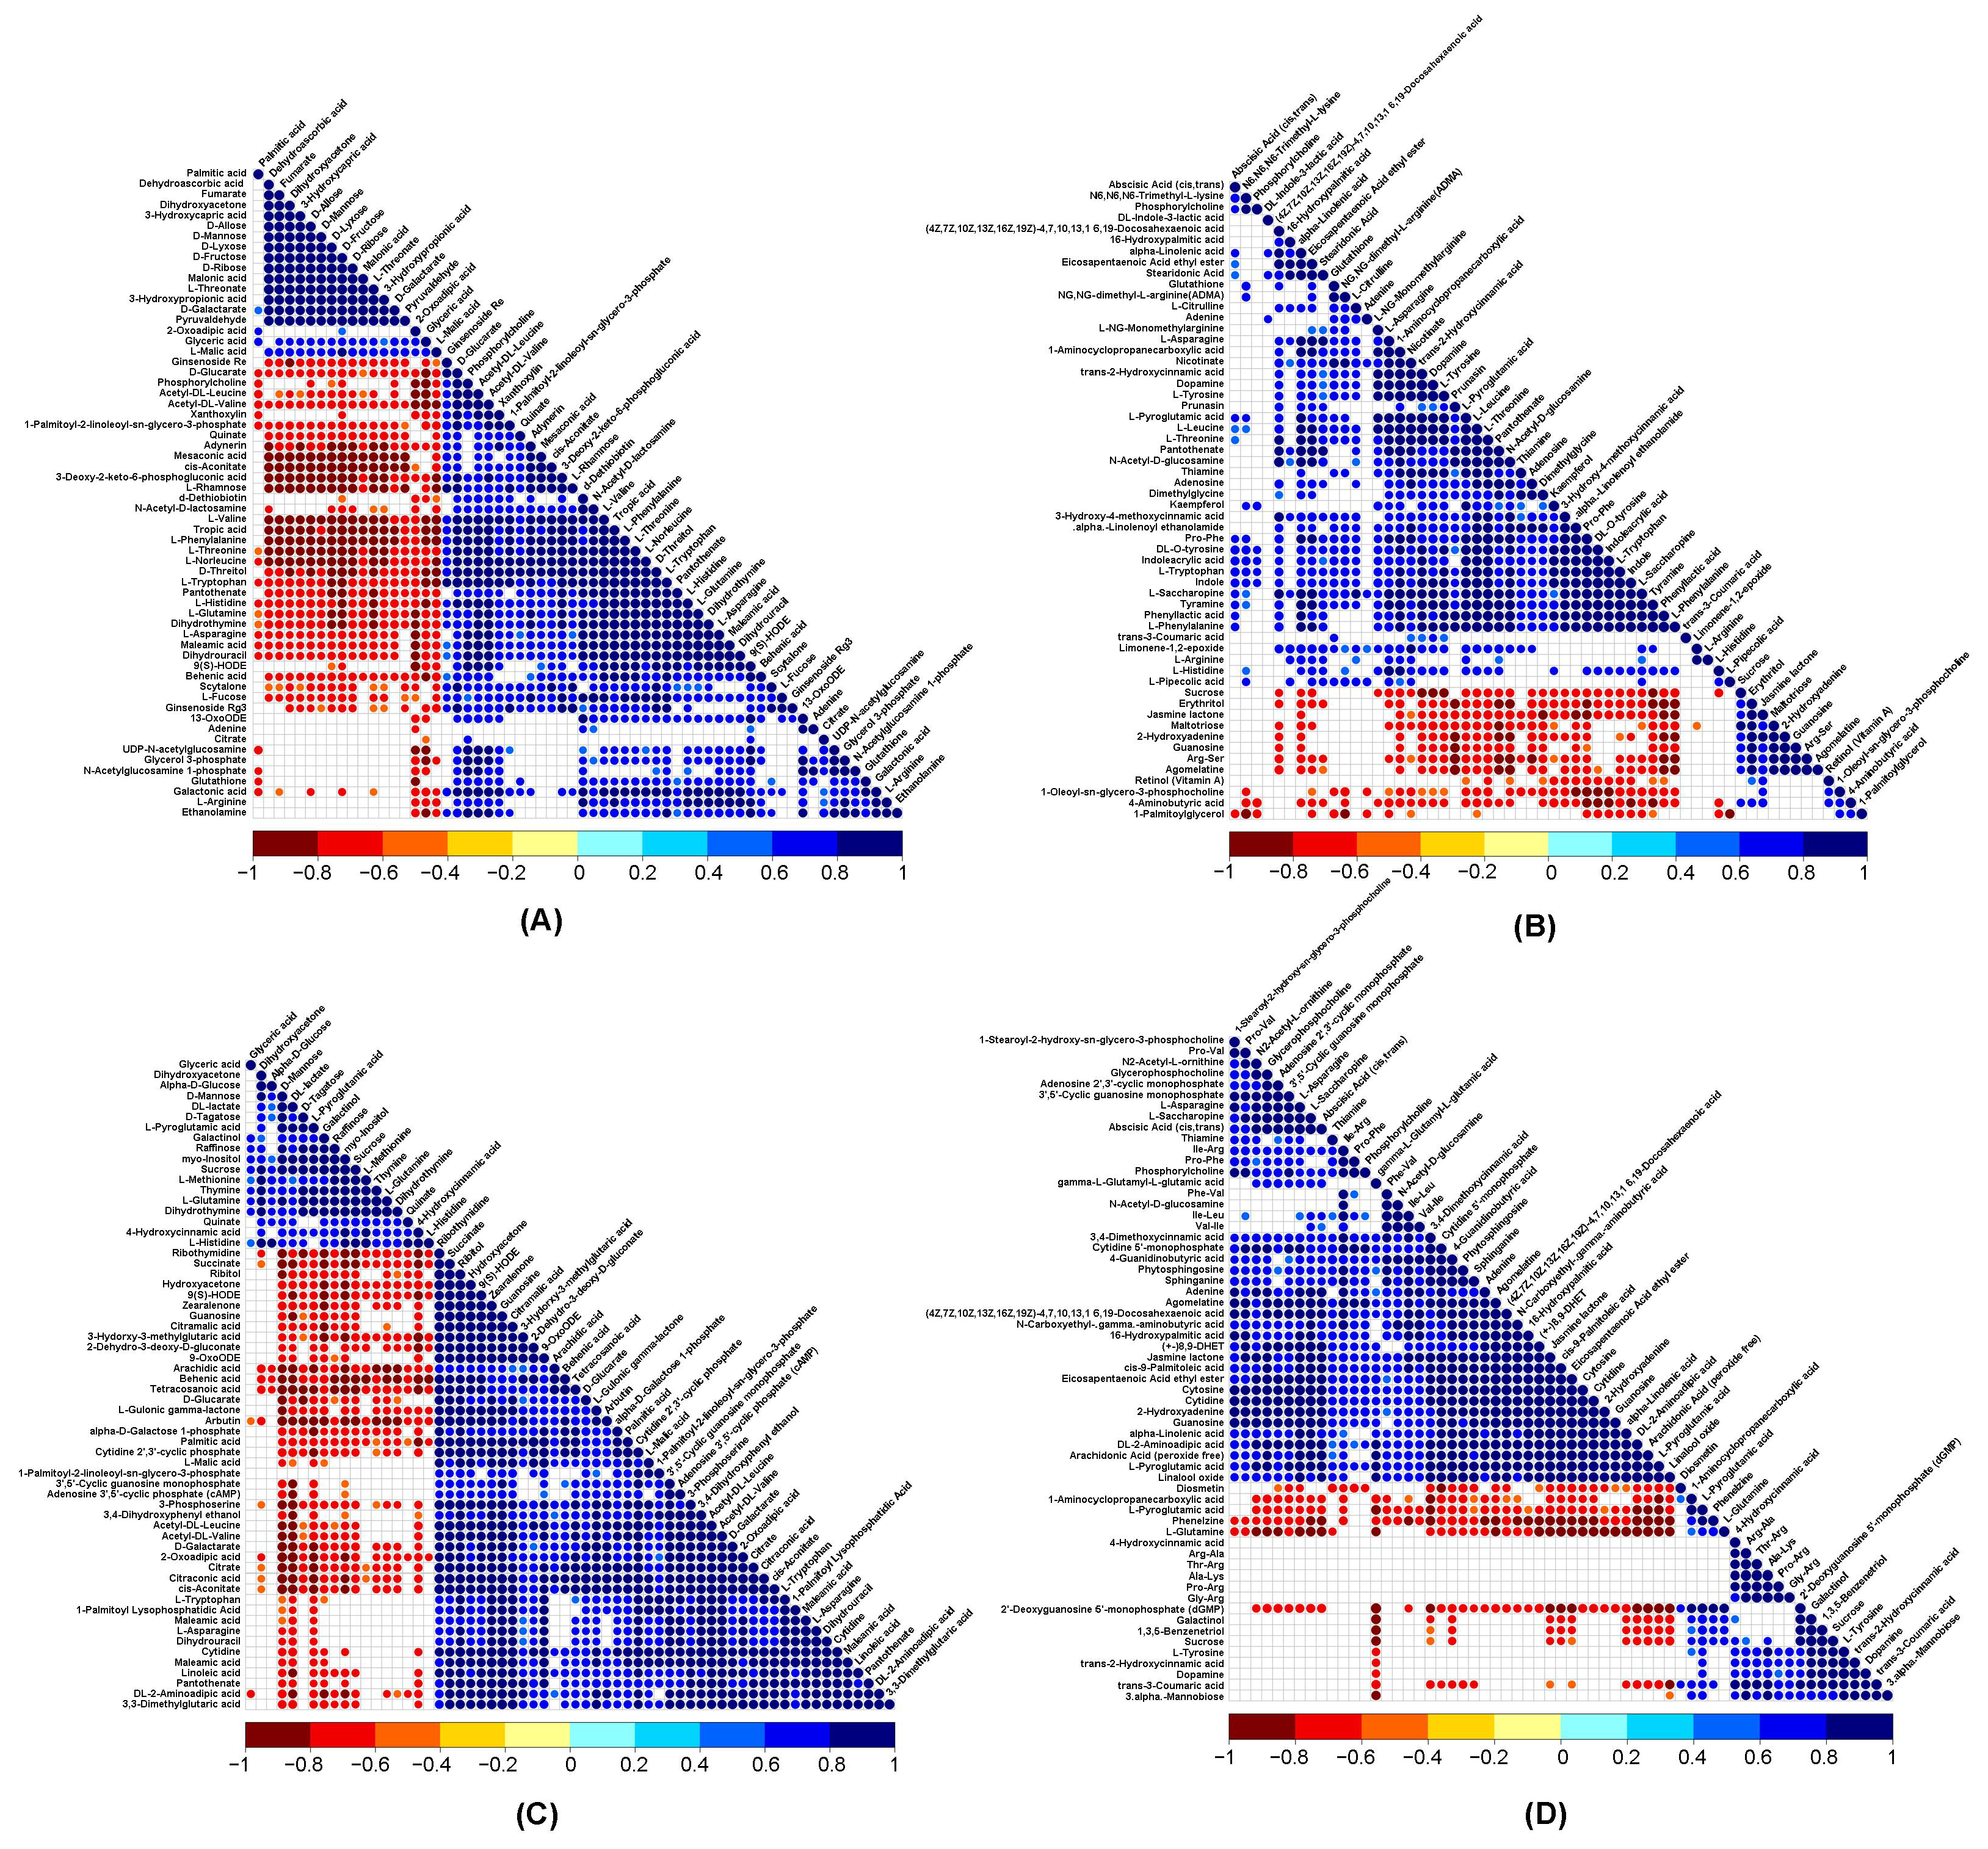
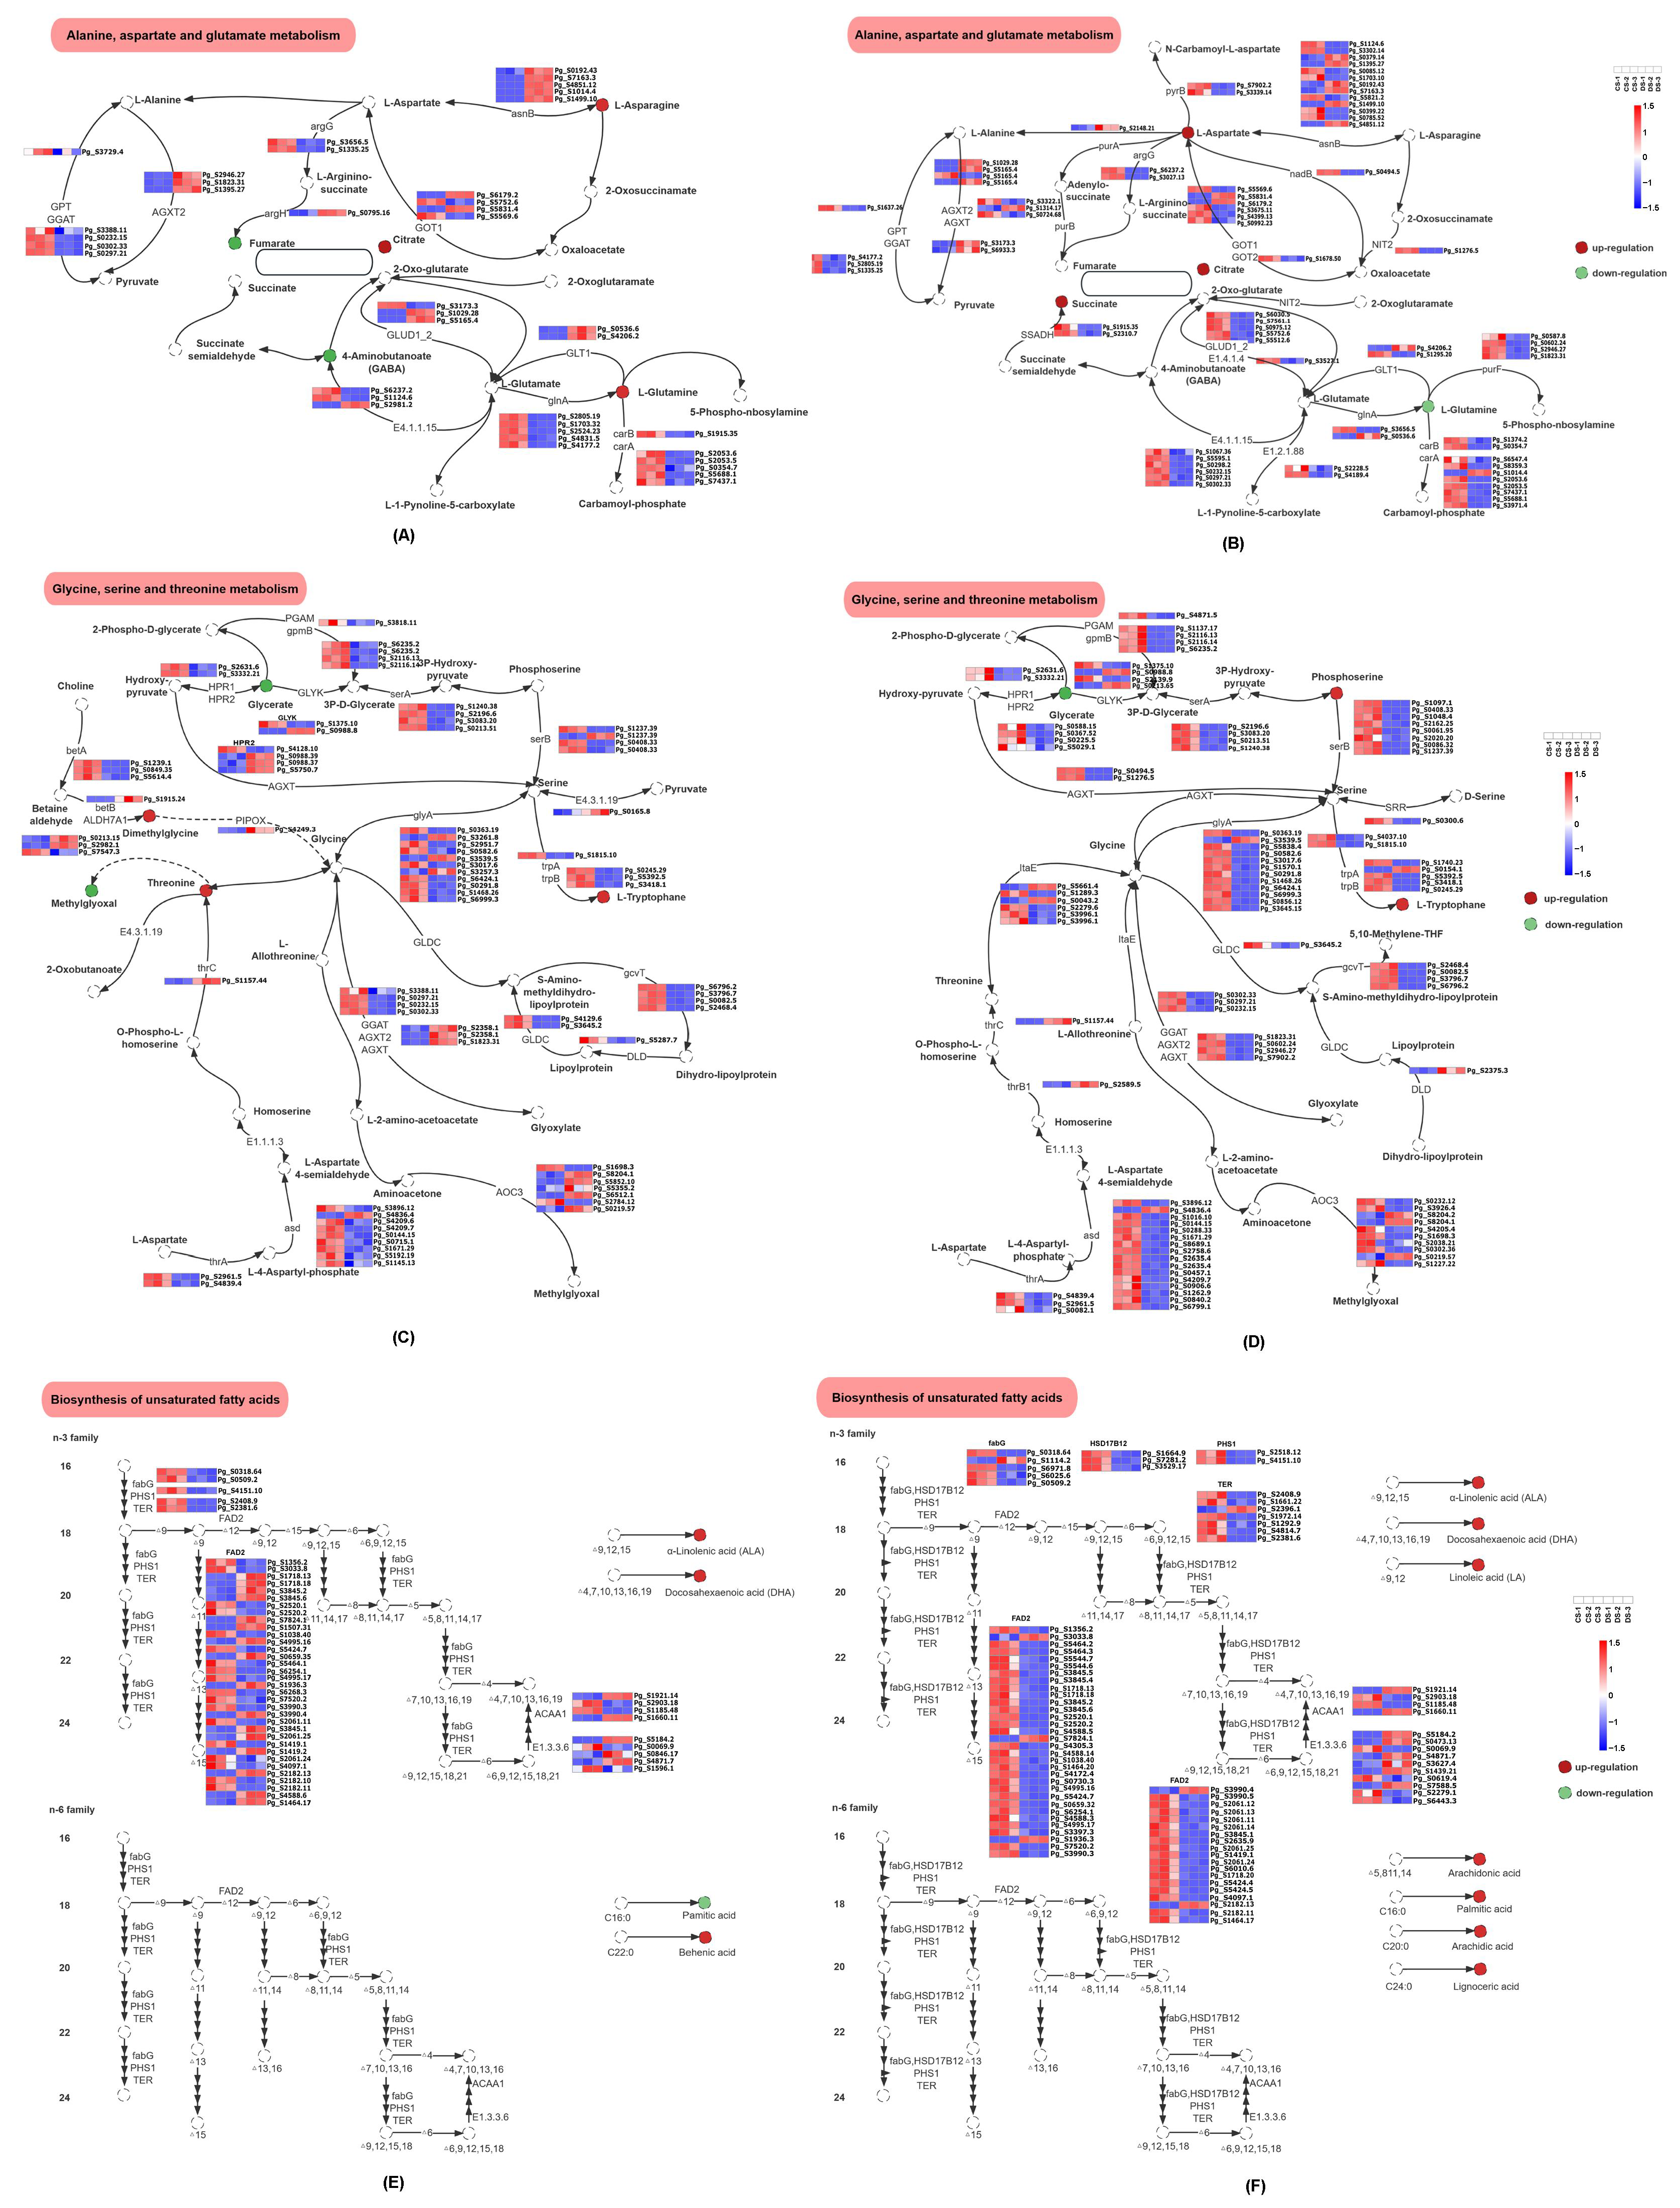
3.7. Correlation Analysis of DRMs and DEGs

By integrating the KEGG pathway generated by P. cactorum responsive genes and metabolites, the same KEGG pathway in ginseng leaves and stems is shown in Figure 10. The significant difference pathways including “Alanine, aspartate and glutamate metabolism”, “Glycine, serine and threonine metabolism”, “Biosynthesis of unsaturated fatty acids”, and “Plant hormone signal transduction” were enriched not only in metabolomes and metabolites but also in both leaves and stems of ginseng plants.
According to data obtained by correlation analysis of DRMs and DEGs in “Alanine, aspartate and glutamate metabolism”, “Glycine, serine and threonine metabolism”, and “Biosynthesis of unsaturated fatty acids” pathways, the general metabolic pathways were displayed in Figure 11 intuitively. The network map of DRMs and DEGs is included in the Supplementary File (Figure S1). As more than 500 differential genes (547 DEGs in leaves, 712 DEGs in stems) are included in the “Plant hormone signal transduction” pathway, hormone regulation pathways are not displayed in the co-expression analysis.
The changes in pathways in diseased ginseng were deduced, and it is manifested by changes in pathways related to the response of amino acids and unsaturated fatty acids and the disorder of phytohormones, which might lead to the defense of ginseng mainly through the process of pathogen-associated molecular pattern-triggered immunity (PTI) and systemic acquired resistance (SAR) (Figure 12).

3.8. Real-Time Quantitative Polymerase Chain Reaction (qRT-PCR) Validation Results
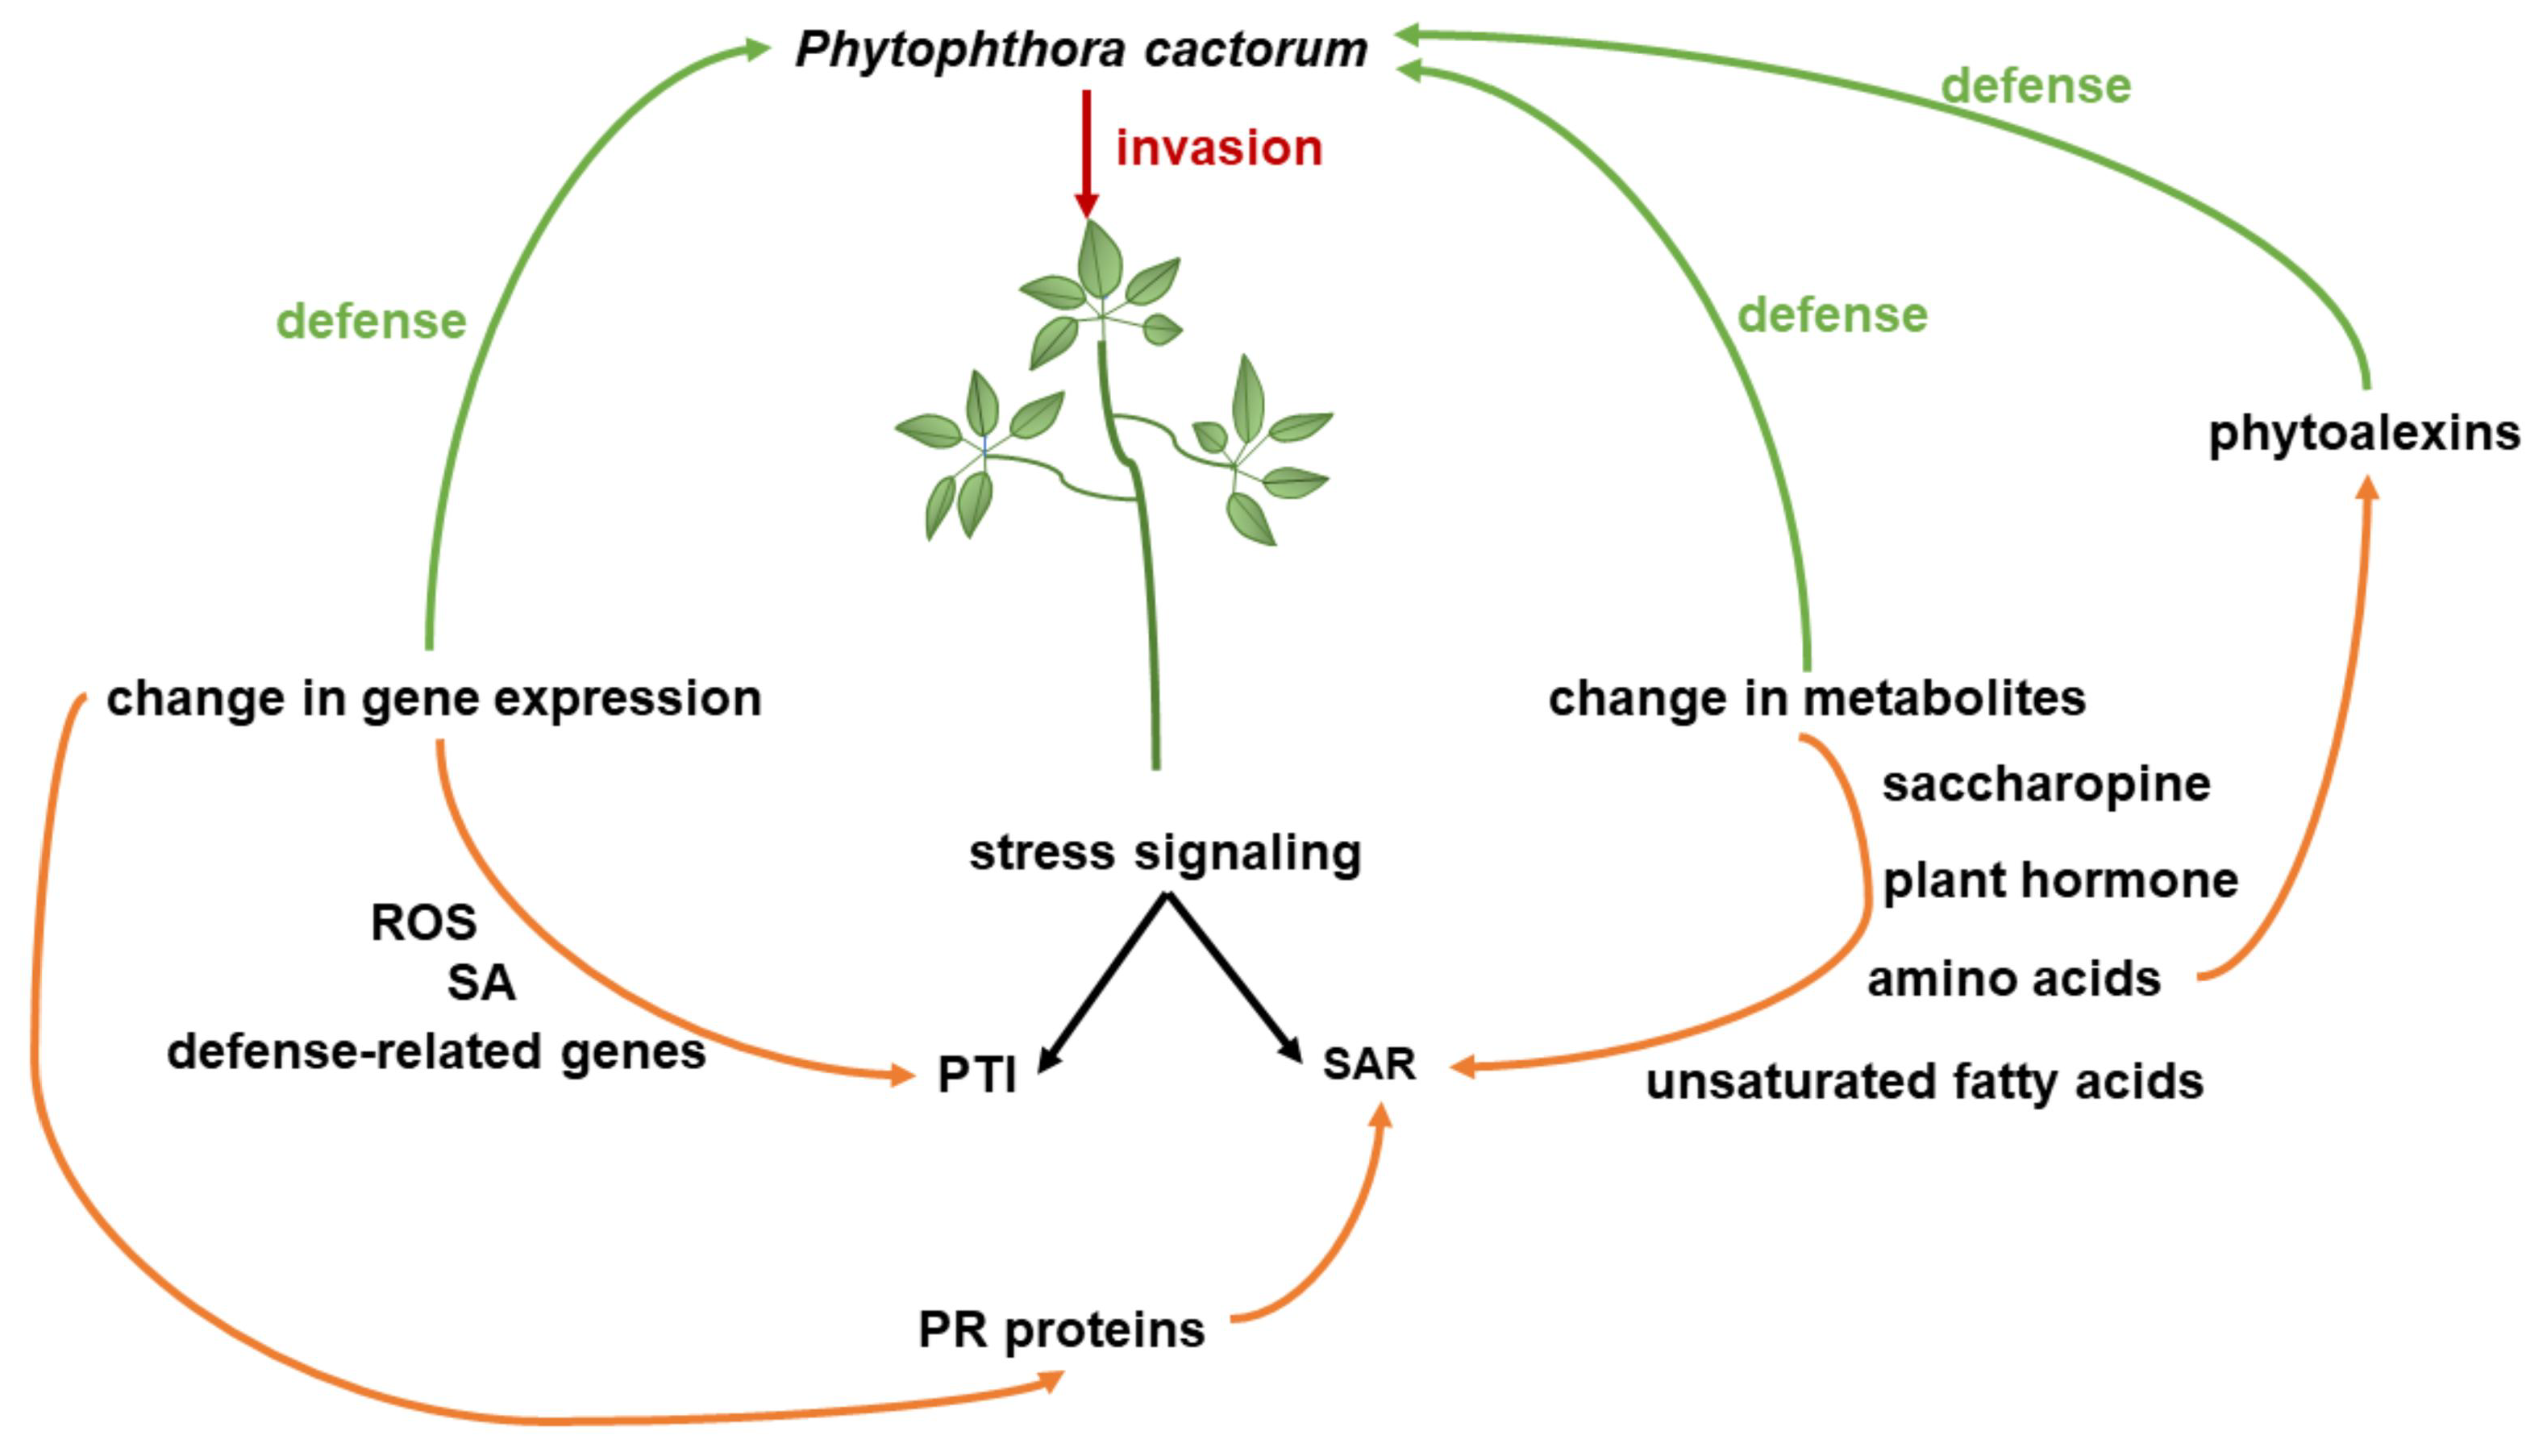
Transcript levels of eight genes qPCR were further validated by qRT-PCR to assess the accuracy of the RNA-seq results. The results displayed in Figure S2 demonstrate the reliability and accuracy of the transcriptome sequencing data. The gene expression was scaled using the Z-score of FPKM (mean value of three biological replications).

4. Discussion

P. cactorum is one kind of Phytophthora species that commonly causes destructive damage in many economic crop plants, such as the ginseng plant [45,46]. It is of great significance to clarify the molecular mechanism of the interactions between Phytophthora and plants for making a systematic management plan for the long-term cultivation of ginseng. Accordingly, we attempt to investigate the underlying changes of genes and metabolites involved in leaves and stems of ginseng responding to P. cactorum based on UPLC-MS/MS and RNA-seq analysis.
Plants usually cope with the threat of pathogens with external barriers as the preformed defense response and intra-cellular reaction as the induced defense [47]. Once the pathogen breakthrough the preformed defense response, a series of induced defenses were activated to assist the plant resistance after the identification of pathogen-associated molecular patterns (PAMPs) or the effector translocated by the pathogen to the host cell. Subsequently induced PTI and effector-triggered immunity (ETI) are considered the main immune systems to combat pathogens [48]. The studies presented thus far provide evidence that a series of physiological changes such as cell wall fortification, generation of reactive oxygen species, synthesis of phytoalexins, transcription of pathogenesis-related (PR) proteins, and programmed cell death caused by the hypersensitive response (HR) appeared in the defense response during the interaction between plants and pathogens [49,50,51,52].
In this study, the transcriptomic analysis showed that the invasion of P. cactorum activates defense-related genes such as FRK1, NHO1, PR1, and WRKY in diseased ginseng plants. Numerous reports have shown that PR1 plays a vital role in host defense, and the exogenous application of PR1 also confirms its anti-oomycete activity [53,54]. In addition, the expression of PR1 gene was recognized as a marker in salicylic acid-mediated disease resistance [55]. It is speculated that PR1 was assisted with the ginseng plant defense and involved in salicylic acid-mediated disease resistance. WRKY gene family widely participates in various biological processes, including growth and development, physiological metabolism, and stress response [56]. The current results revealed that WRKY1, WRKY2, WRKY22, WRKY25, WRKY33, WRKY22, and WRKY52 were differentially expressed in diseased ginseng plants. Overexpression of WRKY1 in tomato and tobacco plants can both enhance the resistance to Phytophthora infestans and Phytophthora nicotianae [57]. WRKY22 and WRKY29 were considered crucial components in the process of mitogen-activated protein kinase (MAPK) mediated plant defense against pathogens [58]. Recent investigations have shown that the WRKY29 not only suppresses bacterial pathogen Pseudomonas syringae and fungal pathogen B. cinerea but also mediates ET production by regulating the expression ACSs and ACO genes [58,59]. Therefore, in this research, it seems that the disturbance expression of the WRKY family is the manifestation of ginseng plant resistance to P. cactorum. Previous studies also showed that NPR1 protein and WRKY transcription factors are regarded as the master regulators of SAR [60]. The gene fluctuation of the peroxisome pathway in ginseng leaves and stems (PEX 19, PEX 14, HRS 4, NUDT 12 are all up-regulated, SOD, IDH, MVK are all down-regulated) was also a hint of reactive oxygen species (ROS) production. The determination result of plant hormone revealed that SA content both increased in diseased ginseng leaves and stems. The above evidence indicates that disease resistance of the ginseng plant is mainly activated through the SA-dependent pathway, which is consistent with the characteristics of PTI and SAR. However, the defense process is not isolated, and there are synergistic pathways involved as follows:

4.1. Alteration in Biosynthesis of Unsaturated Fatty Acids

Due to the destruction of cellular membranes of pathogen-affected plants, a large number of polyunsaturated fatty acids are released via lipase activities and act as signal molecules in the activation of plant defense response. Fatty acids such as stearic, oleic, linoleic acid, and α-linolenic acid have been found to participate in the defense against pathogens and opportunistic microorganisms [15,61].
In this research, we found that both transcriptome and metabonomics results indicate that the “Biosynthesis of unsaturated fatty acid” pathway exists in significant fluctuations upon pathogen attack. Genes involved in unsaturated fatty acid syntheses such as FAD2, fabG, and PHS1 exhibited abnormal expression in diseased ginseng plants. Several fatty acids such as palmitic acid, behenic acid, α-linolenic acid, and arachidonic acid accumulated in ginseng leave affected P. cactorum. We also noticed a similar increase of α-linolenic acid, docosahexaenoic acid, linoleic acid, arachidonic acid, palmitic acid, and arachidic acid in affected ginseng stems, and the significant change in α-linolenic acid, arachidonic acid, palmitic acid, and arachidic acid compared to the control group were recognized as signatory biomarkers in ginseng stems during P. cactorum infection. It was reported that systemic defense reactions were accompanied by increases in linoleic and linolenic acids in beans induced by a non-pathogenic/avirulent Pseudomonas putida [62]. Furthermore, α-linolenic acid is the precursor compound of JA which is a key phytohormone and signaling molecule to mediate plant stress response [63]. Thus, the response of the “Biosynthesis of the unsaturated fatty acid” pathway might further trigger downstream signaling to cope with external stress.

4.2. Alteration in Amino Acids Metabolism Pathway

When plants are colonized by pathogens, amino acid analysis and catabolism will be involved in the plant immunity process [64]. In this research, DEGs and SDMs in ginseng leaves and stems are both concentrated in the “Alanine, aspartate and glutamate metabolism” pathway and “Glycine, serine and threonine metabolism” pathways. The levels of peroxisomal glutamate: glyoxylate aminotransferase (GGAT) and alanine aminotransferase (GPT) in ginseng tissues were significantly influenced by P. cactorum. Genes including argininosuccinate synthase (argG) and asparagine synthetase B (asnB) regulate the aspartate to L-asparagine, leading to the augment of L-asparagine in diseased ginseng tissues. In addition, it is observed that the upregulation of GLT1 (EC1.4.1.14) brings out the accumulation of L-glutamine in the infection leaves. Disturbance occurs in tryptophan synthase, which increases the content of L-tryptophane in infected ginseng leaves and stems. Moreover, in ginseng leaves, threonine synthase (thrC) triggered the increase of threonine.
Metabolomics results also elucidate that most of the amino acid is elevated in ginseng tissues, which also elucidates the general response of the ginseng plant at the stage of infection. P. cactorum significantly affected glutamate metabolites, which fulfill important roles in connecting C and N metabolic fluxes. The current results showed that the ginseng leaves elevated glutamine coupled with the accumulation of citrulline and arginine. The growth of arginine also can be discovered in the DS group. Arginine stores N and is also the precursor of polyamines involved in almost all physiological and biochemical processes [65]. Likewise, the glutamate derivatives glutathione and pyroglutamic acid synthesis are also up-regulated by pathogen challenges. Under abiotic and biotic stresses, the loss of redox homeostasis balance in plants further increases the level of ROS, thus inducing oxidative stress, causing lipid peroxidation, enzyme inactivation and DNA damage [18]. This condition would stimulate antioxidant metabolites such as glutathione to be accumulated to higher levels, consistent with the improvement of the ability to scavenge ROS [66]. Citrulline was also proved to be an efficient hydroxyl radical-scavenger that could prevent oxidative injuries under drought conditions [67]. Consequently, the augment of amino acids such as glutamine, citrulline, and arginine seems to be a response to the pathogen. Nevertheless, the reduction of GABA might account for a metabolic counterbalancing of the glutamate catabolic pathways.
DEG analysis demonstrates that alpha-aminoadipic semialdehyde synthase (AASS) is upregulated to produce more saccharopine. Saccharopine and pipecolic acid were products of lysine through the saccharopine pathway. Pipecolic acid is the priming agent of N-hydroxypipecolate (NHP) that could further stimulate plant immunity through SAR upon pathogen attack [64,68]. Therefore, the rise of saccharopine and pipecolic acid by pathogen challenges in the diseased tissues might be closely related to the plant defense responses [69,70].
In the process of plant metabolism, a considerable amount of carbon flux is converted to aromatic amino acid biosynthesis and their downstream metabolic branches via the shikimate pathway [71,72]. In this study, infected leaves had an extremely higher content of L-valine than control plants (up to 61.4-fold). After the invasion of P. cactorum, aromatic amino acids, secondary metabolites, and hormones produced by the shikimic acid pathway in ginseng leaves were also substantially improved. In plants, the aromatic amino acids including phenylalanine, tyrosine, and tryptophan are not only participated in the synthesis of protein but also functioned as precursors of various hormones and secondary metabolites with various biological functions [64]. The content of phenylalanine in P. cactorum-affected ginseng leaves is 33.5 times that of the control group. An increased expression of aromatic amino acids is accompanied by elevated hormones and secondary metabolites in the infected ginseng leaves, which is the result of aromatic amino acids located upstream. For example, tropic acid was found to be overexpressed in the infected group (up to 33.4-fold). These findings could indicate that phenylalanine and tropic acid in high quantities in plants from pathogen attack could be taken as the response to the pathogen. Therefore, P. cactorum triggered the shikimate pathway to raise the yield of aromatic amino acids in ginseng leaves, thereby motivating the biosynthesis of secondary metabolites generated from aromatic amino acids. The results showed that L-valine, phenylalanine, and tropic acid in high content compared to the control group could be considered DRMs in ginseng leaves during P. cactorum infection.
In the shikimate pathway, quinate and kaempferol also had an increase in ginseng leaves after the invasion of P. cactorum. Kaempferol was considered to function as a phytoalexin and antioxidant, which relieves the stress from the pathogen [73,74]. The stem showed a different scene, with only tryptophan as a significant increase in aromatic amino acids. No elevation of quinate and kaempferol was found in stems, possibly because flavonoids are produced mainly in leaves.

4.3. Alteration in Plant Hormone

Accumulating evidence has suggested that plant hormones play an indispensable role in the plant immune signaling pathways and regulate the defense of plants when facing biotic or abiotic stress. [75] In this study, the transduction pathway of phytohormones has changed significantly in accordance with ginseng leaves and stems. UPLC-MS/MS was applied to capture the changes in trace plant hormones including TY, CA, tzR, SA, GA3, tZ, IAA, and ABA in ginseng (Figure 6). The change of phytohormone in ginseng leaves and stems exhibits a similar trend except for TY.
The environmental challenge has brought about a corresponding change in the levels of BRs, which is a steroidal hormone initiated by phytosterols in plants [39]. Castasterone (CA) is the most active regulator of BRs. It was suggested that the disturbance of CA after the attack of P. cactorum could be regarded as a sign of regulation of the brassinosteroids pathway.
SA induced by the pathogen can be perceived by the receptor nonexpressor of pathogenesis-related genes 1 (NPR1), which is recruited by TGA transcription factors to induce the expression of pathogenesis-related (PR) genes [76]. At the transcriptional level, differential expression of genes in NPR1, TGA, and PR confirmed the SA-related plant immunity and SAR that exists in the P. cactorum-affected ginseng plant. The increased content of SA shown in Figure 6 demonstrates that SA was up-regulated to cope with the stress.
ABA is also a nonnegligible plant hormone playing a dual role in the endurance of plants under biotic and abiotic stresses. The contribution of ABA can generally be divided into three phases: stomatal closure, rapid accumulation of ROS, and crosstalk with intra- and intercellular signals [77]. The last two stages impede the defense mechanism of plants by oxidative damage and disturbing other defensive pathways [40]. In this research, there is an increase in the level of ABA, and genes that regulate the ABA-responsive element binding factor ABF in ginseng leaves were upregulated, which is a response under the stress of P. cactorum.
Literature has reported that CKs play an indispensable role in the process of plant growth and defensive responses to biotic and abiotic stresses. After the infection of the virus, a reduction of tZR was observed in Arabidopsis thaliana seedlings, potato, and tobacco leaves [40]. In accordance with the above-mentioned literature, under P. cactorum stress, tZR levels in ginseng leaves can also be observed to decrease. Furthermore, extensive research has demonstrated that CKs and ABA were antagonized with each other and showed an opposite alteration in the process of anti-stress physiology in plants [78,79,80]. Consistent with this notion, in the determination of phytohormone, up-regulated ABA and down-regulated tZR were presented upon challenge by P. cactorum (Figure 6), whereas underlying molecular mechanisms are poorly understood and need further explorations.
It is noteworthy that an increase was observed in the gene ACS6, which is an important regulatory enzyme in the ET biosynthetic pathway. Correspondingly, 1-aminocyclopropanecarboxylic acid, the metabolic precursor of ET involved in the last step of ET synthesis, was enhanced in the metabolic pathway. It has been proved that ET combines with plant growth promoting rhinoacteria to participate in SAR in plants, thus limiting the invasion of pathogens to plants. [81,82]. It is speculated that the elevation of 1-aminocyclopropanecarboxylic acid might trigger the synthesis of ET under the influence of P. cactorum and mediated interaction defense signaling pathway. Moreover, the infection of P. cactorum also disrupts the biosynthesis of GA3 and IAA in ginseng plants, which may generate innate immunity to resist pathogens. F-box protein GID2, which belongs to the F-box protein family, influenced the expression of downstream genes responding to stress through involvement in phytohormone signaling pathways. In the auxin-response pathway of ginseng leaves and stems, the expression of Grethen Hagen3 (GH3) was significantly increased after being infected. GH3 was supposed to be closely related to auxin homeostasis and plays important roles in the crosstalk between auxin and other phytohormones [83].

5. Conclusions

On this basis, we conclude that ginseng plants have different physiology mechanisms facing P. cactorum involving regulations of primary metabolites, plant immunity through PTI, SAR, a synthesis of a wide range of secondary products as phytoalexins and regulation of hormone signaling pathways. The changes in leaves are mainly highlighted in the metabolism of amino acids, while the changes in stems mainly showed up in the metabolism of unsaturated fatty acids. Both have interfered with plant hormones when responding to stress. Elevated content of L-valine, phenylalanine, tropic acid, SA, and saccharopine in ginseng leaves and the accumulation of α-linolenic acid, arachidonic acid, palmitic acid, arachidic acid, SA, and saccharopine in ginseng stems are considered the DRMs closely associated with P. cactorum infection which can be exploited to be candidates of diagnostic biomarkers.
This research could be advantageous for providing a basic understanding of the complex variations in the genetic and metabolic network in ginseng leaves and stems triggered by P. cactorum. All these will be propitious to reveal the underlying determinants of ginseng plant immune responses to P. cactorum and develop an efficient diagnostic strategy for early identification and rapid interventions. Future research on the temporal dynamic interaction between the ginseng plant and P. cactorum might extend the explanations of the infection process. Apart from the host-pathogen interaction research, attempts should also be focused on molecular breeding and biocontrol agents for P. cactorum control.

Supplementary Materials

The following supporting information can be downloaded at: https://www.mdpi.com/article/10.3390/agriculture13020509/s1, Figure S1: The network map of DRMs and DEGs in pathways in ginseng leaves (A) and stems (B). Blue squares represent the DRMs and yellow square represents DEGs, respectively. The correlation between DRMs and DEGs was calculated by Pearson correlation coefficient and the positive correlation is shown by the red line, otherwise, it is indicated by the grey line; Figure S2. qRT-PCR validation for 8 differentially expressed genes induced by P. cactorum in ginseng leaves (A) and stems (B). “*” and “**” indicate significant differences with p < 0.05 and p < 0.01, respectively. Data shown are the means and standard deviations of 3 biological replicates (n = 3). Table S1: Optimized UPLC-MS/MS parameters for the quantification of phytohormones; Table S2: Primer sequences of the genes for qPCR verification; Table S3: Differential metabolites in ginseng leaves identified by metabolomics analysis based on the UPLC-QTOF/MS; Table S4: Differential metabolites in ginseng stems identified by metabolomics analysis based on the UPLC-QTOF/MS.

Author Contributions

Conceptualization, H.K. and S.H.; methodology, S.H.; validation, S.Q.; formal analysis, S.Q.; resources, S.H. and Y.W.; writing—original draft preparation, H.K.; writing—review and editing, C.X. and K.D.; visualization, S.W.; funding acquisition, Y.W. and H.K. All authors have read and agreed to the published version of the manuscript.

Funding

This research was funded by Jilin Science &Technology Development Plan (No. 20200504001YY, No. 20220401108YY) and Science and Technology Innovation Project of Chinese Academy of Agricultural Sciences (No. CAAS-ASTIP-2021-ISAPS).

Data Availability Statement

The data that support the findings of this study are available on request from the corresponding author (H.K.). (Email address: [email protected]).

Conflicts of Interest

The authors declare no conflict of interest.

References

  1. Zhai, F.G.; Liang, Q.C.; Wu, Y.Y.; Liu, J.Q.; Liu, J.W. Red Ginseng Polysaccharide Exhibits Anticancer Activity Through GPX4 Downregulation-induced Ferroptosis. Pharm. Biol. 2022, 60, 909–914. [Google Scholar] [CrossRef] [PubMed]
  2. Abd Eldaim, M.A.A.; Abd El Latif, A.S.; Hassan, A.; El-Borai, N.B. Ginseng attenuates Fipronil-induced Hepatorenal Toxicity Via Its Antioxidant, Anti-apoptotic, and Anti-inflammatory Activities in Rats. Environ. Sci. Pollut. Res. Int. 2020, 27, 45008–45017. [Google Scholar] [CrossRef] [PubMed]
  3. Wu, F.; Lai, S.; Fu, D.; Liu, J.; Wang, C.A.O.; Feng, H.; Liu, J.A.-O.X.; Li, Z.; Li, P. Neuroprotective Effects and Metabolomics Study of Protopanaxatriol (PPT) on Cerebral Ischemia/Reperfusion Injury In Vitro and In Vivo. Int. J. Mol. Sci. 2023, 24, 1789. [Google Scholar] [CrossRef] [PubMed]
  4. Wang, J.; Fan, M.; Yin, S.; Xu, X.; Fu, B.; Jiang, R.; Sun, L. Ginseng Oligosaccharides (GSO) Inhibit C48/80-stimulated Pseudoallergic Mechanisms Through the PLC/Ca2+/PKC/MAPK/c-Fos Signaling Pathway. J. Funct. Foods 2022, 96, 105211. [Google Scholar] [CrossRef]
  5. Liu, Z.; Bian, X.; Gao, W.; Su, J.; Ma, C.; Xiao, X.; Yu, T.; Zhang, H.; Liu, X.; Fan, G. Rg3 Promotes the SUMOylation of SERCA2a and Corrects Cardiac Dysfunction in Heart Failure. Pharmacol. Res. 2021, 172, 105843. [Google Scholar] [CrossRef]
  6. Han, Y.; Su, Y.; Han, M.; Liu, Y.; Shi, Q.; Li, X.; Wang, P.; Li, W.; Li, W. Ginsenoside Rg1 Attenuates Glomerular Fibrosis by Inhibiting CD36/TRPC6/NFAT2 Signaling in Type 2 Diabetes Mellitus Mice. J. Ethnopharmacol. 2023, 302, 115923. [Google Scholar] [CrossRef]
  7. Ryu, H.; Park, H.; Suh, D.S.; Jung, G.H.; Park, K.; Lee, B.D. Biological Control of Colletotrichum Panacicola on Panax Ginseng by Bacillus Subtilis HK-CSM-1. J. Ginseng Res. 2014, 38, 215–219. [Google Scholar] [CrossRef] [Green Version]
  8. Mhlongo, M.I.; Piater, L.A.O.; Steenkamp, P.A.O.; Labuschagne, N.; Dubery, I.A.O. Concurrent Metabolic Profiling and Quantification of Aromatic Amino Acids and Phytohormones in Solanum Lycopersicum Plants Responding to Phytophthora Capsici. Metabolites 2020, 10, 466. [Google Scholar] [CrossRef]
  9. Wang, C. Studies on Safety Application of Fungicides for Main Diseases of Ginseng in Jilin Province. Master’s Thesis, Jilin Agricultural University, Changchun, China, 2011. [Google Scholar]
  10. Wang, Y.Y. Studies on the Key Techniques for Safe and Efficient Pesticides Control to Main Diseases on Ginseng. Master’s Thesis, Jilin Agricultural University, Changchun, China, 2013. [Google Scholar]
  11. Arora, R.K.; Sharma, S.; Singh, B.P. Late Blight Disease of Potato and Its Management. Potato J. 2014, 41, 16–40. [Google Scholar]
  12. Lee, B.D.; Park, H. Control of Phytophthora Blight of Panax Ginseng Caused by Phytophthora Cactorum Using Phosphonate Under the Controlled Condition. J. Ginseng Res. 2009, 33, 311–315. [Google Scholar] [CrossRef] [Green Version]
  13. Lee, B.D.; Dutta, S.; Ryu, H.; Yoo, S.J.; Suh, D.S.; Park, K. Induction of Systemic Resistance in Panax Ginseng Against Phytophthora Cactorum by Native Bacillus Amyloliquefaciens HK34. J. Ginseng Res. 2015, 39, 213–220. [Google Scholar] [CrossRef] [Green Version]
  14. Kim, Y.-J.; Joo, S.C.; Shi, J.; Hu, C.; Quan, S.; Hu, J.; Sukweenadhi, J.; Mohanan, P.; Yang, D.-C.; Zhang, D. Metabolic Dynamics and Physiological Adaptation of Panax Ginseng During Development. Plant Cell Rep. 2018, 37, 393–410. [Google Scholar] [CrossRef] [PubMed]
  15. Lee, H.J.; Jeong, J.; Alves, A.C.; Han, S.T.; In, G.; Kim, E.H.; Jeong, W.S.; Hong, Y.S. Metabolomic Understanding of Intrinsic Physiology in Panax Ginseng During Whole Growing Seasons. J. Ginseng Res. 2019, 43, 654–665. [Google Scholar] [CrossRef] [PubMed]
  16. Yoon, D.; Shin, W.C.; Oh, S.M.; Choi, B.R.; Young Lee, D. Integration of Multiplatform Metabolomics and Multivariate Analysis for Geographical Origin Discrimination of Panax Ginseng. Food Res. Int. 2022, 159, 111610. [Google Scholar] [CrossRef] [PubMed]
  17. Attard, A.; Evangelisti, E.; Kebdani-Minet, N.; Panabières, F.; Deleury, E.; Maggio, C.; Ponchet, M.; Gourgues, M. Transcriptome Dynamics of Arabidopsis Thaliana Root Penetration by the Oomycete Pathogen Phytophthora Parasitica. BMC Genom. 2014, 15, 538. [Google Scholar] [CrossRef] [PubMed] [Green Version]
  18. Khare, S.; Singh, N.B.; Singh, A.; Hussain, I.; Niharika, K.; Yadav, V.; Bano, C.; Yadav, R.K.; Amist, N. Plant Secondary Metabolites Synthesis and Their Regulations Under Biotic and Abiotic Constraints. J. Plant Biol. 2020, 63, 203–216. [Google Scholar] [CrossRef]
  19. Saddhe, A.A.O.; Manuka, R.; Penna, S.A.O. Plant sugars: Homeostasis and Transport Under Abiotic Stress in Plants. Physiol. Plant 2021, 171, 739–755. [Google Scholar] [CrossRef]
  20. Liu, S.; Wang, X.; Zhang, R.; Song, M.; Zhang, N.; Li, W.; Wang, Y.; Xu, Y.; Zhang, L. Amino Acid, Fatty Acid, and Carbohydrate Metabolomic Profiles With Ginsenoside-induced Insecticidal Efficacy Against Ostrinia Furnacalis (Guenee). J. Ginseng Res. 2020, 44, 544–551. [Google Scholar] [CrossRef]
  21. Castro-Moretti, F.R.; Gentzel, I.N.; Mackey, D.; Alonso, A.P. Metabolomics as an Emerging Tool for the Study of Plant-Pathogen Interactions. Metabolites 2020, 10, 52. [Google Scholar] [CrossRef] [Green Version]
  22. Zhao, M.; Guo, R.; Li, M.; Liu, Y.; Wang, X.; Fu, H.; Wang, S.; Liu, X.; Shi, L. Physiological Characteristics and Metabolomics Reveal the Tolerance Mechanism to Low Nitrogen in Glycine Soja Leaves. Physiol. Plant 2020, 168, 819–834. [Google Scholar] [CrossRef]
  23. Peng, Z.; Wang, Y.; Zuo, W.T.; Gao, Y.R.; Li, R.Z.; Yu, C.X.; Liu, Z.Y.; Zheng, Y.; Shen, Y.Y.; Duan, L.S. Integration of Metabolome and Transcriptome Studies Reveals Flavonoids, Abscisic Acid, and Nitric Oxide Comodulating the Freezing Tolerance in Liriope Spicata. Front. Plant Sci. 2022, 27, 764625. [Google Scholar] [CrossRef] [PubMed]
  24. Kusano, M.A.O.; Fukushima, A.A.O.; Tabuchi-Kobayashi, M.; Funayama, K.; Kojima, S.A.O.; Maruyama, K.; Yamamoto, Y.A.O.; Nishizawa, T.; Kobayashi, M.; Wakazaki, M.; et al. Cytosolic GLUTAMINE SYNTHETASE1;1 Modulates Metabolism and Chloroplast Development in Roots. Plant Physiol. 2020, 182, 1894–1909. [Google Scholar] [CrossRef] [PubMed] [Green Version]
  25. Cho, K.; Cho, K.S.; Sohn, H.B.; Ha, I.J.; Hong, S.Y.; Lee, H.; Kim, Y.M.; Nam, M.H. Network Analysis of the Metabolome and Transcriptome Reveals Novel Regulation of Potato Pigmentation. J. Exp. Bot. 2016, 67, 1519–1533. [Google Scholar] [CrossRef] [PubMed] [Green Version]
  26. Guo, X.A.O.; Luo, T.A.O.; Han, D.; Wu, Z.A.O. Analysis of Metabolomics Associated With Quality Differences Between Room-temperature- and low-temperature-stored Litchi Pulps. Food Sci. Nutr. 2019, 7, 3560–3569. [Google Scholar] [CrossRef] [PubMed]
  27. Mi, S.; Yu, W.; Li, J.; Liu, M.; Sang, Y.; Wang, X. Characterization and Discrimination of Chilli Peppers Based on Multi-element and Non-targeted Metabolomics Analysis. LWT 2020, 131, 109742. [Google Scholar] [CrossRef]
  28. Shao, Y.; Zhou, H.-Z.; Wu, Y.; Zhang, H.; Lin, J.; Jiang, X.; He, Q.; Zhu, J.; Li, Y.; Yu, H.; et al. OsSPL3, an SBP-Domain Protein, Regulates Crown Root Development in Rice. Plant Cell 2019, 31, 1257–1275. [Google Scholar] [CrossRef] [Green Version]
  29. Li, Q.A.O.; Zhan, Y.; Xu, Y.; Zhang, L.; Di, P.; Lu, B.A.O.; Chen, C. Deciphering the Transcriptomic Response of Ilyonectria Robusta in Relation to Ginsenoside Rg1 Treatment and the Development of Ginseng Rusty Root Rot. FEMS Microbiol. Lett. 2022, 369, fnac075. [Google Scholar] [CrossRef]
  30. Bian, X.; Zhao, Y.; Xiao, S.; Yang, H.; Han, Y.; Zhang, L. Metabolome and Transcriptome Analysis Reveals the Molecular Profiles Underlying the Ginseng Response to Rusty Root Symptoms. BMC Plant Biol. 2021, 21, 215. [Google Scholar] [CrossRef]
  31. Che, X.; Zhao, R.; Xu, H.; Liu, X.; Zhao, S.; Ma, H. Differently Expressed Genes (DEGs) Relevant to Type 2 Diabetes Mellitus Identification and Pathway Analysis Via Integrated Bioinformatics Analysis. Med. Sci. Monit. 2019, 25, 9237–9244. [Google Scholar] [CrossRef] [PubMed]
  32. Farh, M.E.; Kim, Y.J.; Abbai, R.; Singh, P.; Jung, K.H.; Kim, Y.J.; Yang, D.C. Pathogenesis Strategies and Regulation of Ginsenosides by Two Species of Ilyonectria in Panax Ginseng: Power of Speciation. J. Ginseng Res. 2020, 44, 332–340. [Google Scholar] [CrossRef]
  33. Wan, L.; Li, B.; Lei, Y.; Yan, L.; Ren, X.; Chen, Y.; Dai, X.; Jiang, H.; Zhang, J.; Guo, W.; et al. Mutant Transcriptome Sequencing Provides Insights Into Pod Development in Peanut (Arachis hypogaea L.). Front. Plant Sci. 2017, 8, 1900. [Google Scholar] [CrossRef] [Green Version]
  34. Chen, K.; Liu, J.; Ji, R.; Chen, T.; Zhou, X.; Yang, J.; Tong, Y.; Jiang, C.; Zhou, J.; Zhao, Y.; et al. Biogenic Synthesis and Spatial Distribution of Endogenous Phytohormones and Ginsenosides Provide Insights on Their Intrinsic Relevance in Panax Ginseng. Front. Plant Sci. 2019, 9, 2018. [Google Scholar] [CrossRef] [PubMed] [Green Version]
  35. Worley, B.; Powers, R. Multivariate Analysis in Metabolomics. Curr. Metab. 2013, 1, 92–107. [Google Scholar] [CrossRef]
  36. Zhao, G.; Zhao, W.; Han, L.; Ding, J.; Chang, Y. Metabolomics Analysis of Sea Cucumber (Apostichopus Japonicus) in Different Geographical Origins Using UPLC-Q-TOF/MS. Food Chem. 2020, 333, 127453. [Google Scholar] [CrossRef] [PubMed]
  37. Luo, J.; Hu, K.; Qu, F.; Ni, D.; Zhang, H.; Liu, S.; Chen, Y. Metabolomics Analysis Reveals Major Differential Metabolites and Metabolic Alterations in Tea Plant Leaves (Camellia sinensis L.) Under Different Fluorine Conditions. J. Plant Growth Regul. 2021, 40, 798–810. [Google Scholar] [CrossRef]
  38. Kanehisa, M.; Goto, S. KEGG: Kyoto Encyclopaedia of Genes and Genomes. Nucleic Acids Res. 2000, 28, 27–30. [Google Scholar] [CrossRef]
  39. Mishra, J.; Srivastava, R.A.O.; Trivedi, P.A.-O.; Verma, P.A.O. Effect of Virus Infection on the Secondary Metabolite Production and Phytohormone Biosynthesis in Plants. 3 Biotech 2020, 10, 547. [Google Scholar] [CrossRef]
  40. Alazem, M.; Lin, N.S. Antiviral Roles of Abscisic Acid in Plants. Front. Plant Sci. 2017, 8, 1760–1769. [Google Scholar] [CrossRef] [Green Version]
  41. Deng, X.G.; Zhu, T.; Peng, X.J.; Xi, D.H.; Guo, H.; Yin, Y.; Zhang, D.W.; Lin, H.-H. Role of Brassinosteroid Signaling in Modulating Tobacco mosaic virus Resistance in Nicotiana benthamiana. Sci. Rep. 2016, 6, 20579. [Google Scholar] [CrossRef] [Green Version]
  42. Dehkordi, A.N.; Rubio, M.; Babaeian, N.; Albacete, A.; Martínez-Gómez, P. Phytohormone Signaling of the Resistance to Plum Pox Virus (PPV, Sharka Disease) Induced by Almond (Prunus dulcis (Miller) Webb) Grafting to Peach (P. persica L. Batsch). Viruses 2018, 10, 238. [Google Scholar] [CrossRef] [Green Version]
  43. De Haro, L.A.; Arellano, S.M.; Novák, O.; Feil, R.; Dumón, A.D.; Mattio, M.F.; Tarkowská, D.; Llauger, G.; Strnad, M.; Lunn, J.E.; et al. Mal de Río Cuarto Virus Infection Causes Hormone Imbalance and Sugar Accumulation in Wheat Leaves. BMC Plant Biol. 2019, 19, 112. [Google Scholar] [CrossRef] [PubMed] [Green Version]
  44. Thomas, P.D. The Gene Ontology and the Meaning of Biological Function. In The Gene Ontology Handbook; Springer: Berlin/Heidelberg, Germany, 2017; Volume 1446. [Google Scholar] [CrossRef] [Green Version]
  45. Volynchikova, E.A.O.X.; Kim, K.A.O. Biological Control of Oomycete Soilborne Diseases Caused by Phytophthora capsici, Phytophthora infestans, and Phytophthora nicotianae in Solanaceous Crops. Mycobiology 2022, 50, 269–293. [Google Scholar] [CrossRef] [PubMed]
  46. Farh, M.E.-A.; Kim, Y.-J.; Kim, Y.-J.; Yang, D.-C. Mini Review: Cylindrocarpon Destructans/Ilyonectria Radicicola-Species Complex: Causa-tive Agent of Ginseng Root-rot Disease and Rusty Symptoms. J. Ginseng Res. 2018, 42, 9–15. [Google Scholar] [CrossRef] [PubMed]
  47. Rojas, C.; Senthil-Kumar, M.; Tzin, V.; Mysore, K. Regulation of Primary Plant Metabolism During Plant-pathogen Interactions and its Contribution to Plant Defense. Front. Plant Sci. 2014, 5, 17. [Google Scholar] [CrossRef] [PubMed] [Green Version]
  48. Yang, W.; Li, S.P.; Cui, H.T.; Zou, S.H.; Wang, W. Molecular Genetic Mechanisms of Interaction Between Host Plants and Pathogens. Yi Chuan 2020, 42, 278–286. [Google Scholar] [CrossRef] [PubMed]
  49. Ninkuu, V.; Yan, J.; Zhang, L.; Fu, Z.; Yang, T.; Li, S.; Li, B.; Duan, J.; Ren, J.; Li, G.; et al. Hrip1 Mediates Rice Cell Wall Fortification and Phytoalexins Elicitation to Confer Immunity Against Magnaporthe oryzae. Front. Plant Sci. 2022, 13, 3180. [Google Scholar] [CrossRef]
  50. Li, B.; Meng, X.; Shan, L.; He, P. Transcriptional Regulation of Pattern-Triggered Immunity in Plants. Cell Host Microbe 2016, 19, 641–650. [Google Scholar] [CrossRef] [Green Version]
  51. Lin, J.; Monsalvo, I.; Ly, M.; Jahan, M.A.; Wi, D.; Martirosyan, I.; Kovinich, N.A.O. RNA-Seq Dissects Incomplete Activation of Phytoalexin Biosynthesis by the Soybean Transcription Factors GmMYB29A2 and GmNAC42-1. Plants 2023, 12, 545. [Google Scholar] [CrossRef]
  52. Pagán, I.A.O.; García-Arenal, F.A.O. Cucumber Mosaic Virus-Induced Systemic Necrosis in Arabidopsis Thaliana: Determinants and Role in Plant Defense. Viruses 2022, 14, 2790. [Google Scholar] [CrossRef]
  53. Li, J. Expression and Purification of Tobacco PR-1a Protein for Punction Analysis. Asian J. Chem. 2009, 21, 3697–3707. [Google Scholar]
  54. Shin, S.H.; Pak, J.H.; Kim, M.J.; Kim, H.J.; Oh, J.S.; Choi, H.K.; Jung, H.W.; Chung, Y.S. An Acidic PATHOGENESIS-RELATED1 Gene of Oryza grandiglumis is Involved in Disease Resistance Response Against Bacterial Infection. Plant Pathol. J. 2014, 30, 208–214. [Google Scholar] [CrossRef] [PubMed] [Green Version]
  55. Breen, S.; Williams, S.J.; Outram, M.; Kobe, B.; Solomon, P.S. Emerging Insights Into the Functions of Pathogenesis-Related Protein 1. Trends Plant Sci. 2017, 22, 871–879. [Google Scholar] [CrossRef] [PubMed]
  56. Jiang, J.; Ma, S.; Ye, N.; Jiang, M.; Cao, J.; Zhang, J. WRKY Transcription Factors in Plant Responses to Stresses. J. Integr. Plant Biol. 2017, 59, 86–101. [Google Scholar] [CrossRef] [PubMed] [Green Version]
  57. Li, J.B.; Luan, Y.S.; Liu, Z. Overexpression of SpWRKY1 Promotes Resistance to Phytophthora Nicotianae and Tolerance to Salt and Drought Stress in Transgenic Tobacco. Physiol. Plant 2015, 155, 248–266. [Google Scholar] [CrossRef]
  58. Asai, T.; Tena, G.; Plotnikova, J.; Willmann, M.R.; Chiu, W.L.; Gomez-Gomez, L.; Boller, T.; Ausubel, F.M.; Sheen, J. MAP Kinase Signalling Cascade in Arabidopsis Innate Immunity. Nature 2002, 415, 977–983. [Google Scholar] [CrossRef]
  59. Wang, Z.; Wei, X.; Wang, Y.; Sun, M.; Zhao, P.; Wang, Q.; Yang, B.; Li, J.; Jiang, Y.Q. WRKY29 Transcription Factor Regulates Ethylene Biosynthesis and Response in Arabidopsis. Plant Physiol. Biochem. 2023, 194, 134–145. [Google Scholar] [CrossRef]
  60. Gao, J.; Bi, W.; Li, H.; Wu, J.; Yu, X.; Liu, D.; Wang, X. WRKY Transcription Factors Associated With NPR1-Mediated Acquired Resistance in Barley Are Potential Resources to Improve Wheat Resistance to Puccinia triticina. Front. Plant. Sci. 2018, 9, 1486. [Google Scholar] [CrossRef]
  61. De Carvalho, C.; Caramujo, M.J. The Various Roles of Fatty Acids. Molecules 2018, 23, 2583. [Google Scholar] [CrossRef] [Green Version]
  62. Mu, Q.; Zhang, M.; Li, Y.; Feng, F.; Yu, X.; Nie, J.A.O.X. Metabolomic Analysis Reveals the Effect of Insecticide Chlorpyrifos on Rice Plant Metabolism. Metabolites 2022, 12, 1289. [Google Scholar] [CrossRef]
  63. Per, T.S.; Khan, M.I.R.; Anjum, N.A.; Masood, A.; Hussain, S.J.; Khan, N.A. Jasmonates in Plants Under Abiotic Stresses: Crosstalk With Other Phytohormones Matters. Environ. Exp. Bot. 2018, 145, 104–120. [Google Scholar] [CrossRef]
  64. Zeier, J. New Insights Into the Regulation of Plant Immunity by Amino Acid Metabolic Pathways. Plant Cell Environ. 2013, 36, 2085–2103. [Google Scholar] [CrossRef] [PubMed]
  65. Nehela, Y.; Killiny, N.A.O. The Unknown Soldier in Citrus Plants: Polyamines-based Defensive Mechanisms Against Biotic and Abiotic Stresses and Their Relationship With Other Stress-associated Metabolites. Plant. Signal. Behav. 2020, 15, 1761080. [Google Scholar] [CrossRef] [PubMed]
  66. Rahman, A.; Alam, M.U.; Hossain, M.S.; Mahmud, J.A.; Nahar, K.; Fujita, M.; Hasanuzzaman, M. Exogenous Gallic Acid Confers Salt Tolerance in Rice Seedlings: Modulation of Ion Homeostasis, Osmoregulation, Antioxidant Defense, and Methylglyoxal Detoxification Systems. Agronomy 2023, 13, 16. [Google Scholar] [CrossRef]
  67. Jinal, H.N.; Sakthivel, K.; Amaresan, N. Characterisation of Antagonistic Bacillus Paralicheniformis (strain EAL) by LC-MS, Antimicrobial Peptide Genes, and ISR Determinants. Antonie Van Leeuwenhoek 2020, 113, 1167–1177. [Google Scholar] [CrossRef]
  68. Eccleston, L.; Brambilla, A.; Vlot, A.A.O. New Molecules in Plant Defence Against Pathogens. Essays Biochem. 2022, 66, 683–693. [Google Scholar] [CrossRef]
  69. Arruda, P.; Barreto, P. Lysine Catabolism Through the Saccharopine Pathway: Enzymes and Intermediates Involved in Plant Responses to Abiotic and Biotic Stress. Front. Plant Sci. 2020, 11, 587. [Google Scholar] [CrossRef]
  70. Hartmann, M.; Zeier, T.; Bernsdorff, F.; Reichel-Deland, V.; Kim, D.; Hohmann, M.; Scholten, N.; Schuck, S.; Bräutigam, A.; Hölzel, T.; et al. Flavin Monooxygenase- Generated N-Hydroxypipecolic Acid Is a Critical Element of Plant Systemic Immunity. Cell 2018, 173, 456–469. [Google Scholar] [CrossRef] [Green Version]
  71. Oliva, M.; Guy, A.; Galili, G.; Dor, E.; Schweitzer, R.; Amir, R.; Hacham, Y. Enhanced Production of Aromatic Amino Acids in Tobacco Plants Leads to Increased Phenylpropanoid Metabolites and Tolerance to Stresses. Front. Plant Sci. 2021, 11, 2020. [Google Scholar] [CrossRef]
  72. Schenck, C.A.; Maeda, H.A. Tyrosine Biosynthesis, Metabolism, and Catabolism in Plants. Phytochemistry 2018, 149, 82–102. [Google Scholar] [CrossRef]
  73. Jiang, N.; Doseff, A.I.; Grotewold, E. Flavones: From Biosynthesis to Health Benefits. Plants 2016, 5, 27. [Google Scholar] [CrossRef] [Green Version]
  74. Dong, N.Q.; Lin, H.X. Contribution of Phenylpropanoid Metabolism to Plant Development and Plant-environment Interactions. J. Integr. Plant Biol. 2021, 63, 180–209. [Google Scholar] [CrossRef] [PubMed]
  75. Verma, V.; Ravindran, P.; Kumar, P.P. Plant Hormone-mediated Regulation of Stress Responses. BMC Plant Biol. 2016, 16, 86. [Google Scholar] [CrossRef] [PubMed] [Green Version]
  76. Han, Q.; Tan, W.; Zhao, Y.; Yang, F.; Yao, X.; Lin, H.; Zhang, D.A.-O. Salicylic Acid-activated BIN2 Phosphorylation of TGA3 Promotes Arabidopsis PR Gene Expression and Disease Resistance. EMBO J. 2022, 41, e110682. [Google Scholar] [CrossRef] [PubMed]
  77. Ton, J.; Flors, V.; Mauch-Mani, B. The Multifaceted Role of ABA in Disease Resistance. Trends Plant Sci. 2009, 14, 310–317. [Google Scholar] [CrossRef] [PubMed]
  78. Corot, A.; Roman, H.; Douillet, O.; Autret, H.; Perez-Garcia, M.D.; Citerne, S.; Bertheloot, J.; Sakr, S.; Leduc, N.; Demotes-Mainard, S. Cytokinins and Abscisic Acid Act Antagonistically in the Regulation of the Bud Outgrowth Pattern by Light Intensity. Front. Plant Sci. 2017, 8, 1724. [Google Scholar] [CrossRef]
  79. Davies, W.J.; Kudoyarova, G.; Hartung, W. Long-distance ABA Signaling and Its Relation to Other Signaling Pathways in the Detection of Soil Drying and the Mediation of the Plant’s Response to Drought. J. Plant Growth Regul. 2005, 24, 285–295. [Google Scholar] [CrossRef] [Green Version]
  80. Wu, J.; Jin, Y.; Liu, C.; Vonapartis, E.; Liang, J.; Wu, W.; Gazzarrini, S.; He, J.; Yi, M. GhNAC83 Inhibits Corm Dormancy Release by Regulating ABA Signaling and Cytokinin Biosynthesis in Gladiolus Hybridus. J. Exp. Bot. 2019, 70, 1221–1237. [Google Scholar] [CrossRef] [Green Version]
  81. Yang, B.; Wang, Y.; Guo, B.; Jing, M.; Zhou, H.; Li, Y.; Wang, H.; Huang, J.; Wang, Y.; Ye, W.; et al. The Phytophthora Sojae RXLR Effector Avh238 Destabilizes Soybean Type2 GmACSs to Suppress Ethylene Biosynthesis and Promote Infection. New Phytol. 2019, 222, 425–437. [Google Scholar] [CrossRef]
  82. Shekhawat, K.; Fröhlich, K.; García-Ramírez, G.X.; Trapp, M.A.; Hirt, H. Ethylene: A Master Regulator of Plant-Microbe Interactions Under Abiotic Stresses. Cells 2023, 12, 31. [Google Scholar] [CrossRef]
  83. Li, F.; Duan, P.; Zhang, H.; Lu, X.; Shi, Z.; Cui, J. Genome-wide Identification of CmaGH3 Family Genes, and Expression Analysis in Response to Cold and Hormonal Stresses in Cucurbita Maxima. Sci. Hortic. 2022, 304, 111256. [Google Scholar] [CrossRef]
Figure 1. Principal component analysis (PCA) scores plot of ginseng leave samples and ginseng stem samples in the negative ion mode (A,C) and positive ion mode (B,D), respectively. CL: control leave group; DL: diseased leave group; CS: control stem group; DS: diseased stem group; QC: quality control.
Agriculture 13 00509 g001
Figure 2. Orthogonal partial least squares discriminant analysis (OPLS-DA) score plot of metabolites in the control and diseased ginseng tissues. OPLS-DA score plot in CL and DL group in the negative (A) and positive ion mode (B); OPLS-DA score plot in CS and DS group in the negative (C) and positive ion mode (D). Permutation test with 100 permutations of the OPLS-DA model of ginseng leaves in the negative (E) and positive ion mode (F); Permutation test with 100 permutations of the OPLS-DA model of ginseng stems in the negative (G) and positive ion mode (H).
Agriculture 13 00509 g002
Figure 3. Heat plot of the differentially expressed metabolites of ginseng leaves and ginseng stems in negative (A,C) and positive mode (B,D). 2 and −2 depict the highest and the lowest relative abundance, respectively.
Agriculture 13 00509 g003
Figure 4. Pairwise correlation heatmap among differentially expressed metabolites of ginseng leaves and ginseng stems in negative (A,C) and positive mode (B,D). 1 and −1 depict the highest negative and positive correlation values, respectively, in the correlation matrix.
Agriculture 13 00509 g004
Figure 5. Enrichment of Kyoto Encyclopedia of Genes and Genomes (KEGG) pathway analysis in different metabolic pathways in leaves (A) and stems (B) of ginseng induced by P. cactorum.
Agriculture 13 00509 g005
Figure 6. Changes of phytohormone content in ginseng leaves (A) and ginseng stems (B) when facing the infection of P. cactorum. The value of each sample is represented by a blue diamond, and the average value of each group is represented by a hollow square. ** represents very significant difference compared to the control group (p < 0.01), * represents significant difference compared to the control group (p < 0.05). TY: typhasterol; CA: castasterone; tZR: trans-zeatin riboside; SA: salicylic acid; GA3: Gibberellin A3; tZ: trans-zeatin; IAA: indole-3-acetic acid; ABA: indole-3-acetic acid.
Agriculture 13 00509 g006
Figure 7. Volcano plot of differentially expressed genes in ginseng leaves (A) and ginseng stems (B). Up- and down-regulated genes are reported as blue and red dots, respectively. Not DEGs are represented as gray dots. p threshold (=0.05) is reported in a dotted line. DEGs: differential expression genes.
Agriculture 13 00509 g007
Figure 8. GO categories of the predicted target genes of the DEGs in ginseng leaves (A) and stems (B).
Agriculture 13 00509 g008
Figure 9. Scatter plots of KEGG pathway enrichment analysis of DEGs in ginseng leaves (A) and ginseng stems (B).
Agriculture 13 00509 g009
Figure 10. KEGG Pathway co-enriched analysis of DEGs and metabolites in ginseng leaves (A) and ginseng stems (B). Bar chart showing the number of genes/metabolites covered by each enriched pathway. The Y-axis indicates -Log10 (p-value) of genes/metabolites while the X-axis indicates the pathway name. yellow: gene; green: metabolites.
Agriculture 13 00509 g010
Figure 11. SDMs and DEGs in pathways of “Alanine, aspartate and glutamate metabolism”, “Glycine, serine and threonine metabolism”, and “Biosynthesis of unsaturated fatty acids” in ginseng leaves (A,C,E) and stems (B,D,F). Upregulated SDMs were depicted in red circles; downregulated SDMs were depicted in green circles. 1.5 and −1.5 depict the highest and the lowest relative abundance, respectively. SDMs: disease-related metabolites.
Agriculture 13 00509 g011
Figure 12. Underlying molecular stress response of ginseng plants to the P. cactorum infection.
Agriculture 13 00509 g012
Table 1. Treatments of ginseng plant in different groups.
GroupsTreatmentsCulture Time After TreatmentHarvested Tissue
CL1sterile water10 daysleaves
DL2P. cactorum10 daysleave
CS3sterile water10 daysstems
DS4P. cactorum10 daysstems
CL1, control leave group; DL2, diseased leave group; CS3, control stem group; DS4, diseased stem group.
Disclaimer/Publisher’s Note: The statements, opinions and data contained in all publications are solely those of the individual author(s) and contributor(s) and not of MDPI and/or the editor(s). MDPI and/or the editor(s) disclaim responsibility for any injury to people or property resulting from any ideas, methods, instructions or products referred to in the content.

