
Research on the Measurement Method of Feeding Rate in Silage Harvester Based on Components Power Data
by
 ,
,
Fengzhu Wang
1,2 ,
,
Jizhong Wang
1,2,
Yuxi Ji
1,2,
Bo Zhao
1,2,
Yangchun Liu
1,2,
Hanlu Jiang
1,2 and
Wenhua Mao
1,2,* 1
State Key Laboratory of Soil Plant Machine System Technology, Chinese Academy of Agricultural Mechanization Sciences Group Co., Ltd., Beijing 100083, China
2
Chinese Academy of Agricultural Mechanization Sciences Group Co., Ltd., Beijing 100083, China
*
Author to whom correspondence should be addressed.
Agriculture 2023, 13(2), 391; https://doi.org/10.3390/agriculture13020391
Submission received: 15 January 2023
/
Revised: 1 February 2023
/
Accepted: 4 February 2023
/
Published: 7 February 2023
(This article belongs to the Special Issue 'Eyes', 'Brain', 'Feet' and 'Hands' of Efficient Harvesting Machinery)
Abstract
:For existing problems, such as the complex interactions between a crop and a machine, the measuring difficulty and the limited measurement precision of the feeding quantity within the corn silage harvester, a method of feeding rate measurement based on key conditions data, working data cleaning, and multiple variate regression is proposed. Non-destructive rotation speed, rotation torque, and power consumption sensors are designed for the key mechanical components. The data conditions, such as rotating speed, rotating torque, power consumption, hydraulic pressure, and hydraulic flow for the key operation of parts including cutting, feeding, shredding, and throwing are monitored and collected in real-time during field harvesting. The working data are screened and preprocessed, and the Mann-Kendall boundary extraction algorithm is applied, as is multiple component time lag correction analysis, and the Grubbs exception detection method. Based on a Pearson correlation analysis results, one-factor and multiple-factor regression models are respectively developed to achieve an accurate measurement of the corn feeding rate. The field validation tests show that the working data boundary extraction results among the load-stabilizing components such as shredding roller and throwing blower are highly reliable, with a correct rate of 100%. The power monitoring data of the shredding roller and throwing blowers are significantly correlated with the crop feeding rate, with a max correlation coefficient of 0.97. The determination coefficient of the single-factor feeding rate model based on the shredding roller reaches 0.94, and the maximum absolute error of the multi-factor feeding rate model is 0.58 kg/s. The maximum relative error is ±5.84%, providing technical and data support for the automatic measuring and intelligent tuning of the feeding quantity in a silage harvester.
1. Introduction
The feeding rate is an important factor affecting the overall performance of a silage harvester. The increase in the feeding rate can significantly improve the harvesting efficiency of a silage harvester [1]. However, if the feeding rate is too high, on the one hand, maize plants will be fed too fast, which may easily cause blockage and failure in the working part, especially the header, and throwing components in the harvester [2]. In this way, the harvesting progress is affected by the follow-up manual fault clearing. On the other hand, due to the excessive feeding volume, the whole machine will be in overloaded harvesting conditions for a long time, which may cause fatigue damage to the working parts and engine [3], thus reducing the overall machine service life. Conversely, when the feeding rate is too small, apart from directly reducing the harvesting efficiency, it may affect the shredding performance of the silage harvester, resulting in the average length of silage cutting or the uniformity of the cutting length not meeting the expected requirements. The ideal field operation state of the silage harvester is to maintain a stable and optimal feeding rate within the rated range on the premise of ensuring a sufficient chopping performance [4].
Currently, scholars have carried out a significant amount of research on the detection method of feeding rate in forage harvesters [5,6,7]. According to the detection principle, this can mainly be divided into mass flow type and volume flow type. The mass flow method mainly realizes the online detection of the feeding rate through indirect modeling by monitoring the machine’s working conditions, such as speed, torque, power, pressure, capacitance, etc. [8,9,10,11]. This method has been extensively studied on grain combine harvesters and has achieved good field verification results [12,13,14]. However, for silage harvesters, which use whole-plant intake, the material composition and machine-crop interactions are more complex [15], and there is a lack of sufficient research on airborne applications, the existing monitoring system for a forage harvester mainly realizes the measurement of conventional parameters, such as location, rotation speed, cutter height, engine data, feeding metal, blade sharpness, etc. Most of the research applications focus on the display and early warning for the machine status, while the relationship among monitoring parameters is relatively independent, and there is a need for a better feeding rate monitoring method based on correlation analysis and multiple-parameter fusion modeling [16,17]. The volume flow detection is mainly detected by the opening of the feed inlet, without considering the influence of moisture content and material density on the model, in which repeated calibration is required [18], and further research is required. According to the model’s methodology, as for the mathematical relationship between the power consumption and feeding rate for a crop combine harvester, the primary, quadratic, and exponential regression models are frequently applied, and it was shown that the measurement between feeding rate and working torque or working power is better modeled by using the primary linear regression model [19].
In consideration of the shortcomings in the existing research and the demands in feed rate monitoring, this paper proposes a measurement method based on multi-power data fusion regression for a maize silage harvester. The mechanism principle and operation process of the silage harvesting machine is analyzed, and strain resistance principles and pressure flow principles are used to design real-time power monitoring sensors for key operation components. Highly reliable pre-processing algorithms for dynamic field data are studied, a one-variable linear model and multiple-variable fusion regression model based on a correlation analysis is established to measure the feeding rate, and field harvesting experiments are carried out to validate the relevant sensors, processing algorithms, and measurement models.
2. Materials and Methods
2.1. Feeding Rate Factors Analysis
The feeding rate of a silage harvester is the total quality of silage fed into the silage harvester per second. During the harvesting operation, the silage feeding rate is influenced by many factors, which can be divided into antecedent factors and subsequent factors according to the time before and after the crop is fed into the machine. The antecedent factors include the harvesting speed, crop density, feeding width, plant moisture content, stubble height, etc. The subsequent factors include the relevant operating condition parameters of the silage harvester, such as the speed, torque, and power of the key working components. The antecedent factors are largely dependent on crop characteristics and vary considerably between land areas [20]; it is difficult to obtain precise data to support the accurate measurement of the feeding rate in field experiments. The subsequent factors can directly characterize the working load of the silage harvester along with the material feeding, and can dynamically respond to the feeding rate change in real time. Therefore, this paper constructs a detection model to automatically obtain the feeding rate through the subsequent power data of multiple components of the maize silage machine.
2.2. Power Measuring Principle
2.2.1. Parameter Symbol Definition
Variable symbols are defined as follows:
Pr—the power consumption of the mechanical-driven part, kW
nr—the rotation speed of the mechanical-driven part, r/min
vr—the rotation linear velocity of the mechanical-driven part, m/s
Tr—the rotation torque of the mechanical-driven part, N.m
F—the rotation force of the mechanical-driven part, r/min
R—the rotation radius of the mechanical-driven part, m
Ph—the power consumption of the hydraulic-driven part, kW
q—the output flow of the hydraulic pump, L/min
Po—the outlet pressure of the hydraulic pump, MPa
Pi—the inlet pressure of the hydraulic pump, Mpa
q—the output flow of the hydraulic pump, L/min
Po—the outlet pressure of the hydraulic pump, MPa
Pi—the inlet pressure of the hydraulic pump, MPa
V0—the rated flow of the hydraulic pump, L/min
ηv—the volumetric efficiency of the hydraulic pump
n0—the engine speed, r/min
k—the transmission ratio the hydraulic pump and the engine
2.2.2. Measuring Principle Analysis
According to the machine power roadmap of the maize silage harvester, the power sources of key operation parts include both mechanical drive and hydraulic drive.
For mechanically-driven working parts, the operating power can be acquired by measuring the rotational speed and rotating torque. For rotation torque measurement, the principle of torsion resistance strain gauge is used, and the strain gauge is attached to the rotating elastic shaft to form a strain bridge detection circuit, which outputs a frequency signal proportional to the torsion value, and thus the working torque is obtained. For rotation speed measurement, a speed sensor is mounted on the fixed part of the torque sensor, and an encoder with multiple detection positions is installed on the rotating part of the torque sensor. When the encoder rotates with the working shaft, the sensor outputs a series of speed pulse signals, and the working speed is measured. According to the definition of mechanical torque, the torque can be calculated by Formula (1).
The relationship between linear speed and rotational speed is shown as follows:
The power consumption of the mechanical rotating parts is then given as follows:
For hydraulic-driven working parts, the operating power can be obtained by the differential pressure between the outlet and inlet and the hydraulic flow of the hydraulic pump, and the power of the hydraulic parts is calculated as follows.
2.3. Power Sensor Design
On the basis of not changing the original body structure, the torque and speed sensors are designed to meet the power detection requirements of different installation locations in the silage harvester.
2.3.1. Header Power Sensor
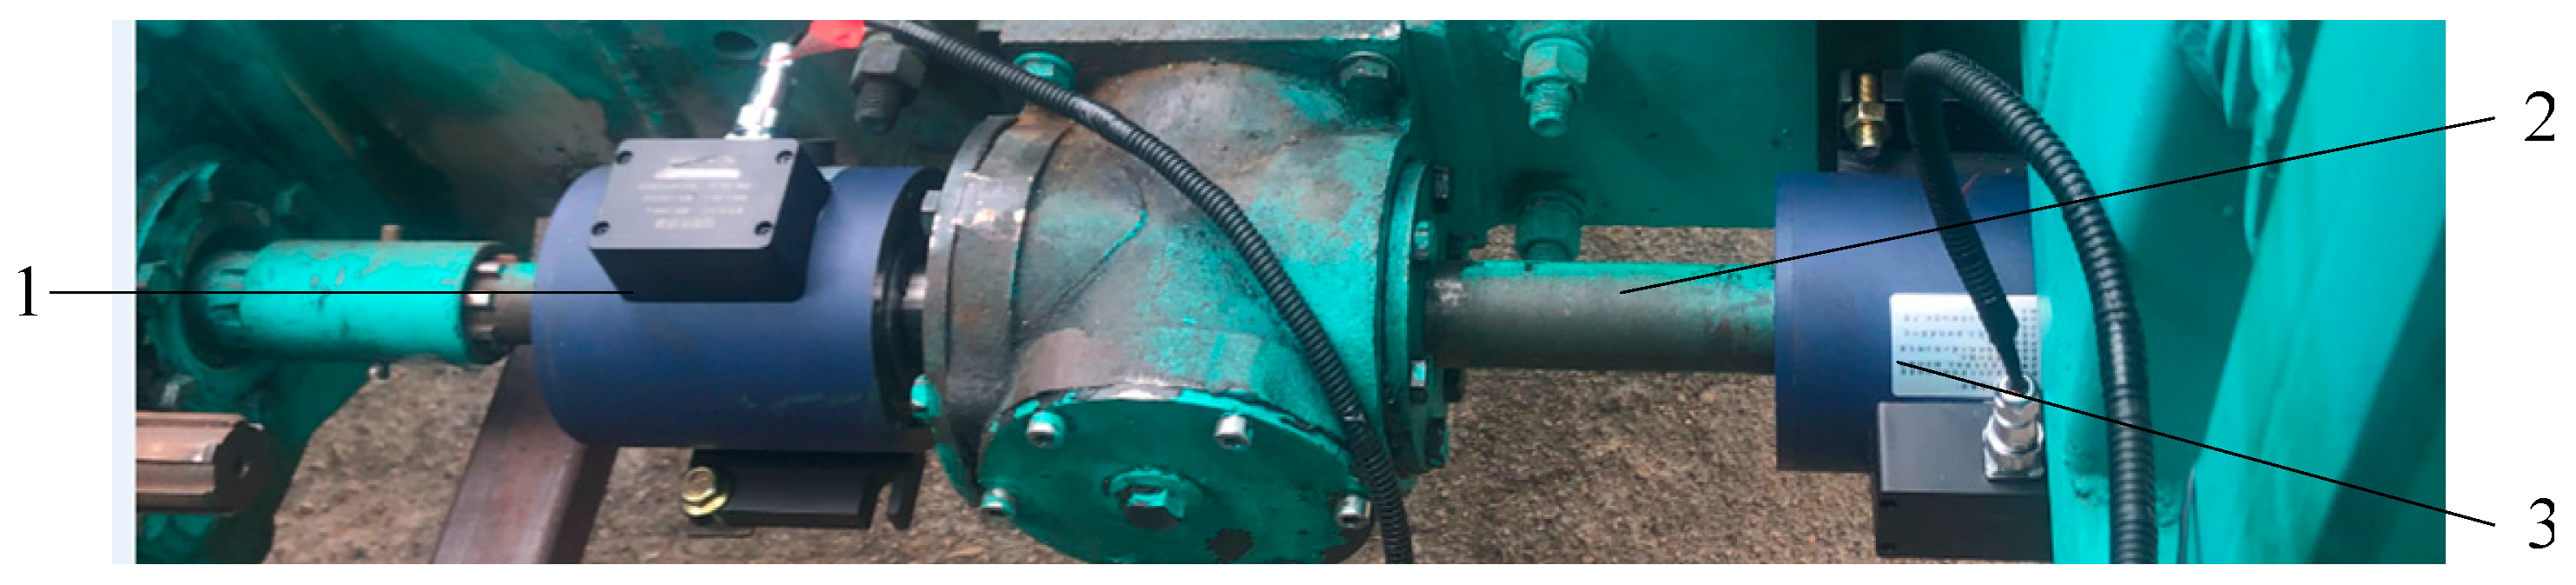
The header is driven by a spline shaft. Under normal operating conditions, the corn silage harvester works in the way of full-width without row-control. Theoretically, it is believed that the operating power of the left header and the right header are equal. Considering the installation space on the header shaft, the original T-shaped driving shaft on the right side of the header is selected as the installation position of the sensors. Two sensors are designed to measure the dynamic power of the header in the shaft-mounting type, where the power sensor of the inside shaft is used to measure the power at the small and fixed rotary cutter disk, while the power sensor of the outside shaft is applied to measure the dynamic power of the large folding and rotary cutter disk, as shown in Figure 1.
2.3.2. Shredding Power Sensor
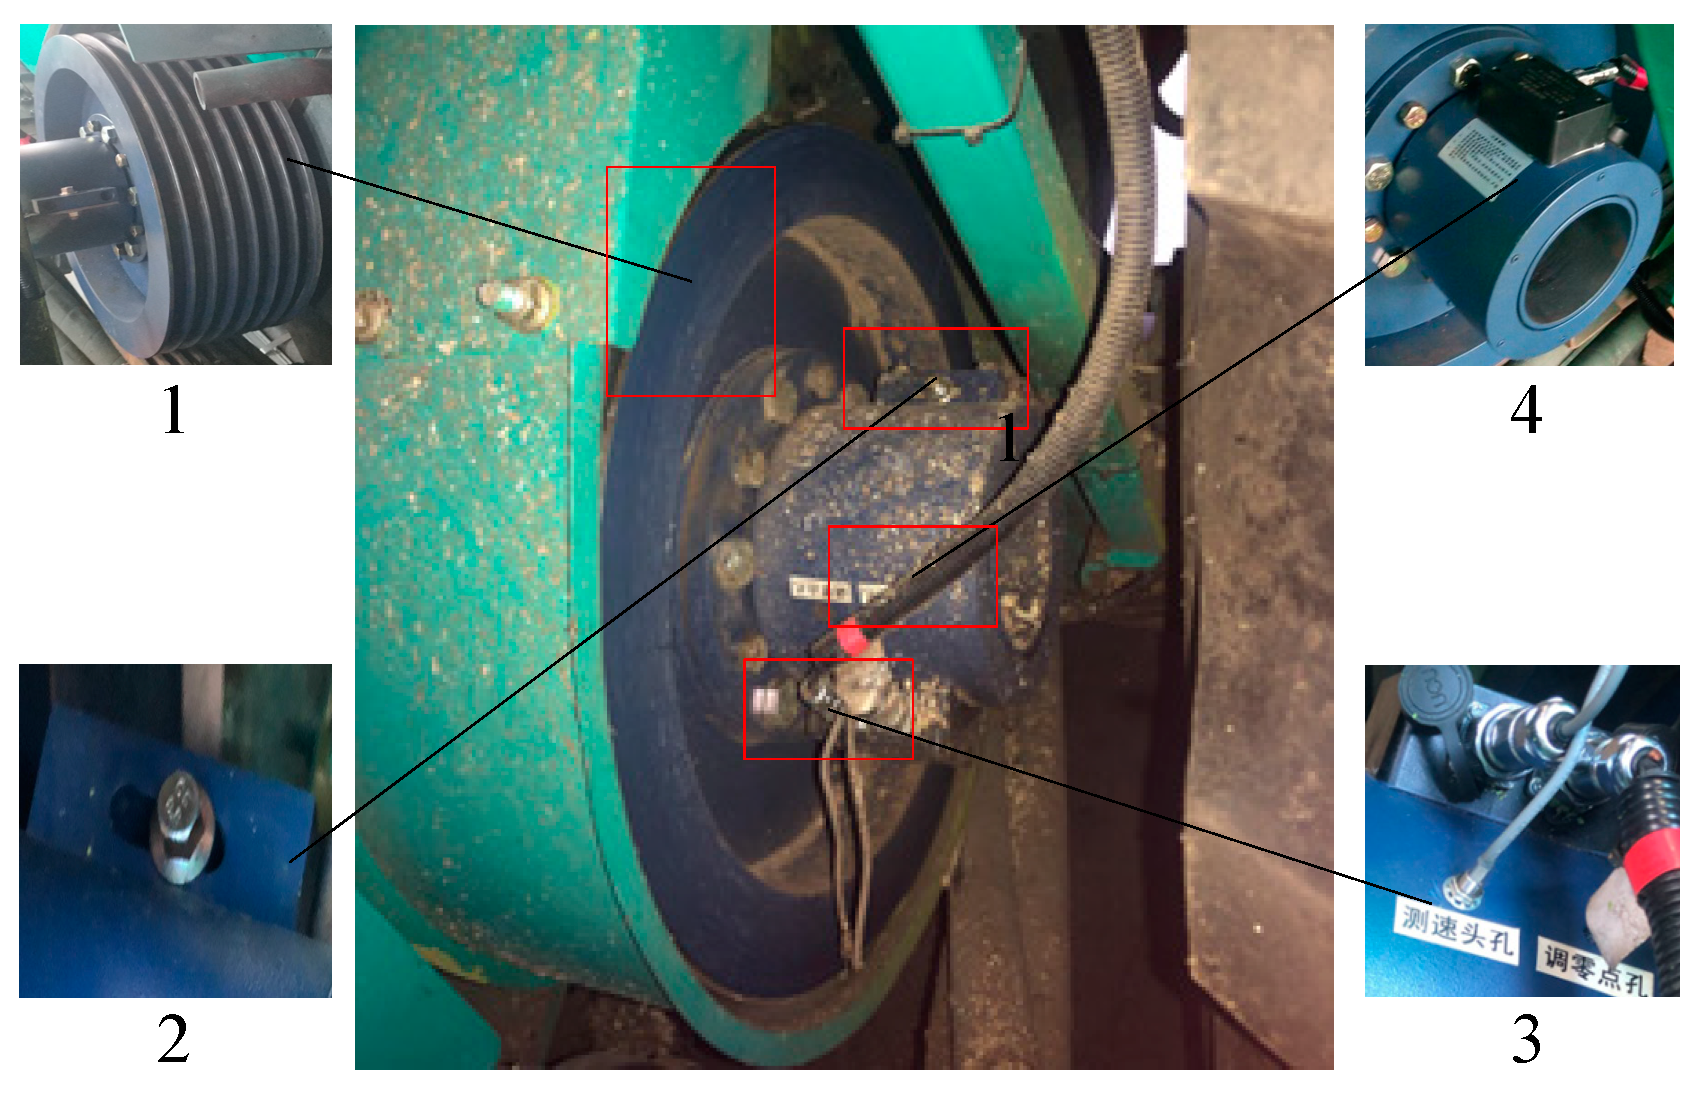
The shredding rollers are driven by the pulley. The original drive pulley is made of cast iron, and its elastic properties cannot meet the requirements of accurate torque measurement. According to the mechanical dimensions of the original cast iron pulley, 40CrNiMoA high-strength alloy steel material with better inherent elastic properties is selected to design a pulley-type shredding torque and speed sensor, as shown in Figure 2.
The sensor mainly consists of three parts: an elastic pulley, a torque-sensing component, and a speed-sensing component. The elastic pulley is utilized to replace the original cast iron pulley, providing the mechanical connection and power transmission for shredding rollers. The torque sensor component includes a resistive torsion strain bridge, a signal acquisition circuit, a signal output circuit, etc. The speed sensor component includes an inductive speed sensor mounted with tiny round screw threads, a speed probe mounting hole, and a speed measuring panel with 30 detection points equally distributed along the circumference. The inductive speed sensor is fixed on the sensor shell at a distance of 1.0 mm from the speed panel, and while as the disc rotates, the speed sensor continuously outputs pulses.
2.3.3. Blowing Power Sensor
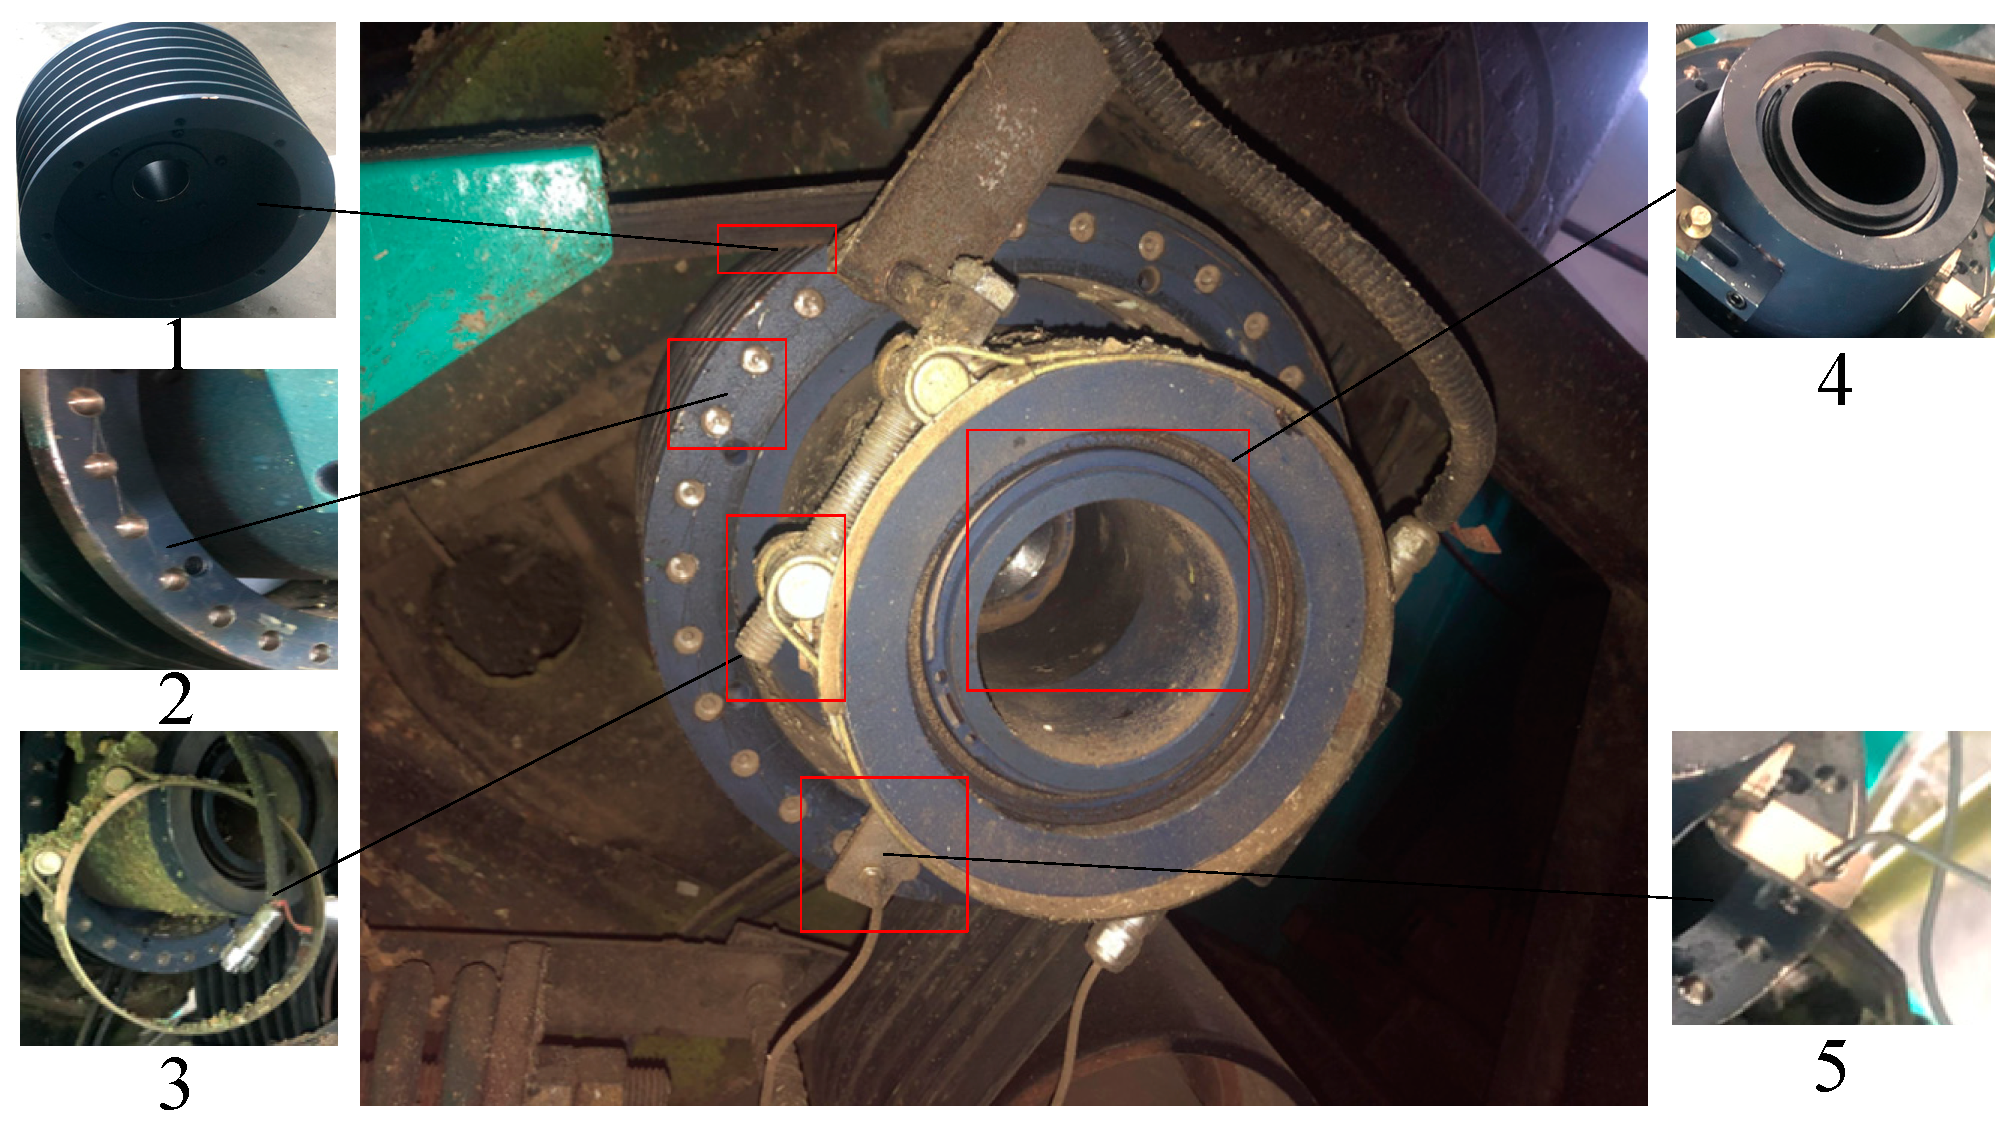
The throwing blower is driven by the pulley. The pulley-type throwing blower torque and speed sensor are designed according to the original mechanical dimensions. The torque measurement is implemented in a similar structure as the shredding rollers. As for the speed detection, due to the small size of the throwing pulley, the outward structure of the speed panel is designed to achieve real-time acquisition of speed pulse signals, while 30 measuring points are evenly arranged along the end face of the pulley, as shown in Figure 3.
2.3.4. Power Sensor Accuracy
The YD322 oil pressure sensor with ±0.1% precision produced by Xian Yunyi Instrument Co., Ltd., Xi’an, China. is applied in the hydraulic power measurement. While the PY-M5S1.5N-L2M hall-type speed sensor with ±0.1% precision manufactured by Delan Electronics Co., Ltd., Dongguan, China. and the HX-900 Rotary Torque Sensor produced by Sanhe Yanjiao Huaxin Mechanical & Electrical Co., Ltd., Langfang, China. is used in the mechanical power measurement. Meanwhile, the CX8525 torque calibrator is used for static torque calibration and measurement, where the loading torque was set to 0%, ±20%, ±40%, ±60%, and ±100% of the full scale of the sensor by electromagnetically controlling the standard loading weights, and it was determined through testing that the static error of the torque sensors was lower than ±0.3%.
3. Algorithms and Models
3.1. Data Pre-Processing Algorithm
The field data acquisition system collects real-time machine-state data continuously. In order to avoid the interference of invalid data to the power-feeding model, only the data collected during the silage harvesting period should be selected as the original data input of the model.
3.1.1. Effective Data Filtering
The shredding roller and throwing blower are the key operating components of the silage harvester, which have more than 60% of the power consumption of the whole machine and have more significant data variation characteristics. Therefore, the monitoring data of these two components are used as the screening basis, and combined with the time-lag analysis model based on material flow, the screening of all measurement data is realized. The main process is as follows.
(1) Define a collection of data categories, D = {d1, d2, d3, d4} = {1, 2, 3, 0}. Where d1, d2, d3, and d4 represent pre-acceleration data, field harvesting data, harvesting stopped data, and non-experimental suspended data, respectively.
(2) Preliminary classification is carried out depending on the rotation speed of the shredding roller, where the experimental and non-experimental data segments are obtained.
where Di is the data category of the ith sampling. nc and nce are the real-time shredding speed and rated shredding speed, respectively.
(3) The Mann-Kendall algorithm is used to detect the boundary points of field harvesting data [21]. Mann-Kendall is a non-parametric time-series rank test method which has good applicability to field data with anomalous interference and unknown sample distribution. However, it is not appropriate for multiple mutation detection. Thus, the experiment samples in the original torque detection sequence are segmented into two data subsets, which are independently used to detect the loaded mutation boundary points and the unloaded mutation boundary points. In the case of a subset X = {x1, x2, x3…,xn} with n torque detection sequences, first, a forward rank sequence Sk is constructed by forwarding traversal and calculation of the cumulative count of torque values at the ith time greater than that at the jth time in the sequence, as shown in Formula (6).
Secondly, based on the sequence mean E(Sk) and sequence variance var(Sk), the forwarding statistics sequence UFk is calculated by Formula (7).
Thirdly, the reverse statistic sequence UBk is calculated by reconstructing the reverse detection sequence XB = {xn, xn-1, …, x1}, repeating the above traversal process, and taking the negative. Then, under the assumption that the statistic follows the standard normal distribution [22], the solution in Equation (8) under the U0.05 significance level constraint is the rising or falling boundary of the effective data segment.
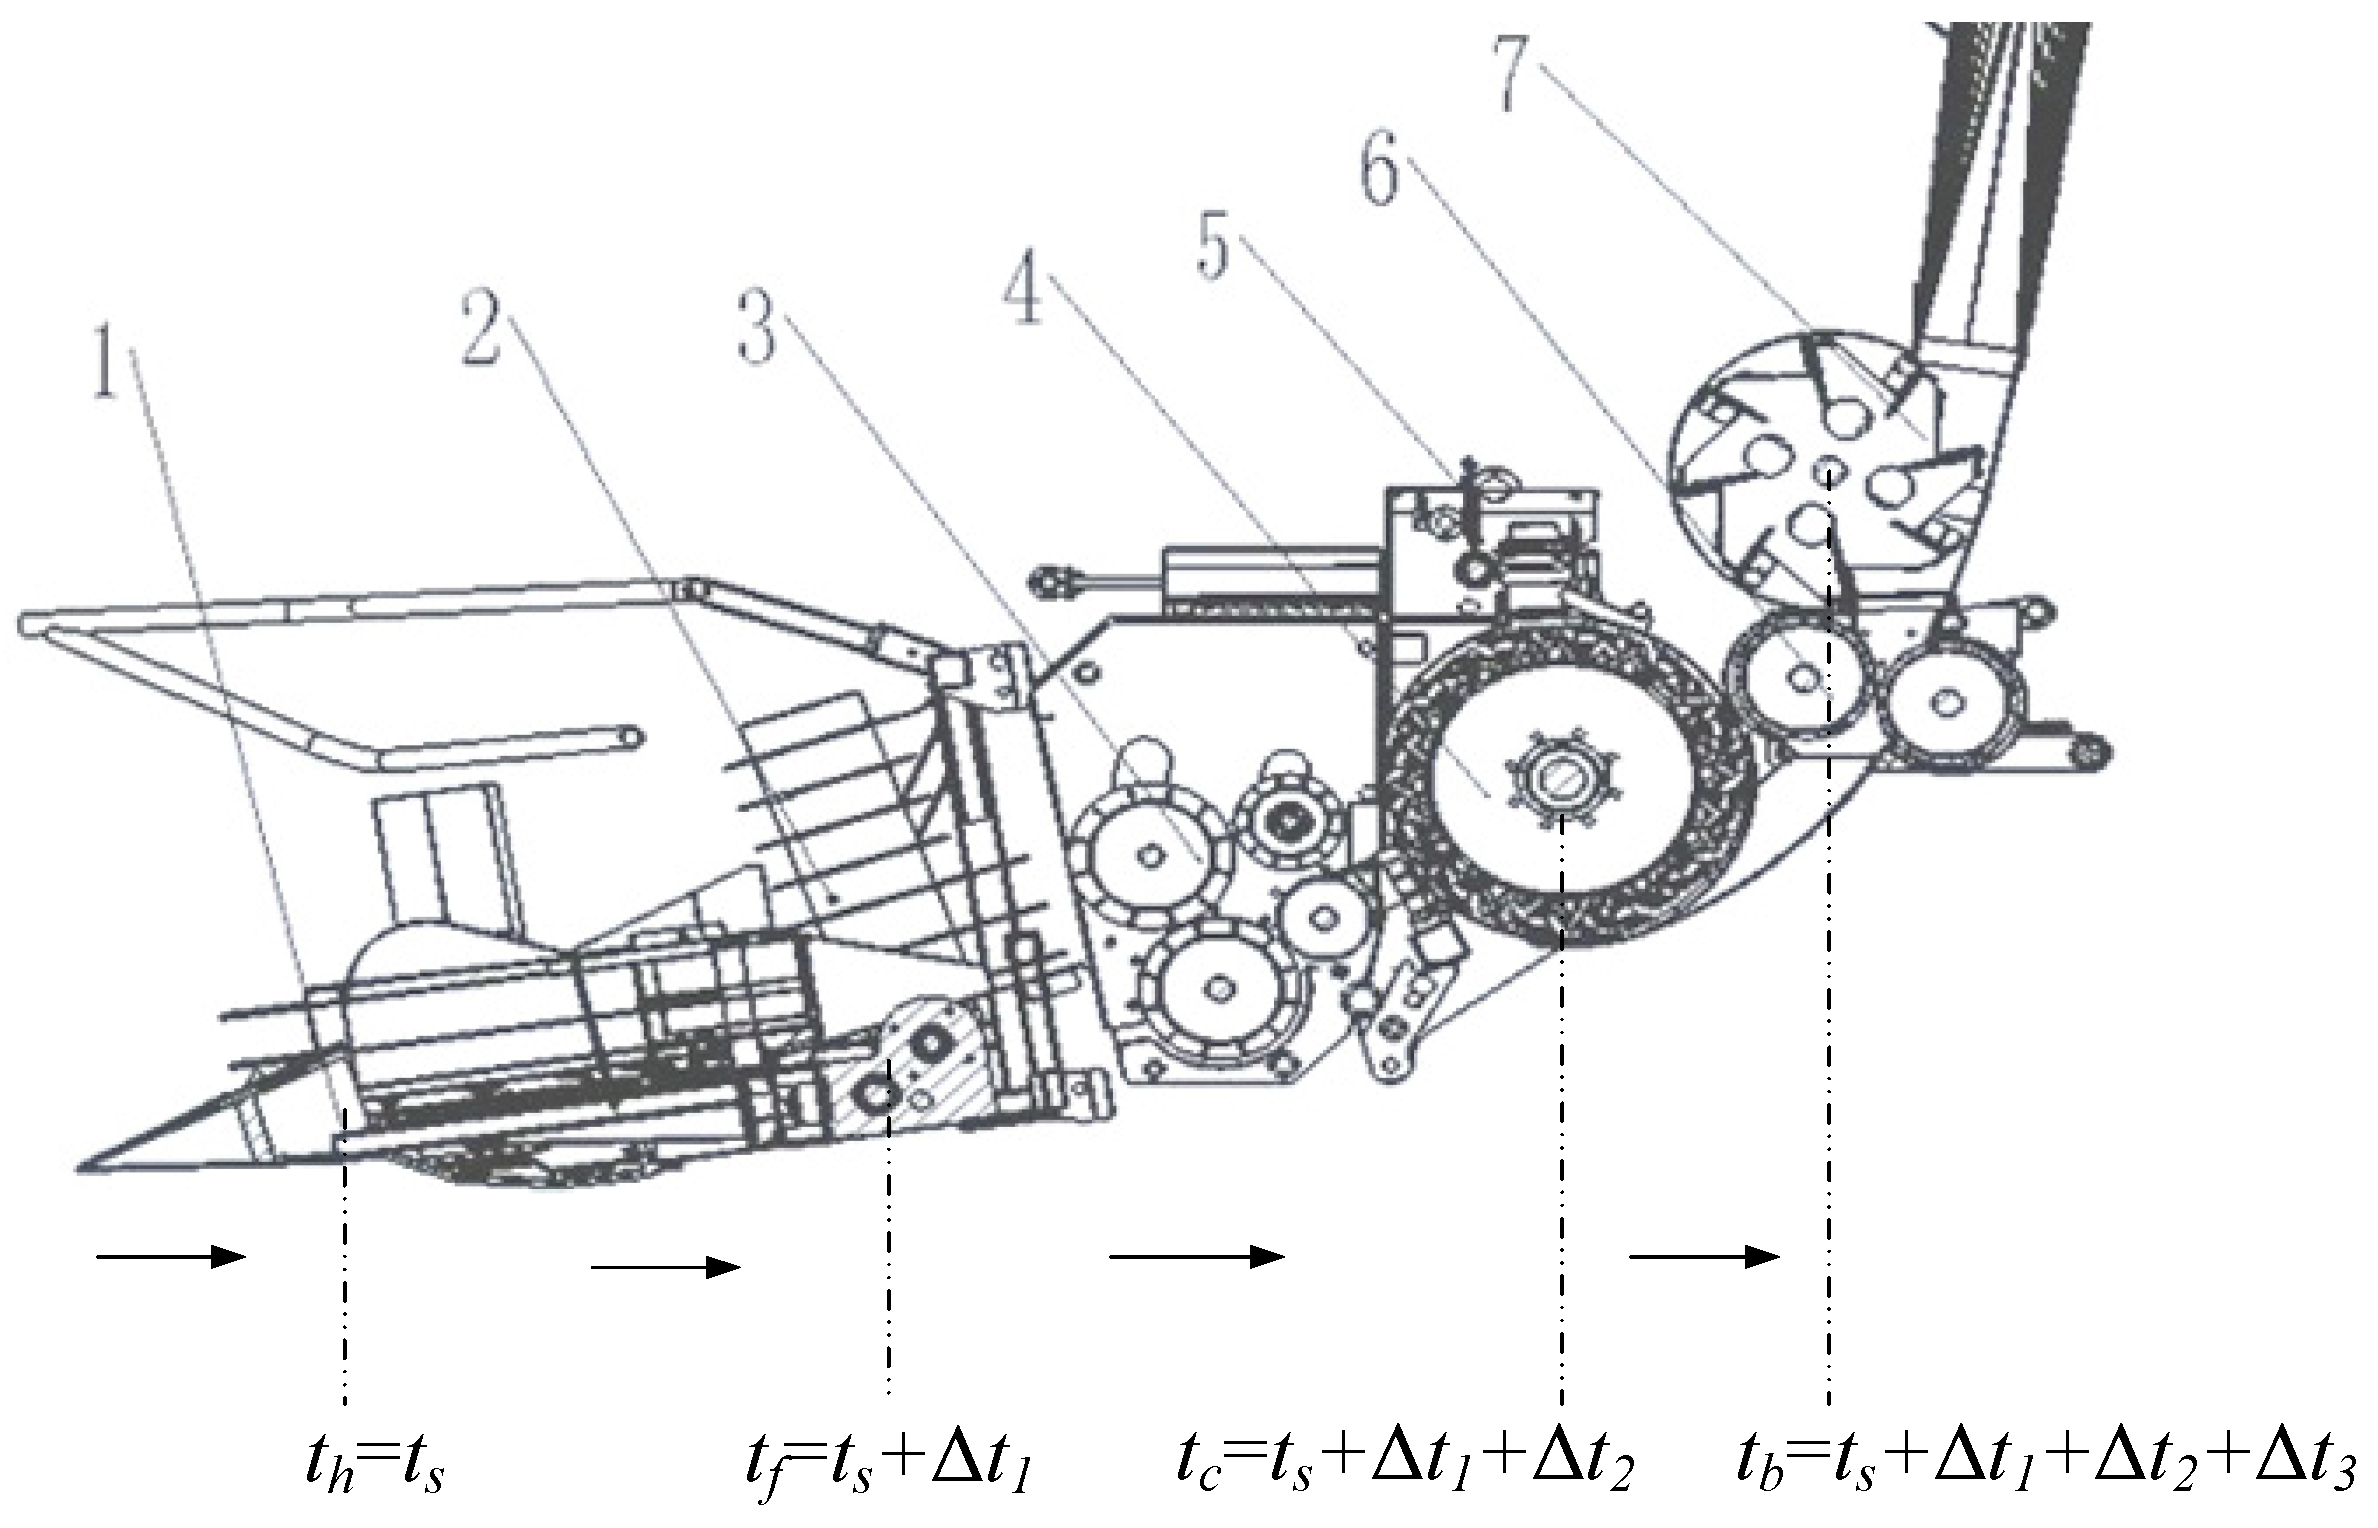
(4) Through the steps above, the data screening for shedding rollers and throwing blowers can be achieved. However, as for header and feeding parts, the data variation characteristics are not sufficient to enable precise boundary extraction. Thus, we locate the harvesting data segment of these two parts by the material’s time-delay model in the silage harvester, as shown in Figure 4.
As the silage is fed into the harvester at the time th, there is almost no time delay for header torque change; After the collection of the header, the silage then reaches the feeding conveying rollers at the time tf, while a time lag of Δt1 exists for the feeding power. After the silage is compacted and conveyed by the feeding rollers, it arrives at the shedding rollers at the time tc, and there is a time lag of (Δt1 + Δt2) for the shredding torque change. Finally, after the crop is shredded, it reaches the blower at the time tb, while the blower load data has a time delay of (Δt1 + Δt2 + Δt3). Δt1 and Δt2 are calculated by Formula (9).
Thus, the effective data segments of the header, feeding unit, shredding rollers, and throwing blows are Xh, Xf, Xc, and Xb respectively, as shown in the Formula (10).
where S1 and S2 are the moving distance of the crop at the header and the feeder, respectively. Rh and Rf are the radii of the header cutting disk and the upper feed roller, respectively. nh and nf are the rotation speed of the header and the upper feed roller, respectively. tcs and tce denote the rising edge and descending edge of the filtered data in the shedder. tbs and tbe express the rising edge and descending edge of the filtered data in the blower.
3.1.2. Exception Data Handling
There are inevitably some anomalous data among the field monitoring samples. Anomalous data include outliers value and the missing value. The outliers are generally evaluated based on the statistical principle. In this study, the Grubbs criterion is applied to verify data and reject outliers one by one with a confidence level of 0.05, while the Grubbs criterion has a more rigorous result [23,24], particularly suitable for this application, within a sample size of 25 to 185 [25]. Taking the screened shedding unit data Xc = [x(tcs), x(tcs+T),…,x(tcs+iT),…, x(tcs+pT)] as an example, the process of data exception handling is as follows.
(1) the sample mean and standard deviation are calculated by the Bessel Formula (11).
(2) Reorganize the samples in order of numerical size {x(t)1, x(t)2…, x(t)p}, where x(t)1 ≤ x(t)2 ≤…x(t)p. The residual error of suspicious outliers vi is calculated by the Formula (12).
(3) Compare the suspicious residual error vi with the critical value of Grubbs coefficient G0. If Formula (13) is satisfied, the data is determined to be an outlier and removed from the data sequence. The new sequence is then retested until there are no outliers in the data series.
(4) Stuff the rejected outliers and missing values by the nearest neighbor method [26], as shown in Formula(14).
3.2. Power Feeding Rate Model
3.2.1. Single-Variable Regression Model
Taking the real-time power consumption of each key operating component in the maize silage harvesting process as the input of the model, a one-dimensional linear regression model between the single power data and the feeding quantity is established, as shown in Formula (15).
where qm is the feeding rate of the silage harvester. x represents the power of a key component. a and b are model regression parameters. ε is residual in the single regression.
3.2.2. Multi-Variable Regression Model
Through preferentially selecting the main factors affecting the feeding rate by correlation analysis in the silage harvester, the least squares multiple regression model [27] between multi-power data and feeding quantity is developed to achieve multi-parameter calibration and fused feeding rate detection, as shown in Formula (16).
where b0, b1, …, and bn are model regression parameters, εm is the residual of the multi-regression.
4. Results and Discussion
To verify the availability of the feeding rate detection model, harvesting tests are carried out in Rizhao, Shandong Province with a self-propelled silage harvester. First, the real-time power monitoring sensors are integrated into the test prototype, covering both the mechanical driving parts and hydraulic driving parts. Secondly, by adjusting the harvesting speed between 1 km/h and 4 km/h, seven groups of field experiments are designed and conducted under different feeding rates, where condition monitoring data under different operating status is simultaneously collected and stored. Thirdly, the raw monitoring data is preprocessed by the combination of the Mann-Kendall data filtering algorithm and the Grubbs exception handling algorithm. Finally, the univariate and multivariate model based on the power data is applied to realize the feeding rate measurement.
4.1. Field Experiment Design
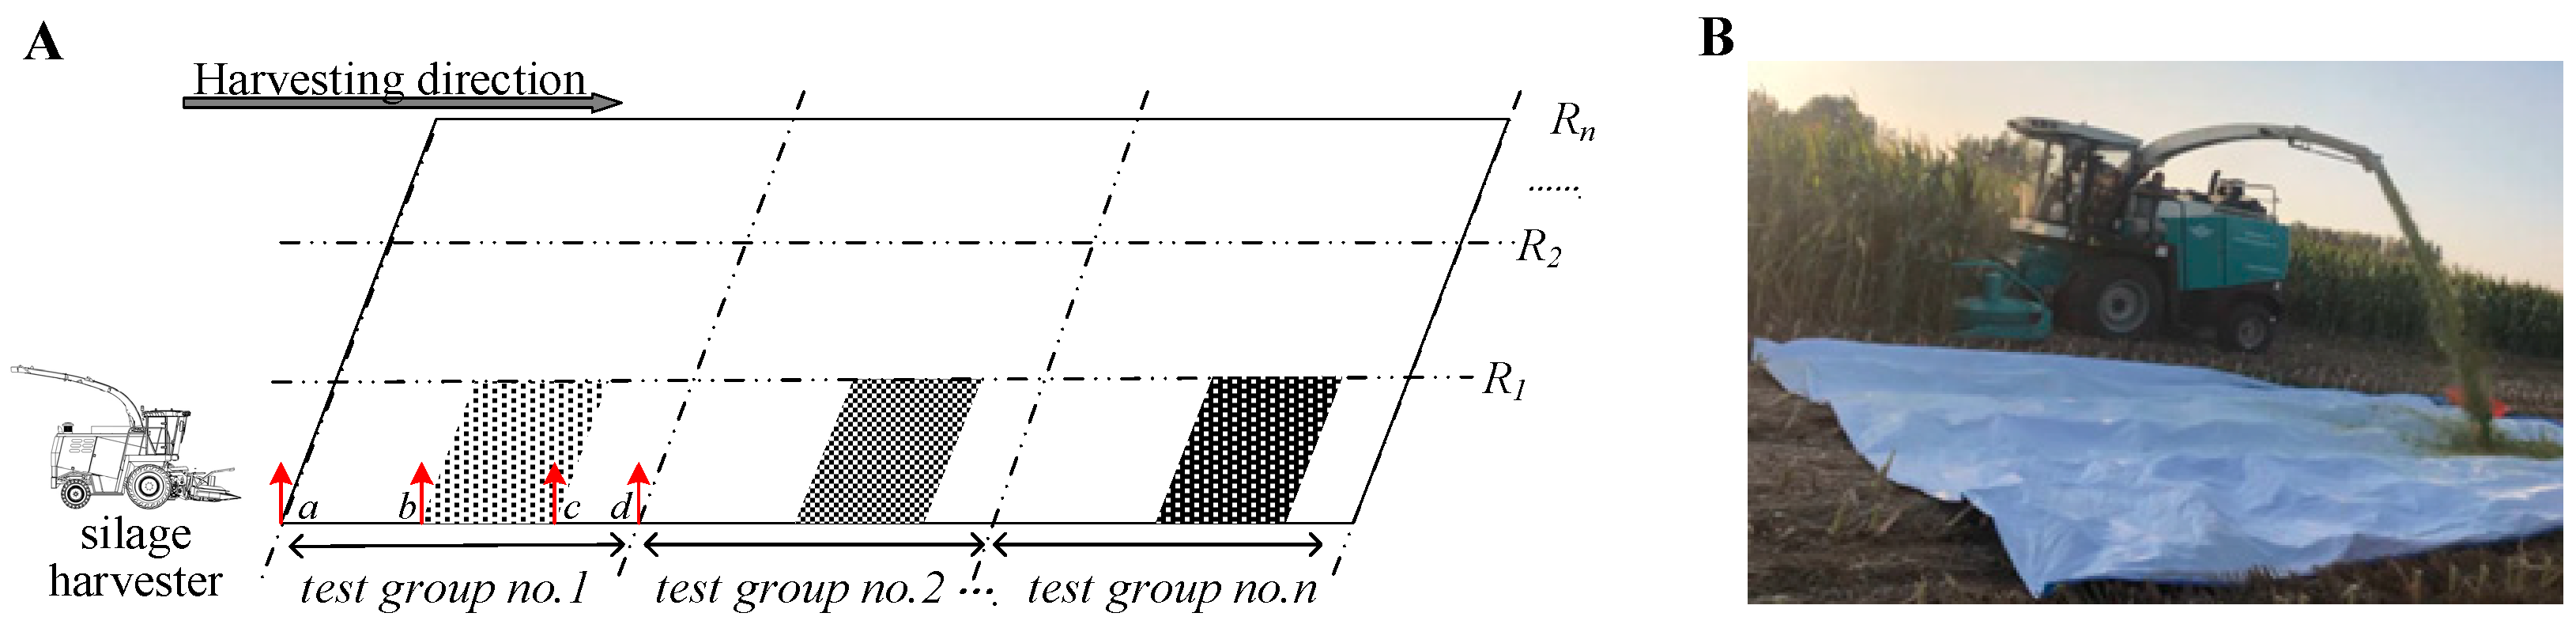
Field experiments are realized group by group, as shown in Figure 5, while the harvested crops are upright maize at the wax ripeness stage with a moisture content of 65–70%.
As shown in Figure 5A, during each group, the silage harvester is adjusted to a predetermined harvesting velocity under the rated working state in the pre-acceleration area (the area between position a and position b in test group no.1). After that, the normal harvesting progress is carried out in the harvesting area (the area between position b and position c in test group no.1) according to the setting velocity and cutting height of 150 mm, while simultaneously all of the silage materials thrown from the outlet of the throwing cylinder were collected manually. Reaching point c, the harvester was parked and shut down in the stopping area (the area between position c and position d in test group no.1). As shown in Figure 5B, the raw material harvested and processed by the silage harvester all falls on the aggregate canvas. After manual collection, it is weighed with a platform scale with an accuracy of 0.01 kg to obtain the cumulative mass of the harvested material. After that, the true value of the feeding rate is calculated with the harvesting time.
4.2. Test Results Analysis
4.2.1. Data Pre-Processing Results
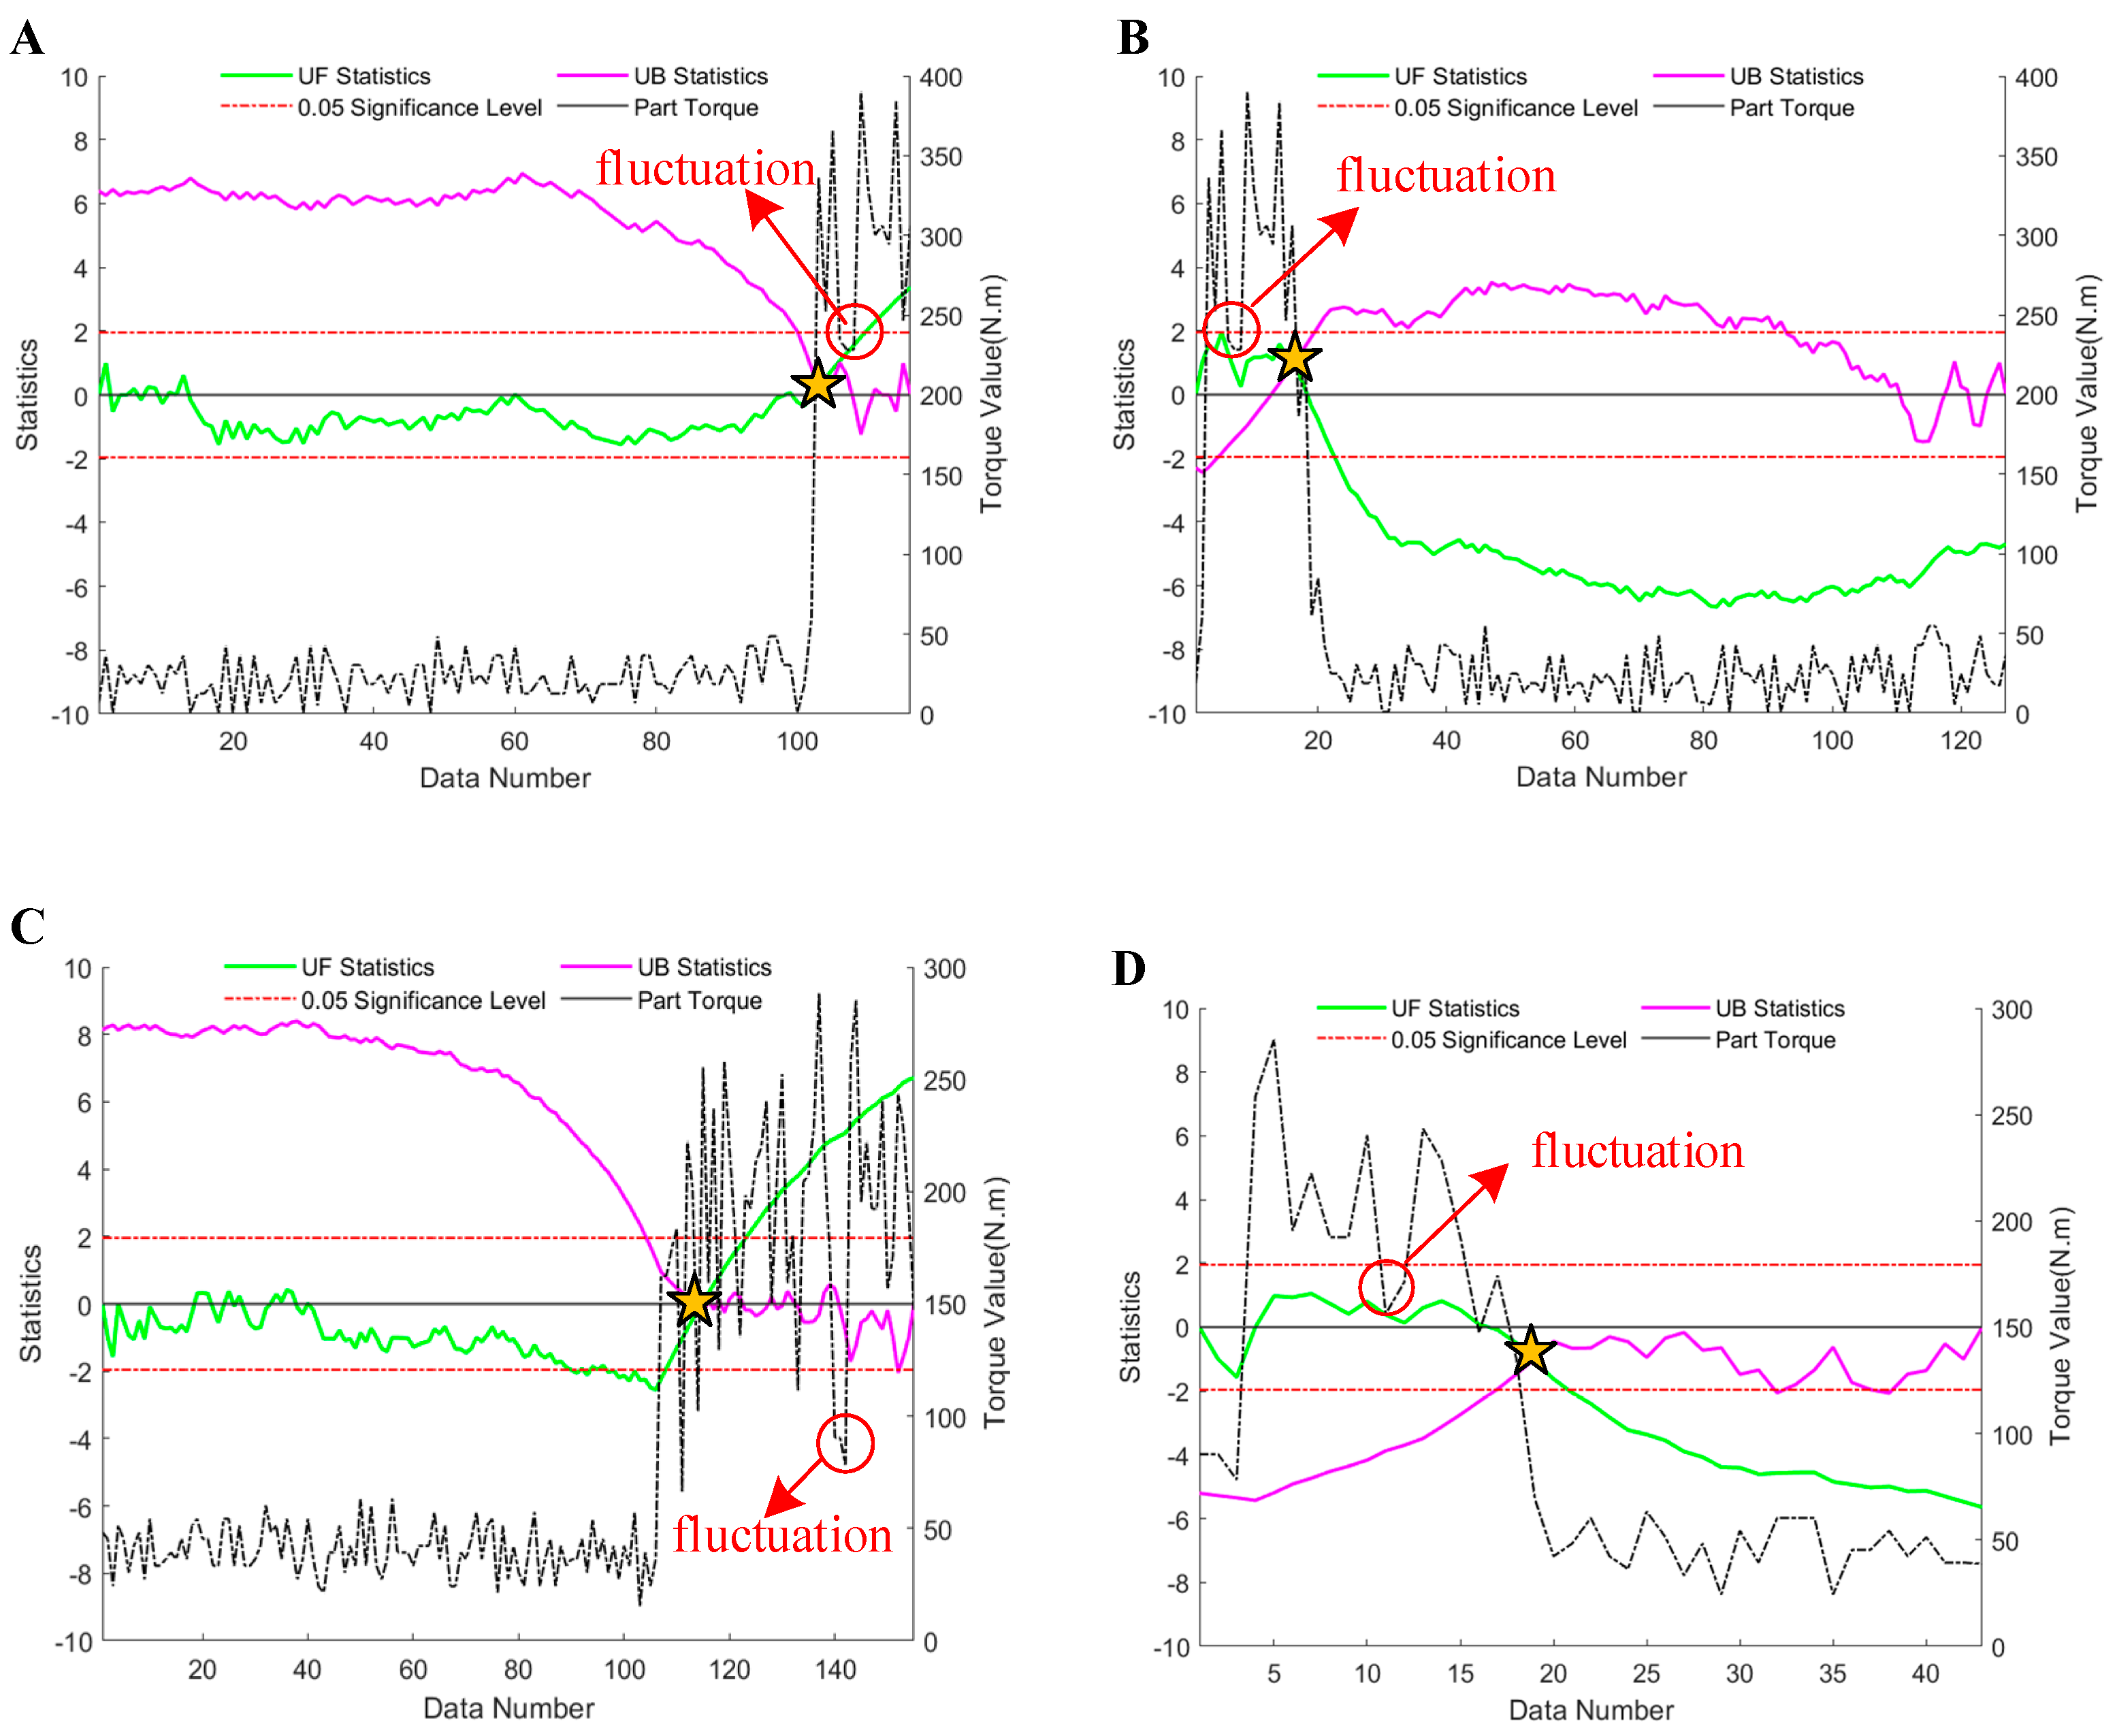
First, the Mann-Kendall algorithm is used to screen the effective data segments. The detection results of the mutation boundary on both sides of the data area are shown in Figure 6. It can be seen that the algorithm can accurately capture the rising and falling edge of the torque monitoring value. Moreover, the data fluctuations related to the dynamic load changes during the harvesting have less influence on the mutation boundary detection.
Meanwhile, the power data of all components are subjected to effective boundary detection, and the test results are shown in Table 1. The boundary extraction accuracy of the shedding data and blowing data are 100%, while that of the inside header, outside header, and feeding part are 64.3%, 71.4%, and 85.7%, respectively. The reason for the analysis is that the header and the feeding part are the front-end mechanisms in plant feeding, which have the characteristics of strong operating vibration, frequency data fluctuations, and small amplitude changes between different working conditions; the accuracy of edge detection is lower compared with the rear-end mechanism. Considering that, the time-delay model described in Formula (10) is applied to achieve data filtering for front-end mechanisms.
Then, through Grubbs Criterion anomaly detection and neighborhood interpolation, the processing results of field test data are finally obtained, as shown in Table 2.
4.2.2. Correlation Analysis Results
Correlation analysis between the monitored variables and feeding rate is performed based on the field trial data, and the correlation R is calculated by Formula (17) through the Pearson correlation coefficient [28].
where X = {x1, x2 …, xn } and Y = {y1, y2 …, yn } are the sampled data sets of the two monitored variables respectively; R is the correlation coefficient between the variable X and Y; and n is the sample set size.
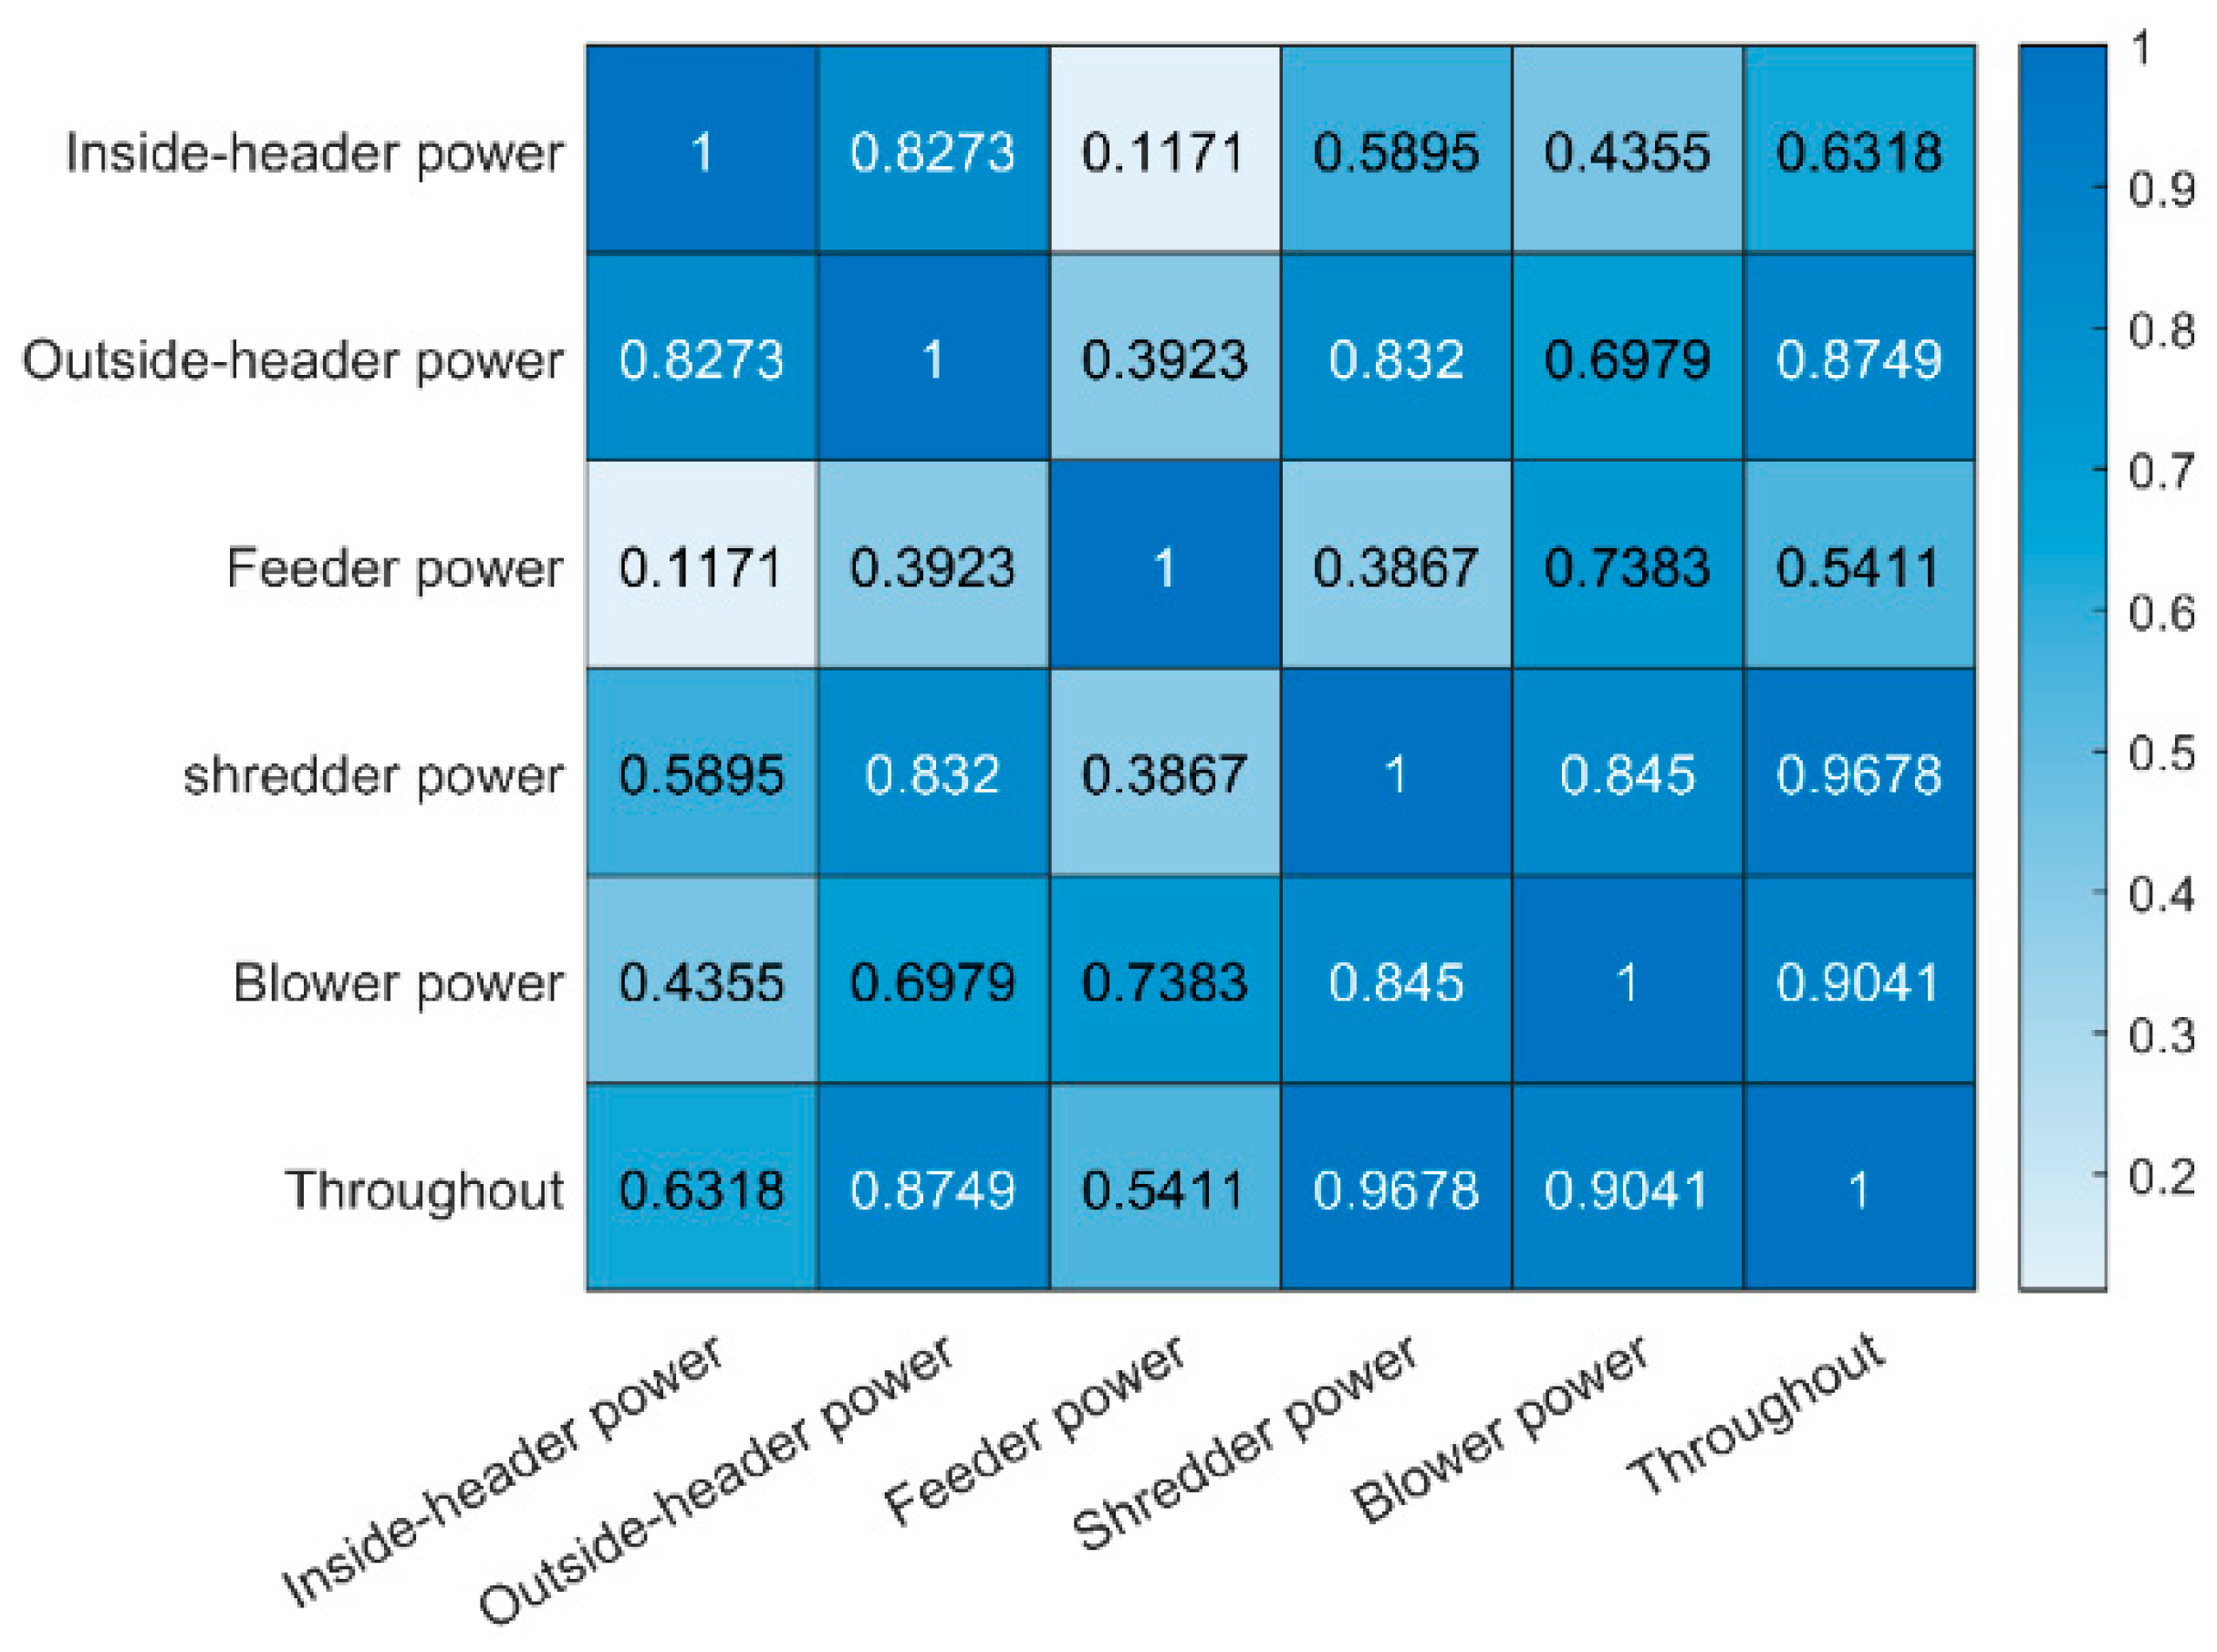
The heat map of the correlation among variables is shown in Figure 7. The results show that the influence of each operating part on the feeding rate, in descending order, is the shredding rollers, the throwing blower, the outside header, the inside header, and the hydraulic feeding part. The correlation coefficient of the outside header, the shredding rollers, and the throwing blower relative to the feeding rate is 0.87, 0.97, and 0.90, respectively. All of the above correlation coefficients are greater than 0.85, presenting a strong correlation relationship with the feeding rate. The correlation coefficient of the inside header and the feeding part relative to the feeding rate is 0.63 and 0.54, respectively, showing a weak correlation with the feeding rate.
4.2.3. Feeding Rate Measurement Results
(1) single-variable regression results
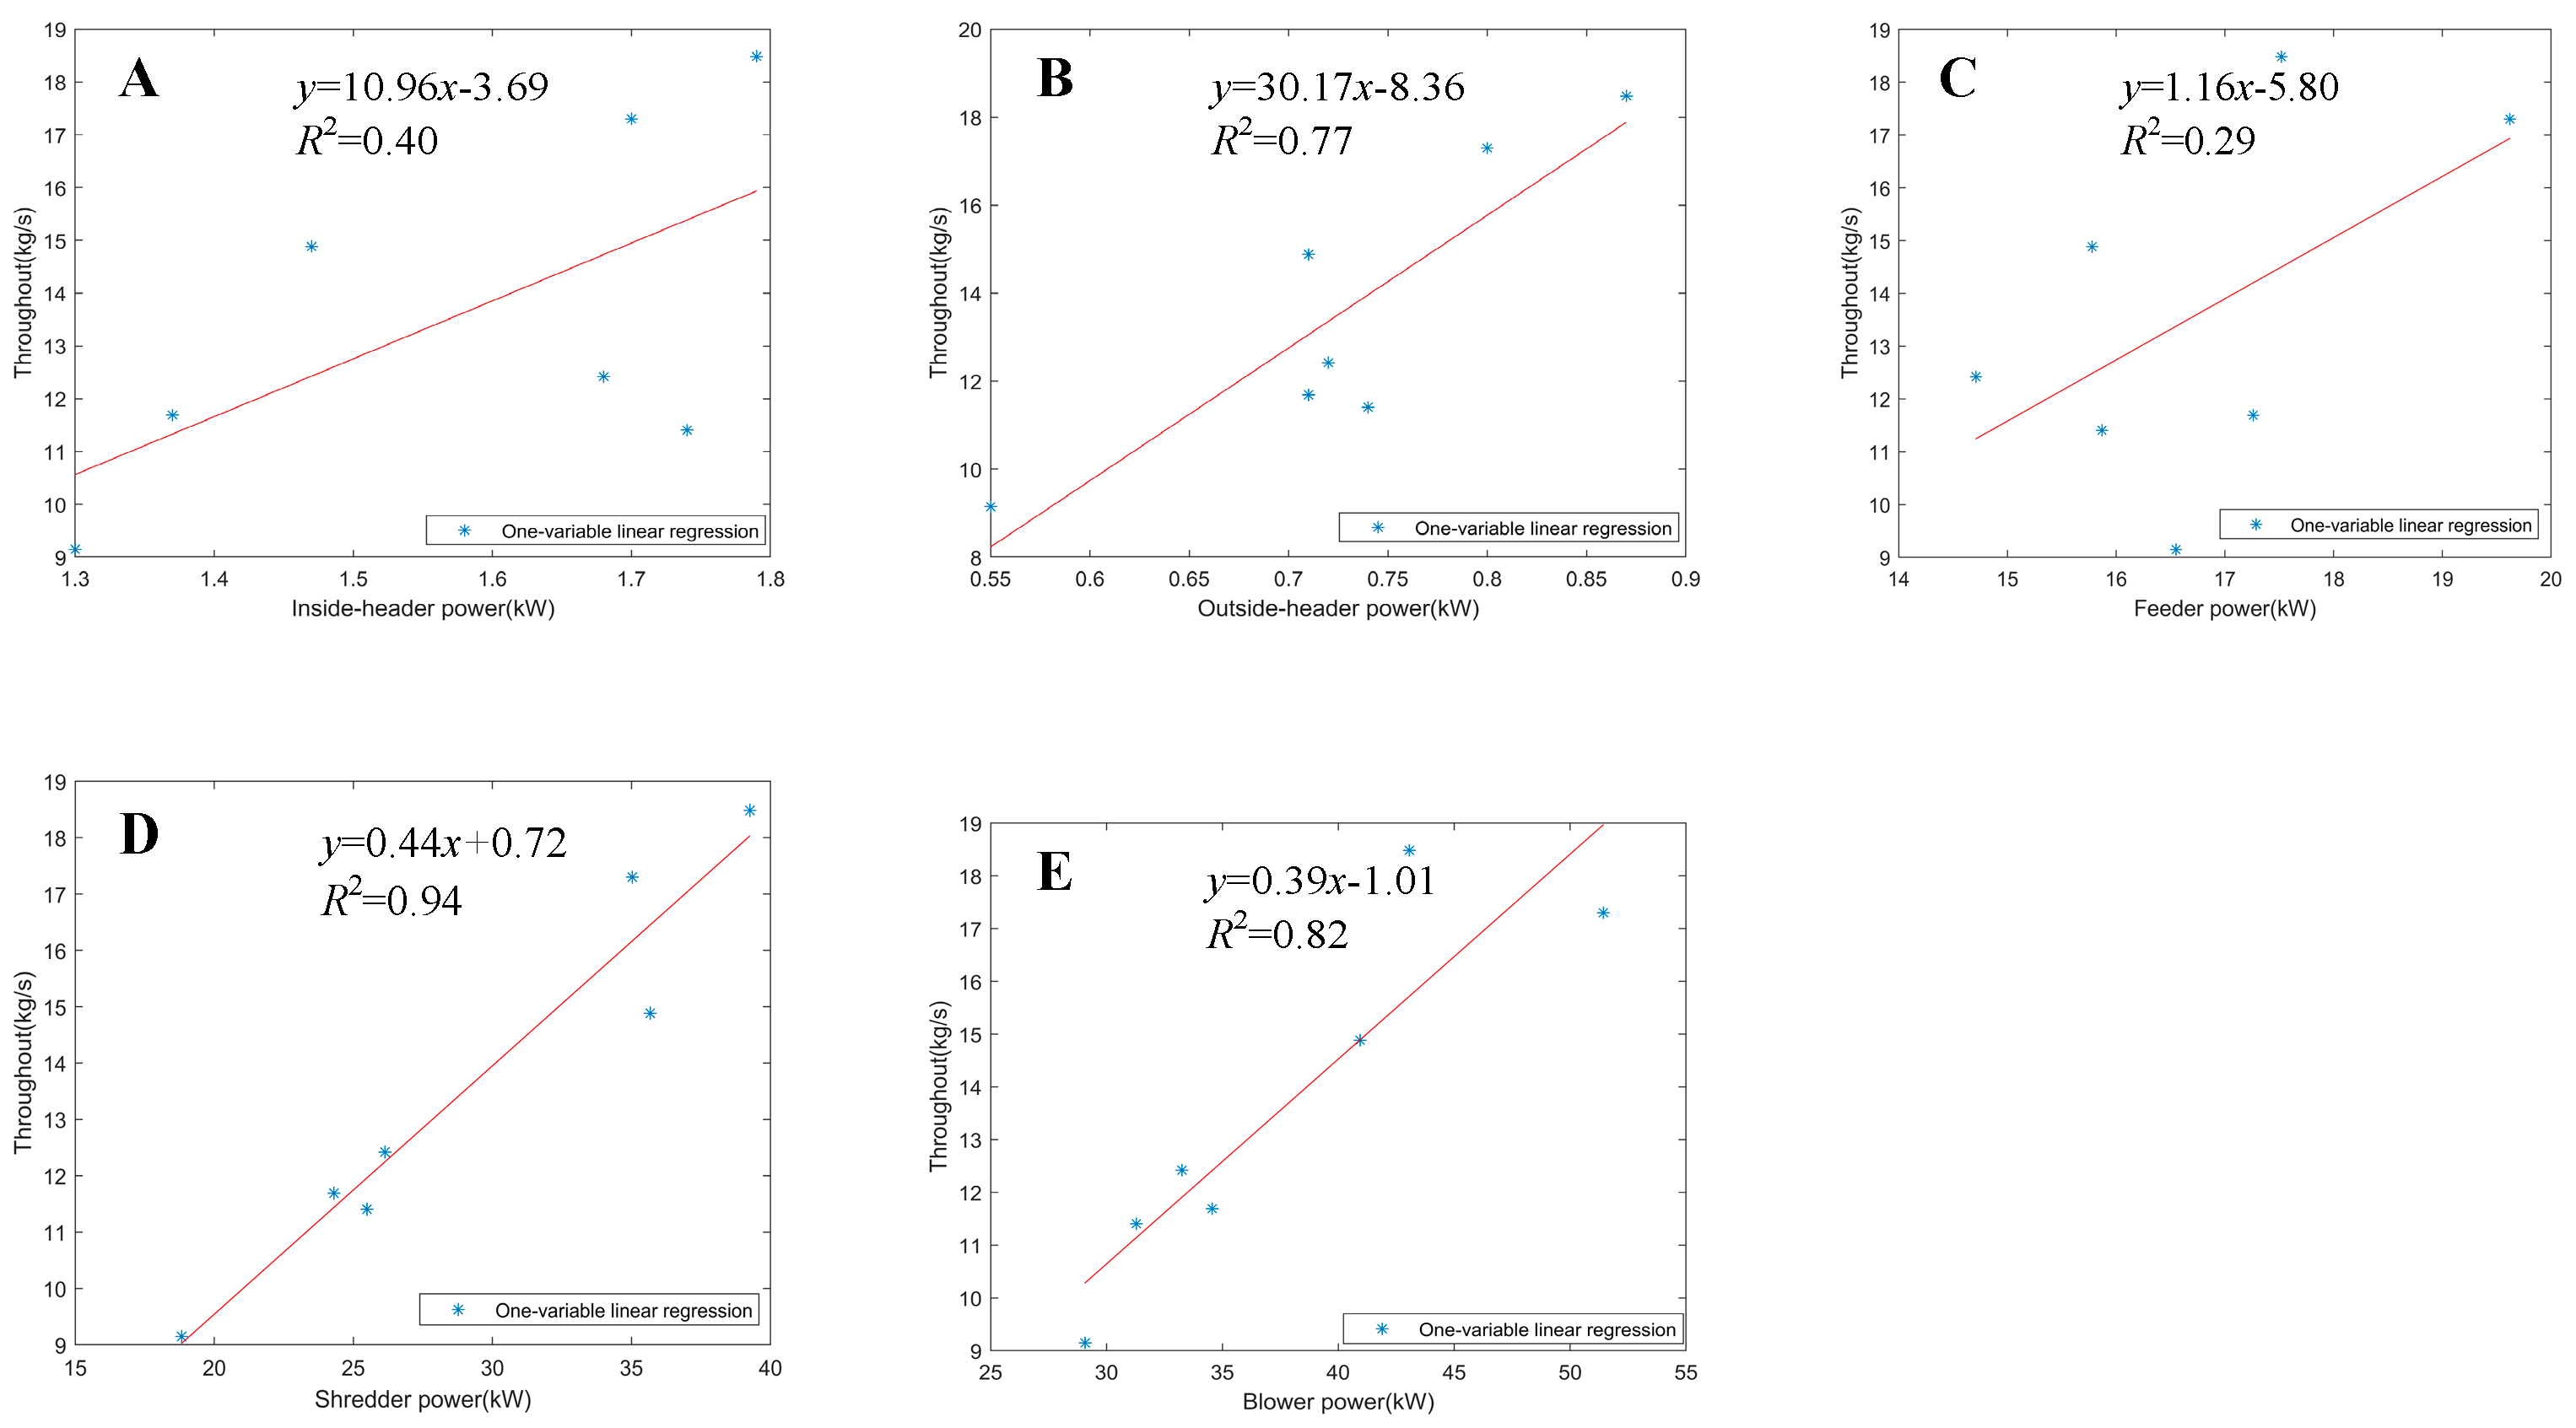
The univariate linear regression models between the feeding rate and the power data of key components in maize silage harvester are respectively established by using the single factor analysis method, and the model results are shown in Figure 8. Along with the increase in feeding rate, the power of each working part shows an increasing trend. According to the modeling performance, they are ranked into shredding roller, throwing blower, outside-header, inside-header, and hydraulic feeding part power, which are consistent with the correlation analysis results. The linear relationship between the shredding power and the feeding rate is the most significant, with a model coefficient of determination R2 of 0.94, while the coefficient of determination R2 for the feeding rate model based on the blowing power is 0.82. Therefore, if a single-factor measurement is considered, a shredding-power-based feeding rate model can achieve better detection results.
(2) multiple-variable regression results
The first three factors that affect the feeding rate, including the inside-header power, the shredding power, and the blowing power, are selected as model inputs to develop a multivariate least squares regression model for the detection of the feeding rate. The result is shown in Formula (18), where the parameter b0 is −4.0326 within the confidence interval of [−12.0817, 4.0165], the parameter b1 is 7.9867 within the confidence interval of [−8.5042, 24.4776], the parameter b2 is 0.2353 within the confidence interval [−0.0564, 0.5271], and the parameter b3 is 0.1315 within the confidence interval [−0.0817, 0.3446]. While the model coefficient of determination R2 is 0.9792, the model statistic F is 73.8684, and the significance factor P is 0.00035 (far less than 0.05). The multiple-variable model is reliable.
where p2, p4, and p5 are the power of the outside header, shredding rollers, and blower, respectively.
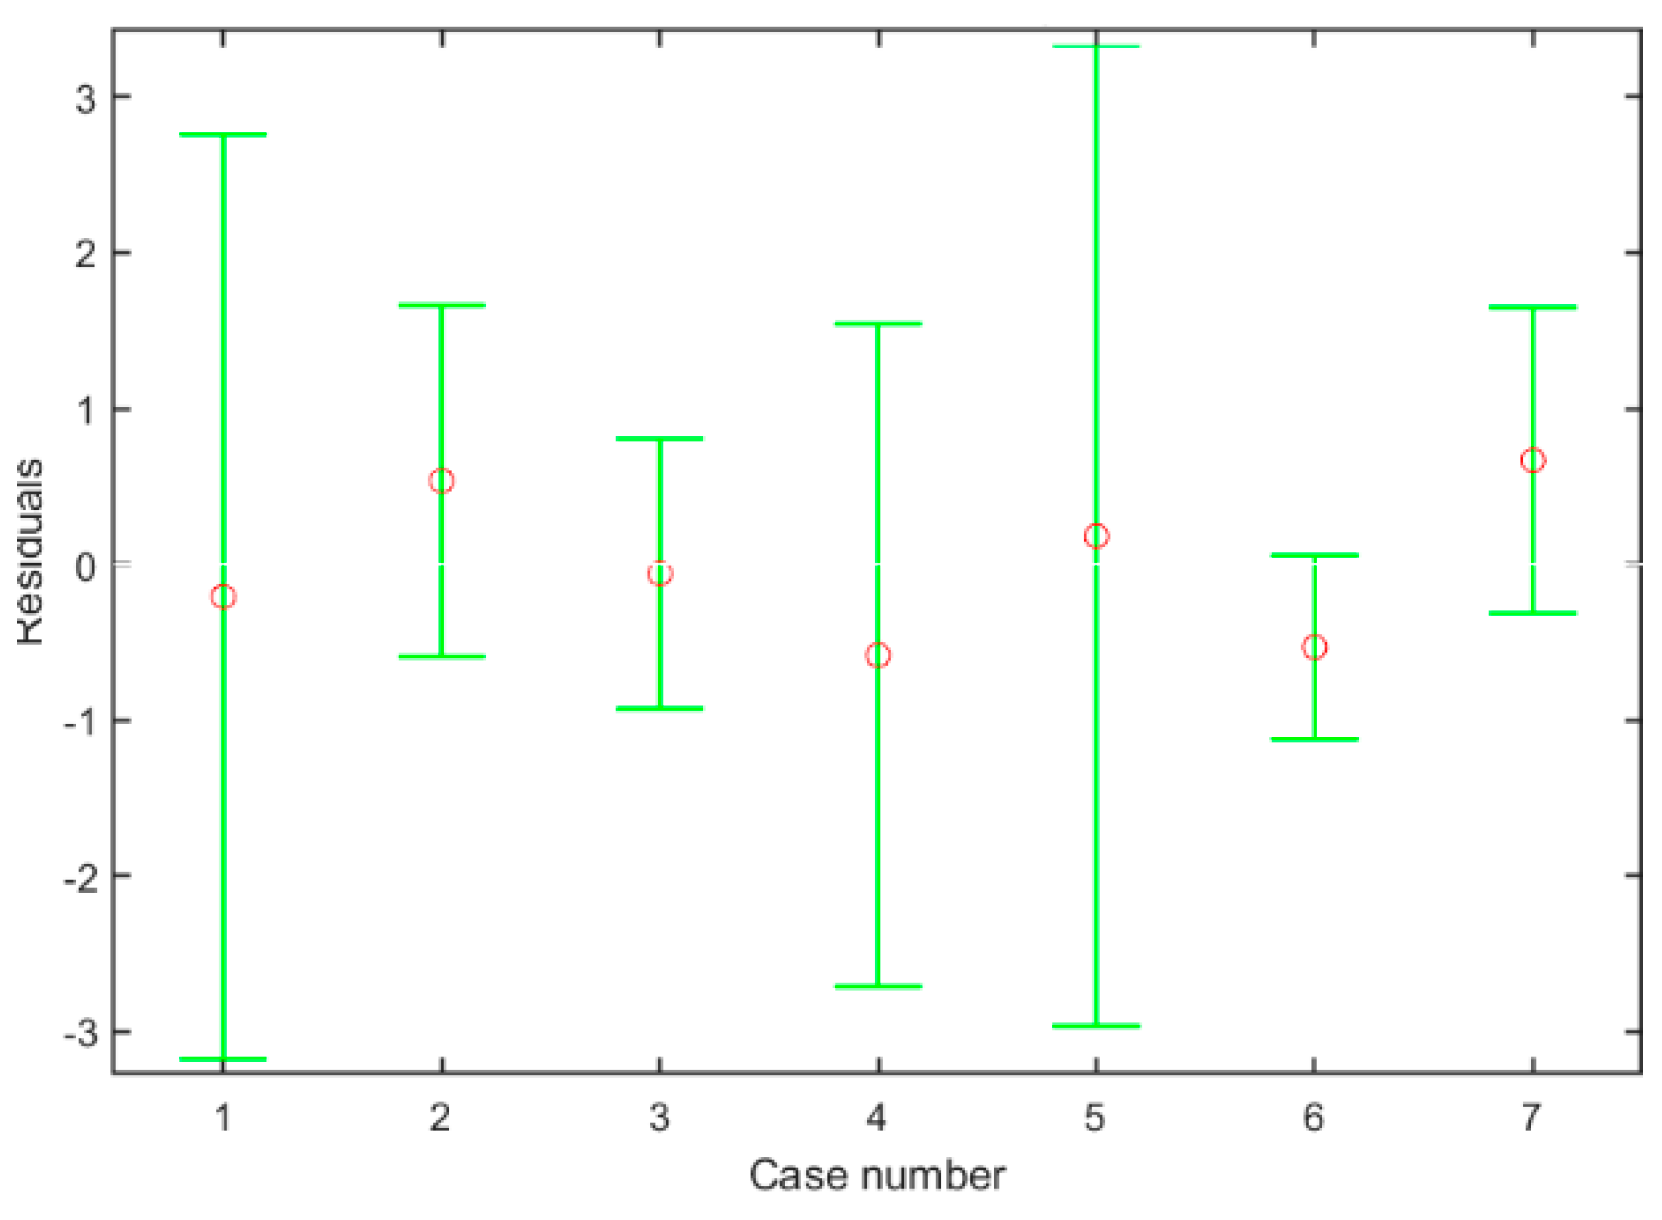
Furthermore, a residual analysis is made for the model and the results are shown in Figure 9. The residual value of the data in the samples is close to zero, while the confidence interval of the residual includes zero and there are no exceptions, indicating that the model can better fit the original data.
Meanwhile, the accuracy of the multiple regression feeding rate model is analyzed, and the results are shown in Table 3. The maximum absolute error of the model is 0.58 kg/s, and the maximum relative error is ±5.84%, which meets the requirements of the field feeding rate measurement and evaluation. Furthermore, the influence factors of feeding rate measurement accuracy are analyzed. There are primarily two aspects that contribute to the detection error. Firstly, as the compositions of maize forage plants in the machine vary, the working power of key components changes dynamically during harvesting, and the feeding rate measurement is modeled based on the average value of the power consumption, which introduces detection errors. Secondly, although the variation range in the crop moisture content during the field harvesting is slight with a range of 65%~70%, the crop moisture content has a direct influence on chopping power consumption, which is the core parameter of feeding rate detection, and thus increases the measurement error.
5. Conclusions
A feed rate measurement method based on multi-component power monitoring, effective data automatic screening, and multivariate data fusion regression was studied in this paper, and field experiments were carried out to validate the model. The conclusions are as follows:
(1) The Mann-Kendall algorithm is applied to realize the automatic boundary extraction in the condition data filtering, which is highly applicable in the shredding rollers and throwing blower with a stable load. The data screening and pre-processing for the whole condition data are then achieved effectively in combination with the material-flow time lag correction model.
(2) The Pearson correlation analysis shows that the correlation coefficients between the feeding rate and the power data of the outside header, throwing blower, and shedding roller are all higher than 0.85, indicating a strong relation, which can be used to build a multivariate fusion feeding rate model.
(3) The multivariate least squares feeding rate model is obtained with excellent significance verification results. The maximum absolute error is 0.58 kg/s, while the maximum relative error is ±5.84%.
(4) As for the feeding rate measurement means of the maize silage harvester, if a single parameter methodology is considered, it is proposed to take shredding power as the input of the model, which provides good measurement accuracy. If a multiple conditions parameter methodology is used, the model based on the fusion of cutting power, shredding power, and blowing power can achieve a better detection result. Furthermore, there is still much room for the improvement of model accuracy and robustness by integrating crop characteristics.
Author Contributions
Conceptualization, B.Z. and Y.L.; methodology, F.W. and H.J.; software, F.W. and Y.L.; validation, F.W. and Y.J.; formal analysis, Y.J.; investigation, J.W.; resources, W.M.; writing—original draft preparation, F.W.; writing—review and editing, F.W., B.Z., Y.L. and W.M.; visualization, H.J. and J.W.; supervision, Y.J.; project administration, W.M.; funding acquisition, B.Z. and W.M. All authors have read and agreed to the published version of the manuscript.
Funding
This research is supported by the National Key Research and Development China Project (2020YFB1709603).
Institutional Review Board Statement
Not applicable.
Data Availability Statement
The original data supporting the study in this article are included in the article; further inquiries can be directed to the corresponding author.
Acknowledgments
The authors thank Shandong Wuzheng Group Co., Ltd. and the Experimental Base of Chinese Academy of Agricultural Mechanization Sciences Group Co., Ltd. for providing the experimental equipment.
Conflicts of Interest
The authors declare that the research was conducted in the absence of any commercial or financial relationships that could be construed as a potential conflict of interest.
References
- Santos, A.P.M.d.; Santos, E.M.; Araújo, G.G.L.d.; Oliveira, J.S.d.; Zanine, A.d.M.; Pinho, R.M.A.; Cruz, G.F.d.L.; Ferreira, D.d.J.; Perazzo, A.F.; Pereira, D.M.; et al. Effect of Inoculation with Preactivated Lactobacillus Buchneri and Urea on Fermentative Profile, Aerobic Stability and Nutritive Value in Corn Silage. Agriculture 2020, 10, 335. [Google Scholar] [CrossRef]
- Zhou, X.; Xu, X.; Zhang, J.; Wang, L.; Wang, D.; Zhang, P. Fault diagnosis of silage harvester based on a modified random forest. Inf. Process. Agric. 2022. [Google Scholar] [CrossRef]
- Stellmach, S.; Braun, L.M.; Wächter, M.; Esderts, A.; Diekhaus, S. On load assumptions for self-propelled forage harvesters. Int. J. Fatigue 2021, 147, 106114. [Google Scholar] [CrossRef]
- Kayad, A.; Paraforos, D.S.; Marinello, F.; Fountas, S. Latest Advances in Sensor Applications in Agriculture. Agriculture 2020, 10, 362. [Google Scholar] [CrossRef]
- Dale Maughan, J.; K Mathanker, S.; E Grift, T.; Christopher Hansen, A. Yield Monitoring and Mapping Systems for Hay and Forage Harvesting: A Review; American Society of Agricultural and Biological Engineers: St. Joseph, MI, USA, 2012. [Google Scholar]
- Mohsenimanesh, A.; Nieuwenhof, P.; Necsulescu, D.-S.; Laguë, C. Monitoring a Hydraulically-Driven Feed Roll System with Sensors on aPrototype Pull-Type Forage Harvester. Appl. Eng. Agric. 2017, 33, 23–30. [Google Scholar] [CrossRef]
- Ferraretto, L.F.; Shaver, R.D.; Luck, B.D. Silage review: Recent advances and future technologies for whole-plant and fractionated corn silage harvesting. J. Dairy Sci. 2018, 101, 3937–3951. [Google Scholar] [CrossRef]
- Kumhala, F.; Prosek, V.; Kroulik, M. Capacitive sensor for chopped maize throughput measurement. Comput. Electron. Agric. 2010, 70, 234–238. [Google Scholar] [CrossRef]
- Maharlouie, M.M.; Kamgar, S.; Loghavi, M. Field evaluation and comparison of two silage corn mass flow rate sensors developed for yield monitoring. Int. J. Agric. 2013, 3, 730. [Google Scholar]
- Lisowski, A.; Klonowski, J.; Sypuła, M.; Chlebowski, J.; Kostyra, K.; Nowakowski, T.; Strużyk, A.; Świętochowski, A.; Dąbrowska, M.; Mieszkalski, L.; et al. Energy of feeding and chopping of biomass processing in the working units of forage harvester and energy balance of methane production from selected energy plants species. Biomass Bioenergy 2019, 128, 105301. [Google Scholar] [CrossRef]
- Chengxiao, F.; Zhigang, L.; YanWei, Y.; Bo, Z.; Yangchun, L.; Liming, Z. on-line detection of mass flow rate of self-propelled corn silage harvester based on capacitance method. J. Chin. Agric. Mech. 2020, 41, 137–142. [Google Scholar] [CrossRef]
- Shenghua, Z.; Guozhong, Z.; Shijie, Z.; Jianwei, F.; Gan, X.; Anwer, M. Designing a Real-time Feed Measurement System for Horizontal Axial Flow Threshing Drum Based on Thin Film Sensor. J. Huazhong Agric. Univ. 2020, 39, 160–169. [Google Scholar] [CrossRef]
- Sun, Y.; Liu, R.; Zhang, M.; Li, M.; Zhang, Z.; Li, H. Design of feed rate monitoring system and estimation method for yield distribution information on combine harvester. Comput. Electron. Agric. 2022, 201, 107322. [Google Scholar] [CrossRef]
- Zhang, Y.; Yin, Y.; Meng, Z.; Chen, D.; Qin, W.; Wang, Q.; Dai, D. Development and testing of a grain combine harvester throughput monitoring system. Comput. Electron. Agric. 2022, 200, 107253. [Google Scholar] [CrossRef]
- Lin, J. Mathematical Model for Improved Mass Flow Estimation in the Feeder Housing of a Forage Harvester. Master’s Thesis, University of Illinois at Urbana-Champaign, Urbana, IL, USA, 2012. [Google Scholar]
- Yingshuai, J. Development of Intelligent Silage Monitoring System and Silage Operation Device. Master’s Thesis, University of Jinan, Jinan, China, 2020. [Google Scholar]
- Siebald, H.; Hensel, O.; Beneke, F.; Merbach, L.; Walther, C.; Kirchner, S.M.; Huster, J. Real-time acoustic monitoring of cutting blade sharpness in agricultural machinery. IEEE/ASME Trans. Mechatron. 2017, 22, 2411–2419. [Google Scholar] [CrossRef]
- Worek, F.; Thurner, S. Yield measurement of wilted forage and silage maize with forage harvesters. In Precision Agriculture’21; Wageningen Academic Publishers: Wageningen, The Netherlands, 2021; pp. 628–637. [Google Scholar]
- Yawei, Z. Mechanisms and Control Strategies Research on Threshing and Seperaing Quility of Combine Harvester. Ph.D. Thesis, China Agricultural University, Beijing, China, 2018. [Google Scholar]
- Pallottino, F.; Antonucci, F.; Costa, C.; Bisaglia, C.; Figorilli, S.; Menesatti, P. Optoelectronic proximal sensing vehicle-mounted technologies in precision agriculture: A review. Comput. Electron. Agric. 2019, 162, 859–873. [Google Scholar] [CrossRef]
- Chen, X.; Li, Y.; Yao, N.; Liu, D.L.; Javed, T.; Liu, C.; Liu, F. Impacts of multi-timescale SPEI and SMDI variations on winter wheat yields. Agric. Syst. 2020, 185, 102955. [Google Scholar] [CrossRef]
- Li, J.; He, S.; Wang, J.; Ma, W.; Ye, H. Investigating the spatiotemporal changes and driving factors of nighttime light patterns in RCEP Countries based on remote sensed satellite images. J. Clean. Prod. 2022, 359, 131944. [Google Scholar] [CrossRef]
- Chen, Z.; Xu, K.; Wei, J.; Dong, G. Voltage fault detection for lithium-ion battery pack using local outlier factor. Measurement 2019, 146, 544–556. [Google Scholar] [CrossRef]
- Torres, A.B.B.; da Rocha, A.R.; Coelho da Silva, T.L.; de Souza, J.N.; Gondim, R.S. Multilevel data fusion for the internet of things in smart agriculture. Comput. Electron. Agric. 2020, 171, 105309. [Google Scholar] [CrossRef]
- Xiong, Y.; WU, X. The Generalizing Application of Four Judging Criterions for Gross Errors. Phys. Exp. Coll. 2010, 23, 66–68. [Google Scholar] [CrossRef]
- Zhenqian, Z.; Cheng, P.; Yifan, S.; Renjie, L.; Man, Z.; Han, L. Signal Analysis and Processing of Combine Harvester Feedrate Monitoring System. Trans. Chin. Soc. Agric. Mach. 2019, 50, 73–78. [Google Scholar]
- Choi, J.-H.; Park, S.H.; Jung, D.-H.; Park, Y.J.; Yang, J.-S.; Park, J.-E.; Lee, H.; Kim, S.M. Hyperspectral Imaging-Based Multiple Predicting Models for Functional Component Contents in Brassica juncea. Agriculture 2022, 12, 1515. [Google Scholar] [CrossRef]
- Djordjević, B.; Mane, A.S.; Krmac, E. Analysis of dependency and importance of key indicators for railway sustainability monitoring: A new integrated approach with DEA and Pearson correlation. Res. Transp. Bus. Manag. 2021, 41, 100650. [Google Scholar] [CrossRef]
Figure 1.
Physical view of header power sensor. 1: power sensor of inside shaft 2: T-type drive shaft 3: power sensor of outside shaft.
Figure 1.
Physical view of header power sensor. 1: power sensor of inside shaft 2: T-type drive shaft 3: power sensor of outside shaft.

Figure 2.
Physical view of shredding power sensor. 1: elastic pulley; 2: mounting base; 3: torque sensor; 4: speed sensor.
Figure 2.
Physical view of shredding power sensor. 1: elastic pulley; 2: mounting base; 3: torque sensor; 4: speed sensor.

Figure 3.
Physical view of blowing power sensor. 1: elastic pulley; 2: velocimetric panel; 3: mounting base; 4: torque sensor; 5: speed sensor.
Figure 3.
Physical view of blowing power sensor. 1: elastic pulley; 2: velocimetric panel; 3: mounting base; 4: torque sensor; 5: speed sensor.

Figure 4.
Time lag analysis of silage flow in the harvester. 1: header; 2: conveying roller; 3: feeding rollers; 4: shedding rollers; 5: self-sharpening unit; 6: self-sharpening unit; 7: kernel-processing unit.
Figure 4.
Time lag analysis of silage flow in the harvester. 1: header; 2: conveying roller; 3: feeding rollers; 4: shedding rollers; 5: self-sharpening unit; 6: self-sharpening unit; 7: kernel-processing unit.

Figure 5.
The experiment process of harvesting in the field(where R1, R2, …, and Rn are harvesting crop rows); (A) Grouping schematic; (B) Picture of the field test.
Figure 5.
The experiment process of harvesting in the field(where R1, R2, …, and Rn are harvesting crop rows); (A) Grouping schematic; (B) Picture of the field test.

Figure 6.
Results of data filtering; (A) The rising boundary of the shredding data; (B) The descending boundary of the shredding data; (C) The rising boundary of the blowing data; (D) The descending boundary of the blowing data.
Figure 6.
Results of data filtering; (A) The rising boundary of the shredding data; (B) The descending boundary of the shredding data; (C) The rising boundary of the blowing data; (D) The descending boundary of the blowing data.

Figure 7.
Heatmap of the variable correlation coefficient.

Figure 8.
Results of the single-variable regression model; (A) The model between inside-header power and feeding rate; (B) The model between outside-header power and feeding rate; (C) The model between feeding power and feeding rate; (D) The model between shredding power and feeding rate; (E) The model between blowing power and feeding rate.

Figure 9.
The plot of residual case order.


Table 1.
Results of boundary detection for data filtering.
| Part Name | Rising Detection (Number) | Descending Detection (Number) | Accuracy Rate (%) | ||
|---|---|---|---|---|---|
| Real | Detected | Real | Detected | ||
| Inside header | 7 | 5 | 7 | 4 | 64.3 |
| Outside header | 7 | 5 | 7 | 5 | 71.4 |
| Feeding part | 7 | 6 | 7 | 6 | 85.7 |
| Shredding rollers | 7 | 7 | 7 | 7 | 100 |
| Throwing blower | 7 | 7 | 7 | 7 | 100 |
Table 2.
Pre-processed data of field harvesting.
| Group No. | Velocity /m·s−1 | Feeding Rate /kg·s−1 | Inside Header Power/kW | Outside Header Power/kW | Feeding Power /kW | Shredding Power /kW | Throwing Blower /kW |
|---|---|---|---|---|---|---|---|
| 1 | 2.38 | 11.69 | 1.37 | 0.71 | 17.26 | 24.3 | 34.56 |
| 2 | 1.70 | 9.15 | 1.3 | 0.55 | 16.55 | 18.83 | 29.07 |
| 3 | 3.06 | 17.30 | 1.7 | 0.8 | 19.62 | 35.03 | 51.43 |
| 4 | 2.04 | 11.41 | 1.74 | 0.74 | 15.87 | 25.49 | 31.29 |
| 5 | 2.23 | 12.42 | 1.68 | 0.72 | 14.71 | 26.14 | 33.25 |
| 6 | 2.50 | 14.88 | 1.47 | 0.71 | 15.78 | 35.67 | 40.94 |
| 7 | 3.29 | 18.48 | 1.79 | 0.87 | 17.52 | 39.26 | 43.06 |
Table 3.
Results of the multi-variable regression model error analysis.
| Group No. | Actual Feeding Rate /kg·s−1 | Detected Feeding Rate /kg·s−1 | Absolute Error /kg·s−1 | Relative Error /% |
|---|---|---|---|---|
| 1 | 9.15 | 8.61 | −0.53 | −5.84 |
| 2 | 11.41 | 11.99 | 0.58 | 5.12 |
| 3 | 11.69 | 11.90 | 0.21 | 1.79 |
| 4 | 12.42 | 12.24 | −0.18 | −1.45 |
| 5 | 14.88 | 15.41 | 0.53 | 3.58 |
| 6 | 17.30 | 17.36 | 0.06 | 0.36 |
| 7 | 18.48 | 17.82 | −0.67 | −3.60 |
Disclaimer/Publisher’s Note: The statements, opinions and data contained in all publications are solely those of the individual author(s) and contributor(s) and not of MDPI and/or the editor(s). MDPI and/or the editor(s) disclaim responsibility for any injury to people or property resulting from any ideas, methods, instructions or products referred to in the content. |
© 2023 by the authors. Licensee MDPI, Basel, Switzerland. This article is an open access article distributed under the terms and conditions of the Creative Commons Attribution (CC BY) license (https://creativecommons.org/licenses/by/4.0/).
Share and Cite
MDPI and ACS Style
Wang, F.; Wang, J.; Ji, Y.; Zhao, B.; Liu, Y.; Jiang, H.; Mao, W. Research on the Measurement Method of Feeding Rate in Silage Harvester Based on Components Power Data. Agriculture 2023, 13, 391. https://doi.org/10.3390/agriculture13020391
AMA Style
Wang F, Wang J, Ji Y, Zhao B, Liu Y, Jiang H, Mao W. Research on the Measurement Method of Feeding Rate in Silage Harvester Based on Components Power Data. Agriculture. 2023; 13(2):391. https://doi.org/10.3390/agriculture13020391
Chicago/Turabian StyleWang, Fengzhu, Jizhong Wang, Yuxi Ji, Bo Zhao, Yangchun Liu, Hanlu Jiang, and Wenhua Mao. 2023. "Research on the Measurement Method of Feeding Rate in Silage Harvester Based on Components Power Data" Agriculture 13, no. 2: 391. https://doi.org/10.3390/agriculture13020391
Note that from the first issue of 2016, this journal uses article numbers instead of page numbers. See further details here.