1. Introduction
Brazil is the world’s largest coffee producer, and it is responsible for one-third of world production [
1]. Most of the national production of Arabica coffee is in the state of Minas Gerais, which is responsible for about 70% of the country’s production [
2]. In this context, coffee farming is an important economic activity for agribusiness and small farmers in Minas Gerais and, consequently, also for Brazil. However, one of the factors that can negatively affect coffee production is pest attacks that occur during coffee production. Therefore, measures that can contribute to monitoring pest development are of fundamental importance.
The coffee leaf miner
Leucopetra coffeella (Lepitoptera: Lyonetiidae) is the main pest of Arabica coffee in Brazil [
3]. The pest has a widespread occurrence in Minas Gerais and attacks the leaves of the coffee plant, causing necrosis and defoliation of up to 75% and losses in production that can exceed 50% [
4,
5]. Crops that are severely defoliated in the drought as a consequence of coffee leaf miner infestation take about two years to recover [
6] and can cause hundreds of millions of dollars in losses [
7]. The increase in coffee leaf miner infestation is associated with several factors, such as indiscriminate use of insecticides, the presence of extensive crops or large areas of continuous monoculture planting, coffee planting in larger spacings, high temperature, prolonged dry periods, and low relative humidity, as well as the absence of natural enemies due to lack of resources in monocultures [
6,
8]. Its most serious occurrence is associated with higher temperatures [
9] and the driest period of the year [
5]. In Minas Gerais, the increase in infestation starts in July/August, with a peak in October [
10].
Monitoring the coffee crop is an important practice for crop phytosanitary management, as it allows the producer to know when there is an infestation of coffee leaf miner and makes it possible to decide whether or not to carry out the control measures. Alternative, efficient, and low-cost methods that can monitor large areas with an infestation of pests and diseases in crops have been gaining prominence with the use of remote sensing [
11,
12,
13]. Such methods are based on the different spectral responses between a healthy plant and one with a pest or disease [
14]. These spectral responses may, for example, be due to changes in morphology, leaf color, chlorosis, and necrosis. For the analysis of the spectral response over time, it is necessary to select and process a large number of images, which is often time-consuming. Therefore, it was necessary to create platforms that would allow these analyses to be streamlined.
For the processing of a large amount of geospatial data (geo-big data), some platforms have emerged. Such platforms include Amazon Web Services (AWS), which was launched in 2006, and Microsoft Corporation’s Azure platform, which was launched in 2010; both of these platforms are paid [
15]. In 2010, Google launched the free cloud computing platform (Google Earth Engine—GEE) that allows quick access and processing of various sets of remote sensing data. The GEE provides access to a global remote sensing database spanning four decades and receives around 4000 new datasets daily in its database [
16]. This amount of data allows the temporal analysis of the coffee crop in any region of the world, and among the databases that are available in the GEE is the collection of Sentinel satellites; machine learning algorithms (M.L.) are among the available tools [
15]. Several studies have used the GEE for fast, regional, and accurate monitoring, e.g., the mapping of infestation by
Spodoptera frugiperda in maize [
17], the analysis of Fulsarium in the culture of wheat [
11], and the evaluation of the impacts of chilling injury on soybean [
18].
Sentinel-2 was released in 2015 and features an MSI multispectral sensor with 13 spectral bands. The visible (RGB) and Infrared (NIR) bands have a spatial resolution of 10 m and a revisit period of about 5 days [
19]. Thus, monitoring can be carried out in short periods and with precision at the level of small rural properties. The M.L. can be defined as a branch of artificial intelligence that considers that the system can learn from data, detect patterns, and make decisions with minimal human intervention [
20]. In recent years, M.L. has gained prominence as an important tool in remote sensing and precision agriculture and has been used to assist in the identification of diseases and pests [
11,
21,
22].
Several studies have been conducted using vegetation indices to detect pest/disease in different crops. Using the NDVI time series, images from Sentinel and the GEE, it was possible to monitor the infestation of Fall Armyworm (
Spodoptera frugiperda) in corn [
17]. Twenty vegetation indices found in the literature were used to evaluate the infestation of
Spodoptera frugiperda in the sorghum crop, with the NDVI and LAI (Leaf Area Index) being the vegetation indices that presented the best performances to identify the infestation [
12]. In another study, 63 vegetation indices associated with machine learning algorithms based on decision trees were used to assess coffee rust infestation [
23]. Spectral reflectance analysis has also been considered to identify pest/disease. Using machine learning algorithms and Satellite Sentinel images, it was possible to separate areas of cotton under attack by
Spodoptera frugiperda by considering the spectral reflectance [
13]. Nine vegetative indices were evaluated to identify the damage caused by frost in coffee plantation areas, with the NDVI being the index that presented the best results for identifying and evaluating frost damage in coffee plants [
24]. Few studies have proposed the creation of specific vegetation indices for a given pest/disease, e.g., a new vegetation index for discriminating yellow-rust-infected winter wheat [
22]. Another index was created to detect Wheat Fusarium Head Blight Using Sentinel-2 Multispectral Imagery [
11].
Vegetation indices common in the literature are not crop or pest/disease specific and cannot, by themselves, discriminate crop-specific parameters. Therefore, it would be important to create specific indices to identify coffee leaf miner infestation. There is no specific vegetative index in the literature to identify leaf miner infestation.
The present work aimed to select the combination of two Sentinel-2 bands to identify the levels of coffee leaf miner infestation in coffee crops; develop a new index to estimate coffee leaf miner infestation in coffee crops; and map the coffee leaf miner attack infestation in coffee crops using Sentinel-2 images through the Google Earth Engine platform.
2. Materials and Methods
2.1. Study Area
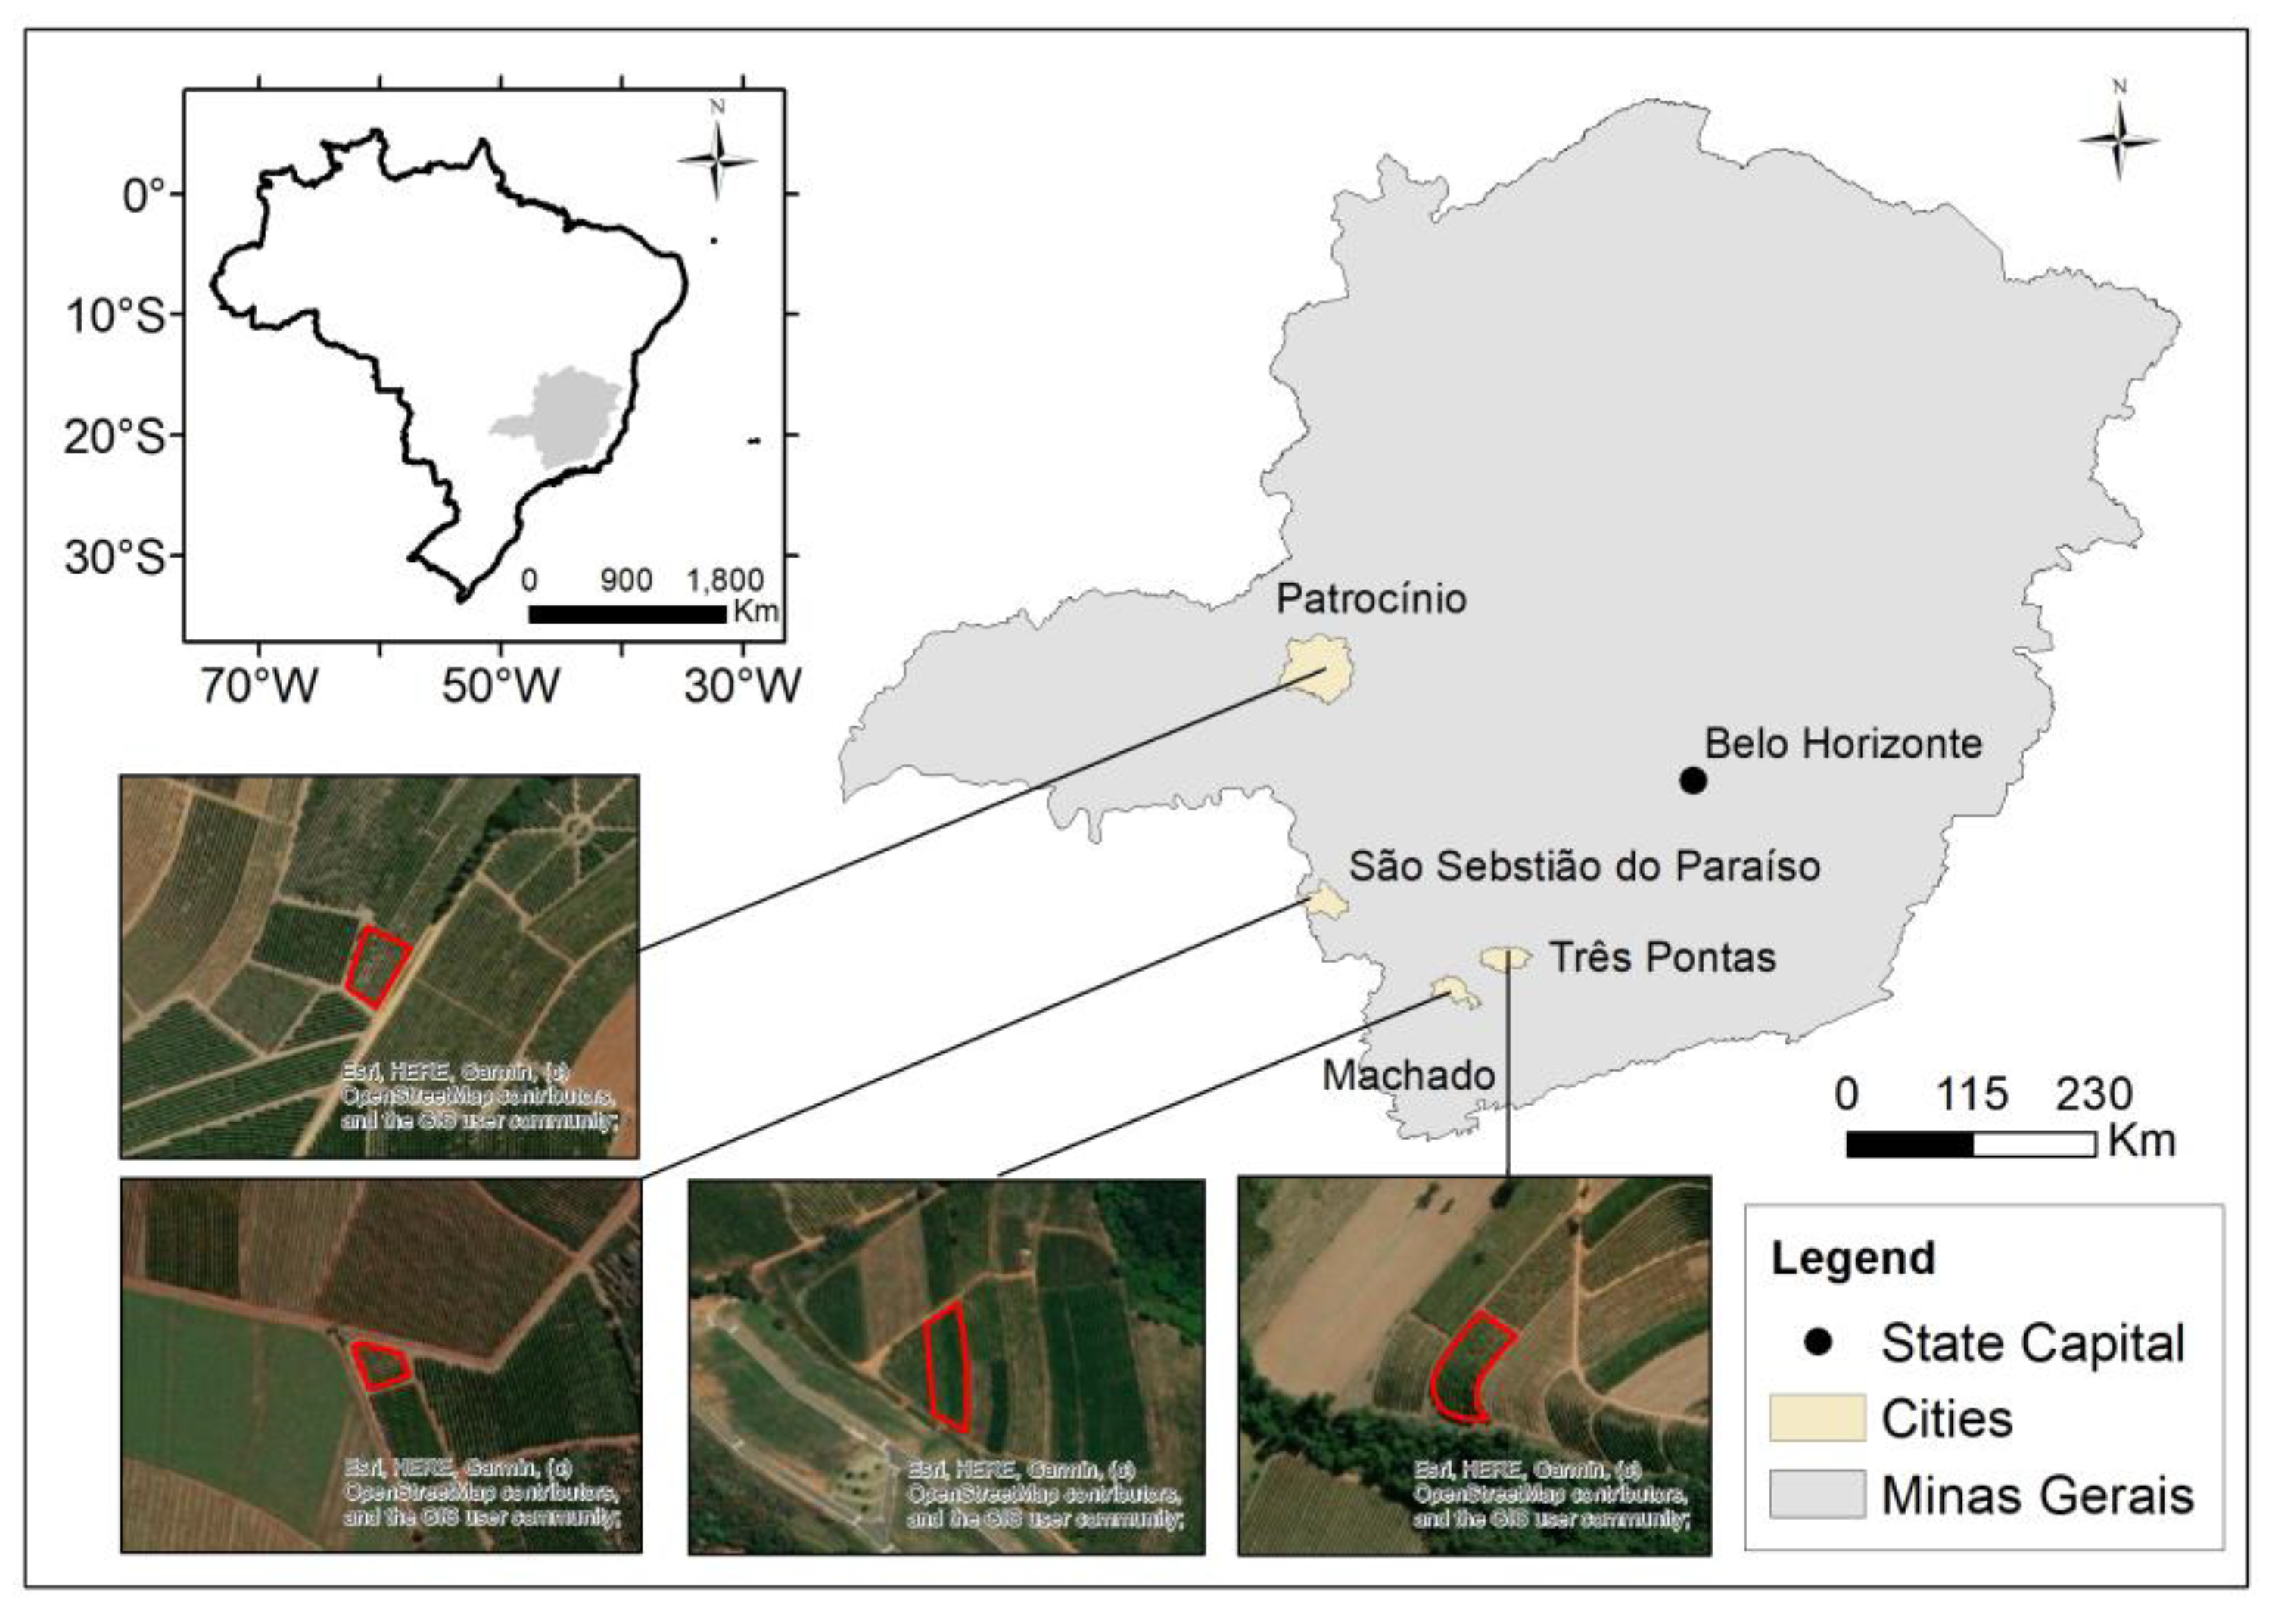
The study was carried out at the Experimental Research Stations of Agriculture and Livestock Research Enterprise of Minas Gerais (Epamig), which are located in the cities of Três Pontas (CETP), São Sebastião do Paraíso (CESP), Machado (CEMA), and Patrocínio (CETP), in the state of Minas Gerais (
Figure 1).
The coffee cultivars and edaphoclimatic characteristics of the experimental research station for the years 2019 to 2021 are described in
Table 1, with precipitation data obtained from the Climate Hazards Group InfraRed Precipitation with Stations (CHIRPS) database [
25] and the temperature data obtained from the database of the Latest Climate Reanalysis Produced by ECMWF/Copernicus Climate Change Service—ERA 5 [
26].
In each experimental research station, a plot with the following areas was selected: CETP (2575 m
2); CESP (930 m
2); CEMA (2279 m
2); and CEPC (1609 m
2). Although the spatial resolution of the Sentinel-2A satellite is 10 m for bands 2, 3, 4, and 8 and 20 m for bands 5, 6, and 7, the plot areas were enough to meet the resolution of Sentinel-2A (
Table 2).
2.2. Data Collect
The first step of the present work was the monthly monitoring of the coffee leaf miner infestation estimate (CLMIE) between January 2019 and December 2021. For the monitoring, leaves were randomly collected from 50 plants per plot. In each plant, from the leaves of the 3rd or 4th pair of two branches, on opposite sides, we collected four distal leaves located in the middle plant strata until the sample collection reached 200 leaves per plot. Only leaves with intact mines were considered for the miner count. We kept the coffee leaves in paper bags and later examined them in the laboratory to assess the active mines (infestation). We calculated the coffee leaf miner (CLM) infestation rate using the following formula:
The second step was the selection of the months with the highest incidence of CLMIE. Then, the selection of Sentinel-2 multispectral images (
Table 2) was carried out in three periods—i.e., on 2 September 2019, between 26 and 28 September 2020, and from September 20 to 21, 2021—to obtain the reflectance of bands in the coffee crop area from coffee leaf miner infestation. Coastal aerosol (B1), Near-Infrared (NIRn) (B8a), Water vapor (B9), Shortwave Infrared/cirrus (B10), Shortwave Infrared 1 (SWIR1) (B11), and Shortwave Infrared 2 (SWIR2) bands (B12) were not considered in the present study, as they were not part of the vegetation indices used in this study.
2.3. Vegetation Indices
The geoprocessing steps and the calculation of the vegetation indices were carried out on the Google Earth Engine cloud processing platform through the development of a script in the JavaScript programming language. Using the geographical coordinates of the experimental research stations (
Table 1), satellite images of the study areas for the months from 2019 to 2021 were obtained. Thus, with the spectral reflectance information available in the images, it is possible to obtain the average value of each one of the vegetation indices in each of the experimental research stations could be obtained.
Based on the spectral reflectance values of Sentinel satellite images obtained for September 2020 and 2021, in coffee crops with and without coffee leaf miner infestation, two basic vegetation indices were adopted, according to the methodology described by Liu et al. [
11], i.e., difference vegetation index (DVI) [
27] and ratio vegetation index (RVI) [
28], as well as modifications of these two indices. These indices allowed us to assess which spectral bands are more sensitive to indicate infestation with coffee leaf miner.
Regression equations based on the variables vegetation indices and coffee leaf miner infestation were then developed. Through the regression equations, the spectral bands that best indicated the coffee leaf miner infestation in coffee crop areas were selected and then compared using statistical performance criteria (determination coefficient—R2, root mean square error—RMSE). The same statistical criteria (RMSE and R2) were used later to compare some vegetation indices described in the literature with the new index.
2.4. The New Index—CLMI
From the selected spectral bands, a new vegetation index called Coffee-Leaf-Miner Index (CLMI) was generated to estimate coffee leaf miner infestation. The CLMI was based on the area covered by a triangle, as per the methodology described by [
11]. To calculate the area of the triangle, a matrix formed by the reflectance values of the selected bands and the respective central wavelengths of these bands was generated. The area of the triangle was calculated by dividing the determinant of the matrix (Equation (1)).
In this study, in addition to the new index, ten other relevant vegetation indices from the literature were selected (
Table 3), and these were calculated through the spectral reflectance values of the Sentinel-2 satellite images. All 10 indices were compared with the CLMI to assess the coffee leaf miner infestation in coffee crops, through statistical performance criteria (R
2 and RMSE) considering the month of September from the years 2019 to 2021. Based on the results found for September, the 3 indices that presented the best performers (higher R
2 and lower RMSE) were compared to CLMI based on October data. All statistical analyses were performed using R 4.2.1 software (R Development Core Team, 2022) [
29].
2.5. Index Test (CLMI) for Mapping Coffee Leaf Miner Infestation
The mapping step was carried out on the Google Earth Engine platform through the development of a script in the JavaScript programming language.
The coffee leaf miner infestation was mapped using the CLMI index on Sentinel-2A images, which were from 26 to 28 September 2020, from four plots in the CETP, CESP, CEMA, and CEPC experimental research stations.
Given that the coffee leaf miner infestation dynamics are influenced by precipitation, the average precipitation values from April to May from the Climate Hazards Group Infrared Precipitation with Station (CHIRPS) data were used. However, the addition of this variable did not show satisfactory results. Thus, only the CLMI was used for the identification test of the coffee leaf miner infestation.
The machine learning method was then adopted using the supervised Random Forest (RF) and Support Vector Machine (SVM) algorithms to recognize patterns of coffee leaf miner infestation in the field based on the images obtained in the four plots (CETP, CESP, CEMA, CEPC) to train the algorithm to recognize the coffee leaf miner infestation using CLMI.
These two machine learning methods (RF and SVM) are among the most popular algorithms used in classification and regression, and they are characterized by similar high performance [
39]. The SVM algorithm, which was first introduced in the late 1970s, is one of the most widely used kernel-based learning algorithms in a range of machine learning applications, in particular, image classification. SVM, in its basic form, is a linear binary classifier which identifies a single boundary between two classes [
39].
The RF is a set of learning algorithms, which were proposed by Breiman [
40] and which consist of a set of decision trees and independent and identically distributed random vectors. SVM and RF can handle learning tasks with a small amount of training datasets but demonstrate competitive results.
In this study, SVM with linear kernel type was applied to establish a discrimination model. For Random Forest, the number of decision trees to create was 100. The confusion matrix was used to assess the accuracy of supervised algorithms. Specifically, before training the algorithm, 30% of the pixels of all plot images were reserved to validate the training of the algorithms (Random Forest and SVM) in the prediction of CLMIE. The remaining pixels (70%) were used to train the algorithms.
The confusion matrix was extracted based on the 30% of data reserved for validation. The CEMA plot was used to represent a healthy plot, as it had the lowest infestation (8% infestation). The other stands were considered infested with coffee leaf miner infestation above 20%.
3. Results
3.1. Field Monitoring
The monthly monitoring of the occurrence of coffee leaf miner infestation between January 2019 and December 2021 in CETP, CESP, CEMA, CEPC are presented in
Table 4.
The occurrence of coffee leaf miner in coffee plantations can be observed throughout the months of the year (
Table 4). However, from June onwards, there was an increase in coffee leaf miner infestation, with the largest infestations occurring in September, October, and November but particularly in October 2021, in which the infestation reached up to 85%, followed by September 2020 with a maximum infestation of 76%. The lowest infestations were in February and March (
Table 4).
3.2. Spectral Characteristics of the Coffee Crop with Coffee Leaf Miner
Considering that the month of September was the month with the second highest incidence of coffee leaf miner in the study region, as well as the month with the highest number of images available, the month of September of the years 2019, 2020, and 2021 was then considered to create of the new index.
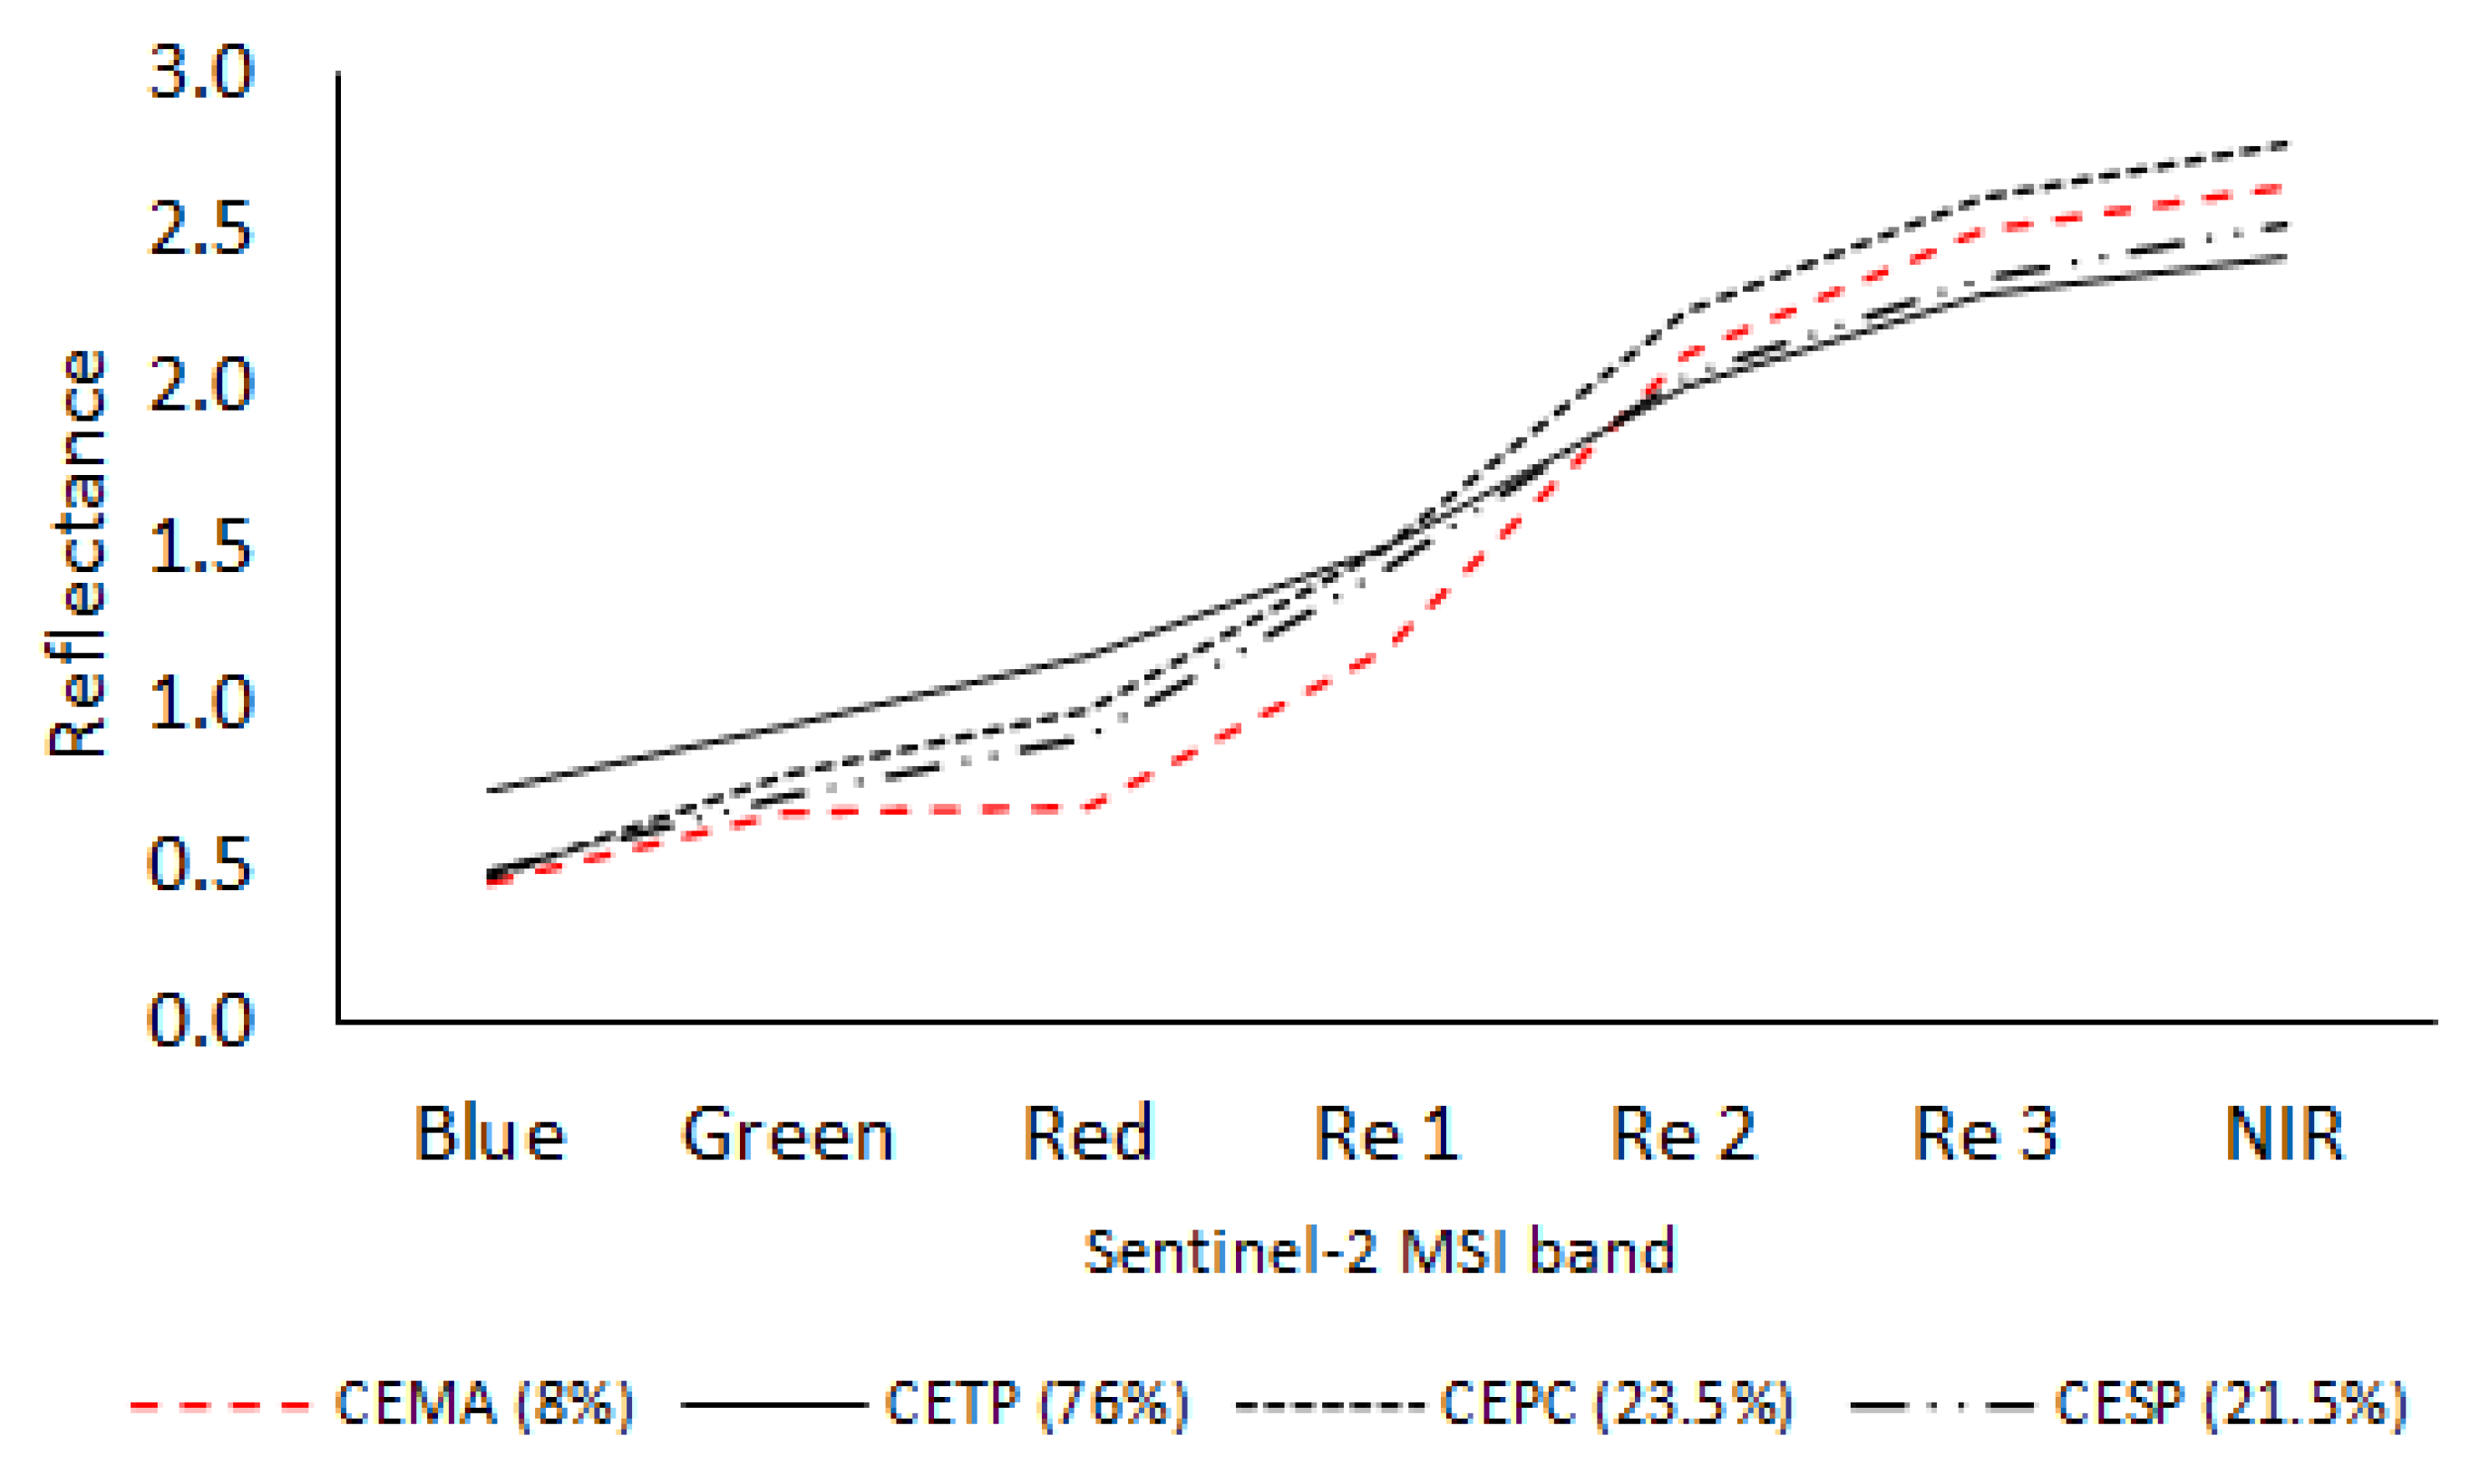
Figure 2 shows the spectral reflectance in coffee crops with different levels of coffee leaf miner infestation from the image obtained on 26 and 28 September 2020.
Based on the pattern of the spectral curve, it is possible to identify that the CETP coffee crop that showed the lowest reflectance in the Near Infrared region (NIR) and the highest reflectance in the Blue wavelength region was the one with the highest coffee leaf miner infestation. In the Red region, it is observed that the higher the percentage of leaf miner infestation (8%; 21.5%; 23.5%, and 76%), the greater the reflectance.
Comparing the reflectance of the coffee crop with the highest infestation (CETP—76%) with the one with the lowest infestation (CEMA—8%) in the NIR region, it can be seen that the higher the infestation, the lower the reflectance.
3.3. Index Development
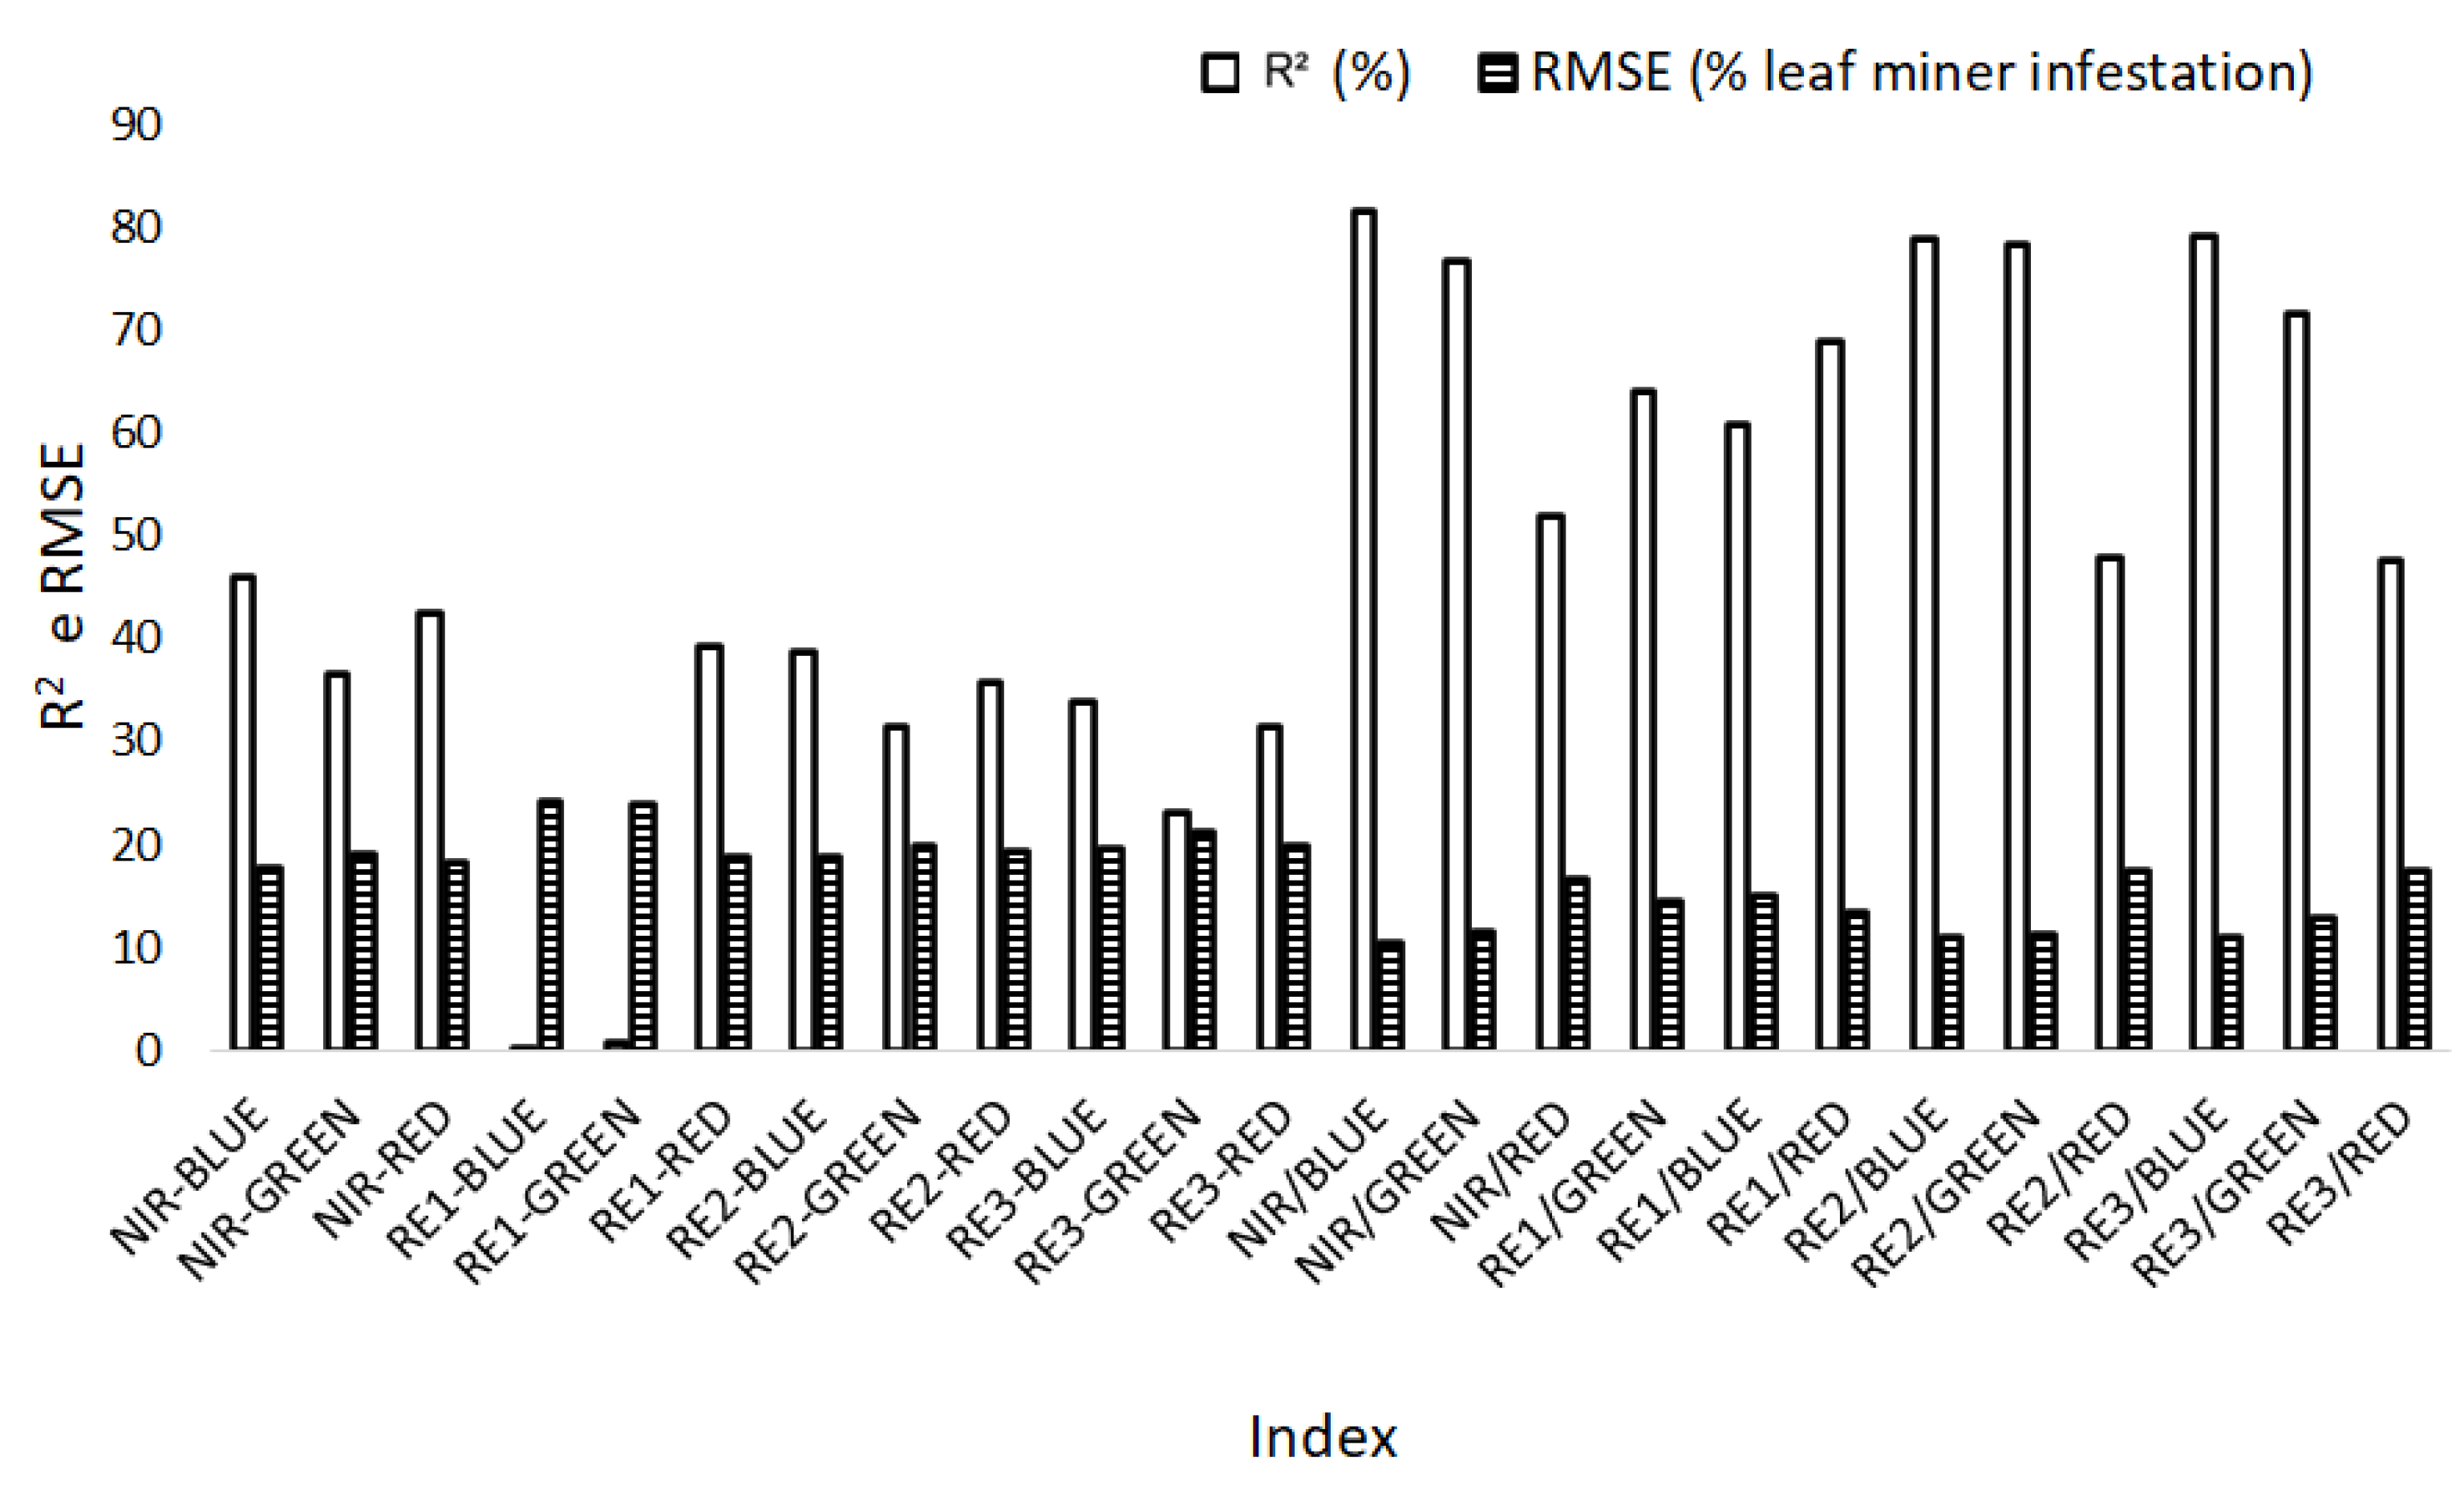
Based on the coefficient of determination (R
2) and the Root Mean Square Error (RMSE) (
Figure 3), which were obtained for the 24 regression equations based on the difference or ratio of band wavelengths and the level of coffee leaf miner infestation recorded in the field, the bands that best show coffee leaf miner infestation in coffee crops areas were selected.
Given the analysis of the ratio between the different bands considered, although the indices based on the ratio (NIR/BLUE and RE3/BLUE) have presented the best results because of the grouping of the values of higher R
2 and lower RMSE (
Figure 3), the CLMI index based on the NIR, RE3, and BLUE bands did not present a good performance for the CLMIE, because of the low values of R
2 and high values of RMSE. Therefore, the indices based on the difference between the bands were also analyzed, with the NIR-BLUE and NIR-RED differences being those that presented the best performances because of the higher R
2 and lower RMSE. The NIR, RED, and BLUE bands were then selected.
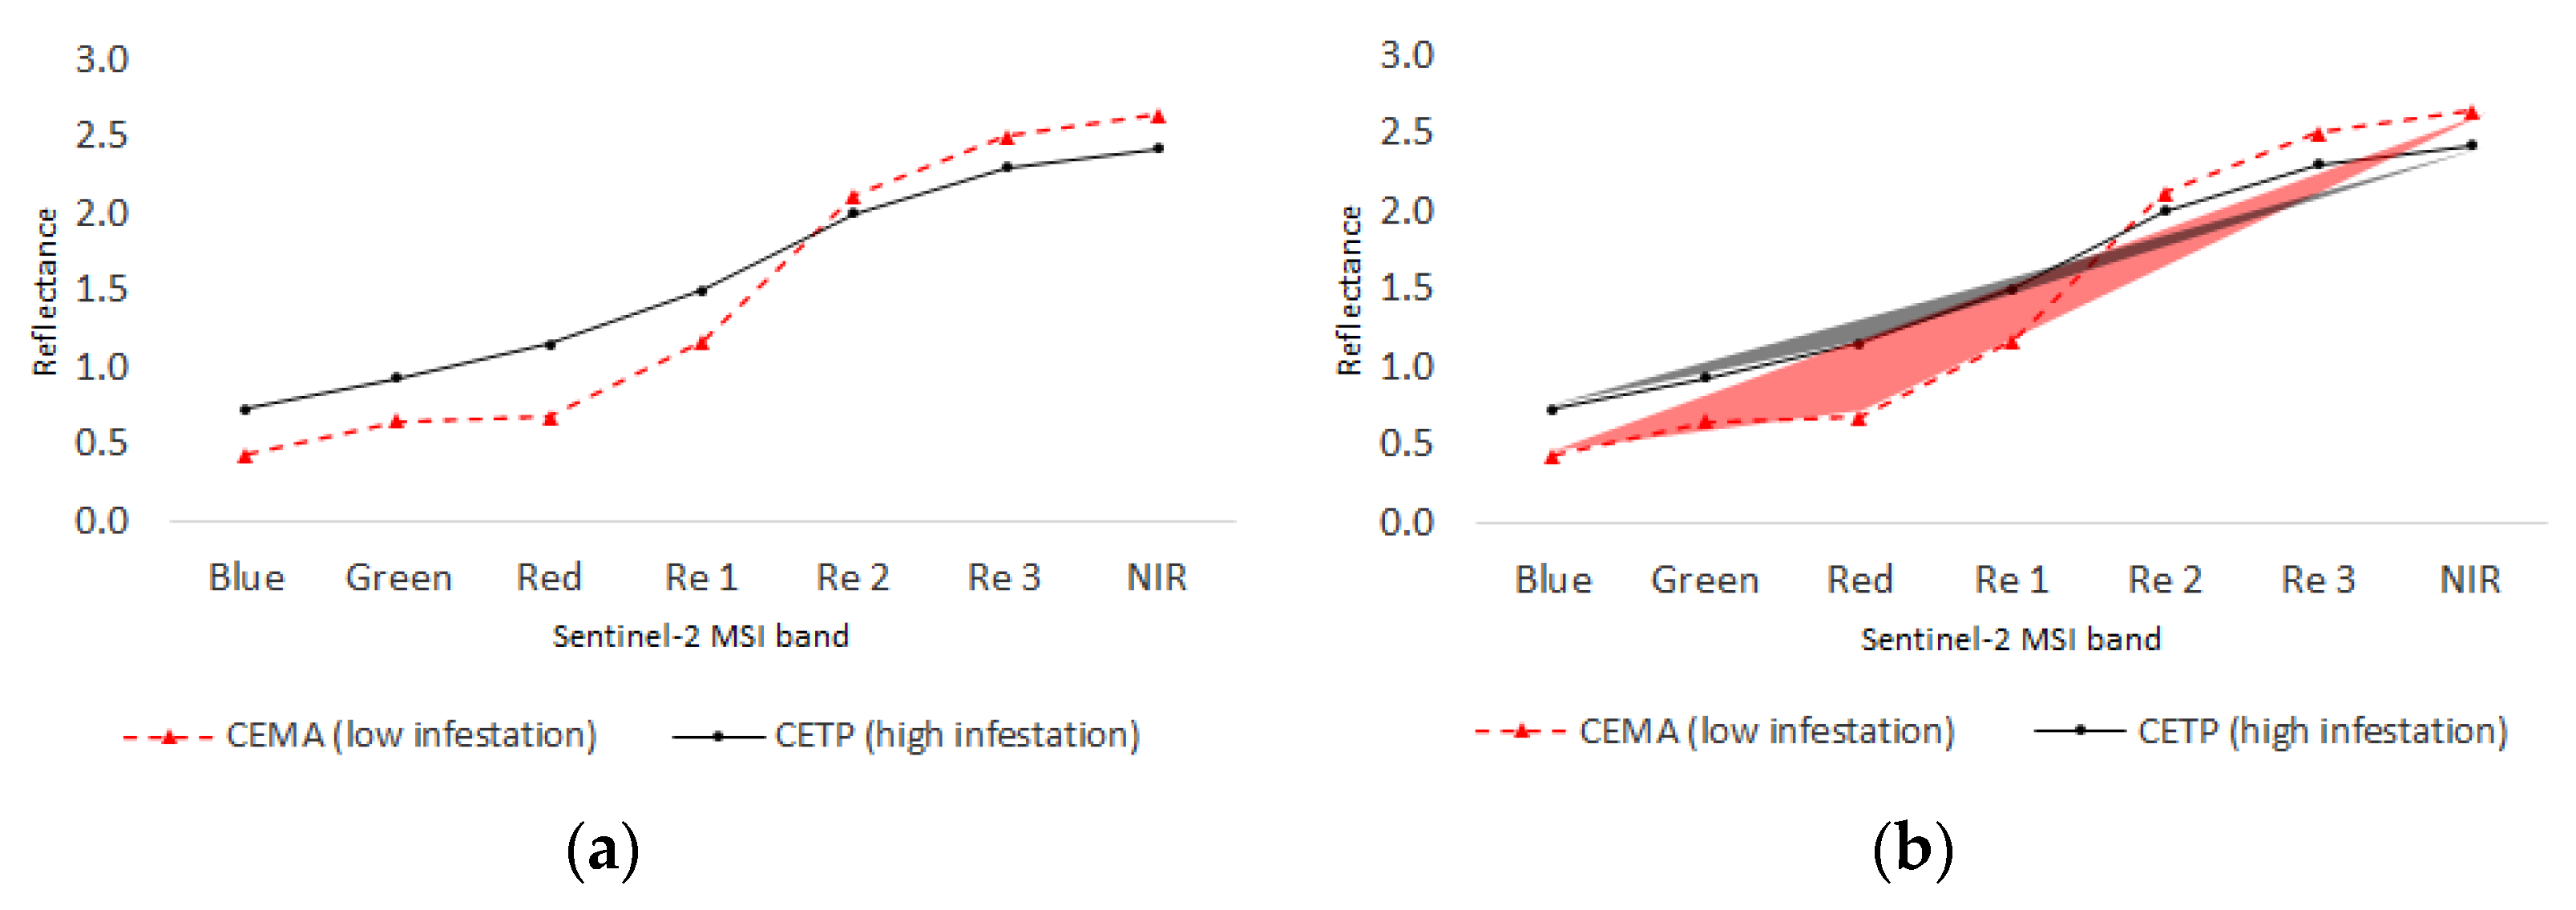
Thus, from the analysis of the area of the triangle, which was formed by the values of the spectral reflectance of the NIR, RED, and BLUE (
Figure 4), the CLMI index was developed for the CLMIE.
Based on the area of the triangle formed in
Figure 4, the CLMI index was created from Equation (2).
where RED, BLUE, and NIR are the reflectance values of the bands, and the numbers 665, 490, and 842 are the central wavelengths of the same bands (
Table 2).
Still based on
Figure 4, it is noteworthy that the smaller the area of the triangle formed, the greater the level of coffee leaf miner infestation because coffee leaf miner infestation decreases the reflectance in the NIR region and increases the reflectance in the Blue region; therefore, the lower the value of the CLMI index, the greater the level of infestation by coffee leaf miner in the coffee crops.
3.4. Estimation of Coffee Leaf Miner Infestation Using Simulation with Multispectral Data
The CLMI index was compared with 10 other relevant vegetation indices in the literature to identify coffee leaf miner infestation in coffee crops using statistical performance criteria (R
2 and RMSE). For a better adjustment of the generated models, the extreme values were removed, i.e., 0% of infestation and 76% of leaf miner infestation.
Table 5 summarizes the R
2 and RMSE values found in the developed models of the CLMI and the ten relevant vegetation indices in the literature.
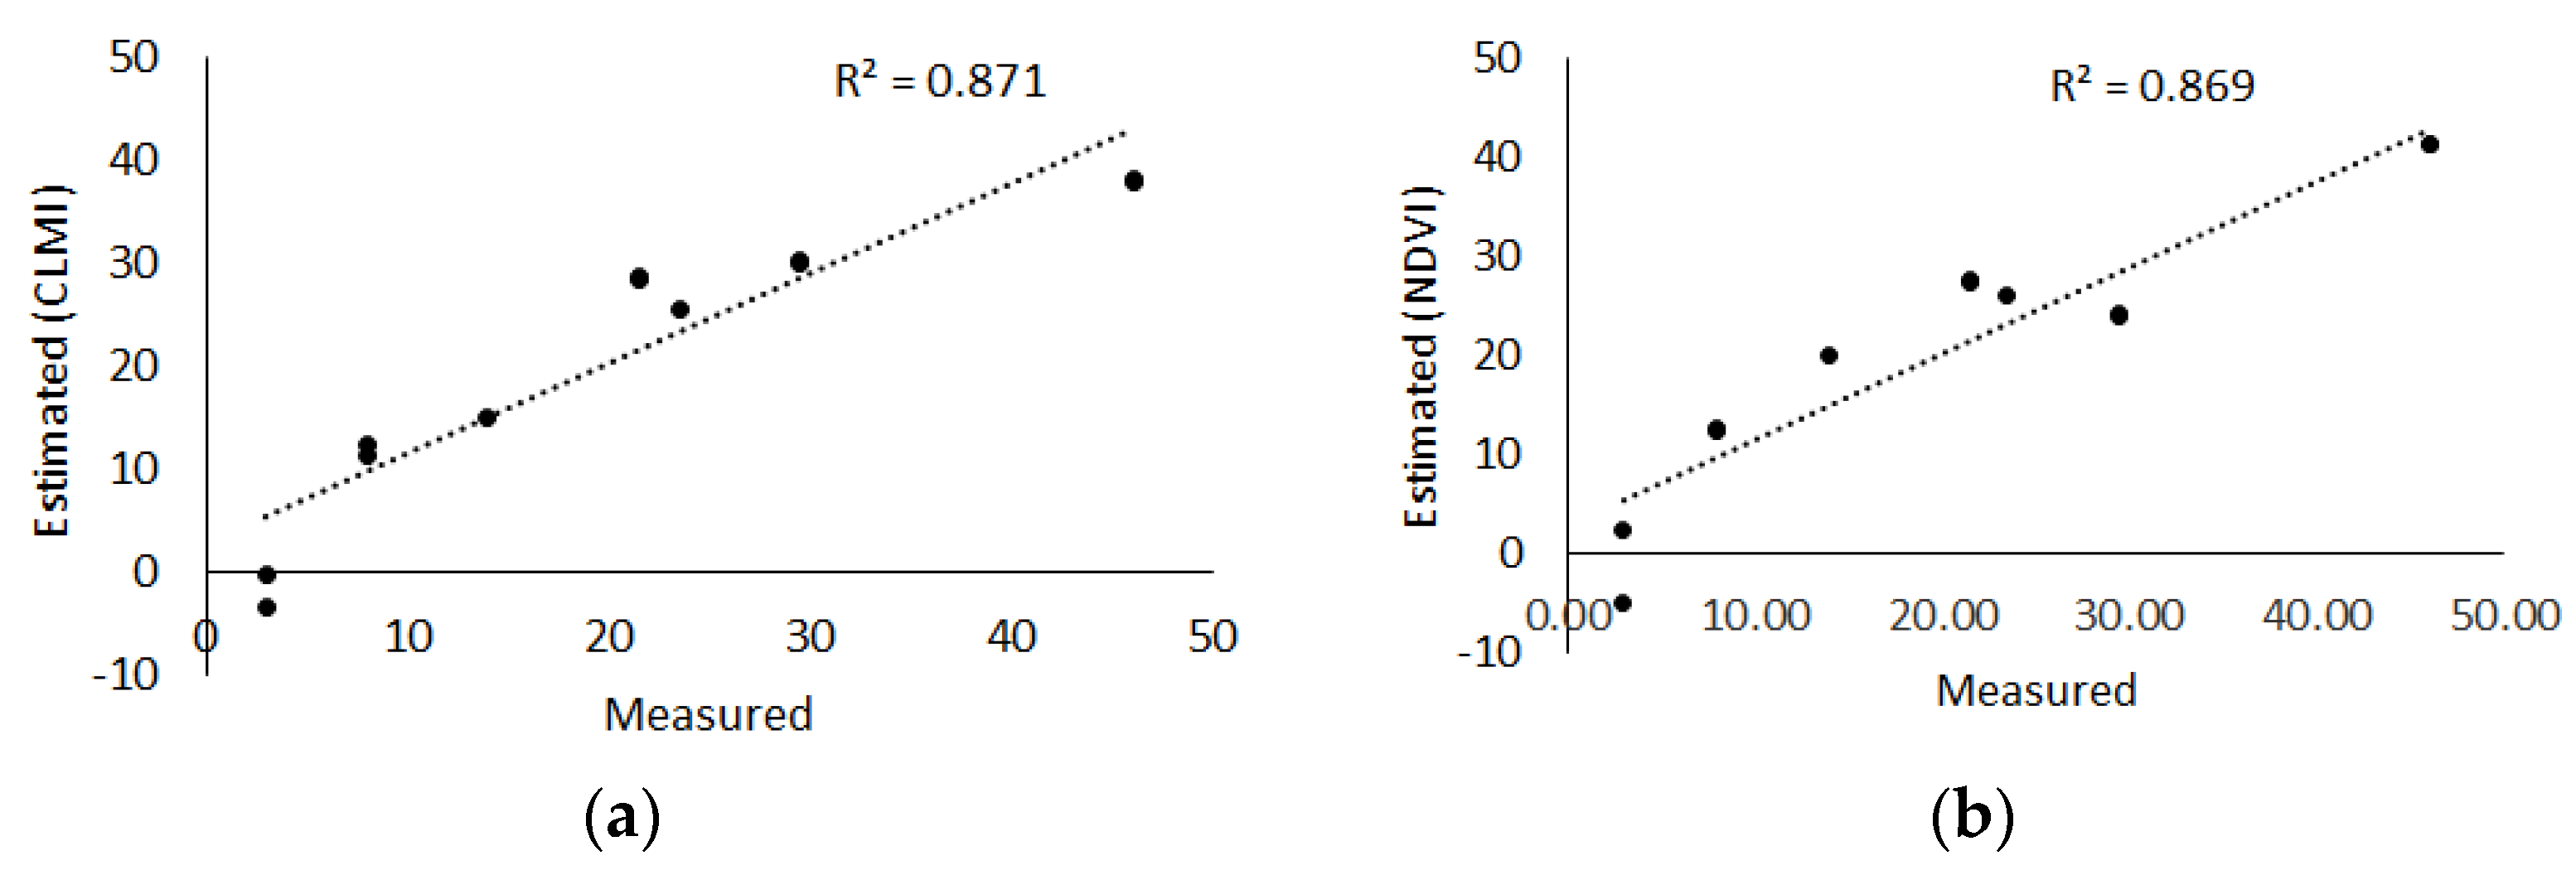
The CLMI presented the best R2 and RMSE values of 0.869 and 4.94, respectively. The new index was the best index to identify coffee leaf miner infestation. The existing vegetation indices in the literature that presented the best performance to identify coffee leaf miner infestation were NDVI, IPVI, EVI, and SAVI, which presented an R2 above 0.85 and an RMSE below 5.5. The vegetation indices that presented a low performance for identifying the leaf miner infestation were the MTCI and REIP, which presented with an R2 below 0.4 and an RMSE above 11.
Figure 5 also shows, based on the results of the models, the estimated values of the coffee leaf miner infestation and those measured in the field in the period between 26 and 28 September 2020.
Figure 5 shows the scatter plots between the estimated coffee leaf miner infestation and that measured in the field. It can be observed that the generated models had difficulties in identifying low leaf miner infestations, reaching negative values when the leaf miner infestation was low.
The vegetation indices that had the highest R
2 value (>0.85) and the lowest RMSE (<5.5) (
Table 5) for the CLMIE in September were used for the CLMIE in October of the years 2019 and 2020 (
Table 6), because in October 2021, there were no cloud-free satellite images of the studied locations. October was the month with the highest infestation of coffee leaf miner (
Table 4).
For October, the CLMI was the best index to estimate coffee leaf miner infestation in coffee crops, due to the higher value of R2 and lower value of RMSE. The NDVI was the vegetation index that presented the lowest performance for estimating coffee leaf miner infestation. However, when comparing the results of October with September, all the vegetation indices presented lower performance when estimating the infestation with coffee leaf miner in October.
3.5. Application of the New Index for Mapping the Coffee Leaf Miner Infestation on a Regional Scale
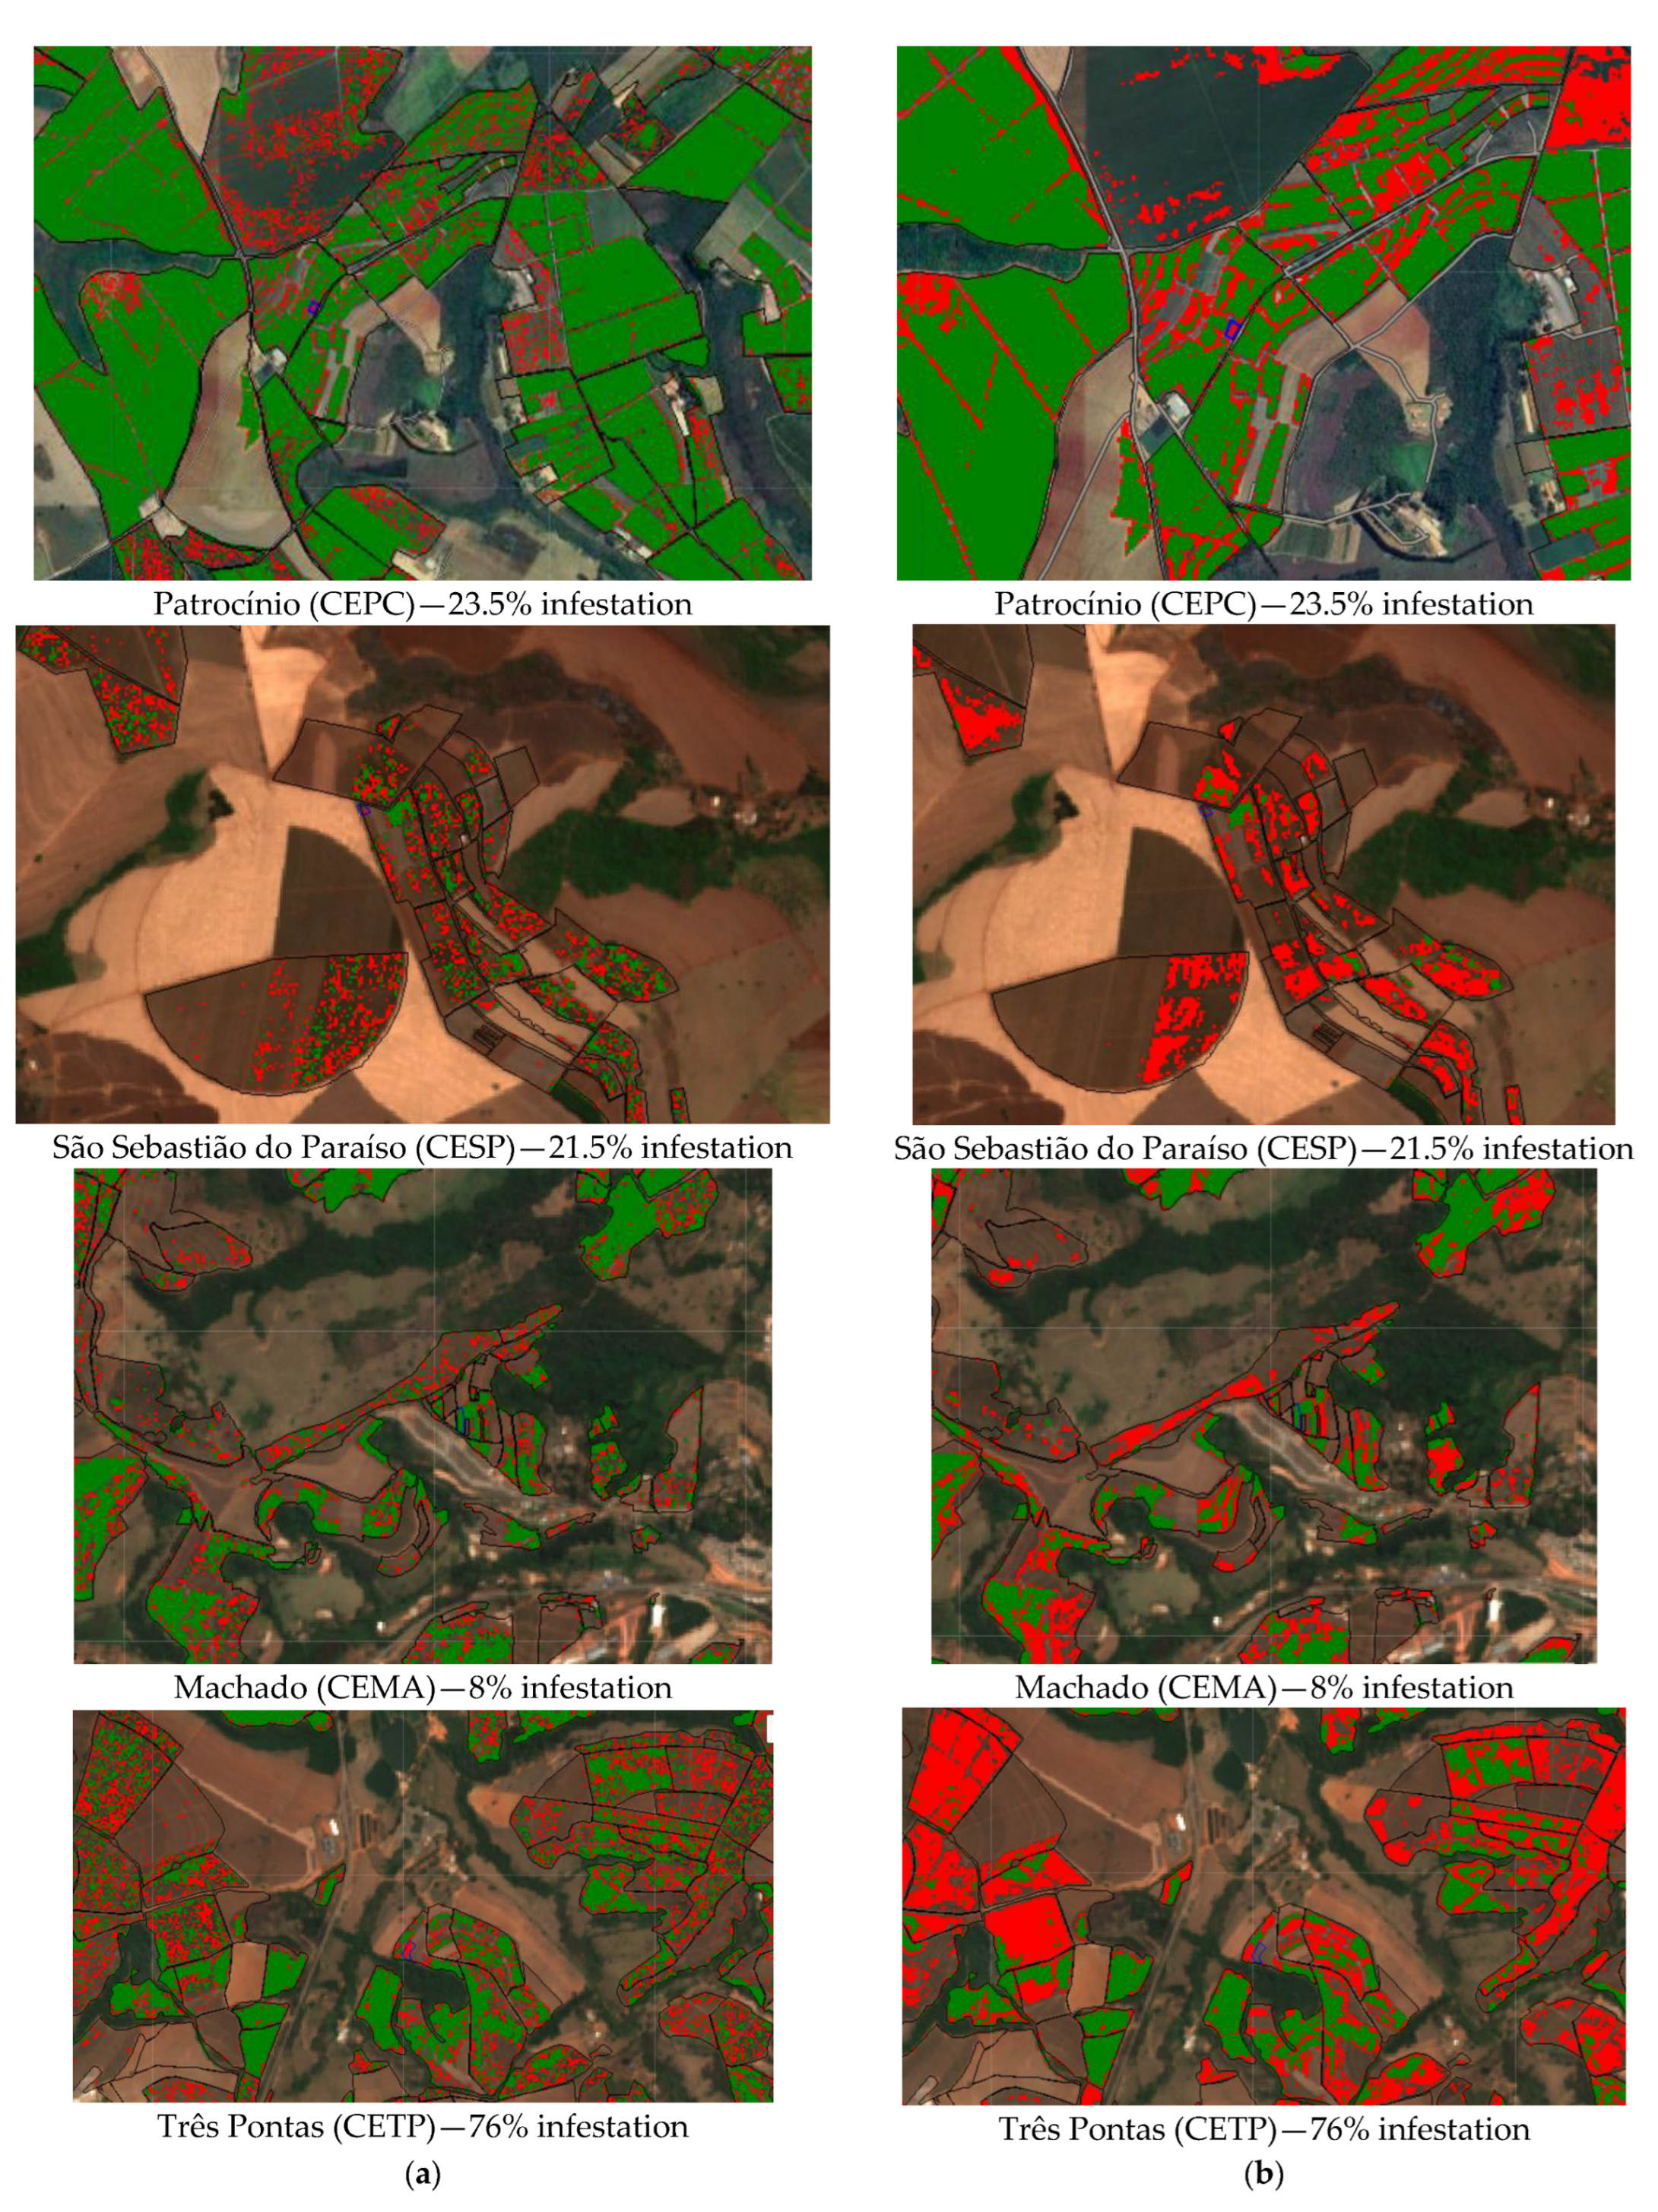
The map of coffee leaf miner infestation using the CLMI index and the supervised Random Forest and Support Vector Machine (SVM) algorithms on Sentinel-2A images, from 26 to 28 September 2020, in four plots in the CETP, CESP, CEMA experimental fields, and CEPC can be seen in
Figure 6.
The coffee leaf miner infestation map using the CLMI index and the supervised Random Forest algorithm showed areas with lower coffee leaf miner infestation when compared to the map that used the SVM algorithm. The Experimental Research Station of CETP and CEMA were the sites that showed the highest infestation with leaf miner (
Figure 6).
The performance of the new index for monitoring coffee leaf miner infestation using Random Forest and SMV is shown in
Table 7. The confusion matrix, the kappa index, and the accuracies for the performance evaluation were considered, and the type I and II errors are presented.
Random Forest presented the best accuracy indices and the lowest errors when compared to the values found when using the SVM algorithm to classify coffee leaf miner infestation. The Random Forest algorithm reached an overall accuracy and kappa index higher than 89%, whereas the SVM algorithm found an overall accuracy of 81.8% and a kappa of 61.3%.
4. Discussion
In this study, we show that coffee crops with an infestation lower than 23.5% had lower reflectances in the Blue, Green, and Red range when compared to the coffee crop with an infestation of 76%. In the visible region (Blue, Green, and Red), the reflectance in the leaves is determined by the pigments of chlorophyll (65%), carotene (6%), and xanthophylls (29%) which, when interacting with electromagnetic radiation, absorb radiation in the Blue region [
42]. Therefore, the degradation of pigments (chlorophyll, carotene, and xanthophylls) because of the coffee leaf miner infestation, causes a pronounced spectral variation in the visible range, mainly in the Blue range. For the Near-Infrared range, the coffee plantation with the highest infestation of a coffee leaf miner (76%) had the lowest reflectance. Infrared reflectance can be affected by changes that occur in the leaf parenchyma [
14], as the coffee leaf miner larva can penetrate the leaf mesophyll and destroy the parenchyma [
4]. This phenomenon can explain the lower Near-Infrared reflectance (NIR) when there is an increase in coffee leaf miner infestation. Therefore, the Near-Infrared range can be used to assess infestations of pests that attack the internal structure of the leaf [
42,
43]. The CLMI was defined as the area of the triangle based on the spectral reflectance in the Blue, Red, and NIR regions.
Table 5 shows R
2 and RMSE values of the regression equations developed from the CLMI and the other 10 vegetation indices. It can be observed that the indices that presented the best performance were those that had the NIR, Red, and Blue bands. NDVI presented the best performance of statistical criteria (R
2 and RMSE) for CLMIE, followed by IPVI and EVI. The indices that presented the bands Green, Re1, and Re2, were the indices that presented the lowest performance, such as the REIP and MTCI indices, which presented the coefficients of determination of 0.017 and 0.32, respectively. The low performance of these indices shows that the use of the Green, Re1, and Re bands of Sentinel-2 does not monitor the CLMIE. October was the month with the lowest values of R
2, when compared to September. The month of September is the beginning of a phenological phase of coffee; therefore, the difference between the months of September and October may be associated with the different physiological conditions between these two months.
The mapping of the area with coffee leaf miner infestation was carried out using the CLMI. The accuracy of the mapping can be seen in the confusion matrix in
Table 3. The producer’s accuracy shows the error of omission, reveals how much the algorithm can identify from the real data, and measures the classification accuracy; the user’s accuracy shows the commission error, showing the reliability of a class corresponding to the field of truth [
44]. For Random Forest, producer accuracy and user accuracy were identical and above 85% for both healthy and infested coffee. The SVM presented a lower performance than the Random Forest algorithm, but the performance of SVM was above 80% for user and producer precision for the user and producer accuracy. A type I error is a false positive, which is when it is estimated that there is an infestation with a coffee leaf miner, but in reality, there is no infestation in the field. A type II error (false negative) estimates that an infestation is not occurring, but in reality, an infestation is taking place. The Random Forest and SVM algorithms presented errors (I and II) below 20%. The kappa coefficient is a statistical method used to assess the level of agreement between two sets of data. Kappa values greater than 80% represent excellent agreement and between 60% and 80% have a substantial agreement [
45]. The Random Forest algorithm presented a kappa coefficient of 95%, and the SVM presented a kappa coefficient of 61.3%. These data show that the use of Random Forest and SVM algorithms associated with the new index could identify with good accuracy the coffee leaf miner infestation in the field.
Mapping using the CLMI index through the machine learning method could be used to identify coffee crops with coffee leaf miner infestation and coffee crops without coffee leaf miner infestation based on the spectral reflectance of coffee crops. There are some limitations and challenges in monitoring coffee leaf miner infestation with CLMI on a regional scale. First, the multispectral data were taken from coffee crops at the same phenological stage, and it is not known whether the behavior of the index would be the same at other stages. Second, the management of the areas was similar in the study areas, and the management practices may be different among the producers. The new index developed can be used to aid in the remote detection of coffee leaf miner infestation on a regional scale in a fast and non-invasive way, facilitating the control of the infestation by reducing monitoring costs. Therefore, the new index can provide optimization of the use of agricultural pesticides. Monitoring of coffee leaf miner infestation at the regional level plays an important role in agriculture. This fast, non-destructive, and low-cost approach can be used as a method of monitoring the coffee leave miner infestation on a regional scale so that the rural producer can be aware of a possible increase in the infestation of the coffee leaf miner on his property. This awareness would allow the producer to increase visits in the field at the periods indicated during monitoring.

 ,
, 


