Article

Role of Non-Structural Sugar Metabolism in Regulating Tuber Dormancy in White Yam (Dioscorea rotundata)

by
Jeremiah S. Nwogha
1,2,3,*,
Wosene G. Abtew
1,
Muthurajan Raveendran
2,
Happiness O. Oselebe
4,
Jude E. Obidiegwu
3,
Cynthia A. Chilaka
5 and
Damodarasamy D. Amirtham
2
1
Department of Horticulture and Plant Sciences, College of Agriculture and Veterinary Medicine, Jimma University, Jimma P.O. Box 307, Ethiopia
2
Departments of Plant Biotechnology and Biochemistry, Centre for Plant Molecular Biology & Biotechnology, Tamil Nadu Agricultural University, Coimbatore 641003, India
3
Yam Research Programme, National Root Crops Research Institute, Umudike 440001, Nigeria
4
Department of Crop Production and Land Scape Management, Ebonyi State University, Abakaliki PMB 53, Nigeria
5
Institute of Pharmacology and Toxicology, Julius Maximilian University of Würzburg, Versbacher Str. 9, 97078 Würzburg, Germany
*
Author to whom correspondence should be addressed.
Agriculture 2023, 13(2), 343; https://doi.org/10.3390/agriculture13020343
Submission received: 29 December 2022 / Revised: 20 January 2023 / Accepted: 25 January 2023 / Published: 30 January 2023
(This article belongs to the Topic Crop Ecophysiology: From Lab to Field)

Abstract

:
Changes in sugar composition occur continuously in plant tissues at different developmental stages. Tuber dormancy induction, stability, and breaking are very critical developmental transitions in yam crop production. Prolonged tuber dormancy after physiological maturity has constituted a great challenge in yam genetic improvement and productivity. In the present study, biochemical profiling of non-structural sugar in yam tubers during dormancy was performed to determine the role of non-structural sugar in yam tuber dormancy regulation. Two genotypes of the white yam species, one local genotype (Obiaoturugo) and one improved genotype (TDr1100873), were used for this study. Tubers were sampled at 42, 56, 87, 101, 115, and 143 days after physiological maturity (DAPM). Obiaoturugo exhibited a short dormant phenotype and sprouted at 101-DAPM, whereas TDr1100873 exhibited a long dormant phenotype and sprouted at 143-DAPM. Significant metabolic changes were observed in non-structural sugar parameters, dry matter, and moisture content in Obiaoturugo from 56-DAPM, whereas in TDr1100873, significant metabolic changes were observed from 101-DAPM. It was observed that the onset of these metabolic changes occurred at a point when the tubers of both genotypes exhibited a dry matter content of 60%, indicating that a dry matter content of 60% might be a critical threshold for white yam tuber sprouting. Non-reducing sugars increased by 9–10-fold during sprouting in both genotypes, which indicates their key role in tuber dormancy regulation in white yam. This result implicates that some key sugar metabolites can be targeted for dormancy manipulation of the yam crop.

1. Introduction

Yam (Dioscorea spp.) holds a key position among the staple tuber food crops while possessing therapeutic potentials [1], cultural significance [2], and better organoleptic properties compared to cassava, potato (within Solanum spp.), and sweet potato (Ipomoea batatas (L.) [3]. It belongs to the monocotyledonous family, Dioscoreaceae, and genus Dioscorea. Yam is a multi-species crop that has about 613 known species that produce tubers, bulbils, or rhizomes [4]. Of these, about 10 are cultivated over a larger area and serve as a staple food crop, and about 50 other species are also eaten as wild-harvested staple famine food. Thus, this genus occupies a prominent position in combating global food insecurity [1,5]. However, prolonged tuber dormancy after physiological maturity has constituted a great challenge for yam genetic improvement and productivity [6]. Tuber dormancy is the major cause of the prolonged inability of wheat and seed tubers to sprout. During dormancy, harvested tubers remain dormant and incapable of developing internal or external shoot buds/sprout for 150 to 210 days, depending on the physiological stage of harvest, species, growing, and storage conditions [7,8,9]. Tuber dormancy induction, stability, and breaking are very critical developmental transitions in the yam crop cycle and have constituted a great regulator of yam production activities as well as its tuber availability, thus making it impossible to have more than one crop cycle per year and limiting crop production, tuber availability, and the rate of genetic improvement through breeding [10].
Plant life largely depends on the photosynthetic fixation of carbon and energy in energy-rich molecules and the concomitant production of oxygen. Sugars not only fuel growth and development in plants as carbon and energy source but also play important regulatory functions, controlling metabolism, stress resistance, growth and development in bacteria, yeast, plants, and animals [11,12]. The regulatory roles of sugar are most explicit in free-living microorganisms that are often challenged by the constantly changing environment. In multicellular organisms, maintenance of nutrient and energy homeostasis within cells and tissues is very important and requires constant monitoring and adjustment of either activities or energy availability [13]. In photosynthetic sugar-producing and sessile organisms such as plants, energy homeostasis maintenance requires an even more sophisticated and flexible regulatory mechanism to maintain the complex physiological and developmental plasticity in plants. In recent years, the pivotal roles of sugar signaling molecules and their dramatic regulation of plant growth and development have been well investigated [14,15,16]. In plants, some of the well-characterized developmental processes that are regulated by sugar levels include cell division, embryogenesis, seed germination, seedling development, hypocotyl elongation, leaf formation, nodule formation, pollen development, adventitious root formation, juvenile-to-adult phase transition, flowering, tuber formation, and senescence induction [17,18,19,20]. It has been shown that glucose, sucrose, or trehalose-6-phosphate are the carbohydrates most involved in the regulation of plants’ growth and development, acting independently as basal functions and also as signaling molecules [13].
Generally, plants have two groups of sugar signaling pathways that respond to carbon availability status [21]. It has been observed that yam tuber dormancy induction concedes with the onset of vine senescence, implying that tuber dormancy induction may be a physiological adjustment in response to change in a continuous supply of sugar (low sugar condition), as a result of the stoppage of photosynthesis and supply of sucrose from the photosynthetic sites (source) to the tuber (the storage organ—sink). Therefore, yam tuber dormancy induction can be said to be one of the crop responses to carbon starvation due to the stoppage of sugar supply from photosynthesis. This is supported by the fact that the dormancy period is generally associated with minimal endogenous metabolic activity, resulting in minimal metabolic changes in order to maintain a low-energy economy [22]. Changes in the composition and transport of sugars occur continuously in plant tissues at different developmental stages [13,23]. Plants have developed an efficient system of perception and transmission of signals induced by these changes in sugar quantity (lower or higher sugar availability) [24]. Low and high sugar conditions have separate response pathways in plants; for instance, hexokinase (as a glucose sensor; HXK1), trehalose-6-phosphate (T6P), and target of rapamycin (TOR) are all high sugar availability responsive pathways, and they stimulate growth or development at any stage. While sucrose non-fermenting 1-related kinase 1 (SnRK1) and C/S1 bZIP transcription factor are responsive pathways for low sugar conditions [14,25,26], they act by inhibiting any activities that utilize sugar and energy, such as growth and developmental processes. Studies on the biochemical changes in yam tubers during storage have revealed that there were changes in starch, sugars, and proteins as the storage progressed [27,28,29]. In this study, we performed biochemical profiling of vital sugar parameters in two white yam (Dioscorea rotundata) genotypes (Obiaoturugo and TDr1100873) from the physiological mature stage of the tubers to sprouting to determine whether non-structural sugar metabolism plays a role in yam tuber dormancy regulation. This will help to understand the molecular mechanism regulating yam tuber dormancy.

2. Materials and Methods

2.1. Genetic Material

The genetic materials comprised two genotypes of white yam (D. rotundata), one local genotype (Obiaoturugo), and one improved genotype (TDr1100873), all sourced from the yam breeding program of the National Root Crops Research Institute (NRCRI), in Umudike, Nigeria.

2.2. Field Study Area

The field was established at the eastern research farm of the National Root Crops Research Institute (NRCRI), Umudike, Nigeria. Umudike is a rainforest agroecology located at 5.4729° N, 7.5480° E, and 152 m ASL. Umudike recorded a mean annual rainfall of 2093 mm, temperature of 27.3 °C, relative humidity of 82%, and sandy loam soil with a pH range of 4.3 to 5.27.

2.3. Field Establishment

Uniform set sizes (200 g) of only the proximal and distal regions of the genetic materials were planted in order to maintain a relatively uniform germination time. A total of 30 plant stands of each genetic material were planted in a randomized complete block design, replicated three times, with 10 plant stands of each genetic material per replicate. The field was adequately maintained under rainfed conditions, and all cultural and standard agronomic practices, including the application of NPK fertilizer at the recommended dose of 80:60:100 kg/ha, were carried out. Tubers were harvested at 50% senescence, which is the tuber’s physiological maturity stage.

2.4. Postharvest Study Area and Sampling

After harvesting, tubers were freighted to the Center for Plant Molecular Biology and Biotechnology, Department of Plant Biotechnology, Tamil Nadu Agricultural University, Coimbatore, India. The tubers were stored in a greenhouse facility with natural light conditions and sunshine that ranged from 10 to 12 h per day, a relative humidity range of 38% to 78%, and a maximum and minimum temperature range of 26 to 36.5 °C and 17.5 to 26.5 °C, respectively. Tubers were sampled on the following days after physiological maturity (DAPM): 42-DAPM, 56-DAPM, 87-DAPM, 101-DAPM, 115-DAPM, and sprouted tuber (143-DAPM). At each sampling point, samples were collected from three tubers of each genotype. Six non-structural sugar parameters, including total sugars, carbohydrates, reducing sugar, non-reducing sugar, amylose, and amylopectin, were estimated at the biochemistry department laboratory of Tamil Nadu Agricultural University, Coimbatore, India. Dry matter and moisture content were also determined during sampling.

2.4.1. Dry Matter and Moisture Content

At each sampling point, triplicate tuber samples were collected. Fresh weights were taken, after which the samples were oven dried to a constant weight at 72 °C. The moisture content was calculated by subtracting the dry matter weight from the sample fresh weight.

2.4.2. Extraction and Quantification of Non-Structural Sugars

At each sampling point, tubers were sampled by sectioning a tuber vertically and longitudinally into six parts comprising the proximal, middle, and distal regions. Samples were quenched in liquid nitrogen, freeze-dried, and stored at −80 °C. For further analysis, freeze-dried samples were microwaved for 5 min, and oven-dried at 70 °C for 72 h. The samples were ground into powder using a commercial grinder. The powdered form was subsequently used for the analysis of six parameters of non-structural sugar, including total sugars, carbohydrates, reducing sugar, non-reducing sugar, amylose, and amylopectin.

2.4.3. Total Sugar and Starch Estimation

Total sugar was estimated using the anthrona method, following the procedure in [30]. Anthrona solution was prepared by dissolving 2 g of anthrona in 1 L of concentrated sulphuric acid (H2SO4). One hundred micrograms of glucose dissolved in 1 mL of water was prepared as a standard stock, from which 10 mL was diluted to 100 mL with water and used as a working standard. One hundred milligrams of tuber sample was dissolved in 20 mL of 80% ethanol and centrifuged for 5 min at 2000 rpm, and the supernatants were eluted. This was repeated twice to extract soluble sugar. The residues were dried and dissolved in 1 mL of 52% perchloric acid (HCl). This was subsequently heated for 20 min in a boiling water bath. The solution was neutralized with solid sodium carbonate (Na2Co3), 1 mL of ethanol was added, and it was centrifuged for 5 min at 2000 rpm. The supernatant was collected and added to the previously extracted soluble sugars, which were then made up to 10 mL with water. A volume of 0.2 mL of the solution was pipetted out and made up to 1 mL with water. Four milliliters of anthrona was added before the optical density spectrophotometry (ODS) reading was taken using a colorimeter at 630 nm. Total sugar was estimated from the ODS reading using the following equation, according to [31], and the value was multiplied by the conversion factor of 0.9 to get estimated starch.
A s = a s b c
where the absorbance A s is a dimensionless ratio that is equal to L o g 10 T s o l v e n t T s o l u t i o n , T is percent transmittance, b is the length of the light path expressed in centimeters, and c is the quantity of micrograms of sugar per milliliter of the final volume.

2.4.4. Reducing and Non-Reducing Sugars Estimation

Reducing sugars were estimated by the sodium thiosulphate titration method of [32]. Ten milliliters of the extract of the total sugar was pipetted into an iodine flask, and 10 mL of iodine was added, followed by a drop-wise addition of 10 mL of NaOH for 4 min, until the red color of the sample solution changed to colorless. Burette volume was noted as (V1). The flask was rinsed with water and made up to 50 mL with water, stopped, and allowed to sit for 15 min, before 3 mL of 10 N HCl was added, which changed its color back to red. This was titrated against 0.1 N sodium thiosulphate until the red color changed to straw yellow. A few drops of starch were subsequently added, and the titration was continued with sodium thiosulphates until the solution became colorless. The burette volume was taken as the titer value (V2). For blank, 10 mL of water was titrated with sodium thiosulphate, and the titer value was denoted as (V3). One hundred milligrams of glucose dissolved in 10 mL of water and then made up to 100 mL in a standard volumetric flask was used as a working standard. Volumetric calculations using the following equations were used to estimate the quantity of the reducing sugars, and the non-reducing sugars were determined by subtracting the reducing sugars from the total sugar.
Volume of 0.1 N thiosulphate = 0.1 N iodine consumed by 10 mL (10 mg of glucose) = xml
x   m l = V 3 V 1
Volume of 0.1 N thiosulphate = 0.1 N iodine consumed by glucose in 10 mL of unknown solution = yml
y   m l = V 3 V 2
Amount of glucose in 10 mL of unknown solution = z mg
z   m g = 10   m g x   m l y   m l
Amount of glucose in 100 mL of unknown solution = the quantity of the reducing sugar
R e d u c i n g   S u g a r = z   m g × 100   m l 10 m g

2.4.5. Amylose and Amylopectin

Amylose was determined using the iodine method according to [33]. Fifty milligrams was weighed into a cylindrical tube. Drops of 80% alcohol and 5 mL of 1 N NaOH were added. The mixture was boiled for 15 min, cooled, and transferred to a 50 mL standard flask and made up to 50 mL with water. Then, 0.5 mL of the extract was pipetted out and 2.0 mL of water was added, followed by 2 drops of 1% phenolphthalein, which gives the solution a pink color. Drops of 0.1 N HCl were added while shaking until the pink color disappeared. One milliliter of iodine reagent, which was prepared by dissolving 1 g of iodine in 500 mL of water, was added and made up to 10 mL with water. The absorbance readings were taken using a colorimeter at 600 nm, and the quantity of amylose was calculated using the same equation as was used to estimate total sugar in Section 2.4.4 above. Amylopectin was estimated by subtracting amylose from starch. Two hundred micrograms of amylose was dissolved in 1 mL of water and used as a standard stock, from which 50 mL was added to 50 mL of water and used as the working standard. All statistical analyses were performed using R software version 4.2. The Kruskal–Wallis test was performed on all variables investigated at p ≤ 0.05, and a Duncan post hoc pairwise means comparison was performed to ascertain the exact difference between means. The statistically significant differences among the variable means were indicated with error bars and letters on the graphics. The days to dormancy breaking was analyzed using t-test at (p ≤ 0.05).

3. Results

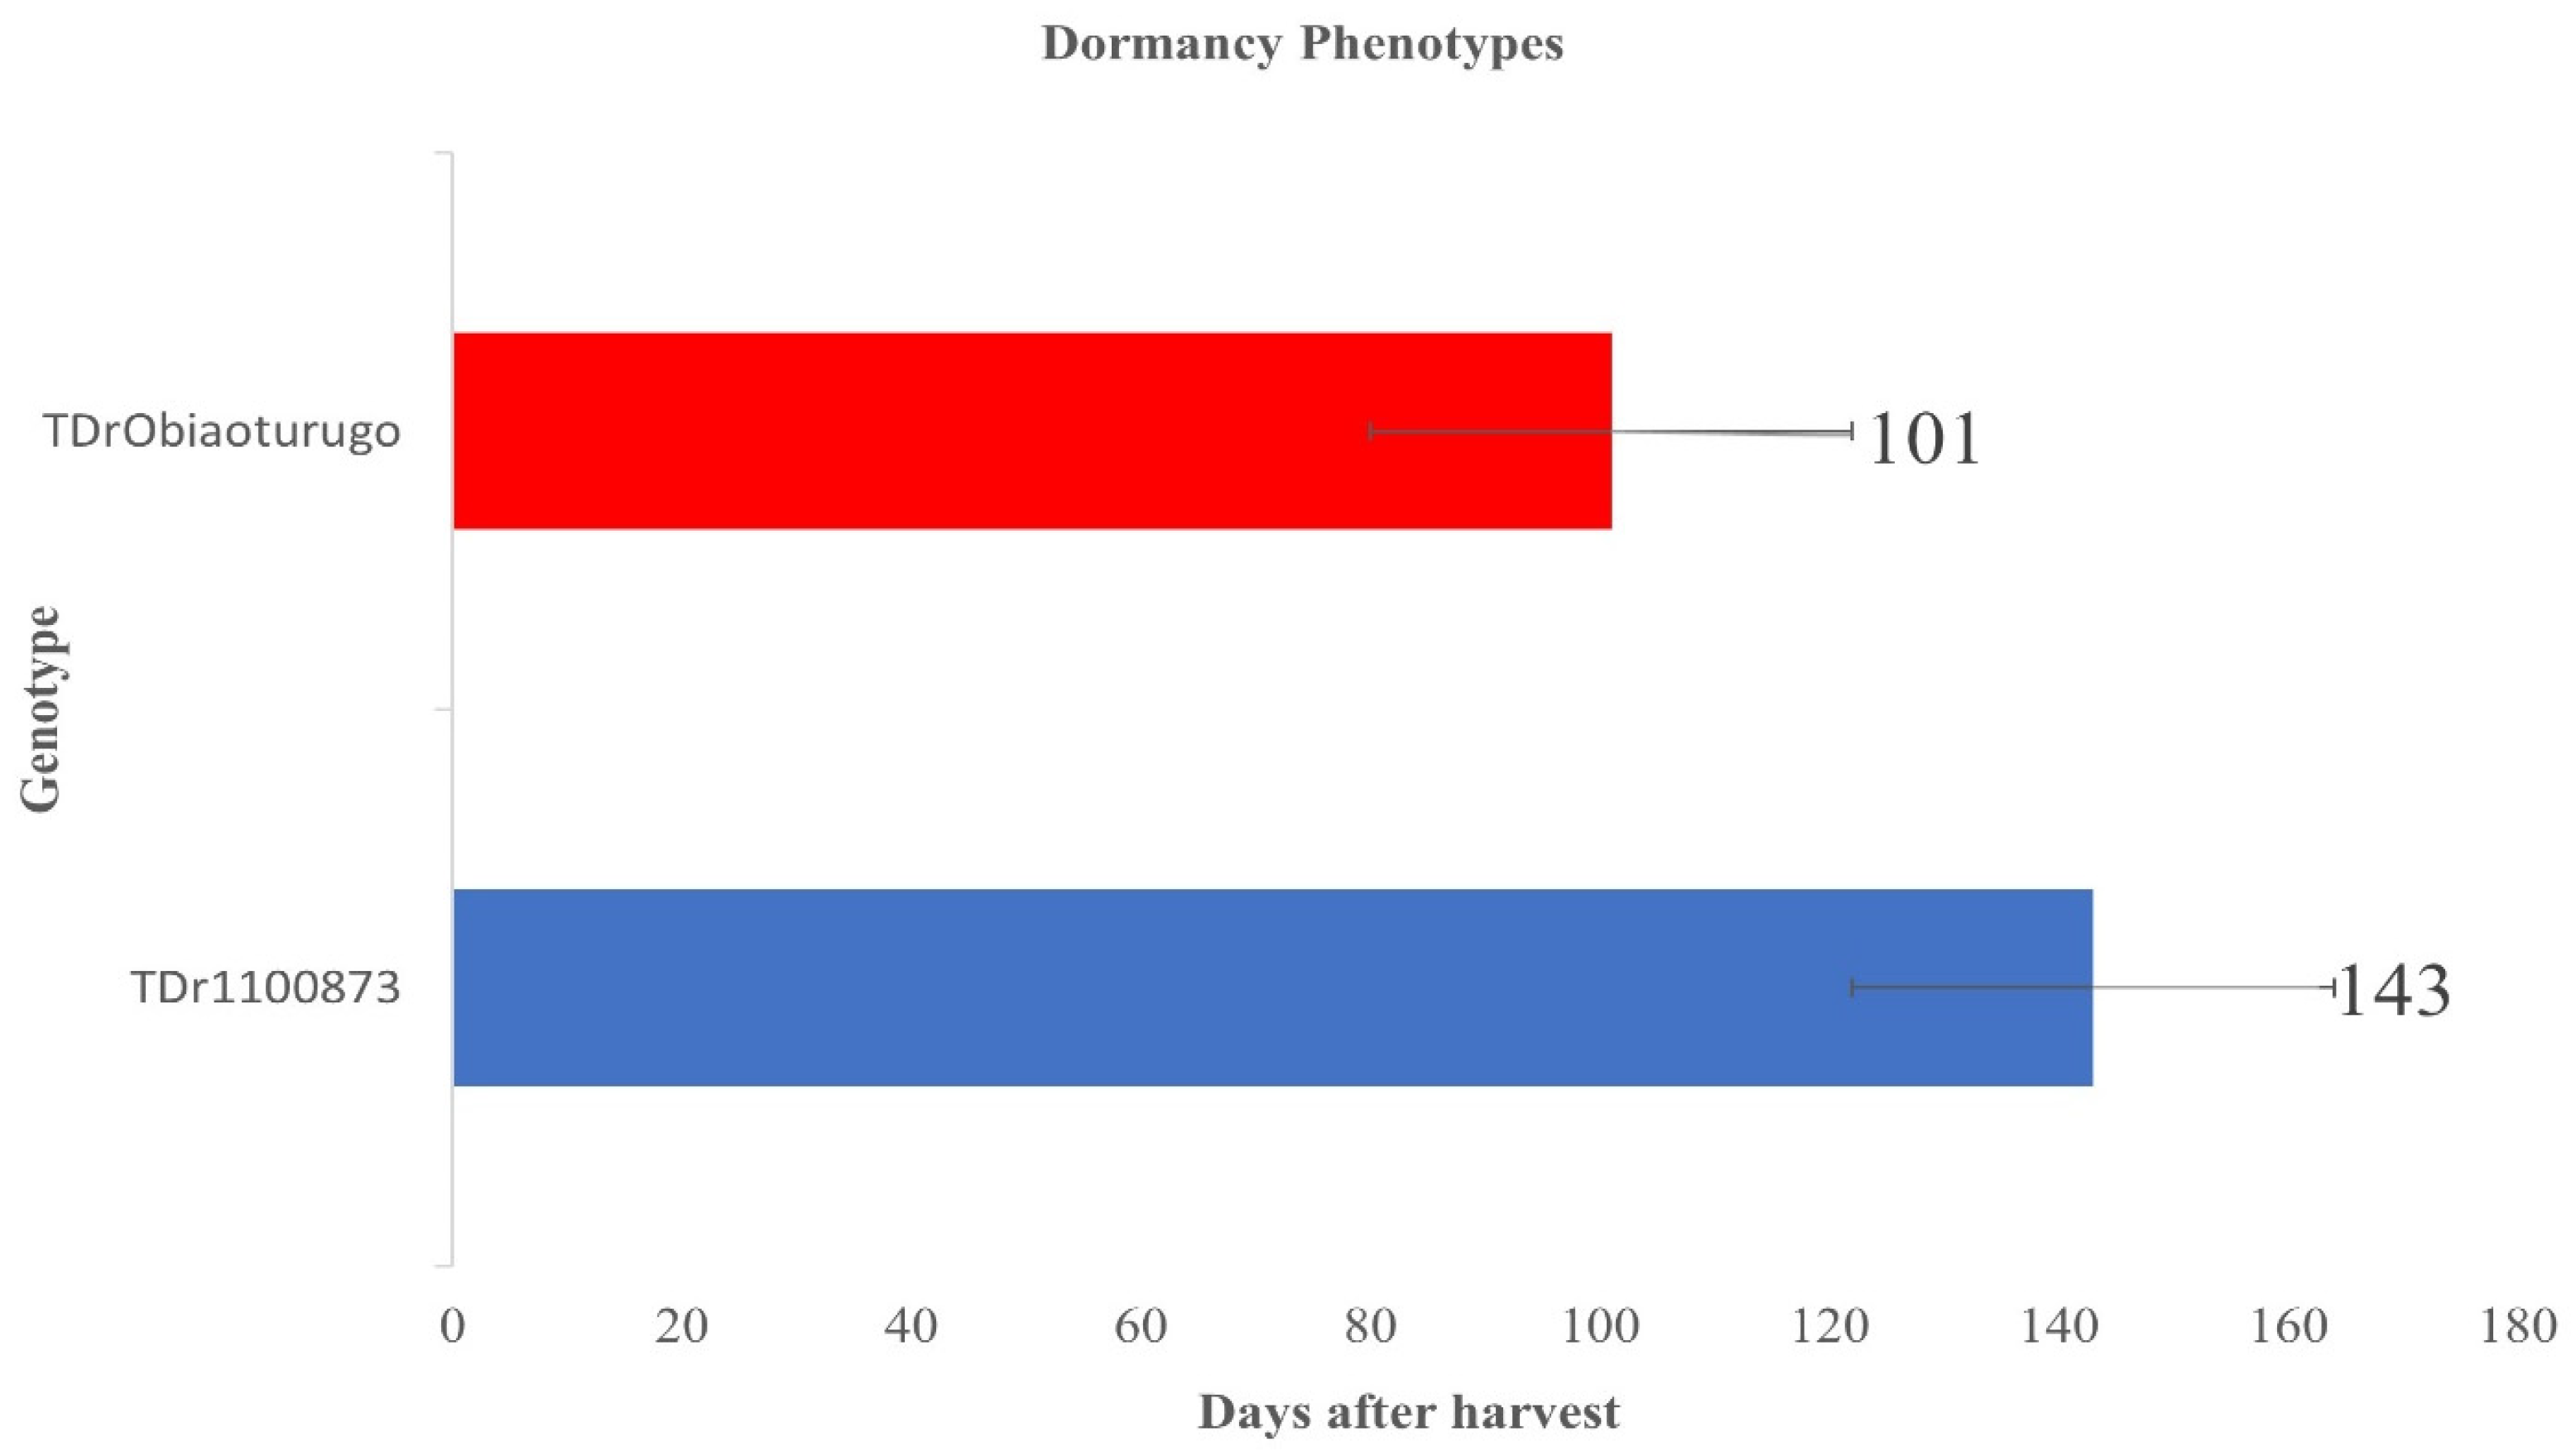
3.1. Tuber Dormancy Duration

The two genotypes exhibited different dormant genotypes. Figure 1 shows the result of t-test analysis at (p = 0.05) and it indicates that the local genotype Obiaoturugo had a shorter dormancy duration, and sprouted on 101-DAPM, compared to the improved genotype (TDr1100873) which sprouted on 143-DAPM demonstrating its longer dormant phenotype with a 42-day difference.

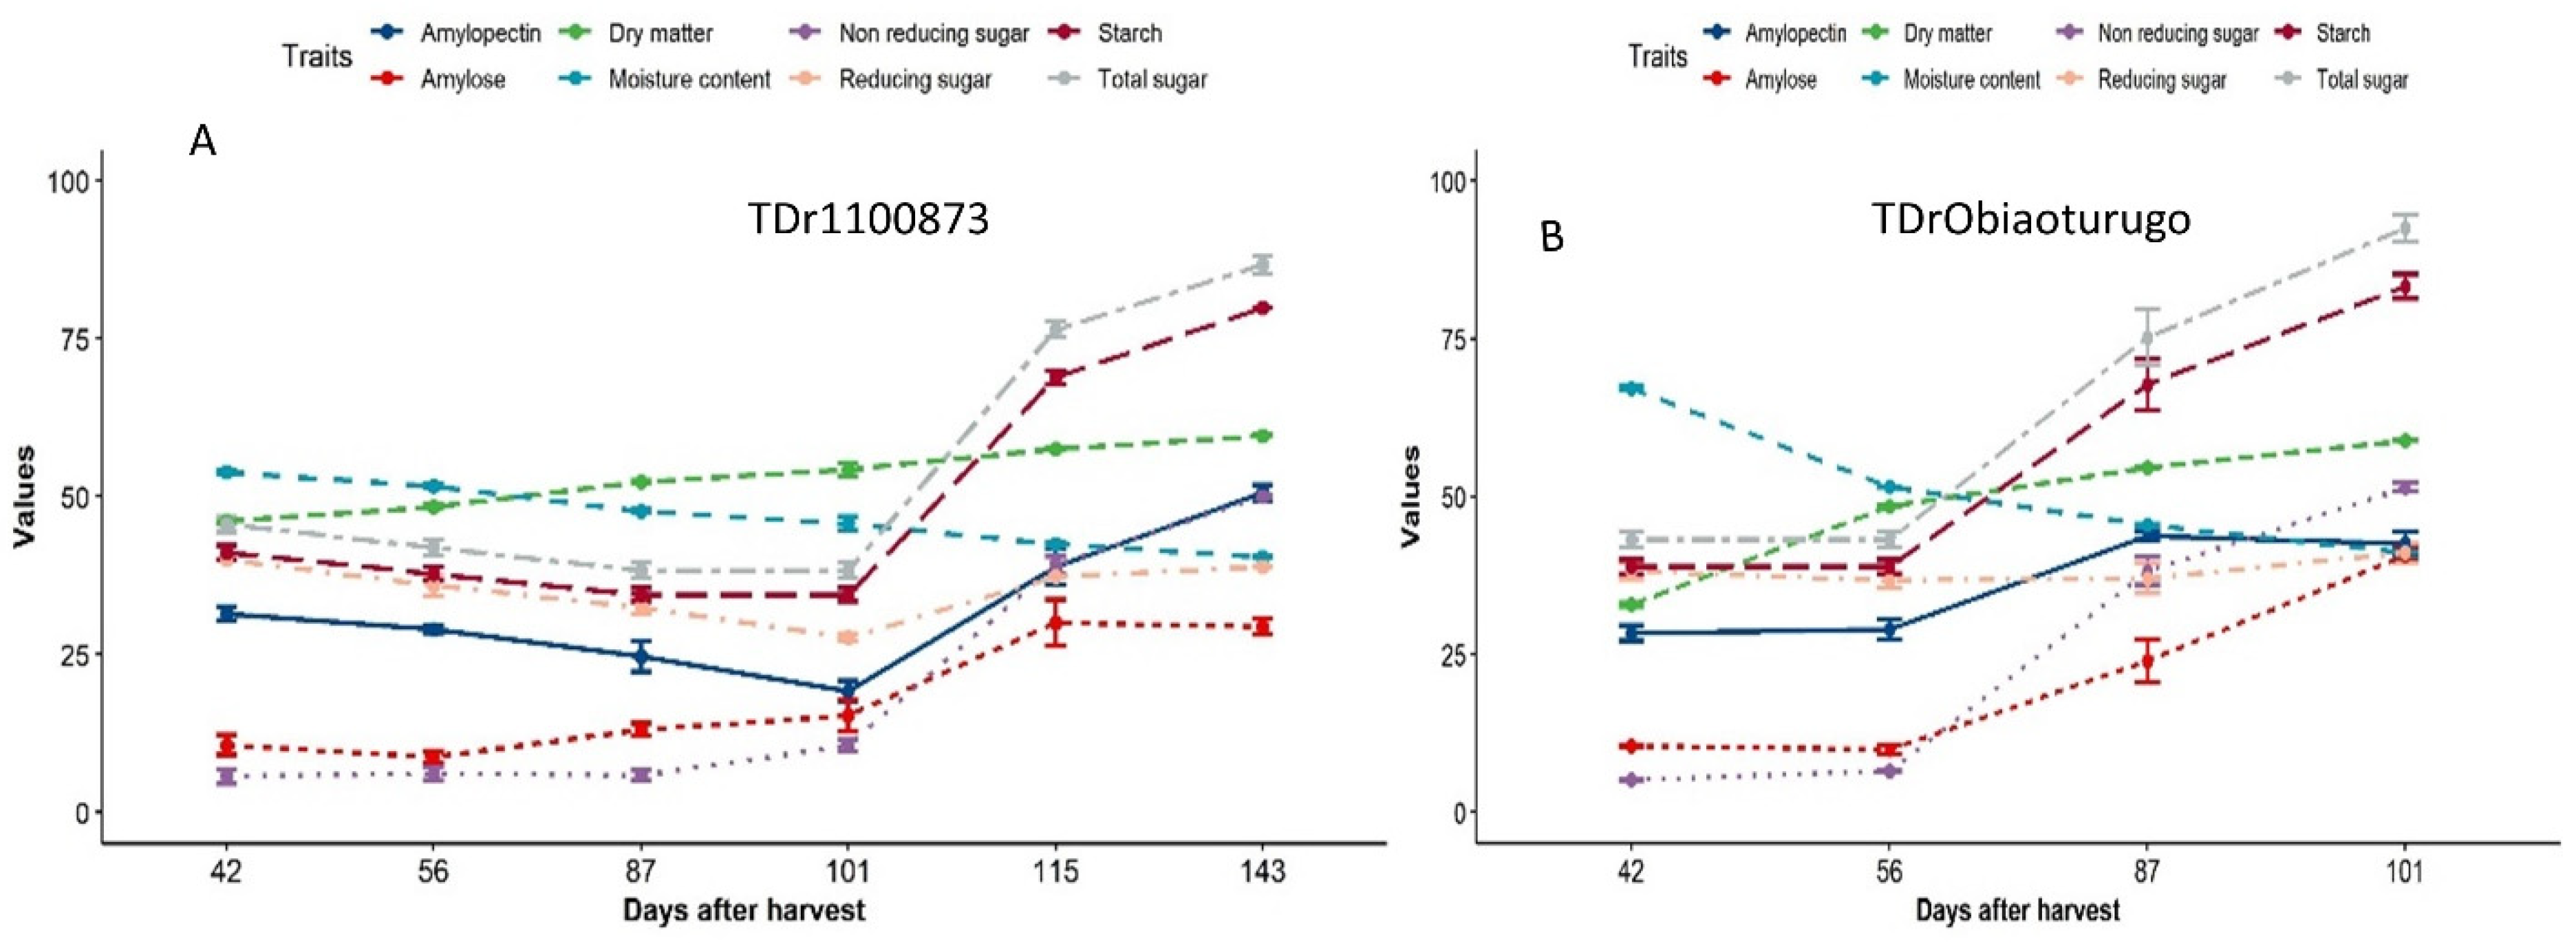
3.2. An Overview Changes in the Metabolic Status of Non-Structural Sugar, Dry Matter and Moisture Content of White Yam Tubers during Dormancy

The trend of metabolic changes in non-structural sugar, dry matter, and moisture content from tuber physiological maturity to sprouting in the two genotypes is similar. Figure 2A,B shows the changes in the estimated sugar parameters, dry matter, and moisture content from dormancy to sprouting in both genotypes. In TDr1100873, it was observed that all the non-structural sugar parameters investigated did not exhibit any significant metabolic change from 42-DAPM to 101-DAPM, but immediately after this period, spikes were observed in all until the sprouting point (143-DAPM) (Figure 2A). It is worth noting that the 101-DAPM data point was 15 days before the appearance of the shoot bud. This occurred in TDr1100873, which occurred at 115-DAPM. No significant changes in non-structural sugar content, dry matter, or moisture content were observed for Obiaoturugo between 42-DAPM and 56-DAPM, although significant changes were observed between 56-DAPM and 101-DAPM. It was observed that amylopectin in Obiaoturugo increased from 56-DAPM to 87-DAPM and decreased as the genotype approached physical sprouting. 56-DAPM, which marks the beginning of rapid increments in the sugar parameters measured, occurred 31 days before the appearance of shoot buds, which occurred on 87-DAPM in Obiaoturugo (Figure 2B).
Dry matter in both genotypes increased gradually from 42-DAPM until the tuber sprouting points (143-DAPM and 101-DAPM) in TDr1100873 and Obiaoturugo, respectively. Conversely, a similar trend was observed in moisture content in the reversed order in both genotypes. Moisture decreased gradually from 42-DAPM to 143-DAPM and 101-DAPM in TDr1100873 and Obiaoturugo, respectively.

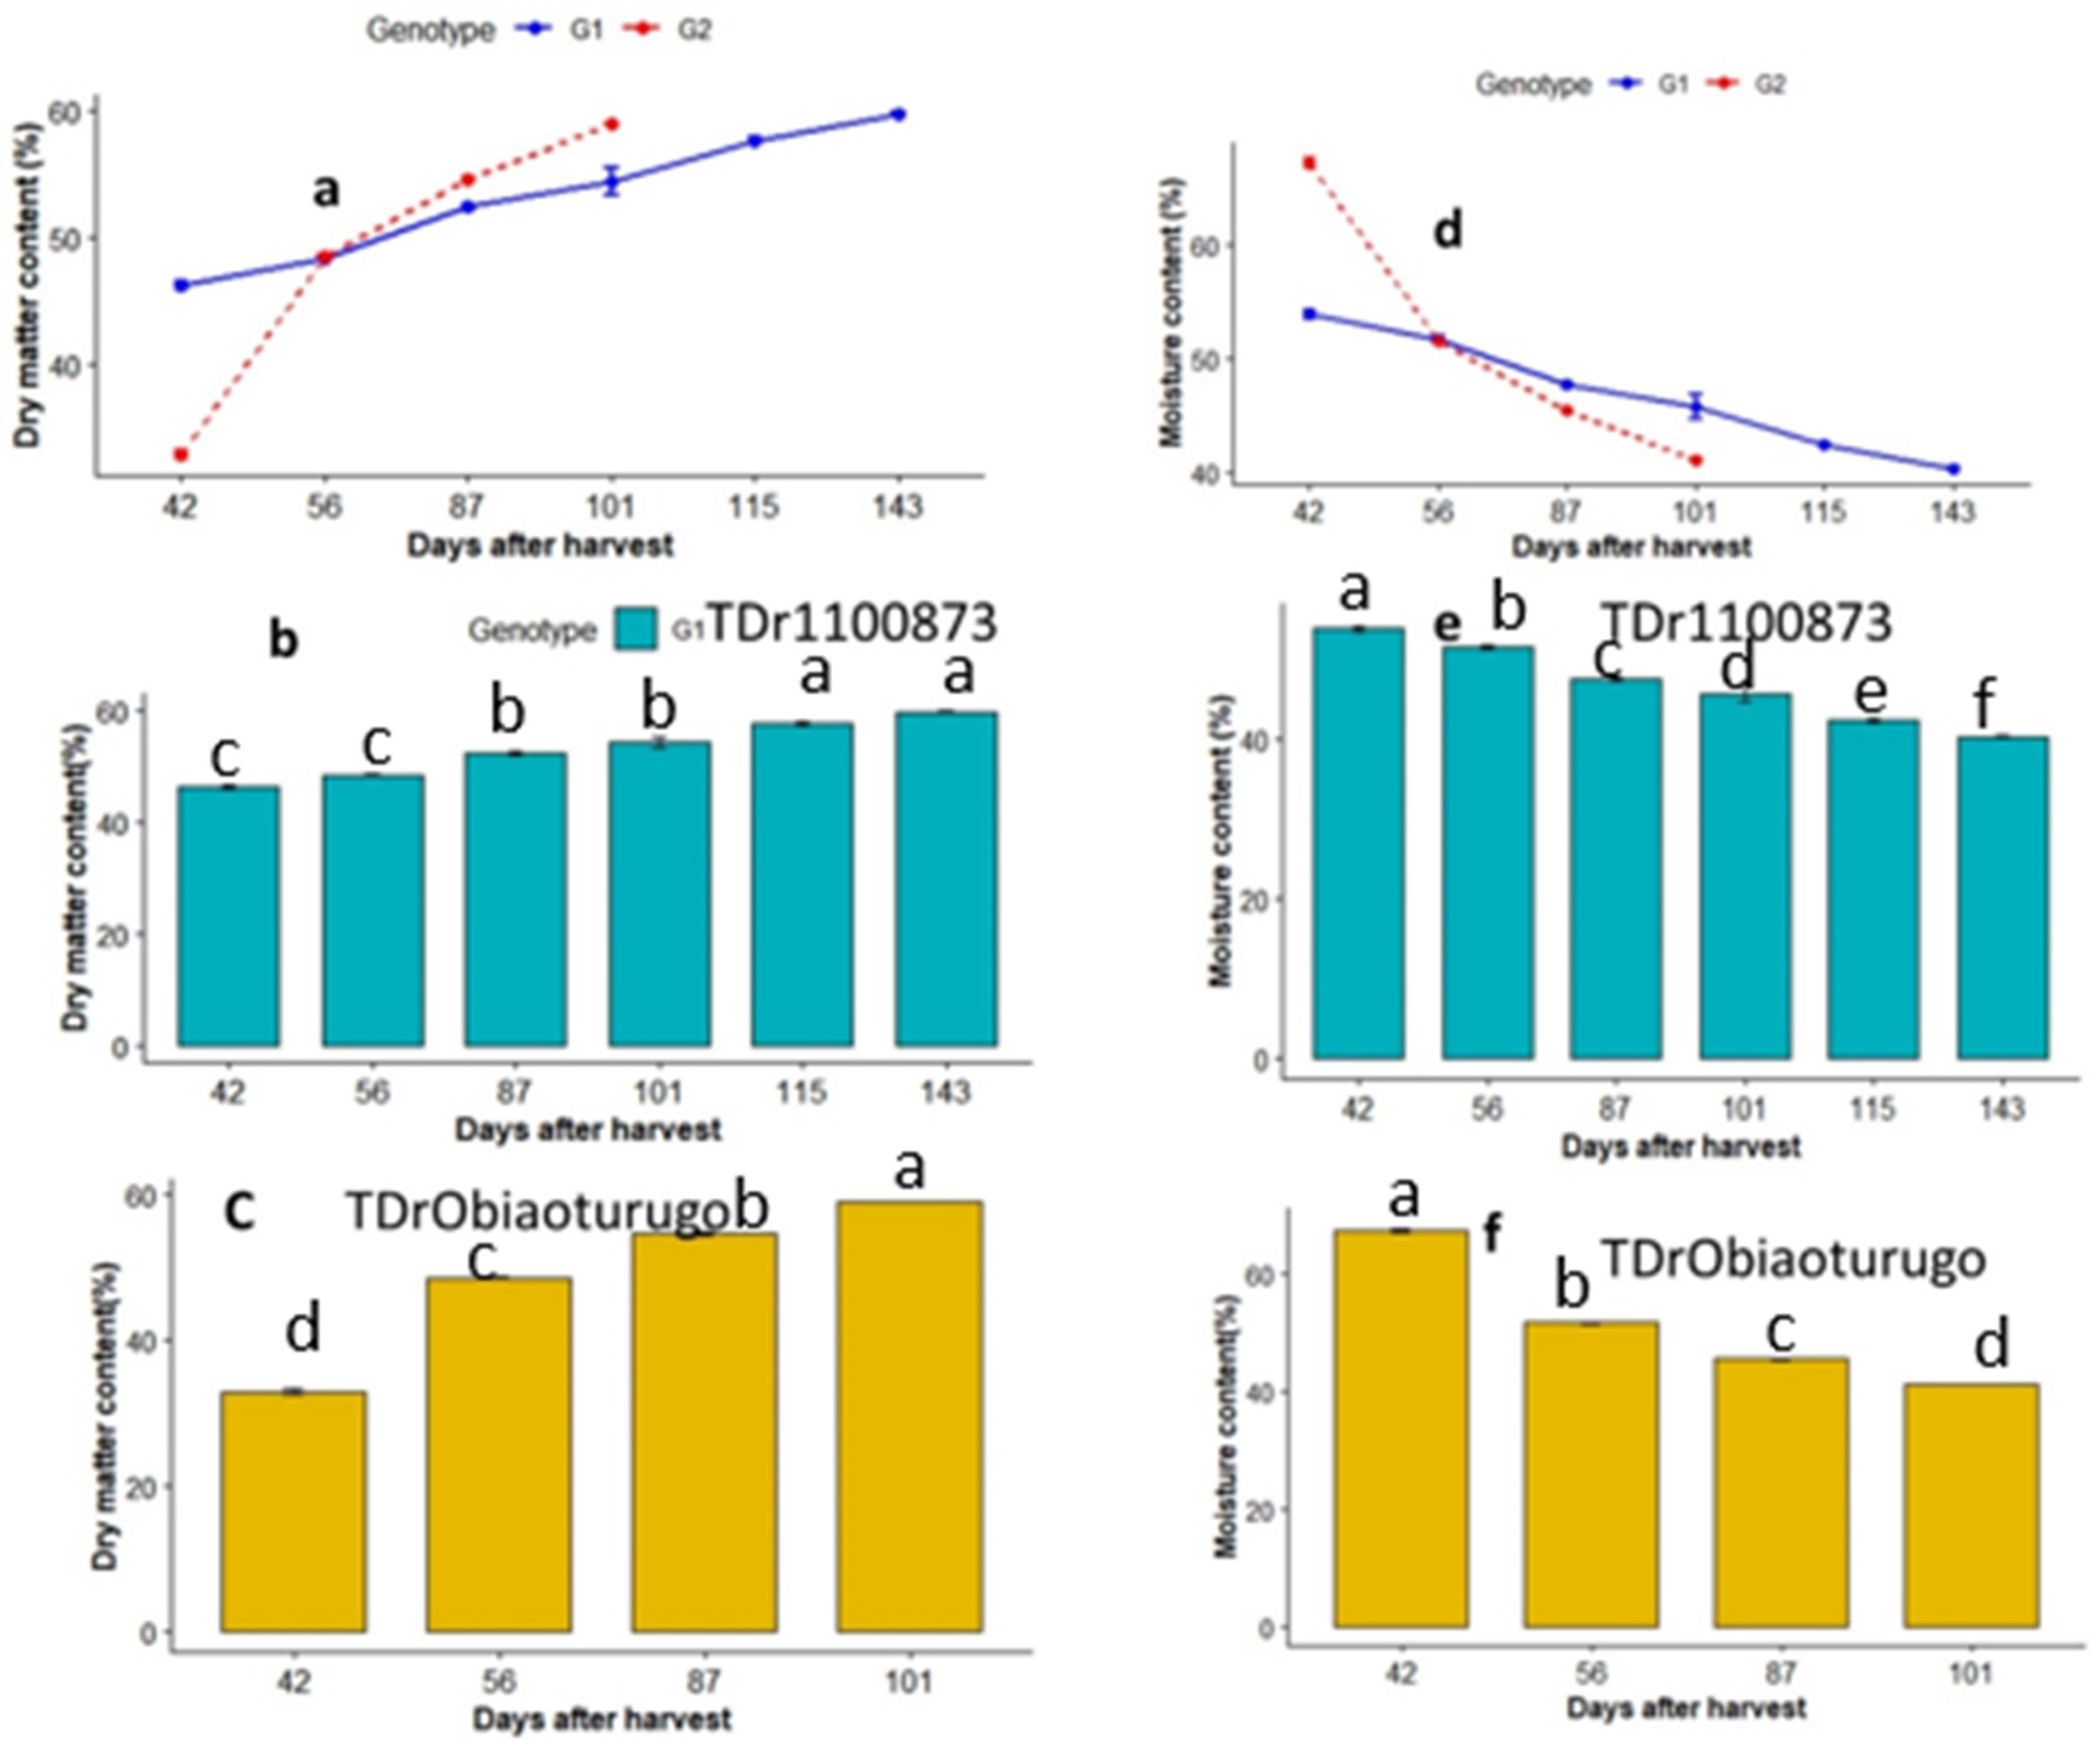
3.3. Dry Matter and Moisture Content

Changes in dry matter and moisture content in the two genotypes from dormancy to tuber sprouting are shown in Figure 3a–f. At 42-DAPM, the dry matter content of (G1:TDr1100873) was significantly higher than that of the short dormant (G2: Obiaoturugo) (Figure 3a). However, as dormancy progresses, at 56-DAPM, there was a switch in the quantity of dry matter content; the dry matter in Obiaoturugo increased above that of TDr1100873 and maintained a significantly higher dry matter content until it sprouted at 101-DAPM. Figure 3b shows that the dry matter of TDr1100873 increased from 46.12% at 42-DAPM to 59.91% at 143-DAPM; however, a significant difference was observed only between the dry matter content at 42-DAPM and 143-DAPM (sprouting point). Similarly, Figure 3c shows that the dry matter content of Obiaoturugo increased from 32.83% at 42-DAPM to 58.88% at 101-DAPM, when it sprouted. The moisture content followed a similar trend as dry matter in the opposite order. Figure 3d shows that moisture content decreased from 59.88% at 42-DAPM to 40.09% at 143-DAPM in TDr1100873, and from 67.17% at 42-DAPM to 40.12% at 101-DAPM in Obiaoturugo. The high moisture content of Obiaoturugo decreased to an amount equal to that of TDr1100873 at 56-DAPM and maintained significantly lower values until 101-DAPM, when it sprouted. Figure 3e shows the changes in moisture content from dormancy to tuber sprouting of TDr1100873. A significant change was observed only between 42-DAPM and 143-DAPM. Figure 3f shows that in Obiaoturugo, a significant change in moisture content was observed only between 42-DAPM and 101-DAPM.

3.4. Metabolic Status of Non-Structural Sugar in White Yam Tubers from Dormancy to Sprouting

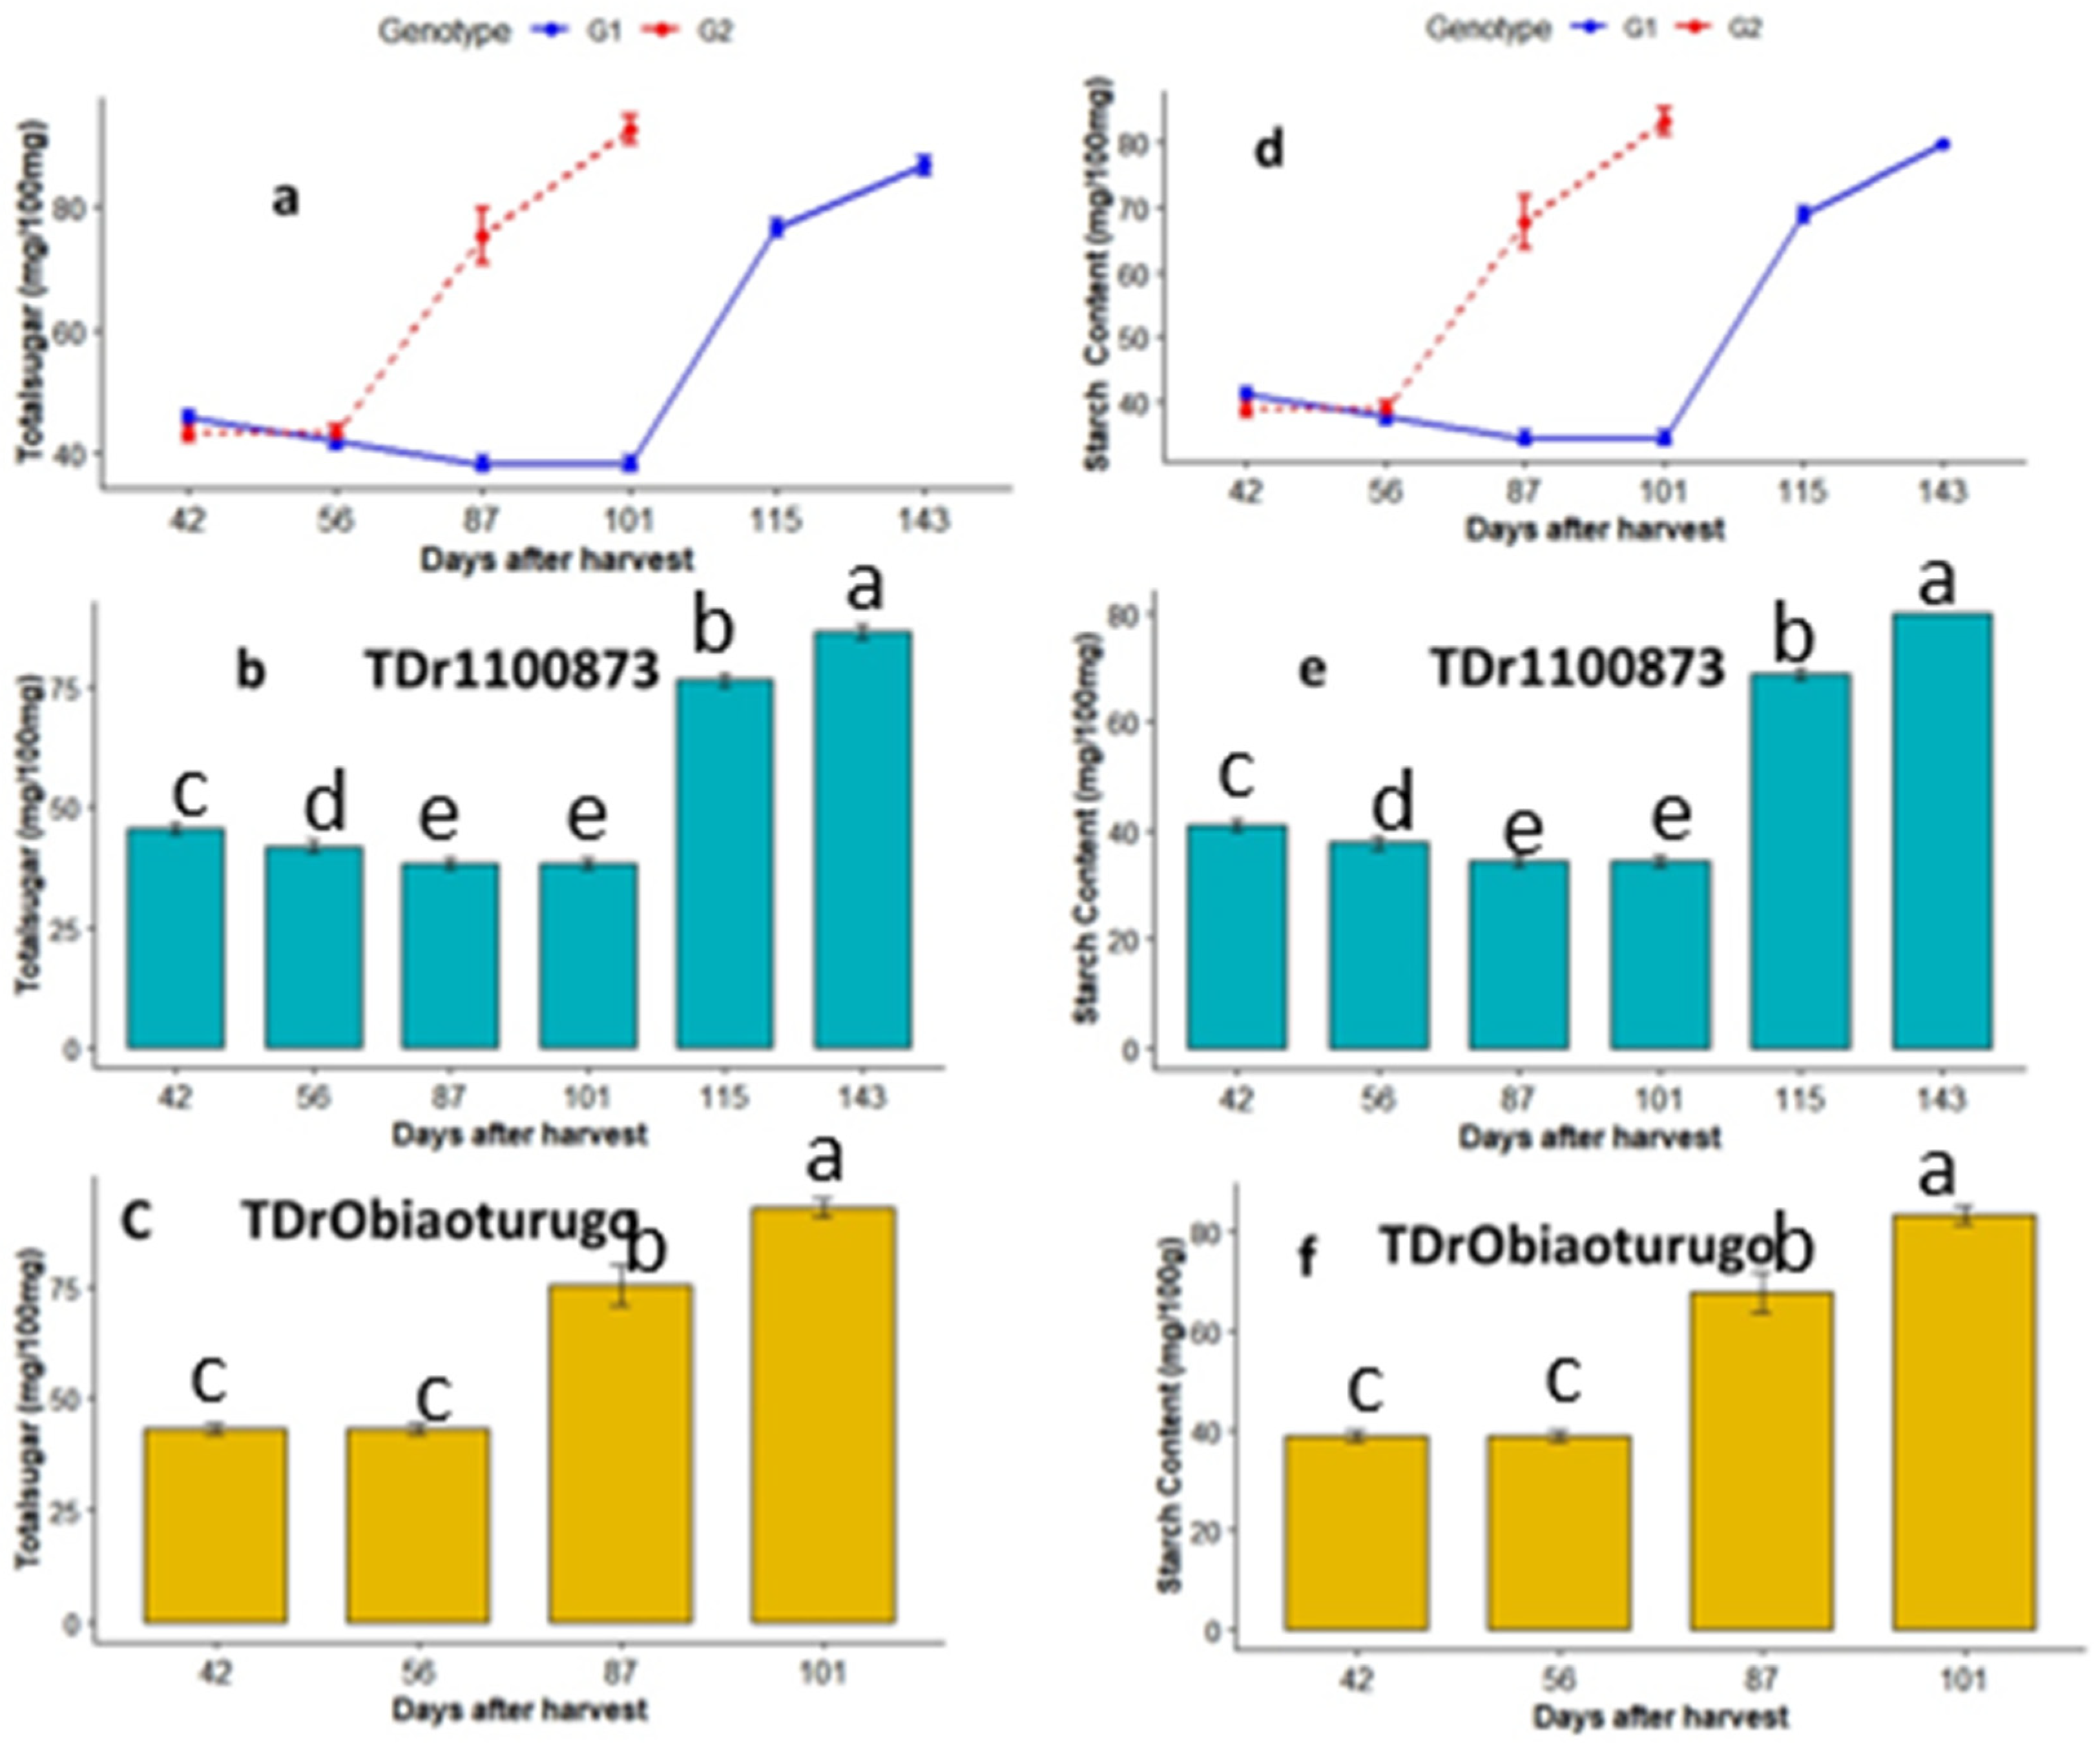
3.4.1. Total Sugar and Starch

The metabolic changes in total sugar and starch from dormancy to tuber sprouting are shown in Figure 4a–f. Figure 4a shows the trend of changes in total sugar between the two white yam genotypes. There were significant differences between TDr1100873 and Obiaoturugo across the sampled dormancy stages, except at 56DAPM. In TDr1100873, there was a gradual decrease in total sugar from 42-DAPM to 101-DAPM, which is the data point before the appearance of shoot buds, after which a rapid increment was observed until the tuber sprouted. Similarly, in Obiaoturugo, there was no change in total sugar between 42-DAPM and 56-DAPM, but from 56-DAPM, which was also the data point before the appearance of shoot buds, there was a rapid increase until the tuber sprouting stage at 101-DAPM. Figure 4b shows that there were no significant changes in total sugar content in TDr1100873 from 42-DAPM to 101-DAPM, after which significant increments were observed from 115-DAPM to 143-DAPM. The total sugar content in TDr1100873 at 115-DAPM and 143-DAPM was 38.24 mg/100 mg and 48.47 mg/100 mg, respectively. They were higher than the total sugar content recorded at 101-DAPM. Similarly, Obiaoturugo recorded total sugar content at 87-DAPM (28.03 mg/100 mg) and 101-DAPM (49.33 mg/100 mg). These values were higher than those at 42-DAPM and 56-DAPM (Figure 4c). Since starch content was estimated by multiplying the total sugar by the conversion factor of 0.9, similar trends in total sugar content were observed in starch content, as shown in Figure 4d–f.

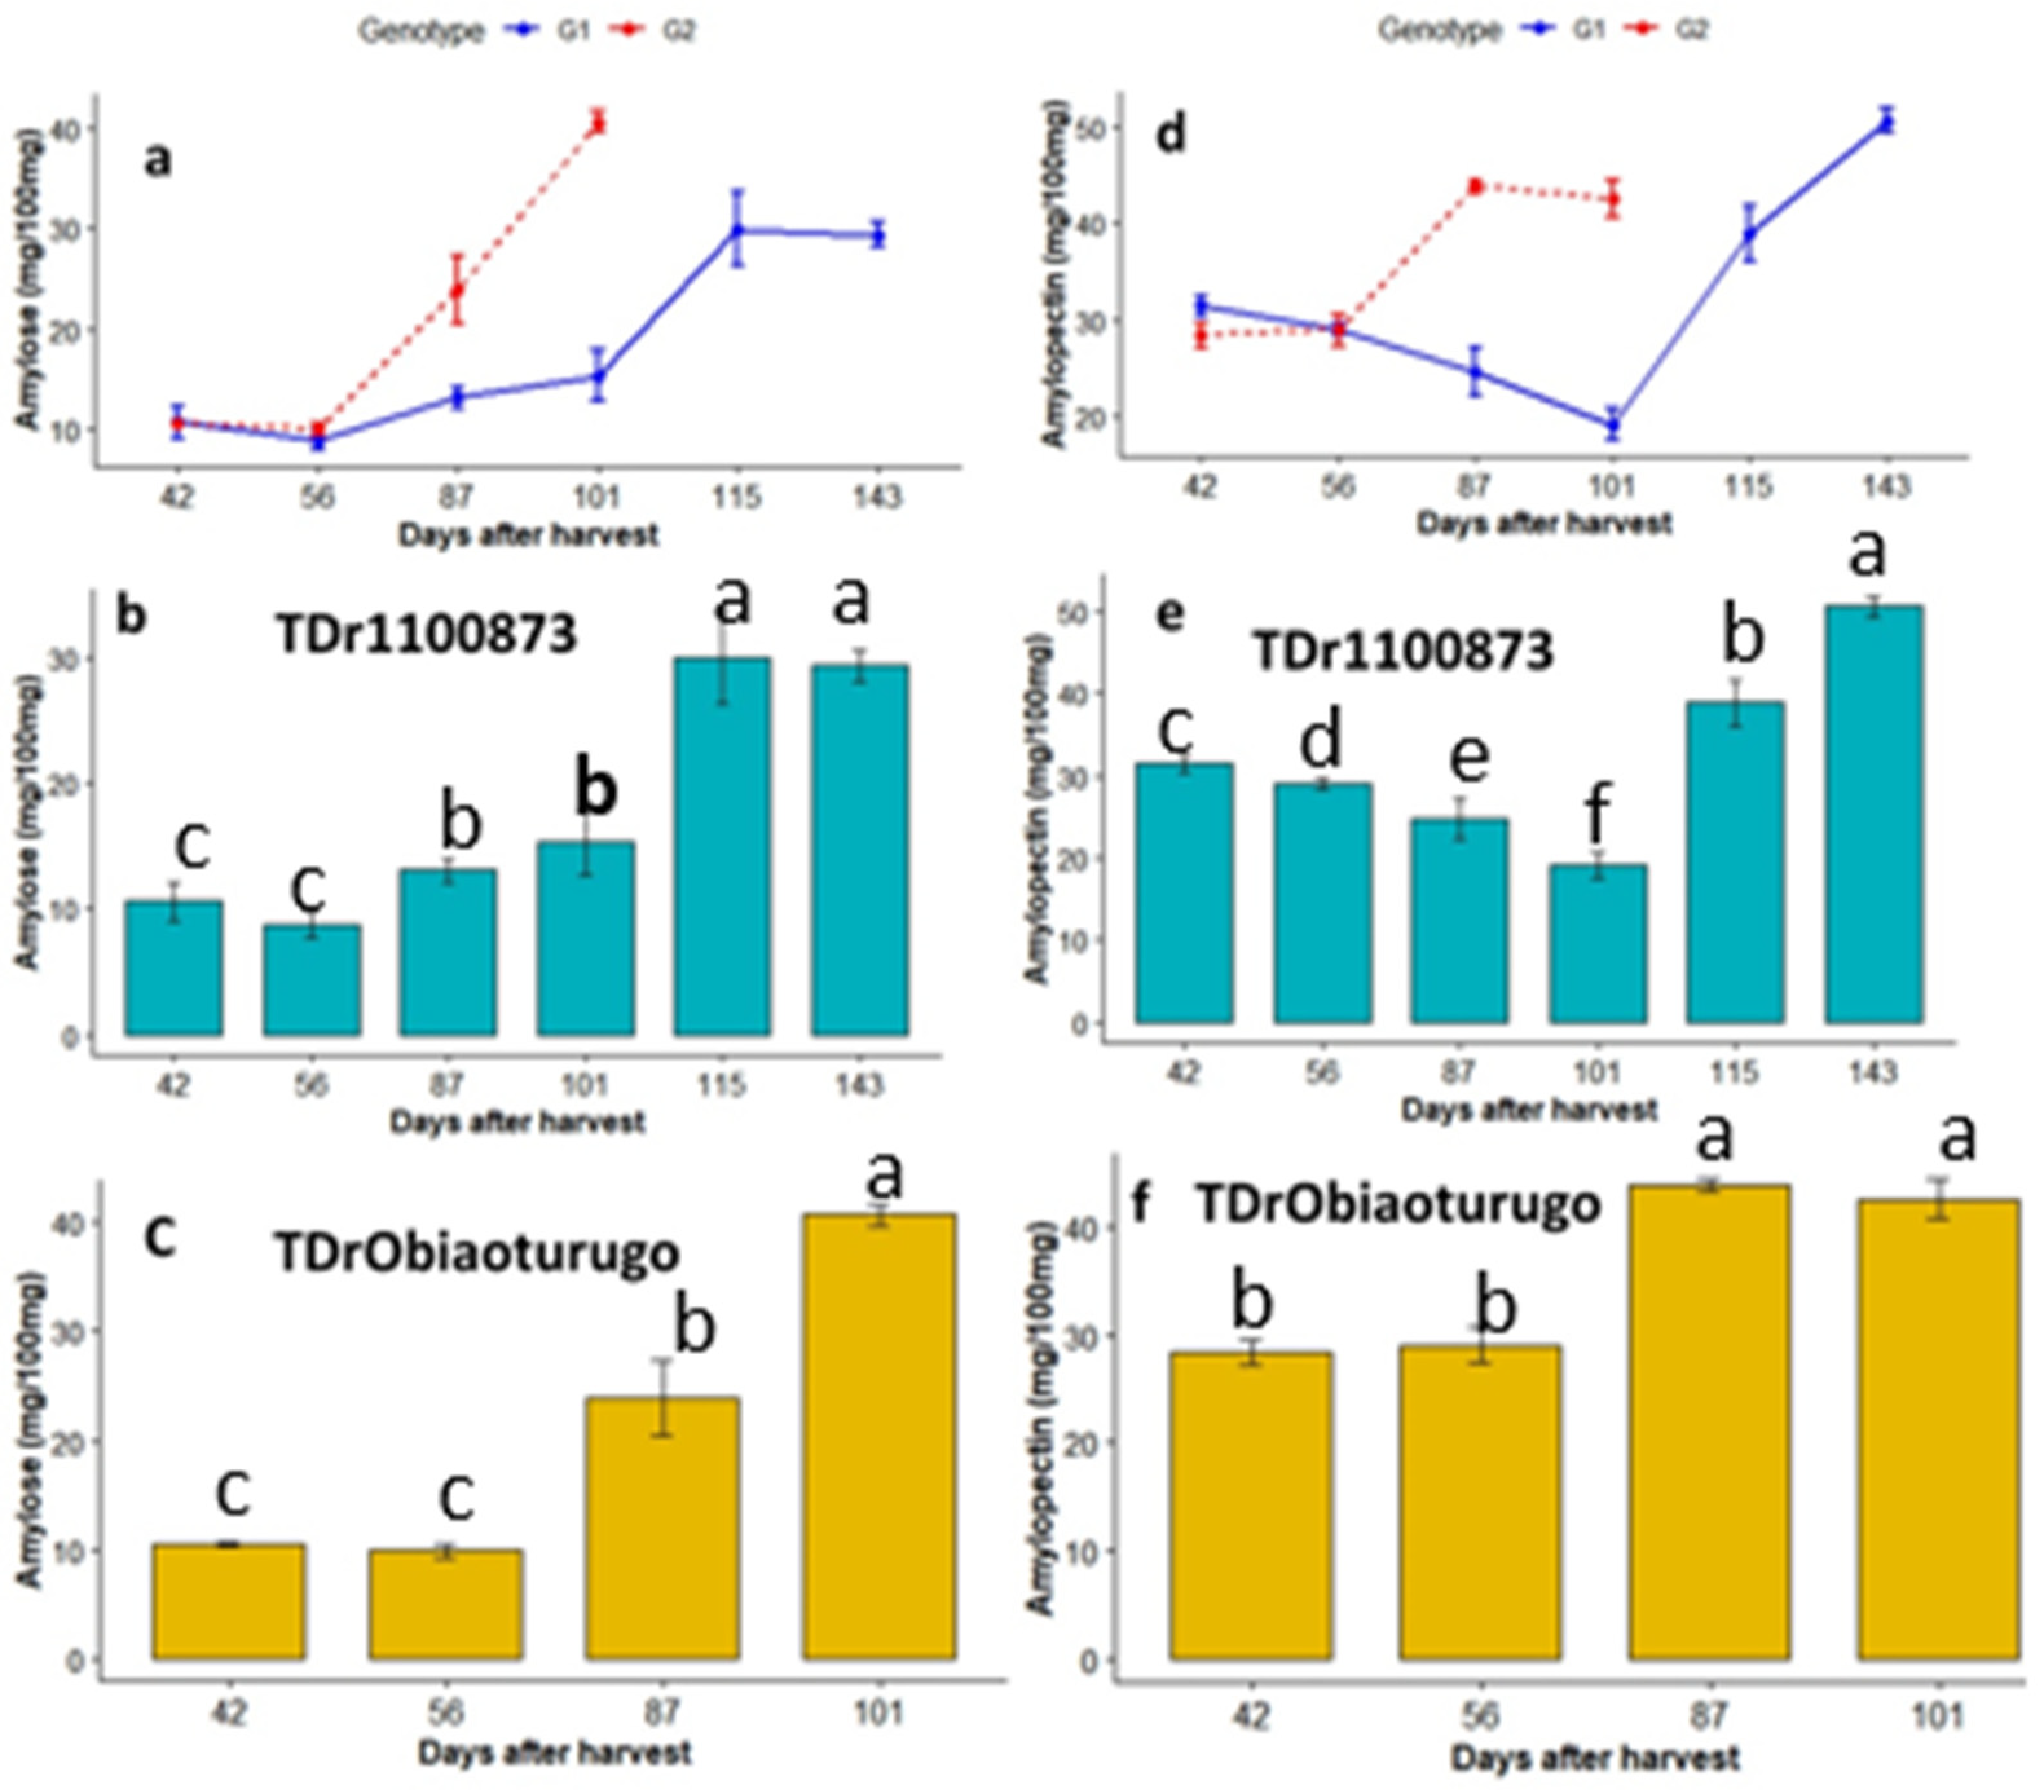
3.4.2. Amylose and Amylopectin

The metabolic changes in amylose and amylopectin in the two white yam genotypes from tuber dormancy to sprouting are shown in Figure 5a–f. The results indicate that at all sampled dormancy stages, amylopectin was more than 2-fold higher than amylose, except at 101-DAPM in TDr1100873. Significant differences were observed between the two yam genotypes in amylose content at 87-DAPM and 101-DAPM but not at 42-DAPM and 56-DAPM (Figure 5a). Rapid increments in amylose content were observed from 56-DAPM to tuber sprouting in both yam genotypes. Figure 5b shows the metabolic changes in amylose content across the studied dormancy stages in TDr1100873. Significant differences were observed between amylose content at 115-DAPM and (101-DAPM, 87-DAPM, 56-DAPM, 42-DAPM). The highest amount of amylose content (29.97 mg/100 mg) was observed at 115-DAPM (appearance of shoot bud stage), while the lowest content (8.76 mg/100 mg) was observed at 56-DAPM.
Figure 5c shows significant differences in amylose content in the tuber of Obiaoturugo across the studied dormancy stages, except between 42-DAPM and 56-DAPM. The highest amount of amylose content (41.83 mg/100 mg) was observed in the sprouted tuber of Obiaoturugo at 101-DAPM, and it was 31.96 mg/100 mg, significantly higher than the 9.87 mg/100 mg (lowest content) observed at 56-DAPM. Figure 5d shows the trend of amylopectin metabolism in the two genotypes during tuber dormancy. There were significant differences between the genotypes at all studied dormancy stages, except at 56-DAPM. After 56-DAPM, Obiaoturugo recorded significantly higher amylopectin content until the tuber sprouted at 101-DAPM. There was a gradual decrease in amylopectin content from 42-DAPM to 101-DAPM in the tubers of TDr1100873, then a rapid increase from 101-DAPM to 143-DAPM (tuber sprouting point) (Figure 5e). The highest amylopectin content (50.57 mg/100 mg) was observed on the sprouted tuber of TDr110873 at 143-DAPM. It was 31.45 mg/100 mg higher than the lowest content (19.12 mg/100 mg) observed at 101-DAPM. In Obiaoturugo, amylopectin content at 87-DAPM and 101-DAPM was significantly higher than at 42-DAPM and 56-DAPM (Figure 5f). The highest amylopectin content (43.78 mg/100 mg) was observed at the appearance of the shoot bud stage (87-DAPM). This was 15.41 mg/100 mg higher than the lowest amylopectin quantity (28.37 mg/100 mg) recorded at 42-DAPM.

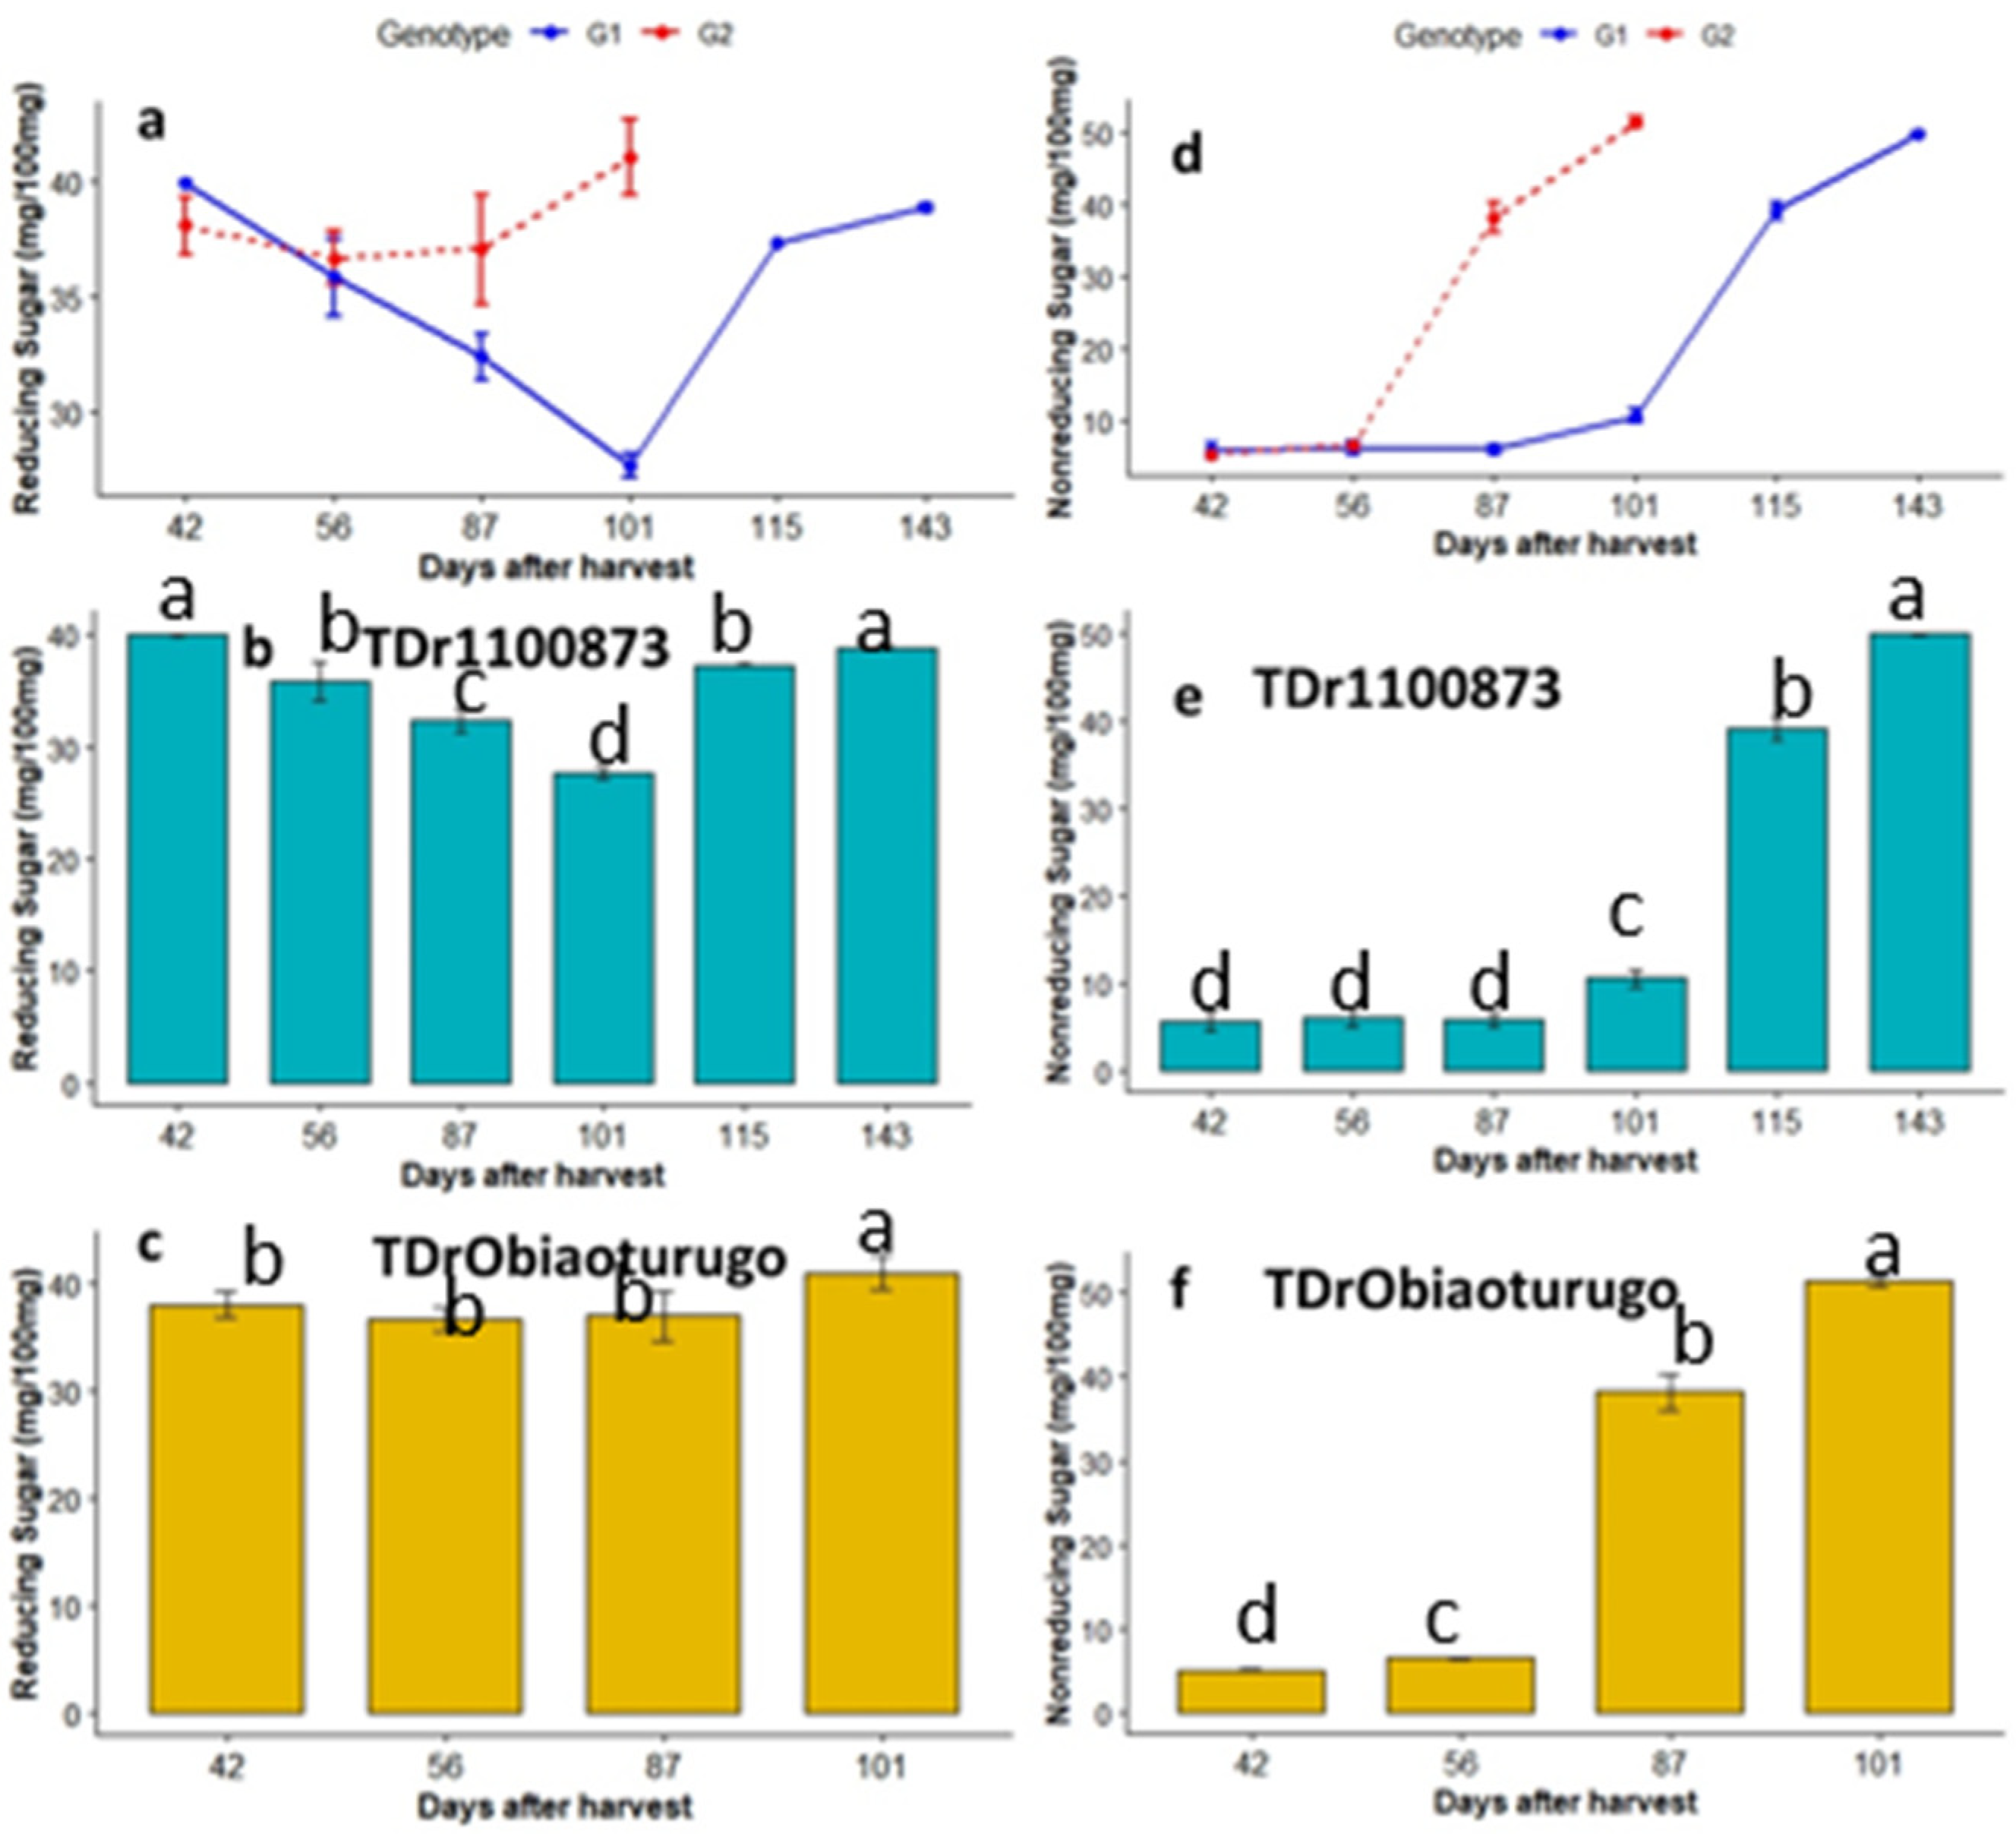
3.4.3. Reducing and Non-reducing Sugars

Metabolic changes in reducing and non-reducing sugars in the two white yam genotypes during tuber dormancy are presented in Figure 6a–f. Figure 6a shows that Obiaoturugo recorded higher reducing sugars than TDr1100873 at all studied dormancy stages, except at 42-DAPM and 56-DAPM. In both genotypes, there was a decrease in reducing sugar at 42-DAPM, 56-DAPM, and 101-DAPM. After which, steady increases were observed until the tubers sprouted at 101-DAPM and 143-DAPM, in Obiaoturugo and TDr1100873, respectively. Figure 6b shows that there was a significant change in the reducing sugar content in the tubers of TDr1100873 between the 87-DAPM and 101-DAPM stages only. The highest reducing sugar content was observed at 42-DAPM, whereas the lowest reducing sugar content was observed at 101-DAPM. Figure 6c shows no significant difference in changes in reducing sugar content in the tubers of Obiaoturugo across the studied points, except at 101-DAPM (sprouted tuber).
The trend of metabolic changes in non-reducing sugars across the studied dormancy stages in both genotypes is presented in Figure 6d. It was observed that between the first two dormancy stages (42-DAPM and 56-DAPM), there were no significant differences between the two yam genotypes. However, after 56-DAPM, a significantly higher non-reducing sugar content was recorded in the tubers of Obiaoturugo than in the tubers of TDr1100873.
Figure 6e shows that there were significant changes in non-reducing sugar content in the tubers of TDr1100873 from 101-DAPM to 143-DAPM. The highest non-reducing sugar content (49.94 mg/100 mg) was recorded on sprouted tubers at 143-DAPM, and it was 44.25 mg/100 mg higher than the lowest quantity (5.69 mg/100 mg) recorded at 42-DAPM, which is equivalent to a 9-fold change. Similarly, in the tubers of Obiaoturugo, significant changes in non-reducing sugar content were observed from 56-DAPM to 101-DAPM (Figure 6f). The highest non-reducing sugar quantity (51.44 mg/100 mg) was observed on sprouted tubers at 101-DAPM, and it was 46.34 mg/100 mg higher than the lowest content (4.6 mg/100 mg) recorded on deep dormant tubers at 42-DAPM, which is equivalent to a 10-fold change. The summary of the pattern of changes observed in the tubers of the two yam genotypes studied with respect to non-structural sugar parameters, dry matter, and moisture content is reported in Table 1.

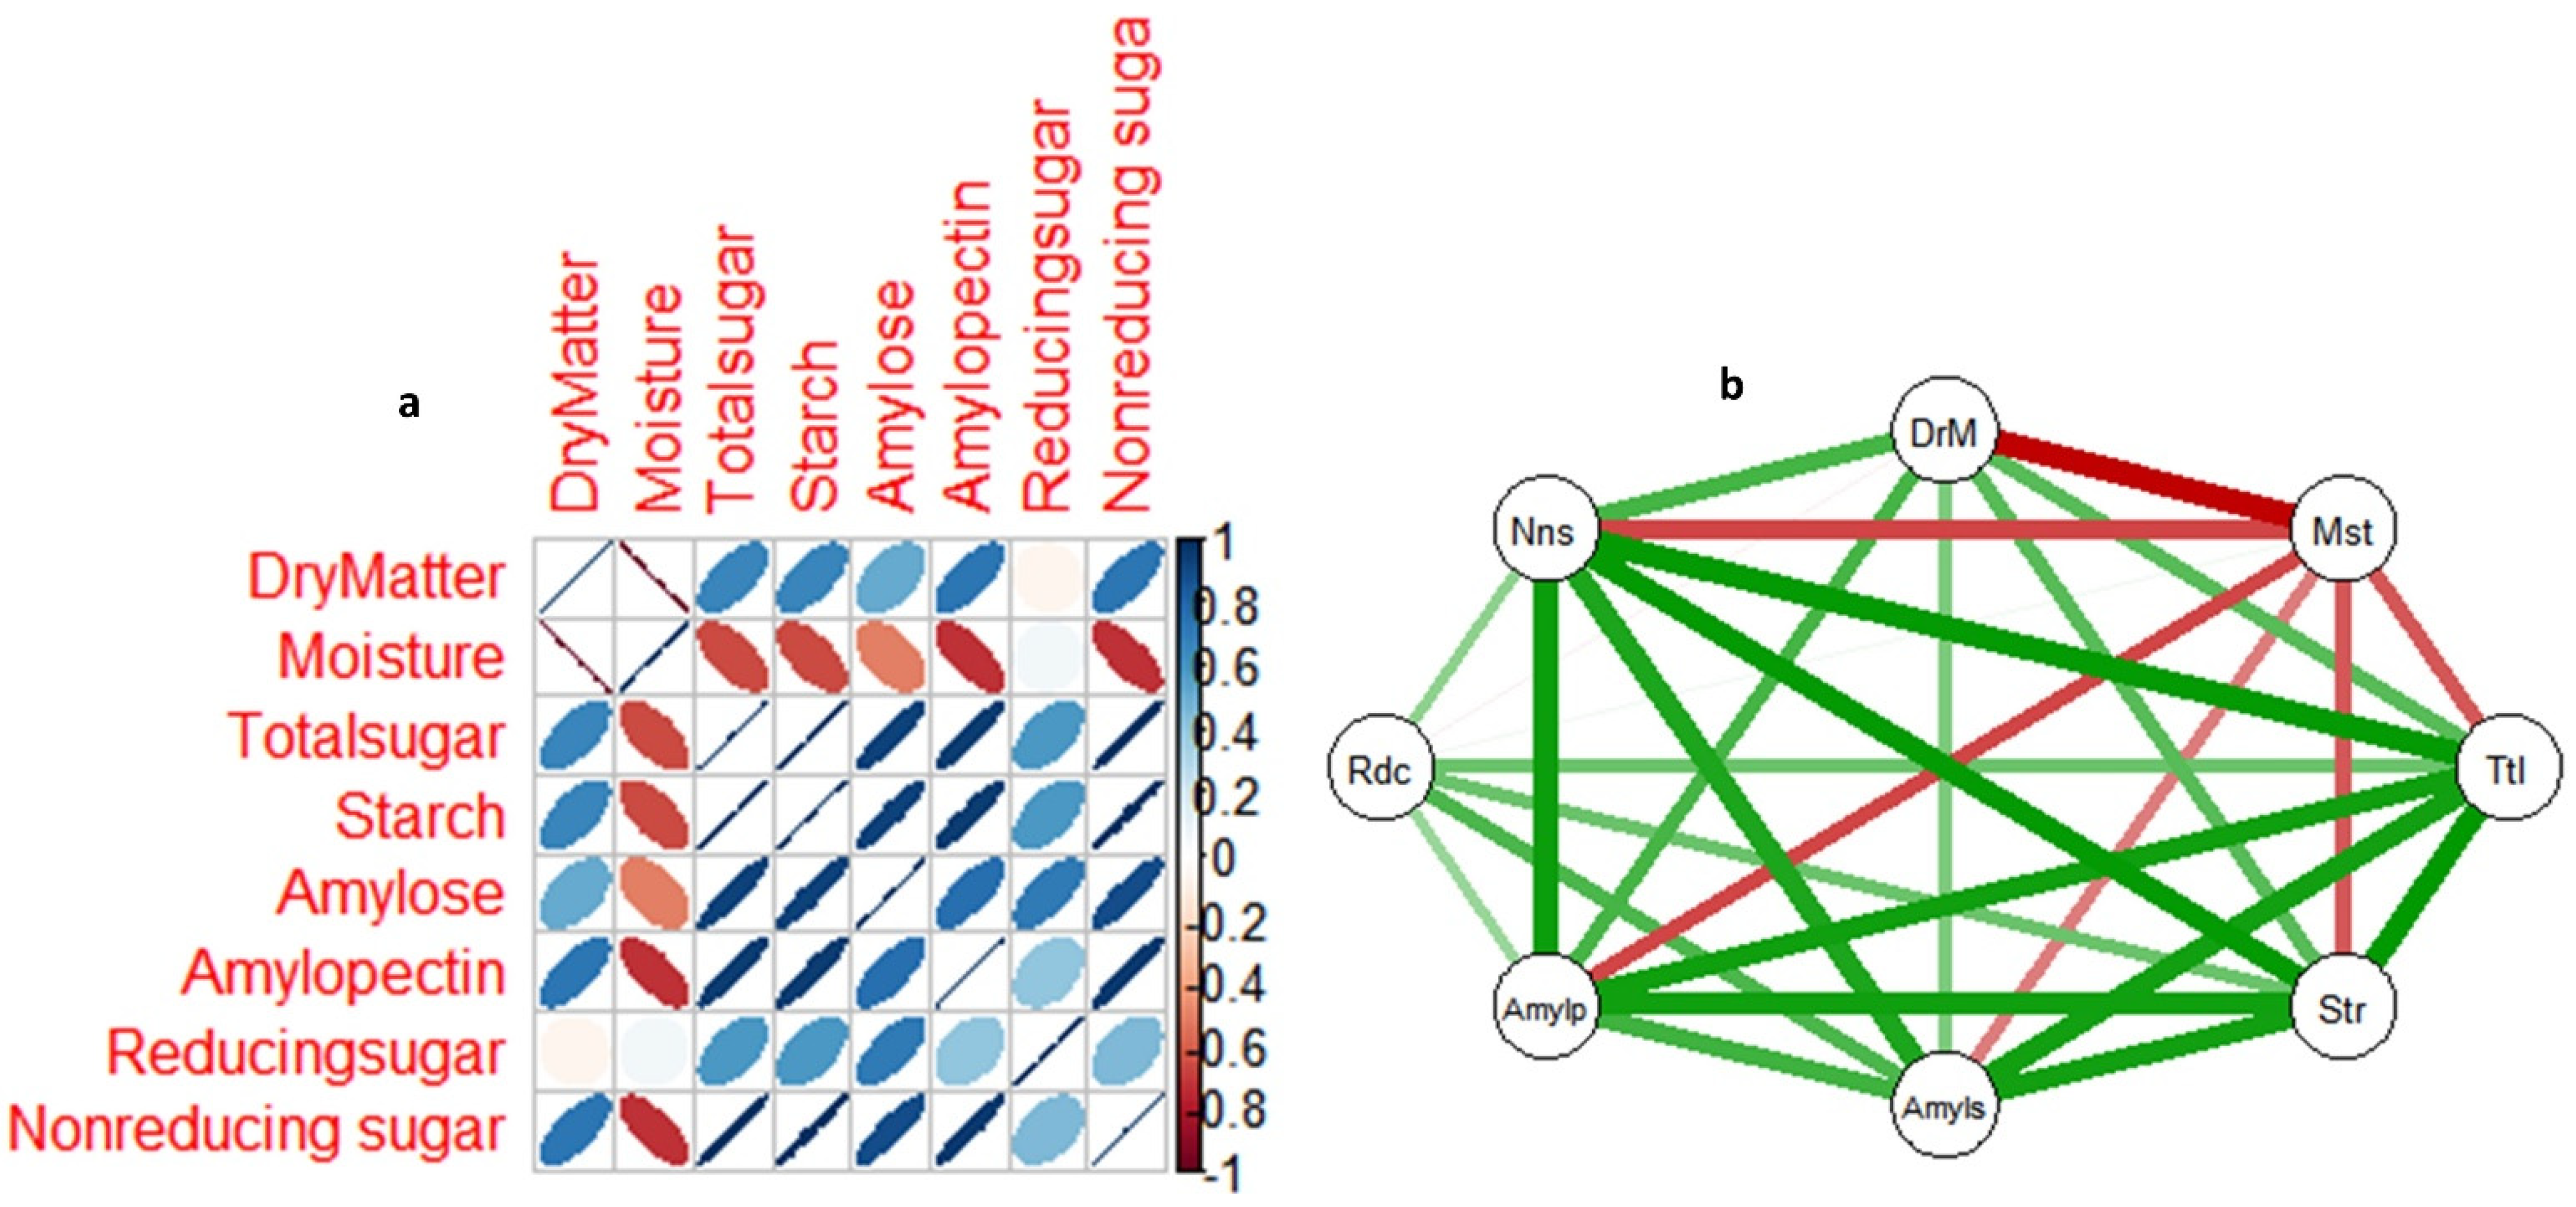
3.5. Correlations among Non-Structural Sugars, Dry Matter and Moisture Content in Yam Tuber from Dormancy to Sprouting

Figure 7a,b shows the correlation matrix among non-structural sugar parameters, dry matter, and moisture content in tubers of the two yam genotypes from dormancy to sprouting. Figure 7a shows that the coefficients of linear relationships among the non-structural sugar parameters, dry matter, and moisture content variables range from r = 0.2 to 0.8 and −0.2 to −0.8 at p = 0.05. The nature of the correlations among the variables (negative or positive) is indicated by red and blue colors, respectively. Whereas, the degree of the correlations is revealed by the correlation coefficient value and color intensity. Figure 7b presents another visualization of the same linear relationships among the variables using a nodes and edges network diagram. Positive and negative correlations were indicated with green and red lines, respectively. Color intensity indicates the degree of correlation. Most of the variables exhibited positive and significant correlations with each other, except moisture content, which exhibited negative and significant correlations with all other variables, with the exception of reducing sugars, which showed no correlations with dry matter or moisture content.

4. Discussions

The results of this study indicate that the two white yam genotypes investigated exhibited different dormancy phenotypes. Since both genotypes were subjected to the same treatment from field experimentation to post-harvest study, the only valid source of variation observed in tuber dormancy duration between the two genotypes could be genetic composition. This finding suggests that yam tuber dormancy is a variable trait. Significant changes in dry matter, moisture content, and six non-structural sugar parameters (total storable sugars, starch, reducing and non-reducing sugars, amylose, and amylopectin) in two white yam genotypes were observed at different stages of tuber dormancy progression. The observed trend signals change with respect to the aforementioned parameters. These changes were observed at the initial stage of dormancy breaking in both genotypes.
Dry matter was higher in the tubers of TDr1100873 at 42-DAPM, and this genotype exhibited a long dormant duration. At 56-DAPM, tubers of Obiaoturugo (short dormant phenotype) recorded higher dry matter content when compared to TDr1100873. The high rate of increase in dry matter in the tubers of Obiaoturugo as dormancy progresses could be attributed to the rate of moisture loss, which was higher in the tubers of Obiaoturugo as compared with TDr1100873. The high rate of moisture loss leads to a faster concentration of sugar solutes, especially the non-reducing sugar, thus providing the sufficient energy required to initiate the molecular processes towards dormancy breaking. This further leads to the early sprouting of tubers of Obiaoturugo at 101-DAPM. This showed a difference of 42 days when compared to the tubers of TDr1100873. In each of the genotypes, there was a gradual increase in dry matter content. The lowest dry matter content was observed at 42-DAPM, while the highest dry matter content was recorded on sprouted tubers. On average, both genotypes sprouted at 60% dry matter content, irrespective of the variations in their dormancy duration, indicating that the 60% dry matter content might be the critical threshold for tuber dormancy breaking in the white yam species. This is in agreement with the findings of [29,34,35], who reported 60.1%, 60.3%, and 59.7% dry matter content at tuber sprouting in white yam (Dioscorea rotundata), water yam (Dioscorea alata), and Chinese yam (Dioscorea esculenta), respectively. Obiaoturugo exhibited a fast rate of moisture loss and a short dormancy duration. In the tubers of Obiaoturugo, moisture content ranged from 40.12% to 67.17% between 42-DAPM and 101-DAPM at which tuber sprouting occurred. It took up to 143-DAPM for the moisture content in the tubers of TDr1100873 to be reduced from 53.88% to 40.09% (the equivalent of the moisture content recorded in the tubers Obiaoturugo). An average moisture content of 40% seems to be a critical threshold for tuber sprouting in both genotypes. Muzac-Tuker et al. (1993) also found a similar trend in water loss among Jamaica yams. This indicates that moisture content might have a strong influence on other factors that regulate energy metabolism during yam tuber dormancy.
Total storable sugars and starch exhibited a similar trend in the tubers of both genotypes. There was a slow decrease in total storable sugars and starch content from 42-DAPM to 101-DAPM, after which the rapid increment was recorded until the tuber sprouting stage in TDr110873. In the tubers of Obiaoturugo, a slow decrease in total storable sugar was observed from 42-DAPM to 56-DAPM, after which a rapid increment was recorded until the tuber sprouting stage. 101-DAPM was the dormancy stage before the appearance of shoot buds in the tubers of TDr110873, and 56-DAPM was the dormancy stage before the appearance of shoot buds in the tubers of Obiaoturugo. These results indicate that the molecular activities towards tuber dormancy breaking start between 56-DAPM and 87-DAPM in Obiaoturugo and between 101-DAPM and 115-DAPM in TDr1100873. These are indications that the total storable sugars might be playing some vital roles in the processes of yam tuber dormancy regulation. The upsurge of the total storable sugars at the dormancy progression stage, during the appearance of shoot buds, indicates possible degradation and mobilization of starch into sugars to provide the required energy for dormancy-breaking activities. Huang et al. (2007) reported a 35% reduction in starch content in Dioscorea rotundata and Dioscorea cayenensis tubers 90 days after storage. Though, in the current study, starch reduction during dormancy break was not observed, amylopectin content decreased, and amylopectin is the determinant of starch quantity. Our results also varied from the finding of Wingler (2018), who reported that the addition of external 6% glucose to a germination medium inhibits seed germination and cotyledon greening, resulting in developmental arrest. However, it is significant to mention that reducing sugar, which is mostly glucose and fructose, was relatively stable throughout our study period (from dormancy to sprouting), indicating that it might not be involved in modulating the tuber dormancy-breaking process.
There was a slight decrease in amylose from 42-DAPM to 56-DAPM before a gradual increase from 87-DAPM in both genotypes. Amylopectin decreased from 42-DAPM to 101-DAPM in the tubers of TDr1100873 and from 42-DAPM to 56-DAPM in the tubers of Obiaoturugo. Amylose and amylopectin are two factors that determine the quantity and quality of starch at any given stage of plant growth. While amylose determines the starch structure (quality), amylopectin determines the starch quantity. Both the proportion of amylose to amylopectin and the structure of amylose and amylopectin molecules have been reported to vary with plant species, tissue, and developmental stage [36]. The dynamic changes in the amylose/amylopectin ratio from yam tuber dormancy to the dormancy breaking stage indicate that there were reversible/irreversible alterations in starch structure and quantity at different stages. When amylose increases, as was observed from the appearance of shoot buds to tuber sprouting in both genotypes, amylopectin decreases. This significantly reduces the quantity of starch since amylopectin is the determinant factor of the quantity of starch at any given developmental stage in plants [36,37,38]. Therefore, these changes further support our earlier postulation that starch was mobilized into sugars during the onset of dormancy-breaking activities.
The reducing sugars content decreased slightly from 42-DAPM to the minimum value at 101-DAPM before increasing rapidly to its initial quantity from 115-DAPM to 143-DAPM in the tubers of TDr1100873. In contrast, Obiaoturugo tubers exhibited no significant changes in reducing sugar content from dormancy to the tuber sprouting stage. The pattern of changes observed in the long-dormant genotype conformed to the pattern proposed by [38,39]. Both reported that reducing sugars show two accumulation peaks between seed dormancy and dormancy breaking. The accumulation peak occurs at the onset of dormancy induction and is attributed to the breakdown of the non-reducing sucrose, which is the primary product of photosynthesis and transportable sugar, to glucose and other storable reducing sugar forms, while the reduction as dormancy progresses is associated with the polymerization of the soluble storage sugars into starch [15]. The accumulation peak at the onset of dormancy breaking and tuber sprouting was attributed to the mobilization of starch into sugars to provide the required energy for the dormancy-breaking process. This trend had earlier been reported by [40,41,42]. Although, the changes observed in reducing sugars in TDr1100873 during this study were too minimal to have contributed to any molecular process of dormancy regulation in white yam tubers. Reducing sugars are sugars that act as reducing agents because of the presence of free keto and aldehyde functional groups in their structure, and they include: glucose, fructose, galactose, maltose, and lactose. They constitute major soluble storage carbohydrates in about 12–15% of all flowering plants, including cereals, vegetables, ornamentals, and roots [43]. These sugars serve as an energy reserve in these plants while also playing a significant role in the regulation of osmotic pressure, sink strength, and resistance to stress [26]. In our study, they appeared not to be involved in dormancy regulation. This was further supported by the non-significant change in reducing content observed in short dormant genotype.
In our study, it was observed that in both genotypes there was a minimum quantity of non-reducing sugars during early dormancy stages, but as dormancy progresses towards breaking, at 56-DAPM in the tubers of Obiaoturugo, and at 101-DAPM in the tubers of TDr1100873, there were increases in non-reducing sugar content, leading to an accumulation of 9–10-fold at sprouting stage of tubers of TDr1100873 and Obiaoturugo, respectively. This constitutes the most profound changes in non-structural sugar metabolism in relation to yam tuber dormancy regulation observed in this study. The accumulation of a major proportion of non-reducing sugars at the onset of dormancy-breaking activities could be linked to the degradation and mobilization of stored carbohydrates during these activities in order to provide the optimum energy needed for the dormancy-breaking process. We infer that the degradation of carbohydrates into sucrose and other non-reducing sugar forms the molecular basics of yam tuber dormancy breaking. Trehalose is another physiologically important non-reducing sugar. The disaccharide serves essentially as an energy source, storage, and transport molecule for glucose in a similar fashion to sucrose and as a stress-responsive compound for cellular protection during stress in all plant kingdoms [44]. Though, the quantity of trehalose found in most plants in normal developmental situations is often very low, thus, indicating its presence as strong signaling over the metabolic role. However, trehalose-6-phosphate (Tre6P), an intermediate product of trehalose biosynthesis, has been shown to have a profound influence on plant metabolism, growth, and developmental transition processes such as: embryonic and vegetative development, flowering time, meristem determinacy, and cell fate specification [45,46,47]. Hence, Tre6P has been widely recognized as the global regulator of metabolism and transcription, promoting plant growth, and initiating developmental phase transitions in response to sugar availability [48]. Increased non-reducing sugars quantity observed from the onset of yam tuber dormancy breaking in this study is indicative of the possible involvement of tre6p or other non-reducing sugar species in yam tuber dormancy regulation, although qualitative characterization of non-reducing sugars composition in yam tuber during dormancy breaking phase is required to validate this assertion. There are reports that Tre6P initiates the process of growth from any plant part under growth arrest (dormancy) by targeting transcriptional members of the sucrose-non-fermenting 1-related kinase 1 (SnRK1) family, which are sensors of energy availability status in plant systems, and inhibit plant growth and development on detection of changes below optimum energy levels during metabolic stress to maintain energy homeostasis [15,49,50,51,52]. Consequently, we hypothesize that Tre6P may be playing an opposing role to the role of SnRK1 in dormancy regulation. While SnRK1 induces dormancy to maintain a low-energy economy situation, Tre6P may break dormancy by inhibiting the action of SnRK1.
We visualized the relations among the non-structural sugar parameters, dry matter, and moisture content with two correlation diagrams (correlation matrix, nude and edge network diagrams). Each of them presented clearly the nature of the linear relationships existing among the non-structural sugar parameters, dry matter, and moisture content in yam tubers from dormancy to the sprouting period. The major relationship that has a profound influence on the metabolic changes in most of the parameters investigated is the moisture content correlation with the rest of the parameters. Going by sensory observation in yam tuber established the fact that the longer tuber is stored and the more moisture it loses, the sweeter it becomes, as a result of increased concentration of glucose, fructose, etc. Hence, it was expected that moisture content would be significant and negatively correlated with reducing sugars in this study. But surprisingly, reducing sugar is the only parameter that moisture content did not correlate with. On the contrary, it showed a significant and negative correlation with non-reducing sugar quantity and other parameters. This further supports our postulation that reducing sugars might not be playing any role in yam tuber dormancy regulation. Contrary to the botanic seeds that require hydration (imbibition) to initiate the germination process (dormancy breaking), yam tubers require the opposite (dehydration) to a certain critical moisture threshold to be able to activate the molecular machinery towards the dormancy-breaking process. It was observed that all sugar parameters investigated, with the exception of reducing sugar, exhibited significant metabolic changes at certain stages of tuber dormancy, with a critical average moisture content of 40.0% in both yam genotypes. This implies that as important as imbibition is in botanic seed dormancy breaking, so is dehydration in tuber dormancy breaking. Furthermore, the significant and negative correlation observed between moisture content and non-reducing sugars further supports our earlier notion that the increase in total sugar observed during tuber dormancy at the stage that coincides with the stage of the critical moisture content was due to an increase in non-reducing sugars and that this has a profound influence on non-structural sugar metabolism during yam tuber dormancy and dormancy regulations. This preliminary finding forms the foundation for future study while putting into context the different genetic pools of the white yam. An understanding of transcriptional and metabolomic activities would further provide insights at molecular levels.

5. Conclusions

Non-reducing sugar and moisture content are two factors that play key roles in yam tuber dormancy regulation. There was a 9–10-fold change in its accumulation during tuber dormancy. Moisture content is a critical regulator of non-structural sugar metabolism, including non-reducing sugar in yam tubers, hence playing a role in yam tuber dormancy regulation.

Author Contributions

Conceptualization J.S.N., J.E.O. and M.R.; methodology, J.S.N., D.D.A. and C.A.C.; software, J.S.N. and C.A.C.; validation, D.D.A., M.R. and C.A.C.; data analysis, J.S.N. and C.A.C.; investigation, J.S.N. and C.A.C.; resources, D.D.A., M.R. and J.E.O.; data curation, J.S.N. and D.D.A.; writing—original draft preparation, J.S.N.; editing, D.D.A., M.R., J.E.O. and W.G.A.; visualization, J.S.N.; supervision, M.R., W.G.A. and J.E.O.; project administration, H.O.O.; funding acquisition, H.O.O. All authors have read and agreed to the published version of the manuscript.

Funding

This research was funded by GENES Intra-Africa Academic Mobility Project; “Mobility for plant genomics scholars to accelerate climate-smart adaptation options and food security in Africa (GENES)” funded by European Union. GENES Intra-Africa Academic Mobility Project. grant number EACEA/2017/2552. The APC will be funded by Jeremiah S. Nwogha.

Institutional Review Board Statement

Not applicable.

Informed Consent Statement

Not applicable.

Data Availability Statement

Not applicable.

Acknowledgments

The authors acknowledge the field staff of yam research programme of NRCRI, Umudike Nigeria, especially Anthony Udeagbara, and Rohit Kambale of department Plant biotechnology Tamil Nadu Agricultural University, Coimbatore, India for their technical support in field and laboratory experimentations respectively.

Conflicts of Interest

The authors declare no conflict of interest.

References

  1. Obidiegwu, J.E.; Lyons, J.B.; Chilaka, C.A. The Dioscorea Genus (Yam)—An appraisal of nutritional and therapeutic potentials. Foods 2020, 9, 1304. [Google Scholar] [CrossRef] [PubMed]
  2. Obidiegwu, J.E.; Akpabio, E.M. The geography of yam cultivation in southern Nigeria: Exploring its social meanings and cultural functions. J. Ethn. Foods 2017, 4, 28–35. [Google Scholar] [CrossRef]
  3. Nwogha, J.S.; Obidiegwu, J.E.; Okereke, R.N.; Bhattacharjee, R.; Oselebe, H.O. Preliminary verification of the adoption status of some yam (Dioscorea rotundata and Dioscorea alata) varieties in Nigeria using microsatellites markers. Afr. J. Biotechnol. 2022, 21, 198–207. [Google Scholar] [CrossRef]
  4. Price, E.J.; Wilkin, P.; Sarasan, V.; Fraser, P.D. Metabolite profiling of Dioscorea (yam) species reveals underutilised biodiversity and renewable sources for high-value compounds. Sci. Rep. 2016, 6, 29136. [Google Scholar] [CrossRef] [PubMed] [Green Version]
  5. Mignouna, H.D.; Abang, M.M.; Asiedu, R. Harnessing modern biotechnology for tropical tuber crop improvement: Yam (Dioscorea spp.) molecular breeding. Afr. J. Biotechnol. 2003, 2, 478–485. [Google Scholar]
  6. Hartmann, H.; Trumbore, S. Understanding the roles of nonstructural carbohydrates in forest Trees—From what we can measure to what we want to know. New Phytol. 2016, 211, 386–403. [Google Scholar] [CrossRef] [Green Version]
  7. Ile, E.; Craufurd, P.; Battey, N.; Asiedu, R. Phases of dormancy in yam tubers (Dioscorea rotundata). Ann. Bot. 2006, 97, 497–504. [Google Scholar] [CrossRef] [PubMed] [Green Version]
  8. Passam, H. Dormancy of yams in relation to storage. Yams. Ignames. 1982, 285–293. [Google Scholar]
  9. Yolou, M.; Zoundjihekpon, J.; Tiama, D.; Anizehou, S.I.; Assaba, E.I.; Adechokan, H.A.A.M.; Zongo, J.D.; Akoegninou, A. Evaluation of yam (Dioscorea cayenensisDioscorea rotundata) seed germination grown in Centre Benin. Int. J. Adv. Res. 2015, 3, 277–284. [Google Scholar]
  10. Hamadina, E.I. The Control of Yam Tuber Dormancy: A Framework for Manipulation; IITA: Ibadan, Nigeria, 2011. [Google Scholar]
  11. Zhang, Y.; He, J. Sugar-induced plant growth is dependent on brassinosteroids. Plant Signal. Behav. 2015, 10, e1082700. [Google Scholar] [CrossRef] [Green Version]
  12. Rolland, F.; Baena-Gonzalez, E.; Sheen, J. Sugar sensing and signaling in plants: Conserved and novel mechanisms. Annu. Rev. Plant Biol. 2006, 57, 675–709. [Google Scholar] [CrossRef] [PubMed] [Green Version]
  13. Ciereszko, I. Regulatory roles of sugars in plant growth and development. Acta Soc. Bot. Pol. 2018, 87, 3583. [Google Scholar] [CrossRef] [Green Version]
  14. Wingler, A. Transitioning to the next phase: The role of sugar signaling throughout the plant life cycle. Plant Physiol. 2018, 176, 1075–1084. [Google Scholar] [CrossRef] [PubMed] [Green Version]
  15. Damaris, R.N.; Lin, Z.; Yang, P.; He, D. The rice alpha-amylase, conserved regulator of seed maturation and germination. Int. J. Mol. Sci. 2019, 20, 450. [Google Scholar] [CrossRef] [Green Version]
  16. Zhaowei, L.; Qian, Z.; Fangmin, C. Sugar starvation enhances leaf senescence and genes involved in sugar signaling pathways regulate early leaf senescence in mutant rice. Rice Sci. 2020, 27, 201–214. [Google Scholar] [CrossRef]
  17. Yaliang, W.; Yikai, Z.; Qinghua, S.; Huizhe, C.; Jing, X.; Guohui, H.; Yanhua, C.; Xiaodan, W.; Junke, W.; Zihao, Y. Decrement of sugar consumption in rice young panicle under high temperature aggravates spikelet number reduction. Rice Sci. 2020, 27, 44–55. [Google Scholar] [CrossRef]
  18. Rodriguez, M.; Parola, R.; Andreola, S.; Pereyra, C.; Martínez-Noël, G. TOR and SnRK1 signaling pathways in plant response to abiotic stresses: Do they always act according to the “yin-yang” model? Plant Sci. 2019, 288, 110220. [Google Scholar] [CrossRef] [PubMed]
  19. Pokhilko, A.; Flis, A.; Sulpice, R.; Stitt, M.; Ebenhöh, O. Adjustment of carbon fluxes to light conditions regulates the daily turnover of starch in plants: A computational model. Mol. BioSyst. 2014, 10, 613–627. [Google Scholar] [CrossRef] [Green Version]
  20. Gibson, S.I. Control of plant development and gene expression by sugar signaling. Curr. Opin. Plant Biol. 2005, 8, 93–102. [Google Scholar] [CrossRef]
  21. Dennis, R. The Role of Primary Carbohydrate Metabolism in Wheat Grain Dormancy and Germination. Ph.D. Thesis, The Australian National University, Canberra, Australia, 2019. [Google Scholar]
  22. Graeber, K.; Nakabayashi, K.; Miatton, E.; Leubner-Metzger, G.; Soppe, W.J.J. Molecular mechanisms of seed dormancy. Plant Cell Environ. 2012, 35, 1769–1786. [Google Scholar] [CrossRef]
  23. de Paiva Neto, V.B.; Otoni, W.C. Carbon sources and their osmotic potential in plant tissue culture: Does it matter? Sci. Hortic. 2003, 97, 193–202. [Google Scholar] [CrossRef]
  24. Sakr, S.; Wang, M.; Dédaldéchamp, F.; Perez-Garcia, M.-D.; Ogé, L.; Hamama, L.; Atanassova, R. The sugar-signaling hub: Overview of regulators and interaction with the hormonal and metabolic network. I. Int. J. Mol. Sci. 2018, 19, 2506. [Google Scholar] [CrossRef] [Green Version]
  25. Wingler, A.; Henriques, R. Sugars and the speed of life—Metabolic signals that determine plant growth, development and death. Physiol. Plant. 2022, 174, e13656. [Google Scholar] [CrossRef] [PubMed]
  26. Martín-Fontecha, E.S.; Tarancón, C.; Cubas, P. To grow or not to grow, a power-saving program induced in dormant buds. Curr. Opin. Plant Biol. 2018, 41, 102–109. [Google Scholar] [CrossRef]
  27. Jaleel, C.A.; Gopi, R.; Manivannan, P.; Kishorekumar, A.; Gomathinayagam, M.; Panneersel Vam, R. Changes in biochemical constituents and induction of early sprouting by triadimefon treatment in white yam (Dioscorea rotundata Poir.) tubers during storage. J. Zhejiang Univ. Sci. B 2007, 8, 283–288. [Google Scholar] [CrossRef] [PubMed] [Green Version]
  28. Tschannen, A.B.; Girardin, O.; Nindjin, C.; Daouda, D.; Farah, Z.; Stamp, P.; Escher, F. Improving the application of gibberellic acid to prolong dormancy of yam tubers (Dioscorea spp). J. Sci. Food Agric. 2003, 83, 787–796. [Google Scholar] [CrossRef]
  29. Hariprakash, C.; Nambisan, B. Carbohydrate metabolism during dormancy and sprouting in yam (Dioscorea) tubers: Changes in carbohydrate constituents in yam (Dioscorea) tubers during dormancy and sprouting. J. Agric. Food Chem. 1996, 44, 3066–3069. [Google Scholar] [CrossRef]
  30. Landhäusser, M.S.; Pak, S.C.; Dickman, L.T.; Furze, E.M.; Kuhlman, I.; Schmid, S.; Wiesenbauer, J.; Wild, B.; Gleixner, G.; Hartmann, H.; et al. Standardized protocols and procedures can precisely and accurately quantify non-structural carbohydrates. Tree Physiol. 2018, 38, 1764–1778. [Google Scholar] [CrossRef]
  31. Dubois, M.; Gilles, K.A.; Hamilton, J.K.; Rebers, P.A.; Smith, F. Colorimetric Method for Determination of Sugars and Related Substances. Anal. Chem. 1956, 28, 350–356. [Google Scholar] [CrossRef]
  32. Widdowson, E.M. A method for the determination of small quantities of mixed reducing sugars and its application to the estimation of the products of hydrolysis of starch by taka-diastase. Biochem. J. 1931, 25, 863–879. [Google Scholar] [CrossRef] [Green Version]
  33. Sowbhagya, C.M.; Bhattacharya, K.R. A Simplified Colorimetric Method for Determination of Amylose Content in Rice. Starch 1971, 23, 53–56. [Google Scholar] [CrossRef]
  34. Huang, C.-C.; Chiang, P.-Y.; Chen, Y.-Y.; Wang, C.-C. Chemical compositions and enzyme activity changes occurring in yam (Dioscorea alata L.) tubers during growth. LWT Food Sci. Technol. 2007, 40, 1498–1506. [Google Scholar] [CrossRef]
  35. Muzac-Tucker, I.; Helen, N.; Ahmad, M. Biochemical composition and storage of Japanican yams (Dioscorea spp.). J. Sci. Food Agric. 1993, 62, 219–224. [Google Scholar] [CrossRef]
  36. Paul, M.J.; Lawlor, D.W. Genetic modification of primary metabolism|Photosynthesis. In Encyclopedia of Applied Plant Sciences; Academic Press: Cambridge, MA, USA, 2003; pp. 484–493. [Google Scholar]
  37. Jabrin, S.; Ravanel, S.; Gambonnet, B.; Douce, R.; Rébeillé, F. One-carbon metabolism in plants. Regulation of tetrahydrofolate synthesis during germination and seedling development. Plant Physiol. 2003, 131, 1431–1439. [Google Scholar] [CrossRef] [PubMed] [Green Version]
  38. Landhäusser, S. Aspen shoots are carbon autonomous during bud break. Trees 2011, 25, 531–536. [Google Scholar] [CrossRef]
  39. Ohanenye, I.C.; Alamar, M.C.; Thompson, A.J.; Terry, L.A. Fructans redistribution prior to sprouting in stored onion bulbs is a potential marker for dormancy break. Postharvest Biol. Technol. 2019, 149, 221–234. [Google Scholar] [CrossRef]
  40. Smeekens, S.; Hellmann, A.H. Sugar sensing and signaling in plants. Front. Plant Sci. 2014, 5, 185–205. [Google Scholar] [CrossRef] [Green Version]
  41. Lastdrager, J.; Hanson, J.; Smeekens, S. Sugar signals and the control of plant growth and development. J. Exp. Bot. 2014, 65, 799–807. [Google Scholar] [CrossRef]
  42. Martínez-Vilalta, J.; Sala, A.; Asensio, D.; Galiano, L.; Hoch, G.; Palacio, S.; Piper, F.I.; Lloret, F. Dynamics of non-structural carbohydrates in terrestrial plants: A global synthesis. Ecol. Monogr. 2016, 86, 495–516. [Google Scholar] [CrossRef] [Green Version]
  43. Doblin, M.S.; Kurek, I.; Jacob-Wilk, D.; Delmer, D.P. Cellulose biosynthesis in plants: From genes to rosettes. Plant Cell Physiol. 2002, 43, 1407–1420. [Google Scholar] [CrossRef]
  44. Tsai, A.Y.-L.; Gazzarrini, S. Trehalose-6-phosphate and SnRK1 kinases in plant development and signaling: The emerging picture. Front. Plant Sci. 2014, 5, 119. [Google Scholar] [CrossRef] [PubMed] [Green Version]
  45. Durán-Soria, S.; Pott, D.M.; Osorio, S.; Vallarino, J.G. Sugar signaling during fruit ripening. Front. Plant Sci. 2020, 11, 564917. [Google Scholar] [CrossRef]
  46. Hartmann, H.; Adams, H.D.; Hammond, W.M.; Hoch, G.; Landhäusser, S.M.; Wiley, E.; Zaehle, S. Identifying differences in carbohydrate dynamics of seedlings and mature trees to improve carbon allocation in models for trees and forests. Environ. Exp. Bot. 2018, 152, 7–18. [Google Scholar] [CrossRef]
  47. Yadav, U.P.; Ivakov, A.; Feil, R.; Duan, G.Y.; Walther, D.; Giavalisco, P.; Piques, M.; Carillo, P.; Hubberten, H.-M.; Stitt, M. The sucrose-trehalose 6-phosphate (Tre6P) nexus: Specificity and mechanisms of sucrose signalling by Tre6P. J. Exp. Bot. 2014, 65, 1051–1068. [Google Scholar] [CrossRef] [PubMed] [Green Version]
  48. Baena-González, E.; Lunn, J.E. SnRK1 and trehalose 6-phosphate–two ancient pathways converge to regulate plant metabolism and growth. Curr. Opin. Plant Biol. 2020, 55, 52–59. [Google Scholar] [CrossRef] [PubMed]
  49. Goddijn, O.J.; van Dun, K. Trehalose metabolism in plants. Trends Plant Sci. 1999, 4, 315–319. [Google Scholar] [CrossRef] [PubMed]
  50. Figueroa, C.M.; Feil, R.; Ishihara, H.; Watanabe, M.; Kölling, K.; Krause, U.; Höhne, M.; Encke, B.; Plaxton, W.C.; Zeeman, S.C. Trehalose 6–phosphate coordinates organic and amino acid metabolism with carbon availability. Plant J. 2016, 85, 410–423. [Google Scholar] [CrossRef] [Green Version]
  51. Zhang, Z.; Zhu, J.-Y.; Roh, J.; Marchive, C.; Kim, S.-K.; Meyer, C.; Sun, Y.; Wang, W.; Wang, Z.-Y. TOR signaling promotes accumulation of BZR1 to balance growth with carbon availability in Arabidopsis. Curr. Biol. 2016, 26, 1854–1860. [Google Scholar] [CrossRef]
  52. Bledsoe, S.W.; Henry, C.; Griffiths, C.A.; Paul, M.J.; Feil, R.; Lunn, J.E.; Stitt, M.; Lagrimini, L.M. The role of Tre6P and SnRK1 in maize early kernel development and events leading to stress-induced kernel abortion. BMC Plant Biol. 2017, 17, 74. [Google Scholar] [CrossRef] [Green Version]
Figure 1. Dormancy duration of two white yam genotypes (Obiaoturugo and TDr1100873). Statistically significant difference between the genotypes was observed at (p = 0.05).
Agriculture 13 00343 g001
Figure 2. (A,B) Metabolic changes in non-structural sugar, dry matter, and moisture content in two white yam genotypes’ tubers from dormancy to sprouting. (A) The data for TDr1100873 and (B) the data for Obiaoturugo. Error bars indicate statistically significant differences among the variables at p ≤ 0.05. The six sugar parameters, dry matter, and moisture content are shown with colored lines, their values are on y-axis (multiple parameters with different units are shown on the same axis; hence, no unit was attached to the values). Total sugar, starch, reducing and non-reducing sugars, amylose, and amylopectin were all measured in mg/100 mg as units, whereas dry matter and moisture were measured in percentage as units. The values on x-axis are days after tuber physiological maturity.
Agriculture 13 00343 g002
Figure 3. (af) Changes in dry matter and moisture content in tubers of two white yam genotypes (TDr1100873 and Obiaoturugo) from tuber physiological maturity to sprouting. Bars with the same letters are not significantly different, while those with different letters are significantly different at p = 0.05. (a) Comparison of dry matter content in the tubers of G1 = TDr1100873 (blue line) and G2 = Obiaoturugo (red line) at all the studied dormancy stages. (b) Changes in dry matter content in the tubers of TDr1100873 across the studied stages. (c) Changes in dry matter content in the tubers of Obiaoturugo across the studied stages. (d) Comparison of moisture content of G1 = TDr1100873 (blue line) and G2 = Obiaoturugo (red line) at all the studied dormancy stages. (e) Changes in moisture content in the tubers of TDr1100873 across the studied stages. (f) Changes in moisture content in the tubers of Obiaoturugo across the studied stages.
Agriculture 13 00343 g003
Figure 4. (af) Total sugar and starch metabolic status in tubers of two white yam genotypes (TDr1100873 and Obiaoturugo) from physiological maturity to sprouting. Bars with the same letters are not significantly different, while those with different letters are significantly different at p = 0.05. (a) Comparison of total sugar content in the tubers of G1 = TDr1100873 (blue line) and G2 = Obiaoturugo (red line) at all the studied dormancy stages. (b) Changes in total sugar content in the tubers of TDr1100873 across the studied stages. (c) Changes in total sugar content in the tubers of Obiaoturugo across the studied stages. (d) Comparison of starch content in the tubers G1 = TDr1100873 (blue line) and G2 = Obiaoturugo (red line) at all the studied dormancy stages. (e) Changes in starch content in the tubers of TDr1100873 across the studied stages. (f) Changes in starch content in the tubers of Obiaoturugo across the studied stages.
Agriculture 13 00343 g004
Figure 5. (af) Amylose and amylopectin metabolic status in tubers of two white yam genotypes (TDr1100873 and Obiaoturugo) from physiological maturity to sprouting. Bars with the same letters are not significantly different, while those with different letters are significantly different at p = 0.05. (a) Comparison of amylose content in the tubers of G1 = TDr1100873 (blue line) and G2 = Obiaoturugo (red line) at all the studied dormancy stages. (b) Changes in amylose content in the tubers of TDr1100873 across the studied stages. (c) Changes in amylose content in the tubers of Obiaoturugo across the studied stages. (d) Comparison of amylopectin in the tubers G1 = TDr1100873 (blue line) and G2 = Obiaoturugo (red line) at all the studied dormancy stages. (e) Changes in amylopectin content in the tubers of TDr1100873 across the studied stages. (f) Changes in amylopectin content in the tubers of Obiaoturugo across the studied stages.
Agriculture 13 00343 g005
Figure 6. (af) Reducing and non-reducing sugar metabolic status in tubers of two white yam genotypes (TDr1100873 and Obiaoturugo) from physiological maturity to sprouting. Bars with the same letters are not significantly different, while those with different letters are significantly different at p = 0.05. (a) Comparison of reducing sugar content in the tubers of G1 = TDr1100873 (blue line) and G2 = Obiaoturugo (red line) at all the studied dormancy stages. (b) Changes in reducing sugar content in the tubers of TDr1100873 across the studied stages. (c) Changes in reducing sugar content in the tubers of Obiaoturugo across the studied stages. (d) Comparison of non-reducing sugar content in the tubers G1 = TDr1100873 (blue line) and G2 = Obiaoturugo (red line) at all the studied dormancy stages. (e) Changes in non-reducing sugar content in the tubers of TDr1100873 across the studied stages. (f) Changes in non-reducing sugar content in the tubers of Obiaoturugo across the studied stages.
Agriculture 13 00343 g006
Figure 7. (a,b) Correlation matrix showing linear relationships between non-structural sugar parameters, dry matter, and moisture content in yam tubers from dormancy to sprouting. Both a and b are visualizing the same relationships in different formats. In both figures, color shades indicate the degree of relationship between two variables connected in the box or on edge at p = 0.05. In (a), variables connected by blue are positively correlated to each other, while those connected by red are negatively correlated. In (b), variables connected to each other at the edge by green-green lines are positively correlated, while those connected by red and green lines are negatively correlated.
Agriculture 13 00343 g007
Table 1. Summary of the changes in six sugar parameters, dry matter, and moisture content in TDr1100873 and Obiaoturugo during dormancy.
GenotypeDAPMDM%Moisture%Total Sugar(mg/100 mg)Starch
(mg/100 mg)
Amylopectin
(mg/100 mg)
Amylose
(mg/100 mg)
Reducing Sugar
(mg/100 mg)
Non-Reducing Sugar
(mg/100 mg)
TDr110087342 days46.12 c53.88 a45.63 c41.07 c31.45 c10.62 c39.97 a5.66 d
TDr110087356 days48.35 c51.65 b41.93 d37.74 d28.98 d8.76 c35.87 b6.07 d
TDr110087387 days52.3 b47.69 c38.23 e34.41 e24.67 e13.07 b32.42 c5.81 d
TDr1100873101 days54.29 b45.72 d38.23 e34.41 e19.12 f15.29 b27.68 d10.56 c
TDr1100873115 days57.55 a42.45 e76.47 b68.82 b38.85 b27.5 a37.32 b39.15 b
TDr1100873143 days59.91 a40.09 f86.7 a79.92 a50.57 a29.35 a38.87 a49.94 a
TDrObia42 days43.24 d67.17 a44.4 c38.85 c28.37 b10.48 c38.1 ab5.07 d
TDrObia56 days48.5 c51.5 b43.17 c38.85 c28.98 b9.86 c36.71 b6.46 c
TDrObia87 days54.47 b45.46 c75.23 b67.71 b43.78 a23.93 b37.14 ab38.18 b
TDrObia101 days59.88 a40.12 d92.5 a83.25 a42.55 a40.7 a41.1 a51.44 a
Each variable was analyzed separately for each variety. Means were compared across the sampling points in days after physiological maturity at p ≤ 0.05. Pairwise means comparison was performed using Duncan’s post hoc test, and variables with the same letter were not significantly different at p = 0.05. TDrObia stands for Obiaoturugo.
Disclaimer/Publisher’s Note: The statements, opinions and data contained in all publications are solely those of the individual author(s) and contributor(s) and not of MDPI and/or the editor(s). MDPI and/or the editor(s) disclaim responsibility for any injury to people or property resulting from any ideas, methods, instructions or products referred to in the content.

