
The Impact of a “National Green Export Review” on Competitiveness: Empirical Evidence for Ecuador’s Fish Exports


College of Economics and Management, Shanghai Ocean University, Shanghai 201306, China
*
Author to whom correspondence should be addressed.
Agriculture 2023, 13(1), 62; https://doi.org/10.3390/agriculture13010062
Submission received: 11 November 2022
/
Revised: 21 December 2022
/
Accepted: 21 December 2022
/
Published: 25 December 2022
(This article belongs to the Special Issue Agricultural Development Strategies for Less-Favoured Areas)
Abstract
:Fish products comprise more than 20% of total Ecuadorian exports. Ecuador introduced the “National Green Export Review” (NGER) in 2015, which aims at making Ecuador’s fishing industry more sustainable to improve the international market access to Ecuador’s fish products. Has this policy achieved its goal? In order to answer this question, this article applies the local projection approach to explore the dynamic impact of the NGER on Ecuador’s share of fish exports in the world fish market. Contrary to expectations, the results are consistent with the view that the NGER does not enhance Ecuador’s competitiveness. The NGER is also not able to compensate for the fall in Ecuador’s share in the world fish market, which has been induced by a change in consumer preferences for tuna and shrimp, Ecuador’s main fish products. The concluding section of the paper provides policy advice on how to make the NGER more effective in achieving its goal.
1. Introduction
For many countries, fish products, which consist of both edible and inedible products (all kinds of fresh, preserved, salted, smoked, and frozen products are categorized as edible, whereas oils, fats, meals, sponges, corals, and solubles are classified as inedible), play a dominant role in ensuring food security [1]. Fishing industries provide job opportunities for low-income families [2,3], and fish products are a vital source of export earnings for many developing countries [4]. According to [3], in 2018, global exports of fish products amounted to USD 164 billion, and developing countries’ contributions were worth USD 88 billion [5]. Low labor costs paired with rich water resources and a wide variety of fish species have given many developing countries a comparative advantage in fish production [6,7].
Fish production and fish exports are of substantial economic importance for Ecuador [8]. Ecuador belongs to the southeastern tropical pacific region, which is recognized as the largest area for tuna and artisanal fisheries [9]. In terms of value, fish products are Ecuador’s third most important export item after oil and bananas [10]. Fish products accounted for 1% of GDP, 12% of agricultural GDP, and 24% of total exports in 2017 [11,12].
The increasing demand for seafood, advancements in fishing technology that allow fishing fleets to increase their fishing capacity, and the fact that marine fish are a common resource are jeopardizing the sustainability of many types of marine fish [13,14]. In the case of Ecuador, numerous species are currently in danger of extinction due to poor management and overfishing [15].
In order to curb the over-exploitation of wild fish stocks in oceans, proactive government intervention in market processes is needed. However, while government policy toward more sustainable ocean fishing can play a pivotal role in meeting the millennium’s sustainable development goals [16], such policies may also exert significant negative impacts on foreign exchange earnings and domestic employment [17,18].
To ensure the long-term viability of fish populations and the integrity of marine ecosystems, Ecuador became the first country in Latin America to join the global effort aiming at a transparent fishing sector [19]. Specifically, Ecuador implemented the “National Green Export Review” (NGER) on 15 July 2015. This review aims at enhancing export earnings and the creation of job opportunities, inter alia, in the sustainable fishing industry [20]. UNCTAD provides guidance and technical support [21,22]. Using the words of UNCTAD: “The results of the NGER will assist policymakers to design policy packages to support the development of productive capacity and tap external markets for green products and services in sectors where Ecuador has a demonstrable comparative advantage” [23]. “The objective is to promote and consolidate national exports of fisheries that are more sustainable and more competitive at the international level and contribute to a transition to a more sustainable economic development path” [24].
The NGER foresees the implementation of sustainable fishing practices at all levels of the value chain. The goal is to gain recognition for responsible harvesting and processing practices [10]. For instance, the NGER paves the way for an intensified combat against illegal, unregulated, and unreported fishing activities [21]. For that purpose, the NGER requires the implementation of multiuse traceability systems and improved transparency [20].
As one of the NGER’s aims is to promote the exports of fisheries, this study investigates the NGER’s impact on Ecuador’s competitiveness in the world fish market. Specifically, the study provides estimates of the dynamic impact of the NGER on Ecuador’s share of fish exports in total world exports of fish products. The study applies Jorda’s [25] local projection approach to estimate impulse response functions (IRFs) which show the impact of the NGER for each year from 2015 to 2019. Estimations are based on aggregate fish export data ranging from 1980 to 2019. Contrary to expectations, the results are consistent with the view that the NGER so far has not enhanced Ecuador’s competitiveness in the world fish market. The NGER is not able to compensate for the fall in Ecuador’s market share due to changing consumer preferences.
The paper is structured as follows: Section 2 briefly reviews Ecuador’s National Green Export Review, and Section 3 includes a review of the related literature. Section 4 describes the methodology and data used, and Section 5 presents the estimation results. Section 6 contains a discussion of the results and recommendations for policymakers. Section 7 summarizes the paper.
2. Green Export Review of Ecuador
NGERs have been adopted by Ecuador, Ethiopia, Morocco, Oman, and Vanuatu. NGERs aid emerging and transitioning economies in developing and enhancing the competitiveness of their green sectors [10]. Ecuador adopted the NGER on 15 July 2015. Fisheries, together with cacao-chocolate, is one of the sectors that the NGER focuses on [21].
The NGER is a process that helps policymakers to develop policies and increase the capacity of green sectors in which they have a comparative advantage by applying UNCTAD’s green space methodology [26]. Specifically, in order to define and execute green economy policies, construct institutional and regulatory frameworks, and create cooperative government-to-business and business-to-business processes, the NGERs are carried out through an interactive multi-stakeholder process [27].
The specific goals of NGERs are to increase a country’s ability, effectiveness, and competitiveness in the production and trade of green goods and, thus, to foster sustainable development [19]. NGERs assist small- and medium-sized enterprises in their participation in global markets.
The Ecuadorian Ministry of Commerce adopted the NGER to increase and maintain a competitive basis for sustainable fish production [20]. The two main goals of NGER are to enhance the possibilities for generating and harvesting sustainable fishing products, and improve market access. The Ecuadorian Ministry of Commerce puts emphasis on boosting export earnings and job opportunities without compromising the environment [21]. Therefore, the NGER of Ecuador fights against illegal, unreported, and unregulated fishing activities with better and more effective efforts [19]. In addition, multiuse traceability systems and the use of sustainability certificates for fisheries are prerequisites for receiving premium prices and market access [21]. Furthermore, to combat the oversupply and overfishing of tuna, Ecuador has developed a voluntary code of conduct for the responsible management of tuna catches. The voluntary code of conduct is voluntarily agreed to by signatories, and it stipulates certain standards of management, including monitoring, controlling, surveillance, and inspection of the entire value chain [28,29].
While the NGER, inter alia, aims at improving access to the world fish market, at the same time, it can be considered a technical non-tariff trade barrier. Technical barriers to trade consist of regulations, sanitary and phytosanitary measures, testing, and inspection [30]. Moreover, developing countries face challenges in certifying goods as being sustainable or organic. Additional investments in suitable infrastructure are necessary to implement certification [31].
To sum up, NGERs focus on sustainability issues and green sectors, they aim at increasing world market access (i.e., enhancing international competitiveness), they are non-tariff barriers to trade, and their implementation requires capabilities that developing countries may not be able to offer, at least in the short run. Their impact on exports, therefore, is ambiguous a priori.
3. Literature Review
NGERs are a means to implement Voluntary Sustainability Standards (VSSs) [32]. VSSs are defined as “[…] norms and standards designed to ensure that a product is produced, processed or transported sustainably in order to contribute to specific environmental, social and economic targets” [32] (p. VI). While VSSs intend to reconcile environmental, social, and economic objectives, the simultaneous achievement of all these objectives is a challenging task as trade-offs exist between different policy goals [32].
Specifically, from a conceptual viewpoint, the question about the role of VSSs as a trade facilitator or as a trade barrier is still unanswered. On the one hand, VSSs can enhance exports in that they ensure product quality [33,34], lower information asymmetries [35], and lead to a modernization of the entire value chain [36,37]. On the other hand, VSSs might act as a trade barrier as they increase compliance and monitoring costs and make gaining access to global value chains more challenging, which is especially an issue for small businesses [38].
Several empirical studies have tried to answer the question of VSSs being either a trade facilitator or a trade barrier. For example, Anderson [39] uses trade data from the years 2009 to 2013 for 15 EU countries to estimate the impact of the Global GAP Certification on the trade of various agricultural products. The author concludes that adherence to the Global GAP Certification has a favorable effect on both the potential of trading and the volume of imports. Masood and Brümmer [40] use disaggregated data for banana imports to EU countries from the years 2010 to 2012. These authors also find that the Global GAP Certification increases the volume of banana imports to the EU. Similarly, Fiankor et al. [41] conclude that the Global GAP Certification acts as a catalyst for the trade of various horticultural products. These authors use bilateral trade data from the years 2010 to 2015. They also show that the trade-enhancing effect depends on the specific product and the specific destination market considered. Ehrich and Mangelsdorf [42] use data on 12,000 food processing firms from the years 2008 to 2013. They evaluate the impact that the International Featured Standard (IFS) has on manufacturing exports. These authors find that the IFS increases the exchange of manufacturing goods between high- and middle-income countries, but they conclude that the IFS did not have any effect on trade with low-income countries.
In contrast, the findings of Elder et al. [43] suggest that VSSs have negative impacts on farmers’ ability to compete in international markets, mainly due to the increased compliance costs and a lack of financial resources. Based on a sample of EU countries and countries from the European Free Trade Association, Fiankor et al. [41] estimate the impact of the Global GAP Certification on the trade of various horticultural products. Their results are consistent with the view that the Global GAP Certification acts as a trade barrier.
Taken together, as, with the conceptual background, the empirical evidence regarding the impact of VSSs on trade is also mixed. It seems that the impact of VSSs on trade is contingent on the extent and quality of a country’s infrastructure endowment. Whether Ecuador’s NGER, which is a specific way to adopt VSSs, is effective for Ecuador’s fishing industry’s international competitiveness is investigated in the remaining parts of the paper.
4. Methodology and Data
4.1. Empirical Methodology
In order to estimate the short-run impact of the implementation of the NGER on Ecuador’s share of fish exports in the world fish market, this study applies the local projection (LP) approach developed by Jordà [25]. The LP has been used in a wide variety of applications, for example, to study fiscal multipliers [44] and to investigate the impact of financial crises on public debt [45].
Alternative options for estimating the dynamic impact of policies are available but are considered inferior to local projections [46]. The first viable alternative is Vector Autoregressions (VARs). According to [46], VARs are considered a “black box” since all variables are considered endogenous. Moreover, one has to know the exact order in which the variables enter the system of equations. Autoregressive-Distributed-Lag (ARDL) models are another alternative to local projections. Yet, as [46] argues, “IRFs obtained using this method tend to be lag-sensitive, therefore undermining the overall stability of the IRFs” (p. 14).
Local projections do not experience such issues as the lagged dependent variables enter as control variables and are not used to derive the IRFs. Finally, a big advantage of local projections over alternatives is that confidence intervals can be computed directly using the standard errors of the estimated coefficients. There is no need to conduct Monte Carlo simulations [46]. In a nutshell, the popularity of LPs is based on their robustness to the misspecification of the data generation process and the relative ease with which confidence intervals are computed [47].
This study estimates IRFs by running OLS regressions of the type:
where X represents the endogenous variable of interest, here, the share of Ecuador’s exports in the world fish exports market. Z indicates the control variables, (L) stands for the polynomial lag operator, and the variable “Shock” represents the policy innovation, which in this study is the implementation of the NGER.
h represents the forecast horizon over which the IRFs are estimated. As this study evaluates the short-run response to the NGER, the forecast horizon is over the years 2015 to 2019. Thus, h = 0,1, 2, 3, 4. L1 (L2) has a maximum value of 4 and a minimum value of 0, which implies that lags of the right-hand-side variables up to h = 4 are considered in the estimations. The optimal lag length is determined by applying “Hall’s general to specific rule” [48].
The endogenous variable in Equation (1), (Xt + h − Xt − 1), can be transformed into a sum of first differences (i.e., (ΔXt + h + ΔXt + h − 1 + … + ΔXt)). Coefficient , thus, provides the cumulative response of the dependent variable in period t + h to the NGER in period t. The is estimated by OLS regressions for each forecast horizon h. The corresponding 95% confidence interval is calculated using the standard errors of . As the error term in (1) is per construction serially correlated (moving average), Newey–West standard errors with a lag of h are applied. Using Newey–West standard errors implies that standard errors are robust to arbitrary heteroscedasticity as well.
4.2. Variables and Data
The main endogenous variable in this study is the share of Ecuador’s fish exports in world fish exports (variable “MarketShare”). MarketShare is a standard proxy variable for a country’s competitiveness in world markets [49]. MarketShare is calculated by dividing the total fish exports of Ecuador, measured in USD, by world fish exports. Note that Ecuador adopted the USD as its official currency.
In order to capture the supply side of the fish market, this study includes Ecuador’s production of fish as a predictor variable in Equation (1). The variable “FishProduction” aims at measuring Ecuador’s potential supply of fish products to the world market. With this variable, the study implicitly controls Ecuador’s resource endowment, the institutional setting that shapes the production process and the access and state of development of Ecuador’s production technology [50,51]. The study also includes lagged values of variables MarketShare and FishProduction to control for possible inertia in demand and possible lagged impacts of production on exports.
The variable MarketShare can be split into two parts, the average price of fish exports and export volume as a share of world export volume. Given the aim of the NGER to enhance Ecuador’s competitiveness in the world fish market by enhancing sustainability, the NGER’s impact on the average price is of special interest. The reputation of sustainable production should, ceteris paribus, lead to an increase in the average price of Ecuador’s fish exports. In additional analyses, the study, therefore, models the impact of the NGER on the average export price of fish products and on the export volume as a share of world export volume. The average fish export price is calculated by dividing the real fish export value in USD (fish export value/GDP deflator) by the fish export quantity in kg. Deflation is carried out to compensate for the impact that inflation has on the average price.
The main exogenous variable is an indicator for years with the NGER in force (variable NGER). NGER has entry 1 for years in which the NGER is adopted (i.e., 2015–2019) and entry 0 otherwise. To cope with potential inertia in variable MarketShare, Equation (1) includes lags of the endogenous variable. In addition, Equation (1) includes a variable for Ecuador’s domestic supply of fish products, that is, fish production (in USD) per capita (variable FishProduction) and its lagged values.
The data span the years 1980 to 2019 and are taken from various sources. Data for the value and volume of fish exports, as well as for fish production, are taken from the Food and Agricultural Organization (FAO). Data on population are taken from the World Bank’s World Development Indicators database. Table 1 includes the basic descriptive statistics for the main variables used in the analysis.
Table 1 demonstrates that the mean market share for fish exports is 0.62, and the maximum and minimum values are 0.11 and 1.25, respectively. According to a recent statement from the World Trade Organization [12], Ecuador earned USD 2.9 billion and USD 4.6 billion from the global fish export market in the years 2012 and 2017, respectively. During this time, the fish and aquaculture sector grew by 60% in value in the global fish market. The mean value (over the period 1980 to 2019) of Ecuador’s fish production per capita is USD 0.013, with maximum and minimum values of USD 0.033 and USD 0.003, respectively. The mean price of exported fish products is USD 18.75 per kg, with a minimum of USD 4.20 and a maximum of USD 37.19. The volume of fish exports as a percentage of total world exports ranges from 1.7% to 0.09%, with an average value of 0.82%.
5. Results
5.1. Unit Root Tests
A unit root in the data generation process invalidates the estimation results. In order to determine the presence of unit roots, this study applies the Augmented Dickey–Fuller (ADF) test [52] and the Phillips and Perron (PP) test [53]. The ADF and PP tests, which test the null hypothesis of a unit root, indicate that MarketShare and FishProduction are stationary at first differences (cf. Table 2). In order to select the appropriate lag length for the ADF test, the Akaike Information Criterion (AIC) and the Schwarz Information Criterion (SIC) are used. Both information criteria indicate the same lag length. In the PP test, the Newey–West bandwidth selection method is used.
The ADF and PP tests assume no structural breaks in the data generation process over the estimation sample. In order to cope with the possibility of a structural break, which may resemble the impact of a unit root, the Ziviot–Andrews test is performed [54]. This test first tests for the presence of a structural break, and second, depending on the prior finding, tests for the presence of a unit root [55]. The Ziviot–Andrews test leads to the same conclusion as before: the two variables are stationary at first differences (cf. Table 3). Therefore, variables are used in differences in the estimations. However, as mentioned above, the endogenous variable (MarketSharet + h–MarketSharet-1) can be transformed into a sum of the first differences and is stationary, given the results in Table 2 and Table 3.
5.2. Baseline Results
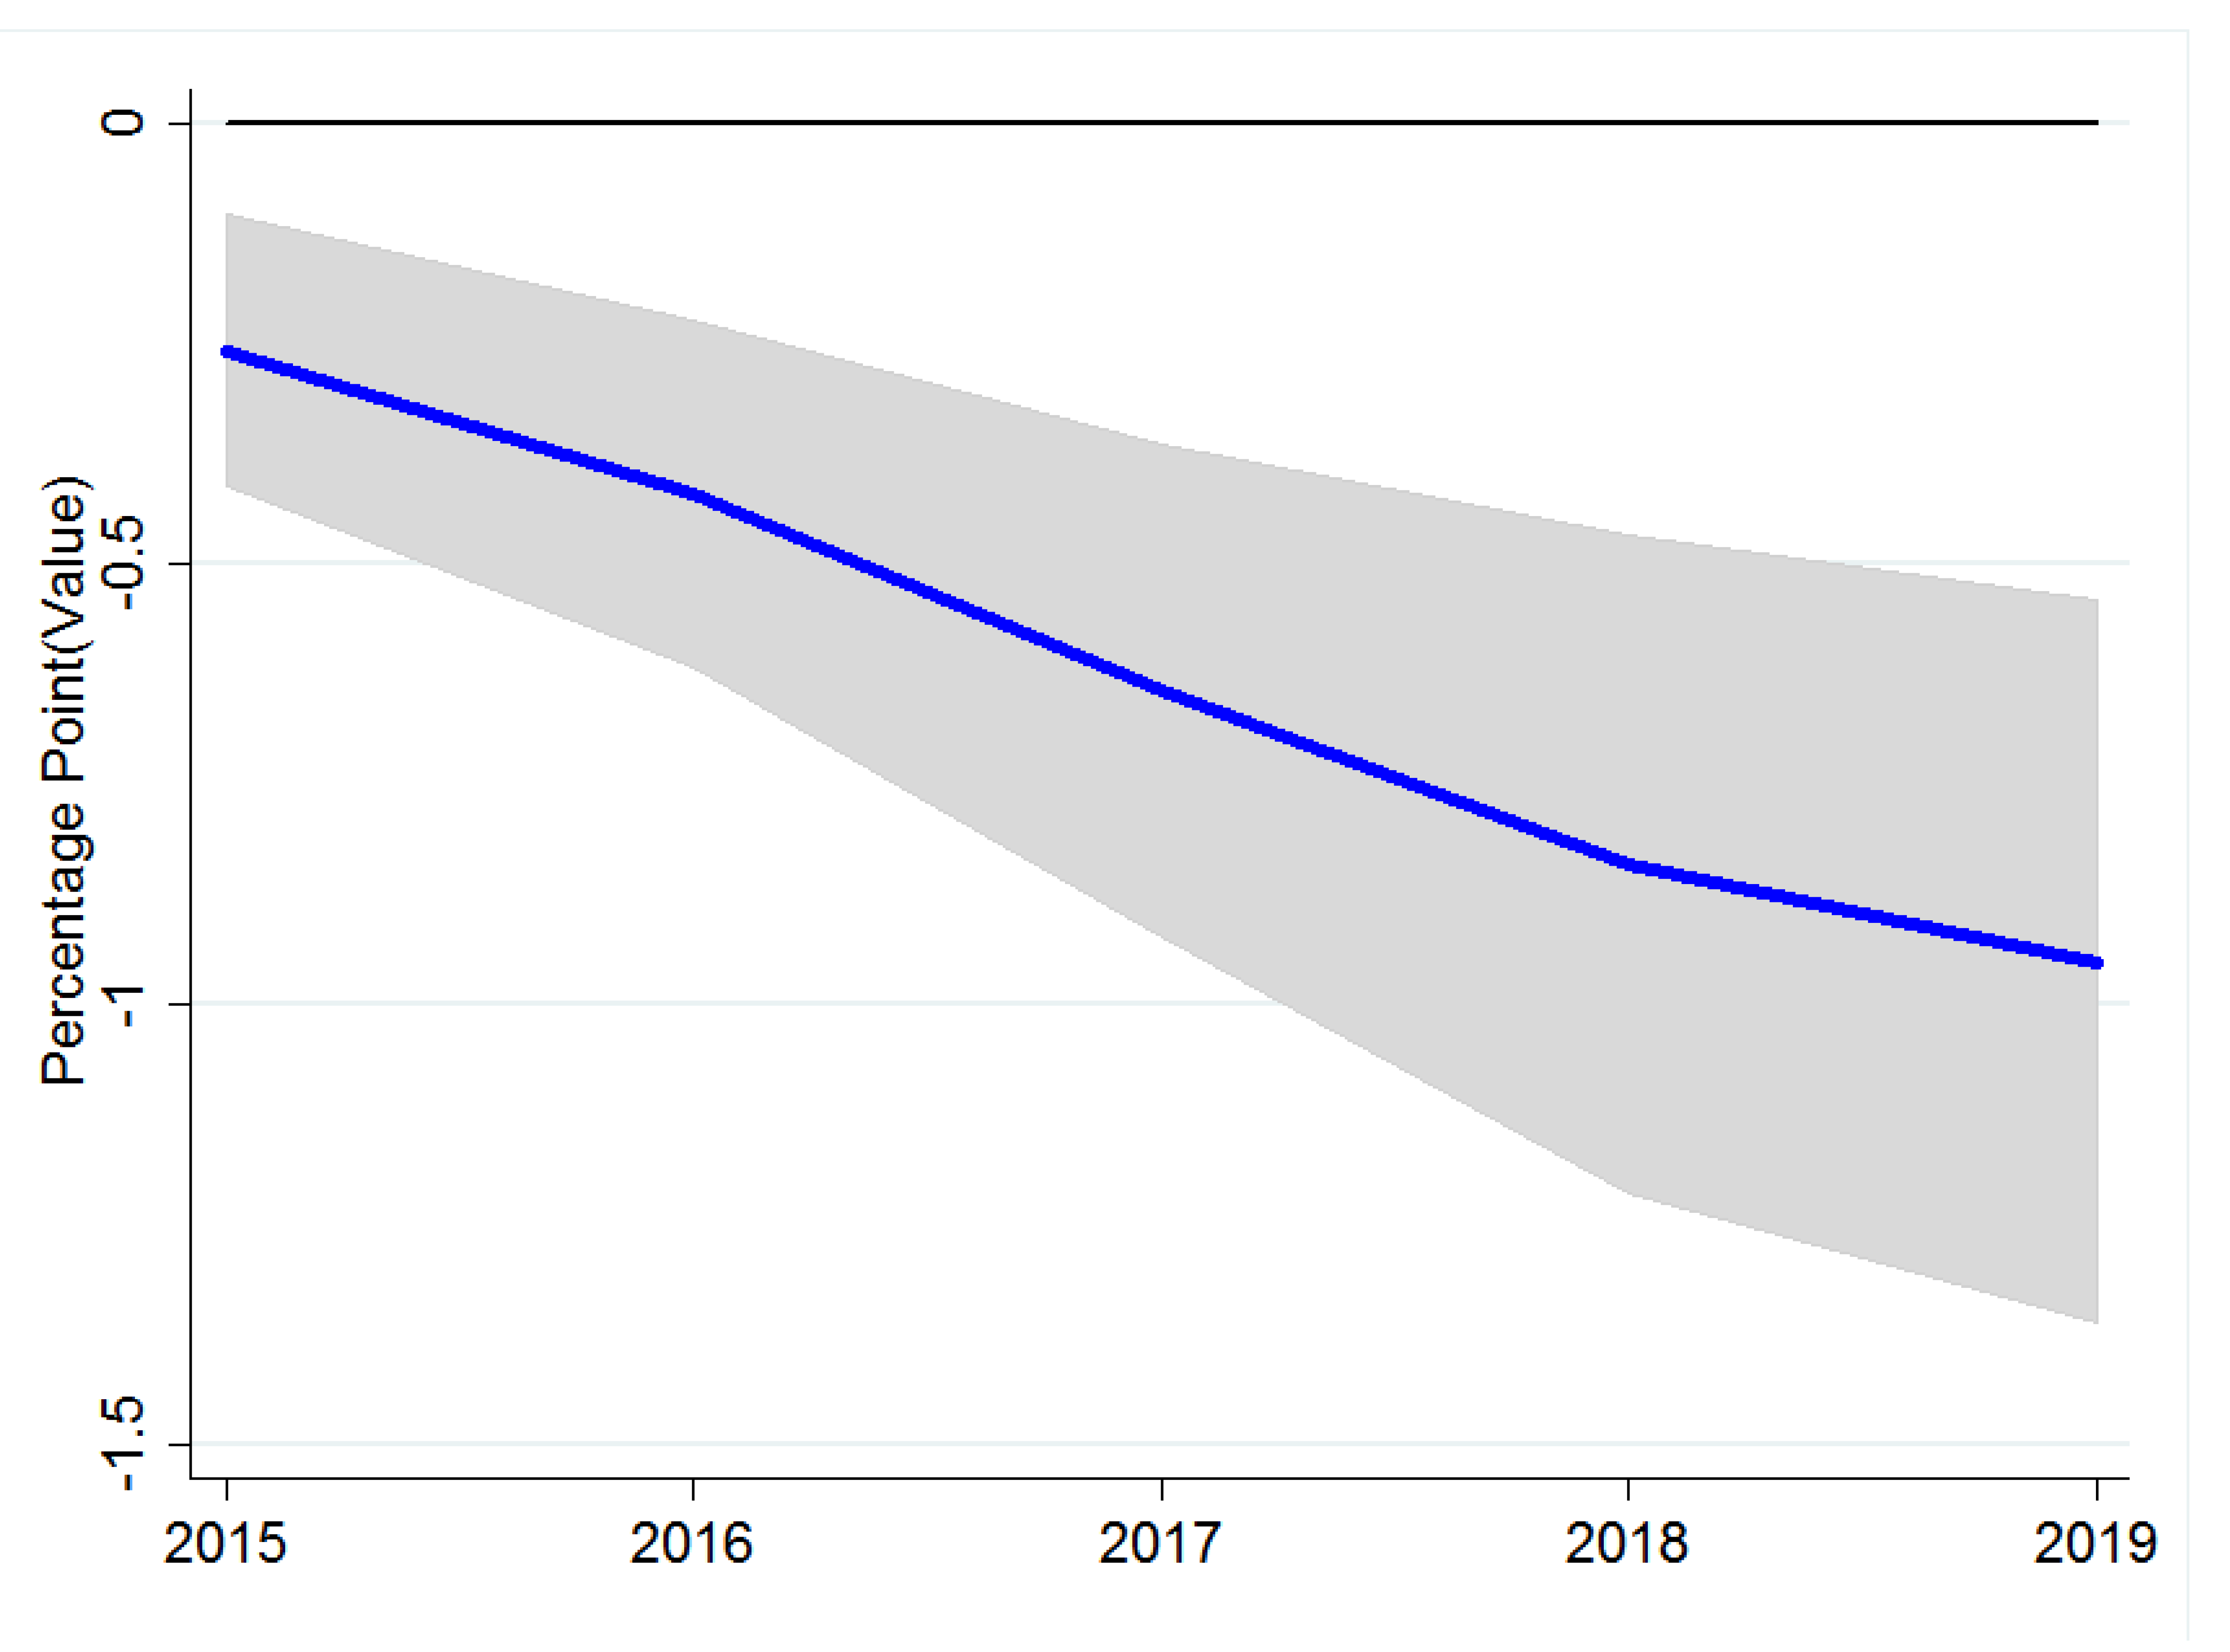
Table 4 includes the estimation results when Equation (1) is estimated for each forecast horizon (h = 0, 1, …, 4). Figure 1, which is a standard IRF plot that is also used, for instance, by [46], contains the corresponding IRF. The figure is the graphical representation of the coefficients (the impulse responses) on the NGER shown in Table 4. Therefore, h = 0 is the year 2015 (the year of the implementation of the NGER), h = 1 is the year 2016, and h = 4 is the year 2019.
In Figure 1, the solid thick blue line depicts the cumulative impulse responses of MarketShare at the various forecast horizons, and the dark gray solid area represents the 95% confidence interval. As is evident from the figure, the NGER seems to reduce the share of Ecuador’s fish exports in total world fish exports. Thus, these findings may suggest that contrary to its aim, namely enhancing market access and international competitiveness, the NGER reduces Ecuador’s competitiveness in the world fish market. From Figure 1, one can see that the impulse response (IR) is negative and statistically different from zero in the year 2015. The NGER was in force for only 5.5 months in 2015, but policy measures often need some time to unfold their impact. The significant negative impact in 2015, thus, casts some doubt on the interpretation of the findings as a causal effect.
Indeed, around the same time as the adoption of the NGER, the fish export market experienced a shift in consumer preferences, particularly in the two important trading partners, the EU and the USA, and for Ecuador’s main fish product, tuna [29]. Purchasing decisions are increasingly determined by product attributes, taste, price, and food safety concerns, as well as sustainability issues [56,57]. Put differently, the negative impact of the NGER on the market share that Figure 1 indicates should not be interpreted as a causal impact. It could merely be a correlation.
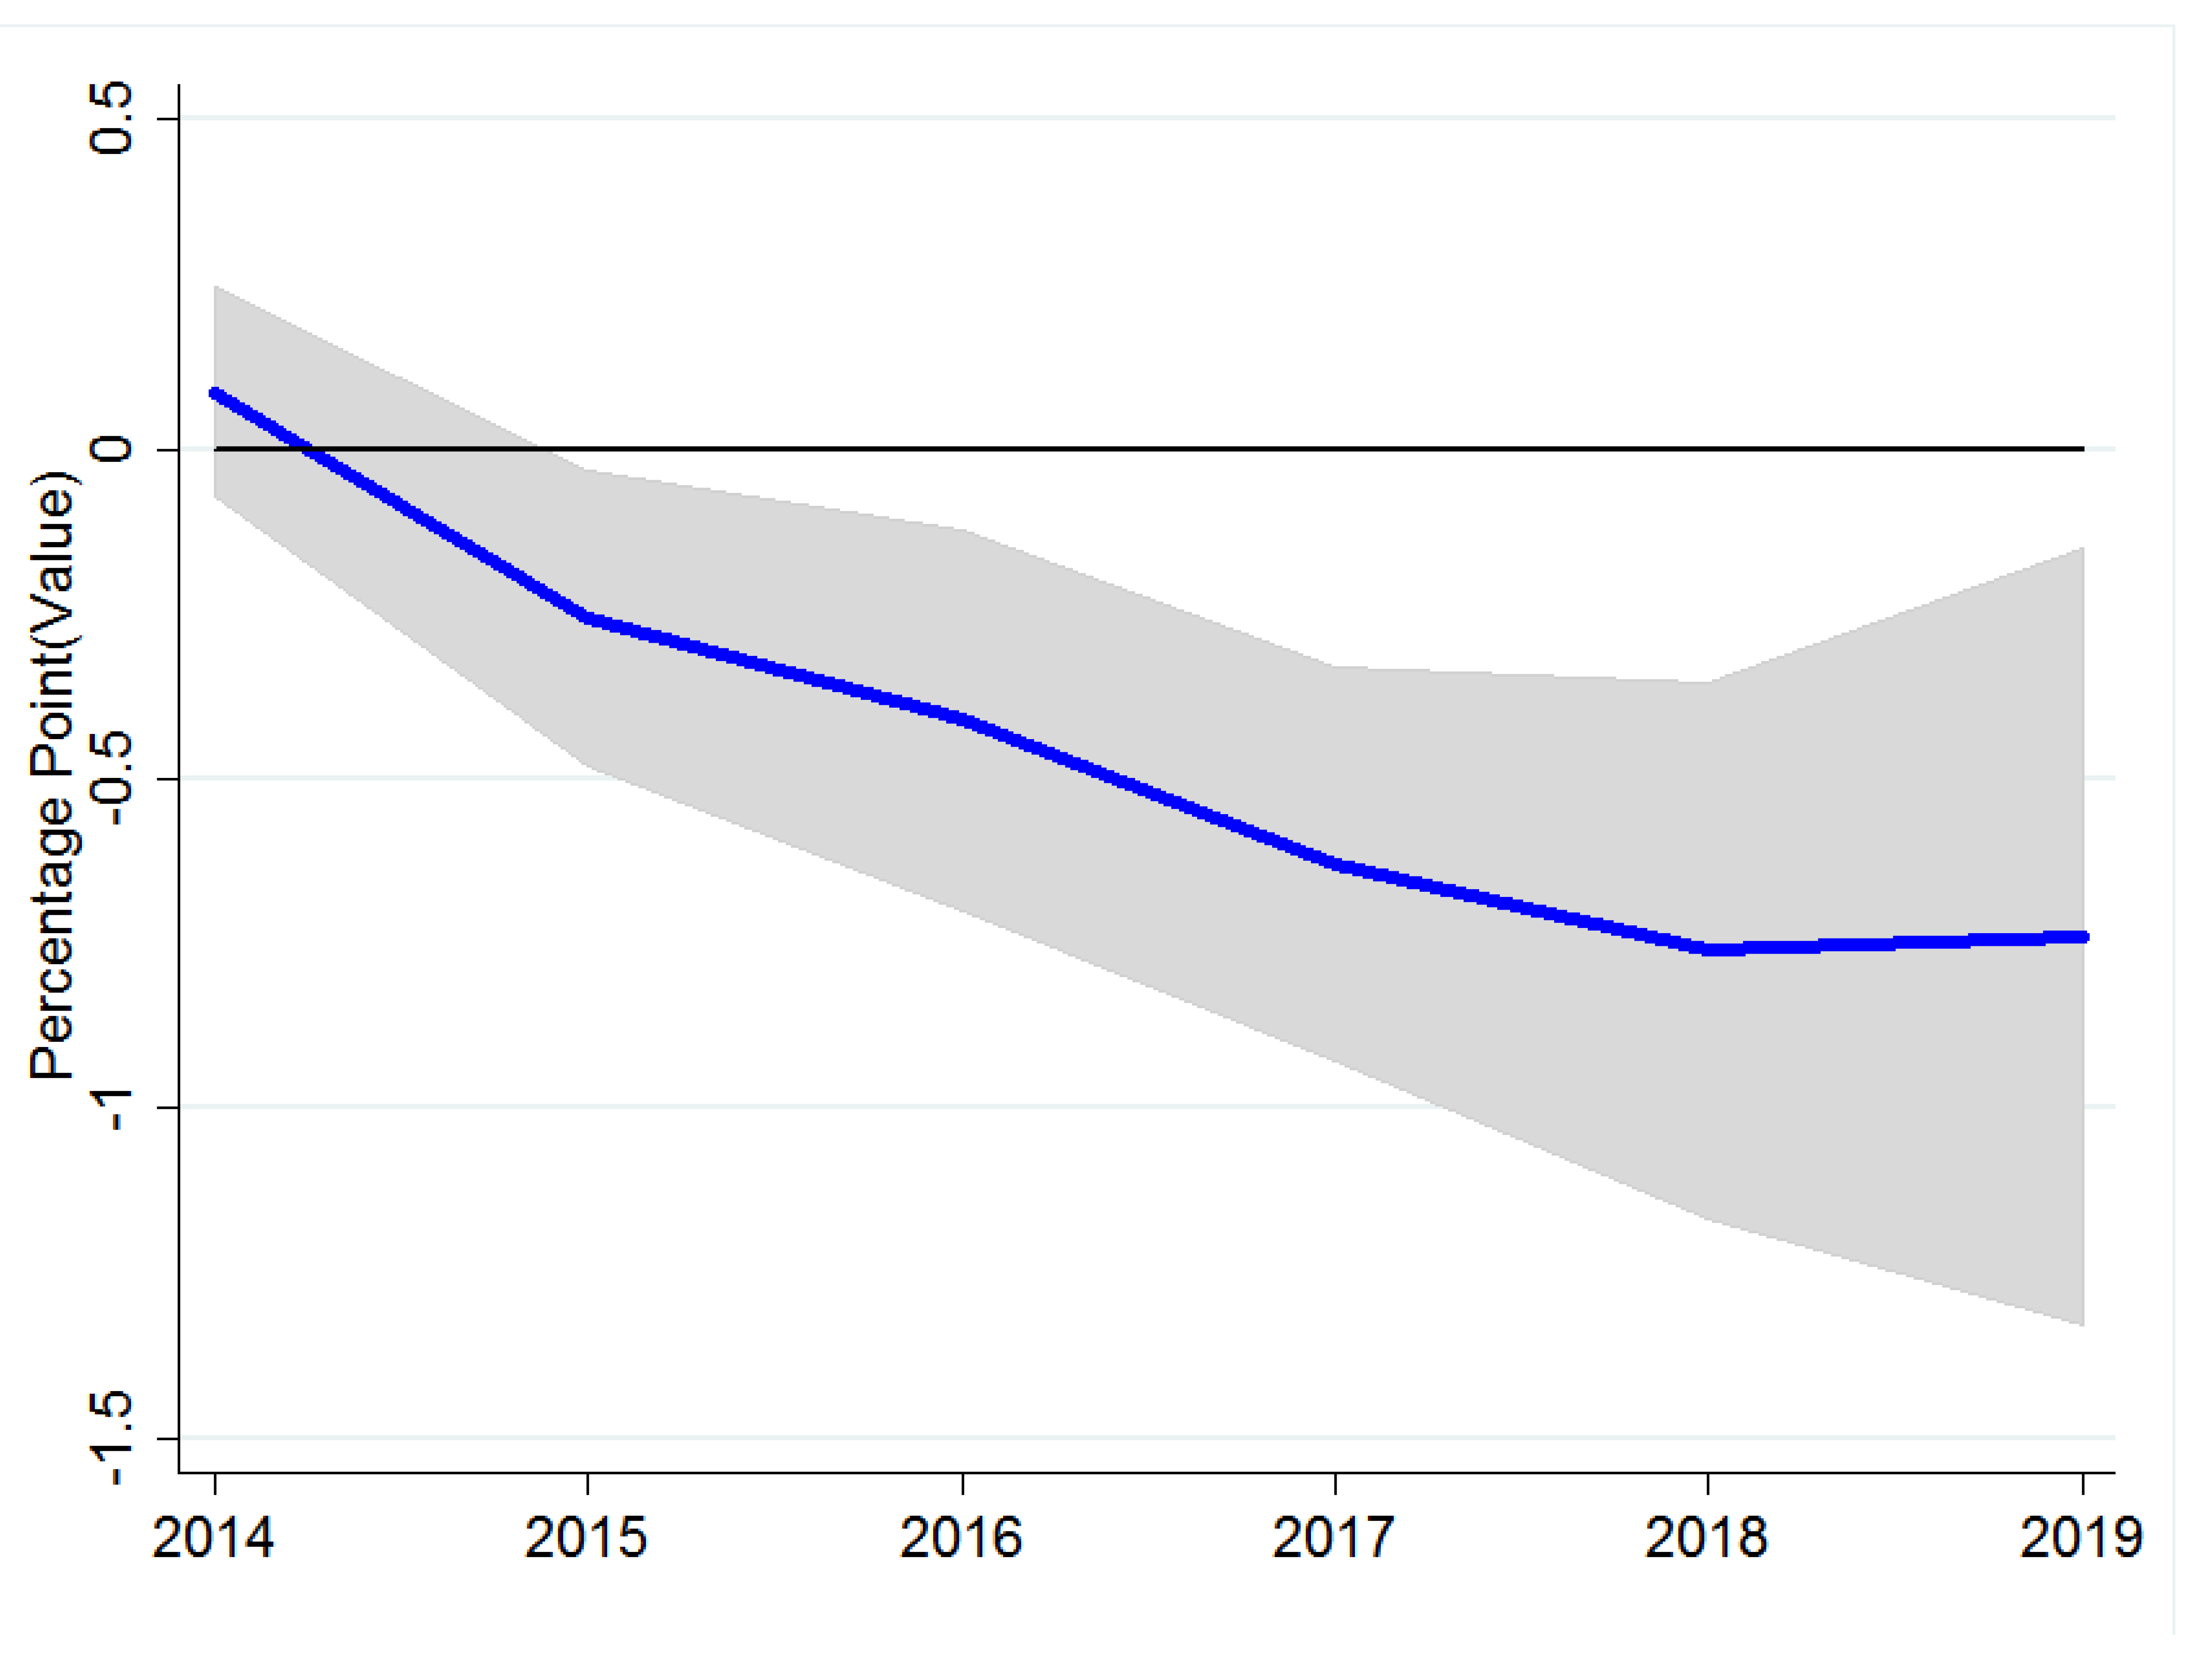
In order to investigate this issue further, this study conducts a placebo test. Specifically, variable NGER is substituted in Equation (1) by a dummy variable (“Dummy2014”) with entry 1 in 2014 and 0 otherwise. The basic idea is that, in 2014, the NGER was not in force and, thus, could not be at work. If the “shock” from Dummy2014 results in a similar IRF to the one received from the NGER, this casts severe doubt on the NGER being the cause for the drop in MarketShare. Indeed, as Figure 2 signals, the IFR from the placebo test is remarkably similar to that contained in Figure 1 for the NGER.
Comparing the IRs in Figure 1 and Figure 2 horizon-wise (horizon 0 in Figure 1 and horizon 1 in Figure 2 correspond to the same year, 2015) indicates that the impact of Dummy2014 is of comparable size to the impact of the NGER. The confidence intervals are also overlapping, which implies that the IRs are not statistically different. Thus, the NGER has no negative causal impact on MarketShare. Furthermore, the NGER also does not reduce the negative effect on international competitiveness, which set in around 2014 due to changing consumer preferences in the US and the EU. In this sense, the results are consistent with the view that Ecuador’s NGER is ineffective (neutral), at least in the short run. The NGER does not achieve one of its declared goals, namely making Ecuador’s fish exports more competitive in the world fish market, but it is also not the reason for the drop in the market share that Ecuador has been experiencing since 2014.
5.3. Impact of the NGER on Average Price of Fish Exports and Export Volume
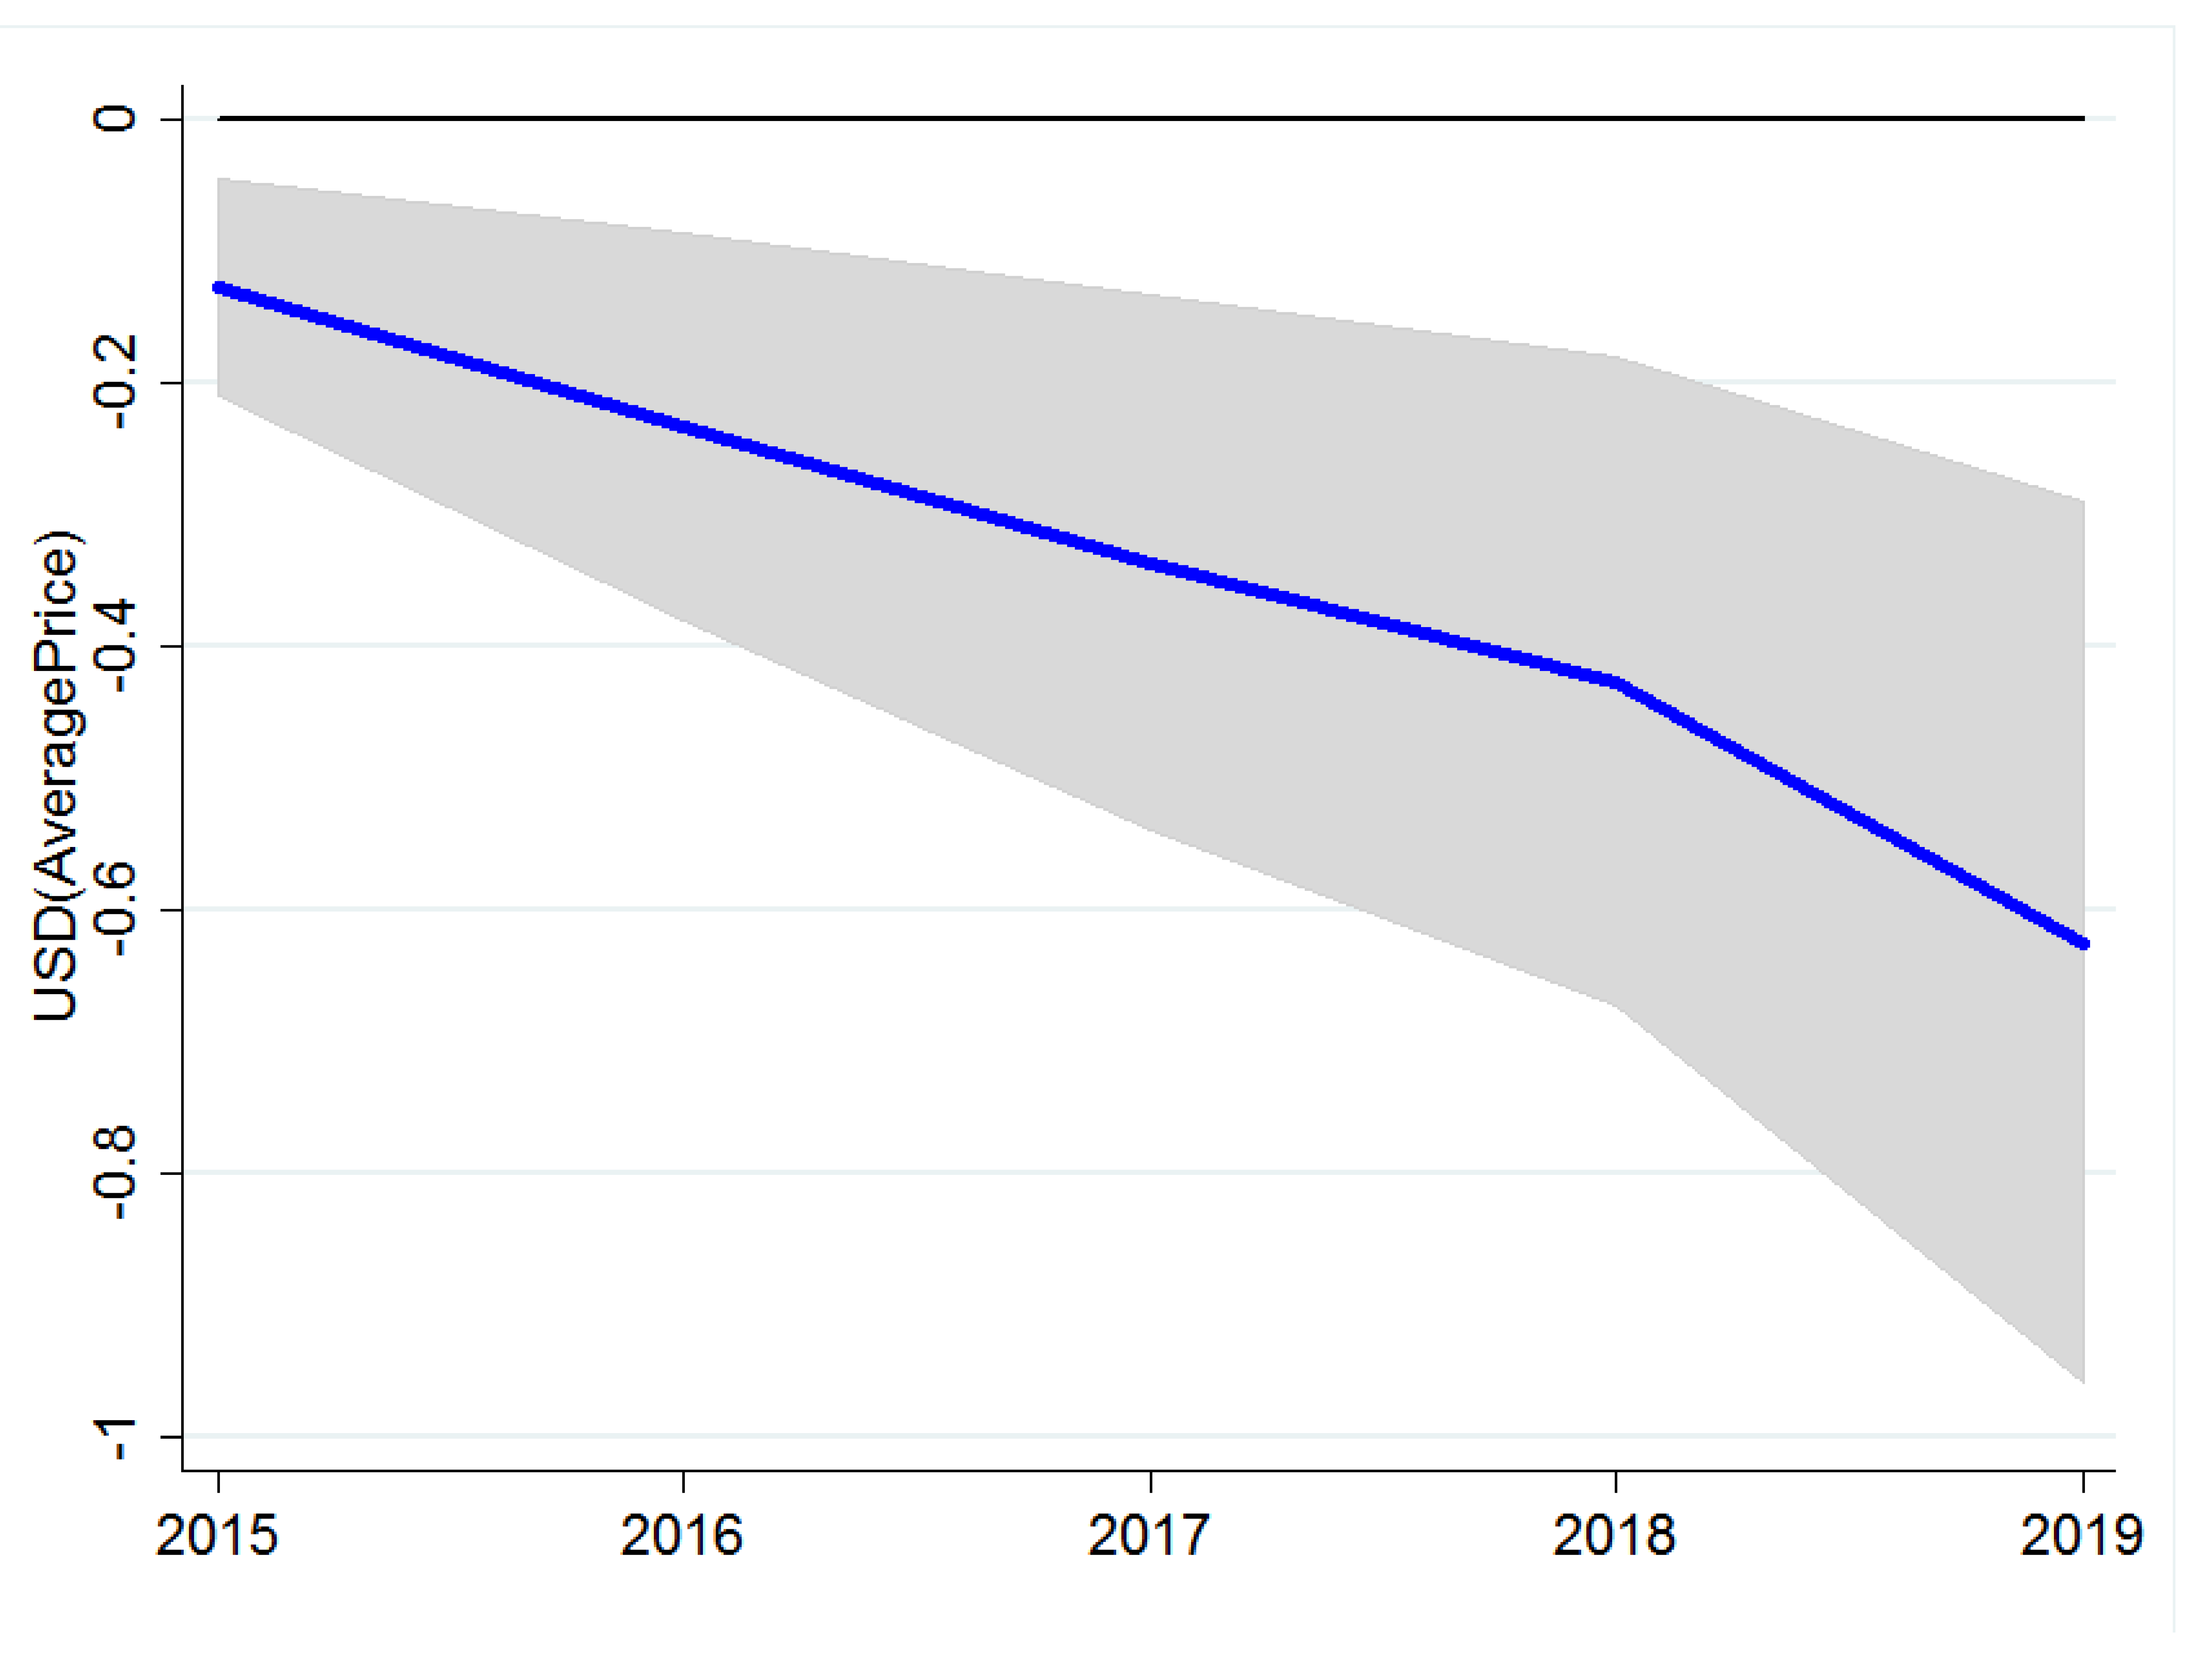
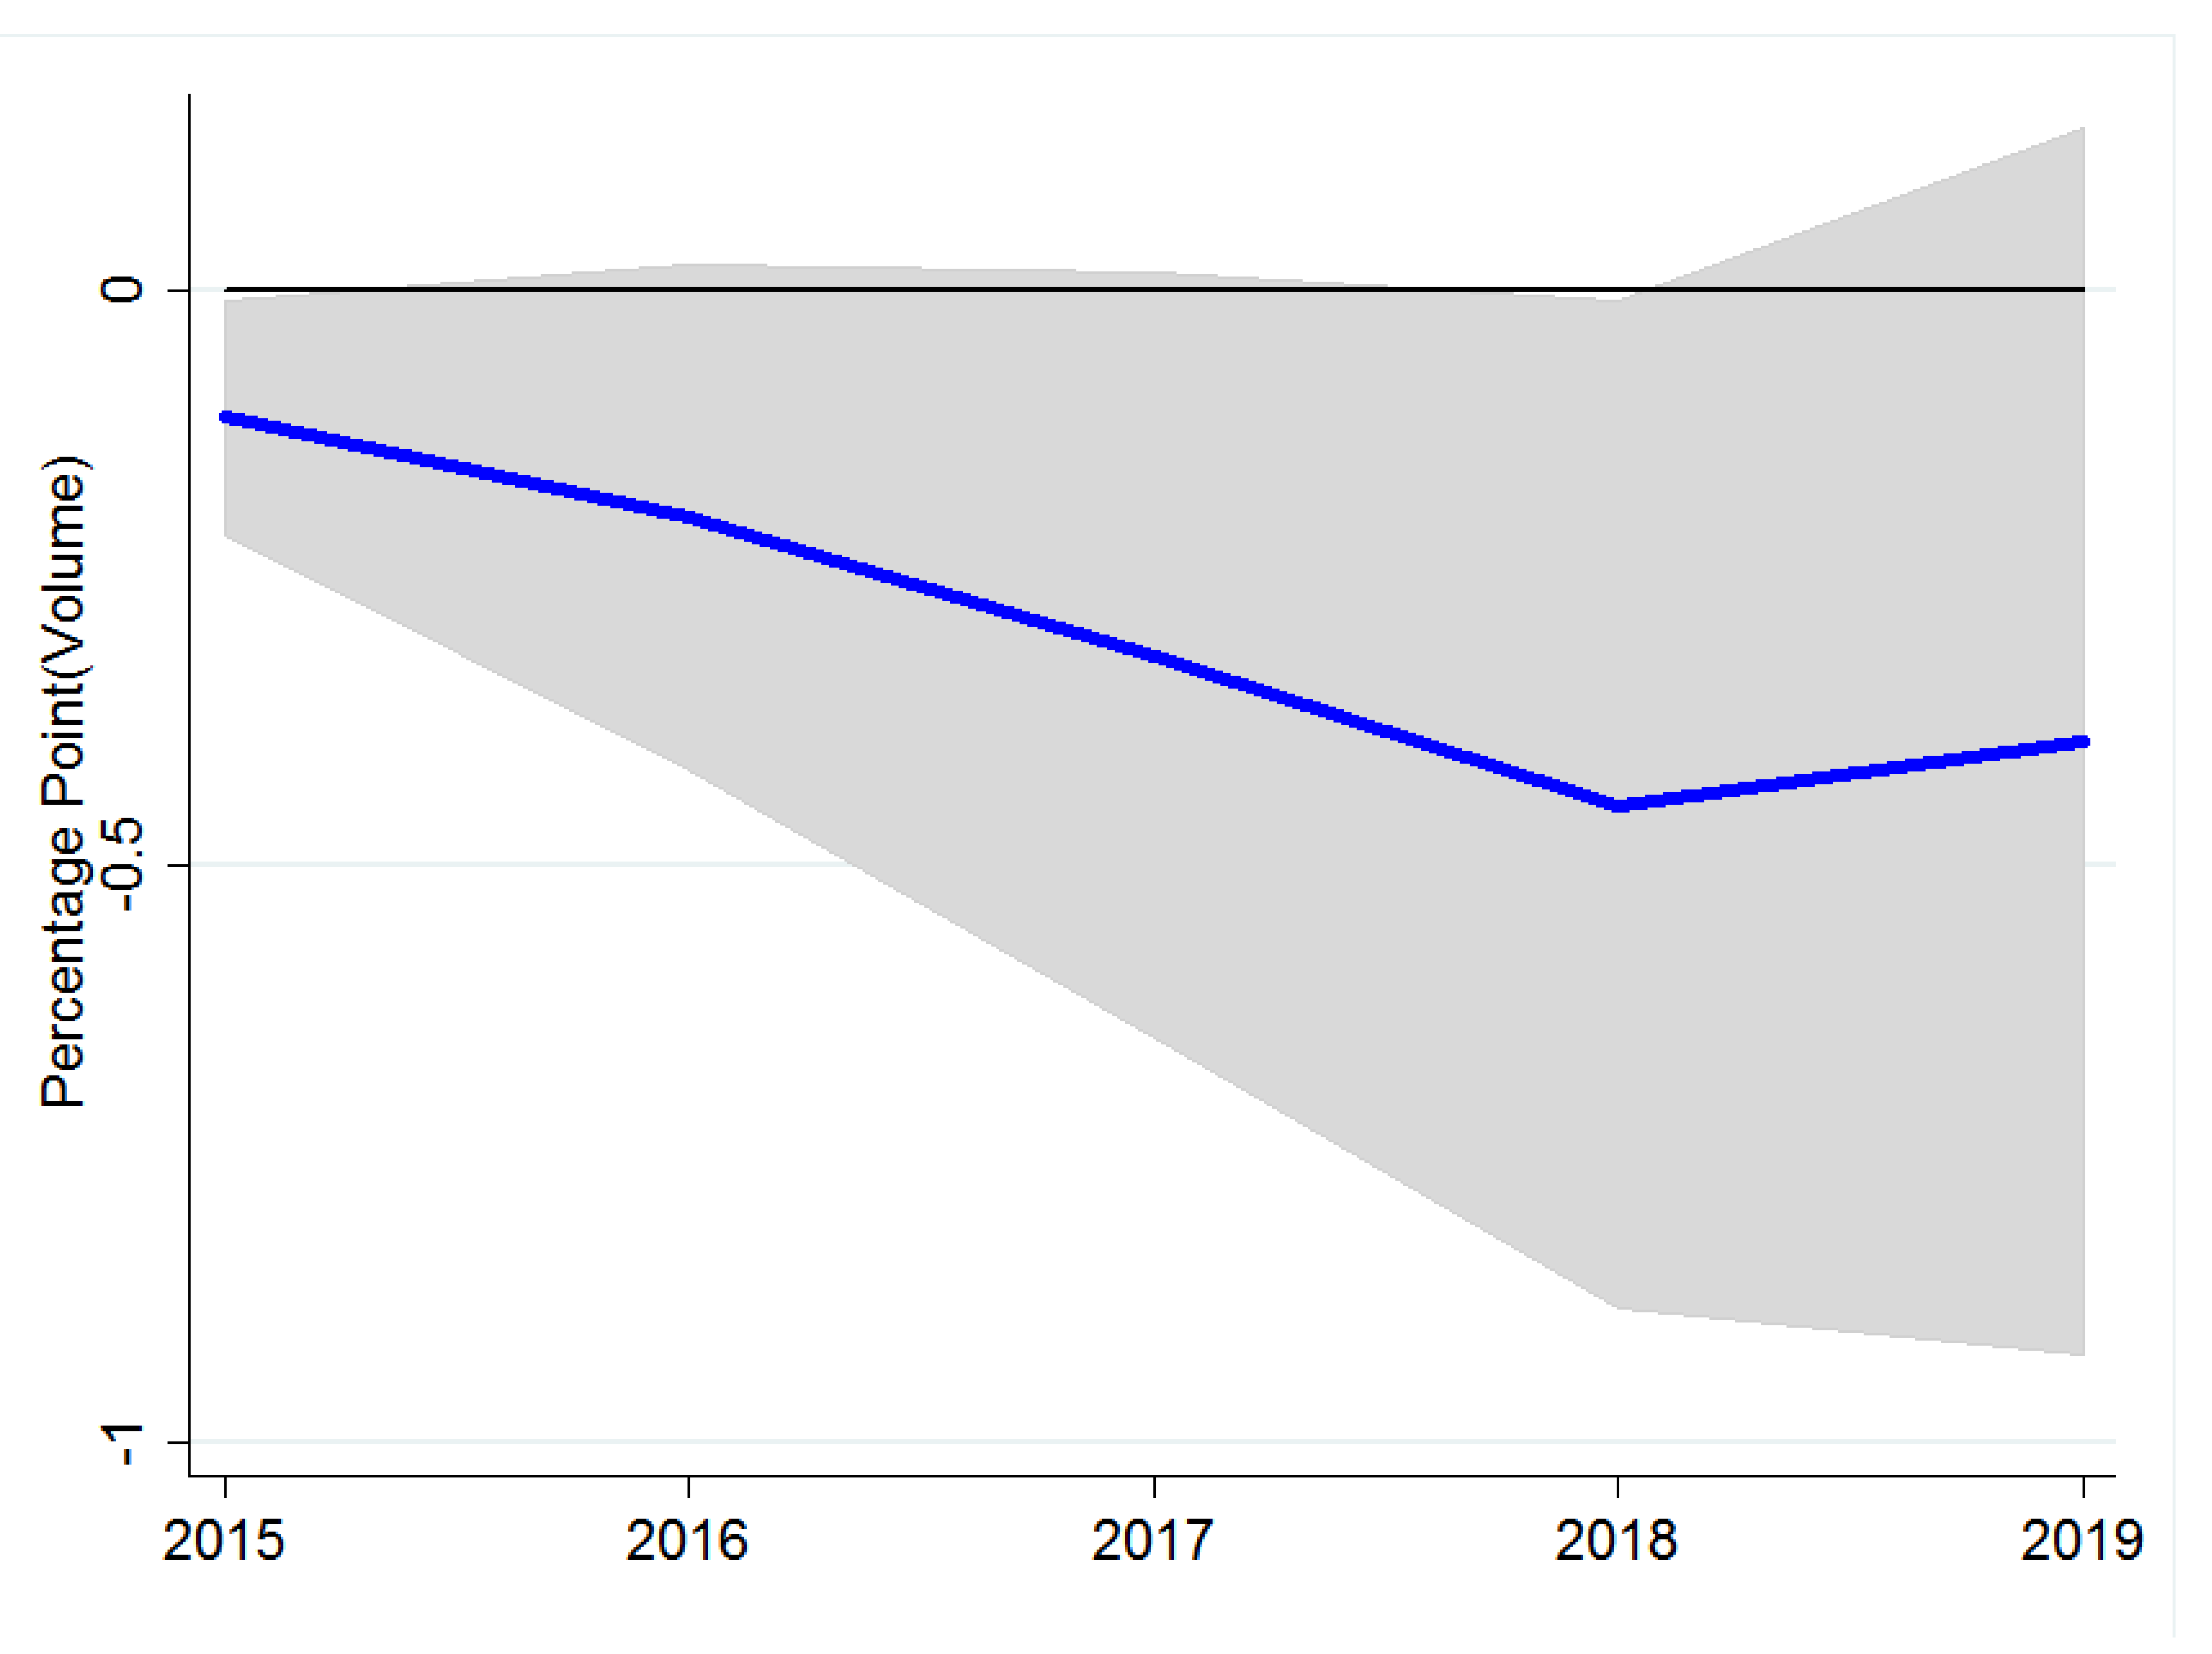
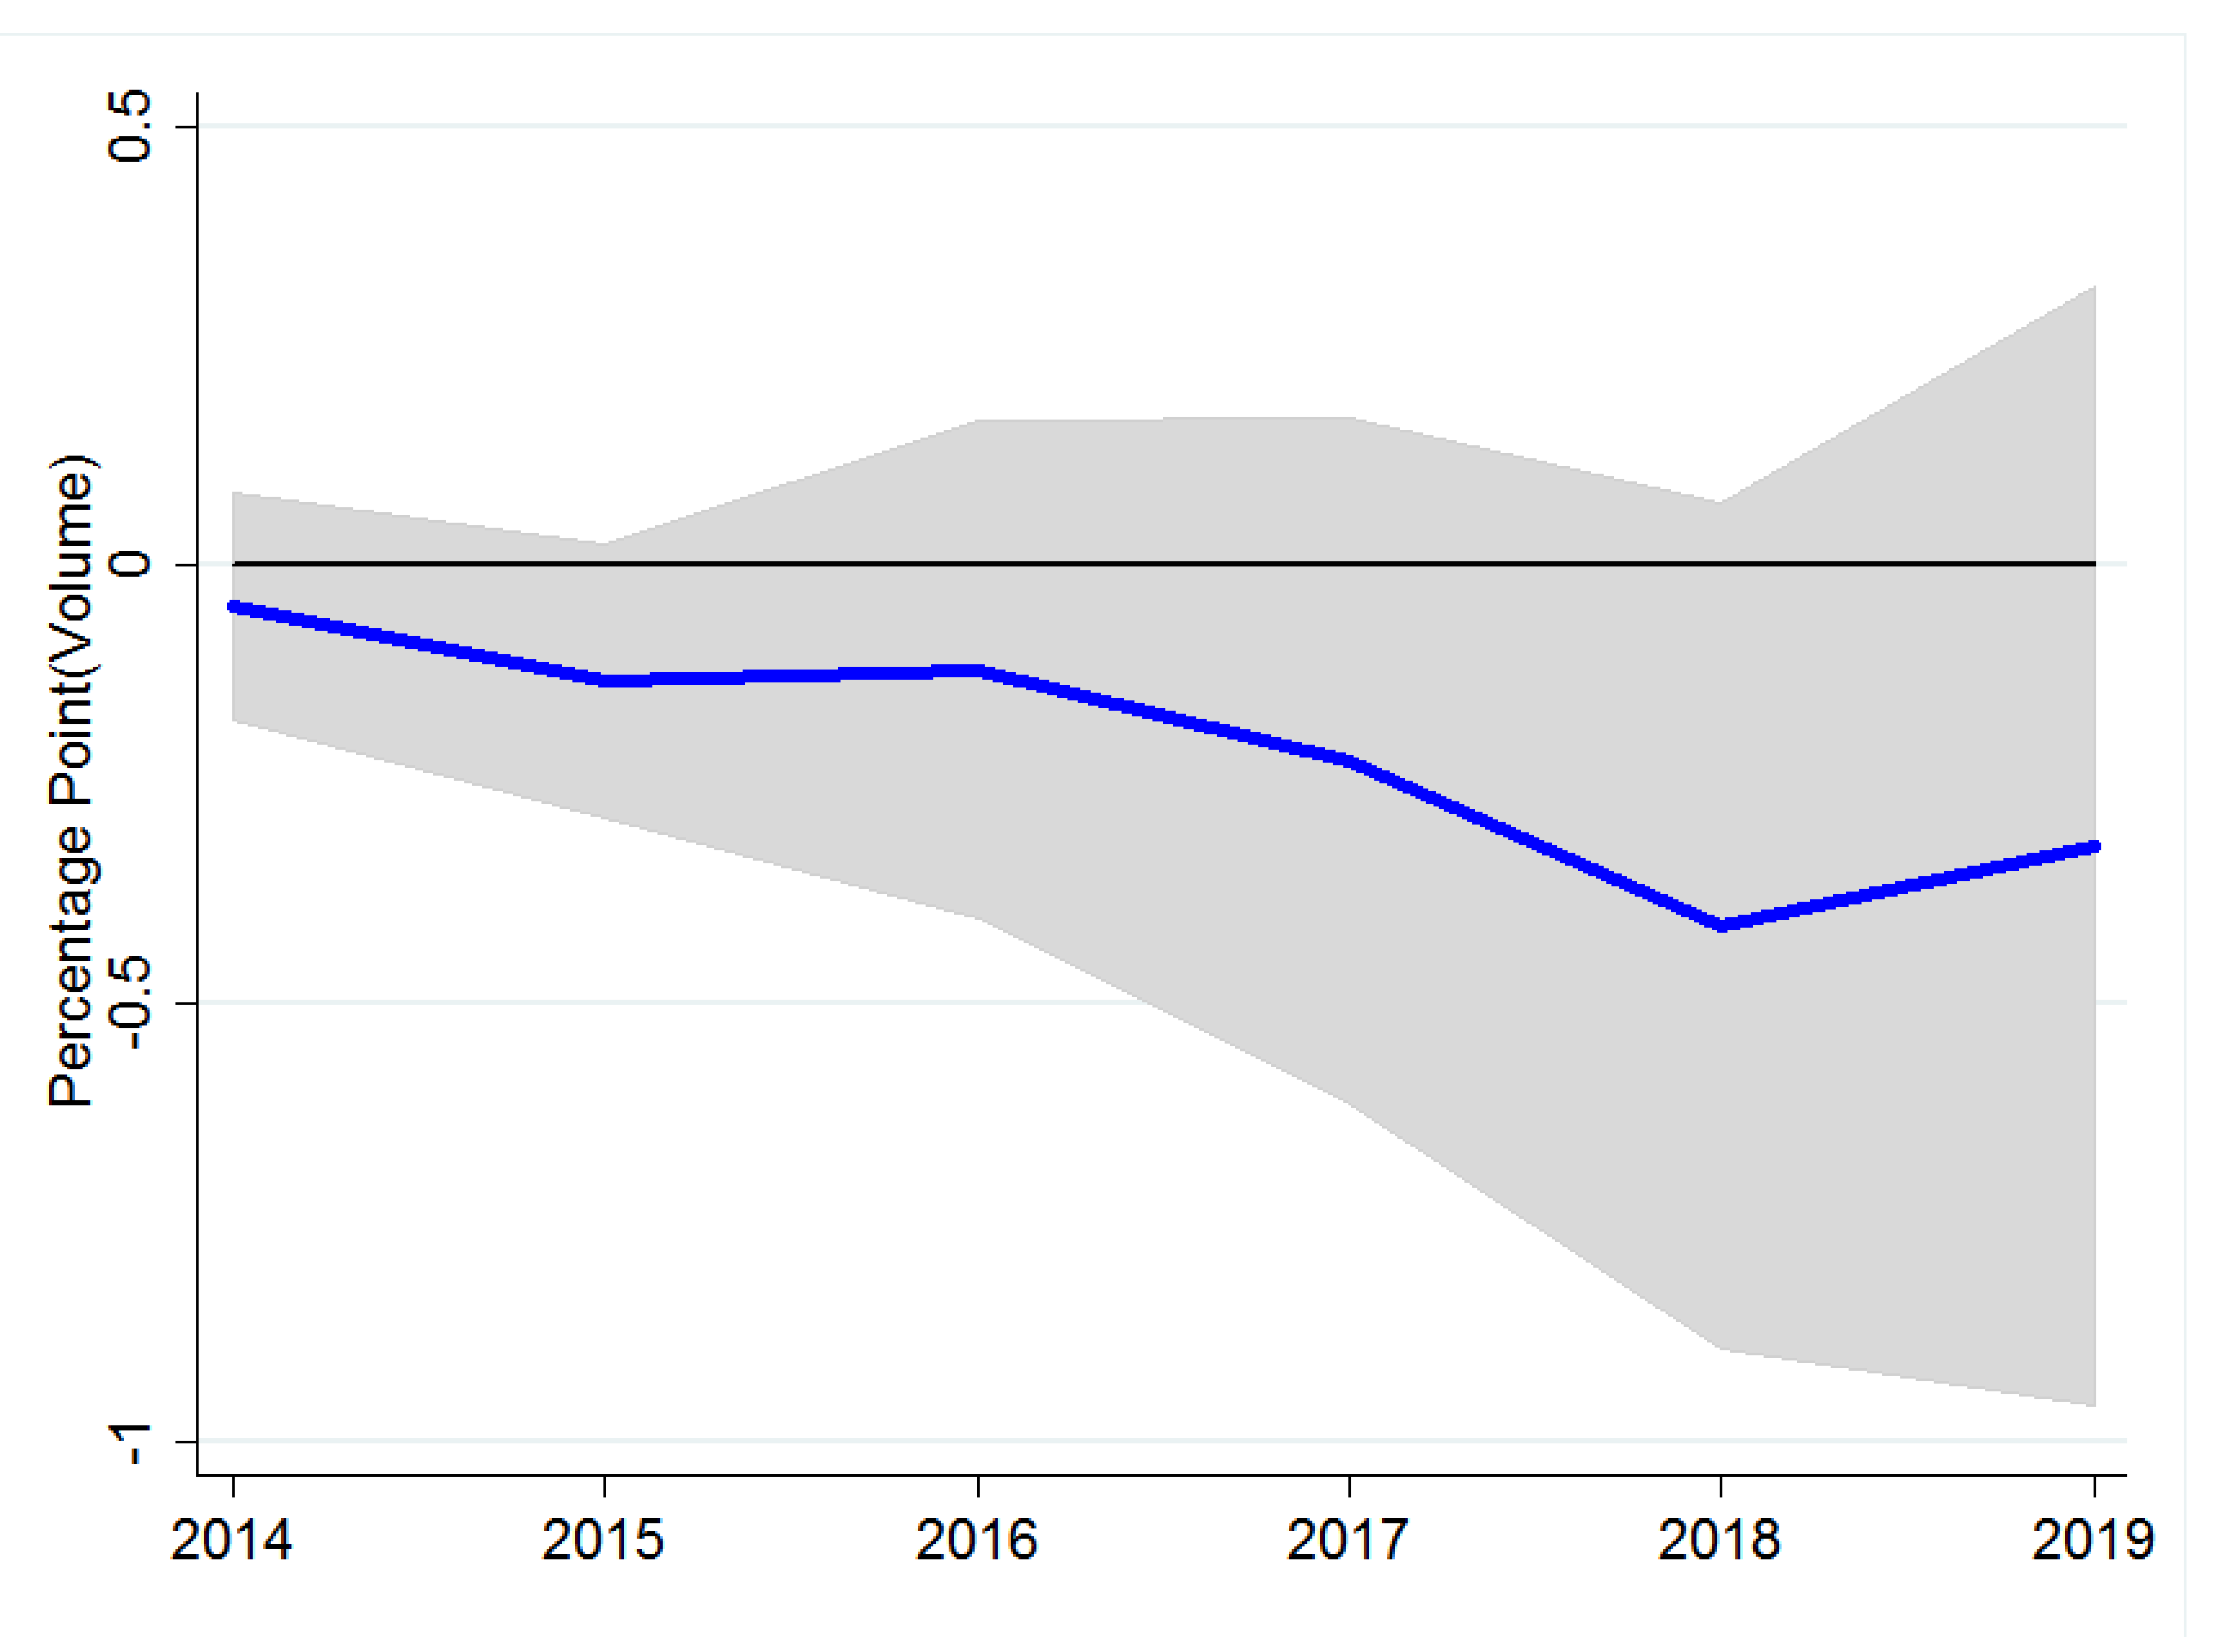
The value of fish exports can be split into the average price (in USD) of fish exports and the volume of fish exports. To investigate whether the NGER is correlated with prices and/or volume of exports and whether the NGER could stop the drop in prices and/or in export volume which arose due to changing consumer preferences, the study estimates Equation (1) with MarketShare substituted by variables “AveragePrice” and “Volume”, respectively. The related IRFs are shown in Figure 3, Figure 4, Figure 5 and Figure 6.
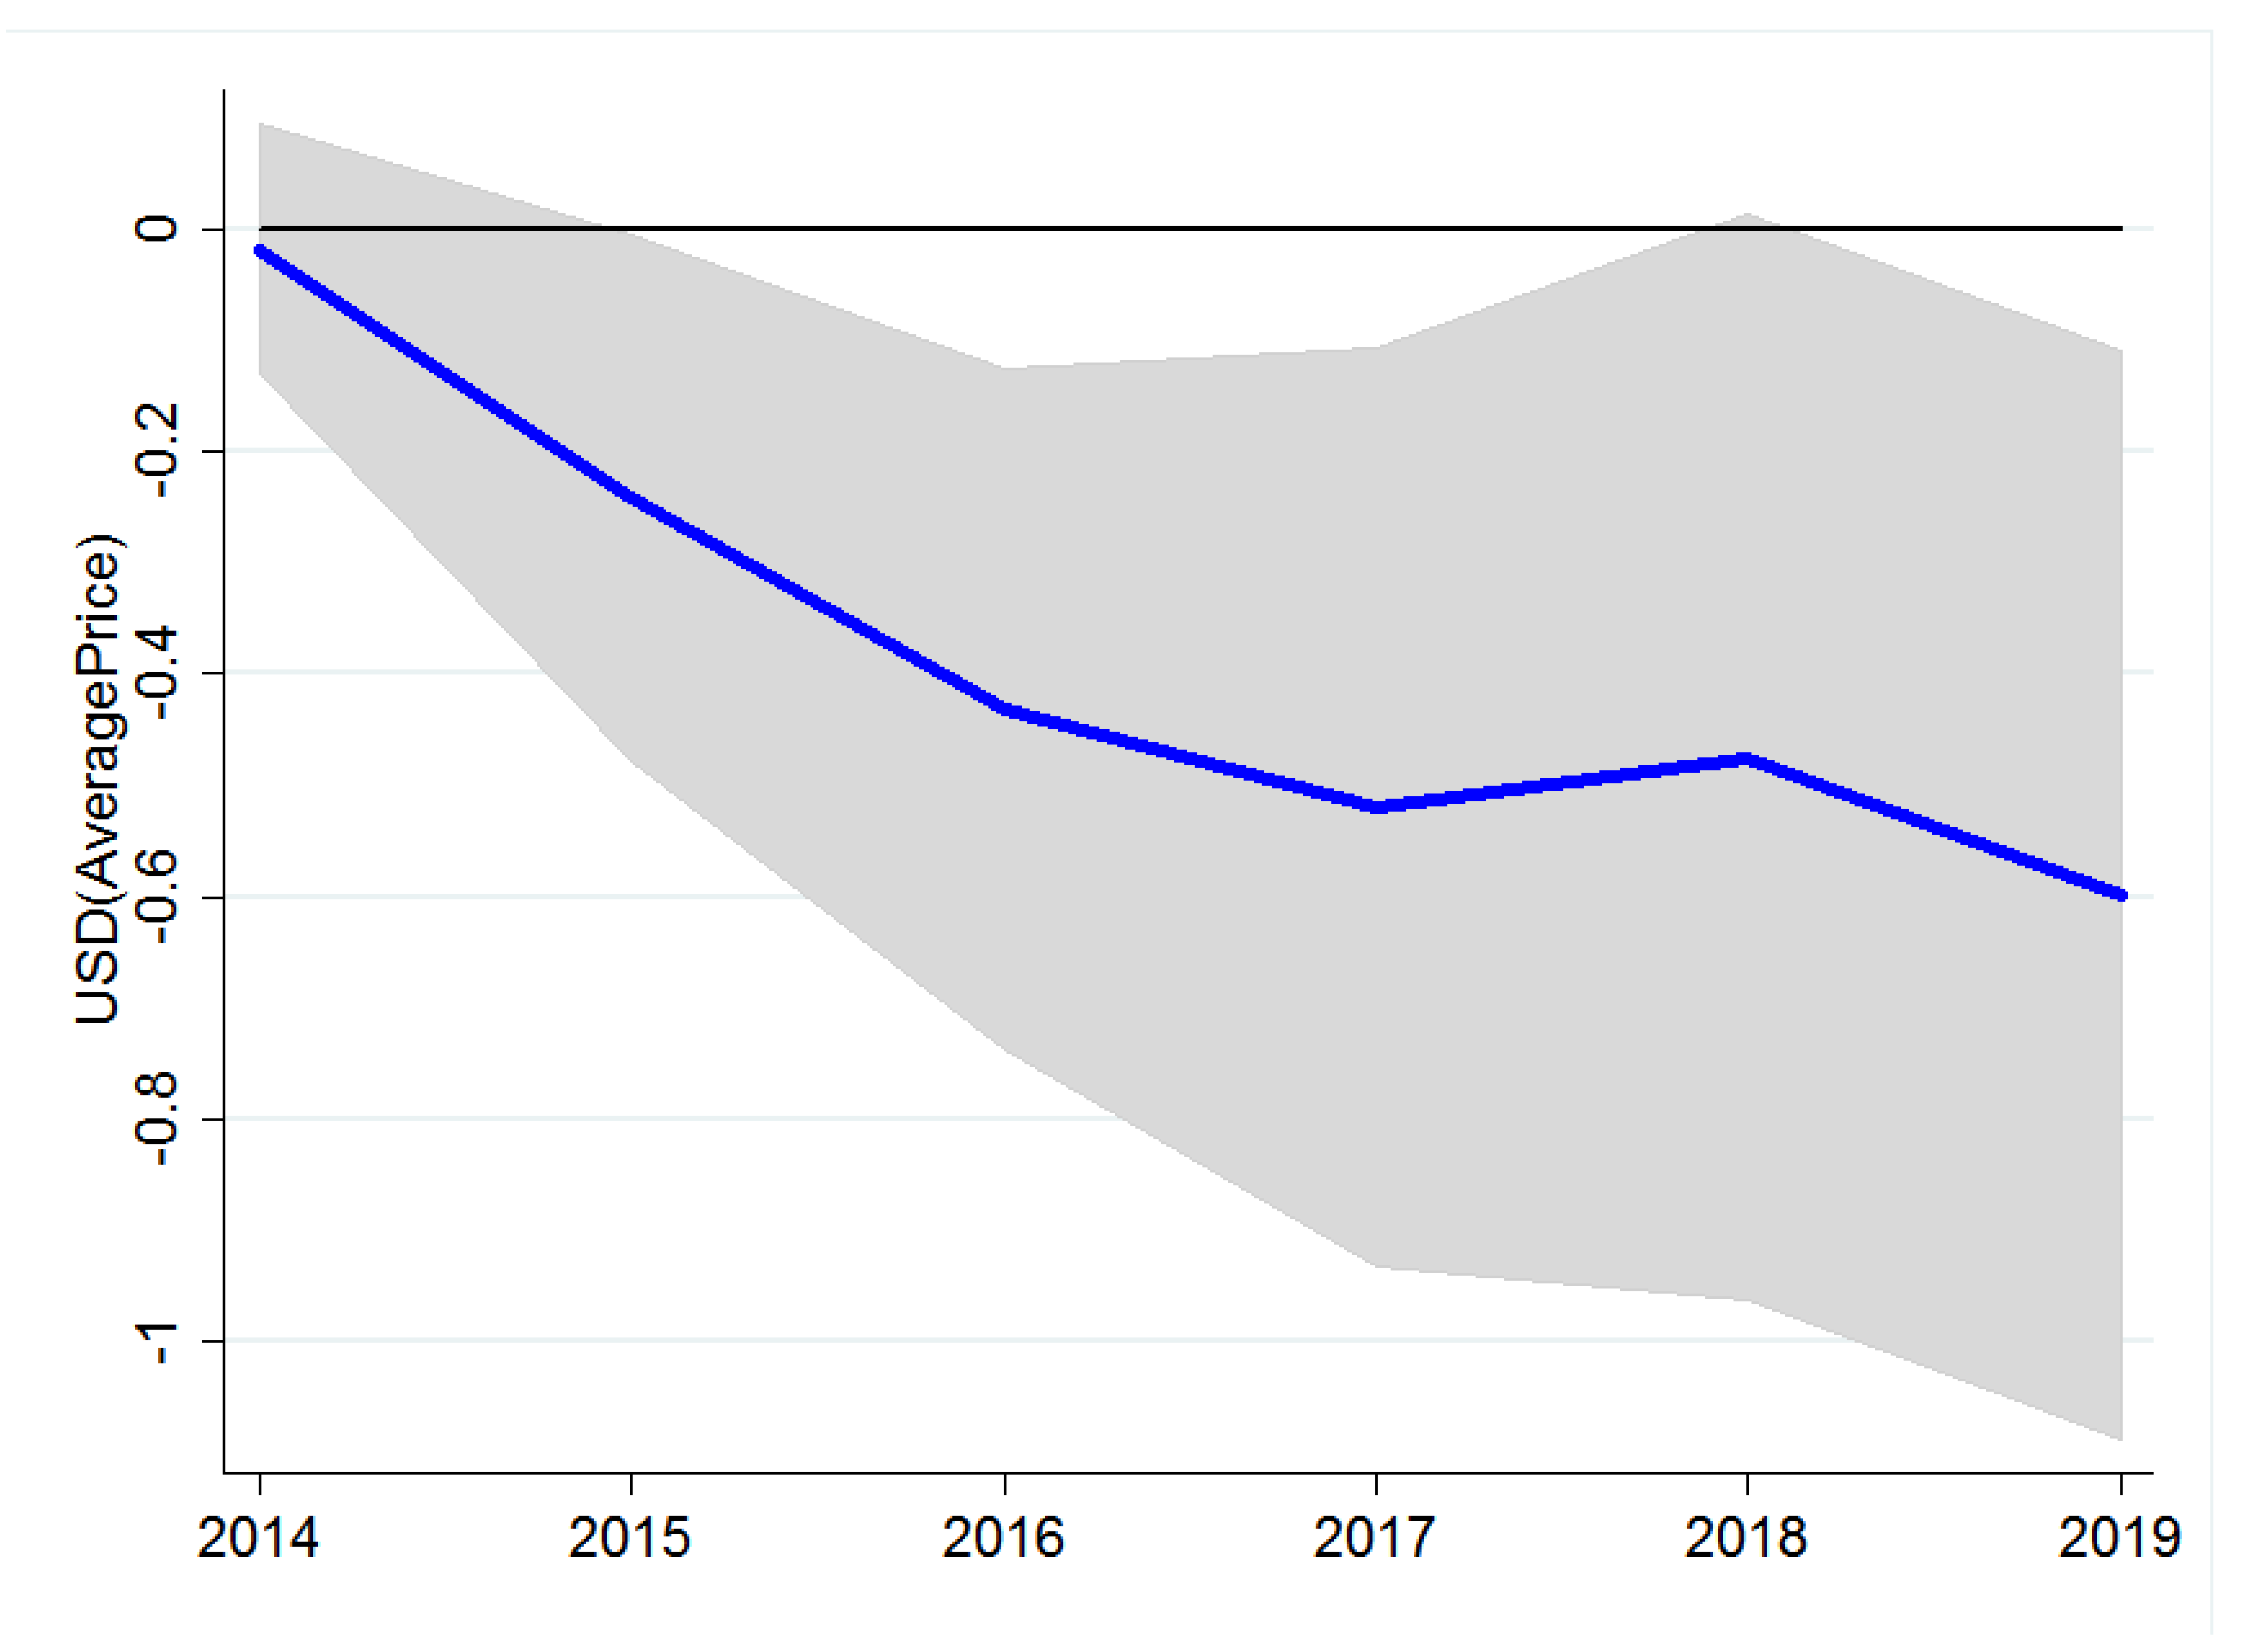
From the figures, one can see that the real average price is particularly negatively correlated at the various horizons with the NGER. In the case of Volume, there is not a statistically significant difference from zero regarding the effect. However, as for MarketShare, this effect is not to be interpreted causally as the IRFs from replacing the NGER with Dummy2014 are statistically not distinguishable from the IRFs derived using the NGER as a policy innovation.
The neutrality of the NGER with respect to AveragePrice is notable, not least as the NGER, inter alia aims to increase the sustainability of fish exports which should, in turn, lead to higher export prices [58]. Yet, according to these findings, by comparing the IRs shown in Figure 3 and Figure 4, the NGER is not able to stop the fall in the average price.
6. Discussion and Recommendation
The findings of this study indicate the difficulties that developing countries face in their pursuit of achieving sustainability in production. For example, the NGER recommends the adoption of strict traceability guidelines. Traceability can influence consumer purchasing decisions by providing essential information regarding seafood [59], and traceability helps to distinguish high-quality from low-quality products. Traceability is also a valid strategy to protect consumer health in both developed and developing nations [60]. However, adhering to traceability requirements is a challenging task for developing nations due to their limited financial resources as well as the lack of material and immaterial infrastructure [61,62]. Specifically, developing nations often lack the administrative facilities to handle the complex certification process needed to fully implement traceability [63].
What follows from these results for the effective implementation of National Green Export Reviews? First, it is essential to have a clear understanding of how to implement sustainable practices from the producer’s (fishermen’s) point of view [64]. Voluntary measures might not be sufficient to incentivize fishers and fish producers to revert to more sustainable production, catching, and raising of fish. The government needs to incentivize (or force) the major players in the market to prioritize ecologically friendly aquaculture methods [65] along with better management and control of fishery resources at all levels [66]. Strict laws and their strict enforcement, as well as subsidies that help fishers during the transformation process, are essential measures for “going green and sustainable” [67].
Second, Ecuador also needs to have proper facilities, which includes the appropriate material and immaterial infrastructure, for effective implementation of the NGER. Complying with standards and certification must be efficient and easy for fisher and fish producers.
Third, the government also needs to pay attention to building up trust in food security at all levels of the supply chain via strict and effective inspections. A reputation of good (institutionalized) security standards can assist the exporters in receiving a premium price from consumers, which, in turn, helps in offsetting the rising cost of trade due to the NGER [68]. Furthermore, for policies to be effective, they should be integrated and consistent with the standards required to avoid unnecessary restrictions [69], which is crucial for securing a minimum market share at a lower selling price [70].
Fourth, Ecuador has to create an effective and modern accounting management register system to record fish catch and to control the market to achieve targeted price levels by promoting sustainable fisheries [8]. Keeping a close eye on compliance-related elements should help in establishing a cost-effective strategy, and it should be conducive to evaluating the effectiveness of existing regulations in light of enforcement requirements [71].
Fifth, possible changes in consumer preference must be considered when planning and implementing trade policies [72]. Gaining some ideas about (changes in) consumer preferences, for instance, through consumer surveys, focus groups, and interviews may aid in the formulation of effective policies [73]. In case far-reaching changes in preferences are indicated, effective communication of how the new policy is consistent with these changes should be of help to convince consumers that fish products comply with their preferences. Put differently, communication, via advertising, marketing, and fairs, of how the new policies comply with consumer preferences is key.
7. Summary
The “National Green Export Review” (NGER) is a means to adopt Voluntary Sustainability Standards (VSSs). In the case of Ecuador, the NGER was implemented in 2015 and aimed at making Ecuador’s fishing industry more sustainable in order to improve the international market access to Ecuador’s fish products. This study applies the local projection approach to explore the dynamic impact of the NGER on Ecuador’s share of fish exports in the world fish market.
The results indicate that the NGER is ineffective (neutral) with respect to enhancing the competitiveness of Ecuador’s fish products. The impulse response functions (IFRs) derived from the NGER are statistically similar to those derived from a “placebo shock” that occurred prior to the implementation of the NGER. This placebo shock leads to a negative impact on variables MarketShare and AveragePrice and likely captures a change in consumer preferences for fish products, especially for tuna, Ecuador’s main fish product (together with shrimp). The NGER is not able to compensate for the negative impact the change in preference has on Ecuador’s competitiveness in the world fish market. While the NGER does not have a positive impact on Ecuador’s share in the world fish market, the implementation of the NGER also does not act as a trade barrier. These findings are consistent with recent literature, which stresses that the effectiveness of VSSs depends on the infrastructure endowment of the country that adopts VSSs. In Section 6, this study provides policy recommendations on ways to improve Ecuador’s material infrastructure so that the NGER can be an effective means to make the fishing industry more sustainable and, in turn, to improve the international market access of Ecuador’s fish products.
This study is not without limitations. An obvious limitation is the brief time period since Ecuador adopted the NGER. It is possible that the NGER unfolds its positive impact only over a longer time span. Once longer time series are available, follow-up research could investigate whether the impulse responses to the NGER become positive and statistically different from zero in the long run. In addition, if time series data on individual fish species, especially tuna, are available, the analysis could be re-done with a view on the NGER’s impact on the market share of various fish species. From a statistical perspective, follow-up research could also investigate the presence of structural breaks in the fish export data that are used in this study. While this study uses data in first differences due to the presence of unit roots, there is still a possibility that structural breaks in growth rates bias the results of this study.
Author Contributions
Conceptualization, M.A.E. and M.L.; methodology, M.A.E. and M.L.; software, M.A.E.; validation, M.L. and T.C.; formal analysis, M.A.E.; investigation, M.A.E. and M.L.; resources, M.L.; data curation, M.A.E.; writing—original draft preparation, M.A.E. and M.L.; writing—review and editing, M.L.; visualization, M.A.E.; supervision, M.L. and T.C.; project administration, M.L. and T.C.; funding acquisition, M.L. and T.C. All authors have read and agreed to the published version of the manuscript.
Funding
This research received no external funding.
Data Availability Statement
Only publicly available datasets were analyzed in this study, as described in the text.
Conflicts of Interest
The authors declare no conflict of interest.
References
- Kumar, R.; Kumar, R.R.; Stauvermann, P.J. Effect of fisheries subsidies negotiations on fish production and interest rate. J. Risk Financ. Manag. 2020, 13, 297. [Google Scholar] [CrossRef]
- Béné, C. Small-Scale Fisheries: Assessing Their Contribution to Rural Livelihoods in Developing Countries; FAO Fisheries Circular, Food and Agriculture Organization (FAO): Rome, Italy, 2006. [Google Scholar]
- FAO. The State of World Fisheries and Aquaculture (2020); Food and Agriculture Organization (FAO): Rome, Italy, 2020; Available online: http://www.fao.org/fishery/sofia/en (accessed on 25 August 2022).
- FAO. The State of the World Fisheries and Aquaculture 2016; Food and Agriculture Organization (FAO): Rome, Italy, 2016; Available online: https://www.fao.org/publications/sofia/2016/en/ (accessed on 25 August 2022).
- World Bank. Blue Economy. Available online: https://www.worldbank.org/en/topic/oceans-fisheries-and-coastal-economies (accessed on 22 June 2022).
- UNCTAD. Fishery Exports and the Economic Development of Least Developed Countries; UNCTAD: Geneva, Switzerland, 2017. [Google Scholar]
- Golub, S.; Varma, A. Fishing Exports and Economic Development of Least Developed Countries: Bangladesh, Cambodia, Comoros, Sierra Leone and Uganda; UNCTAD: Geneva, Switzerland, 2014. [Google Scholar]
- Menéndez Delgado, E.R.; Rodríguez Ríos, E.B.; Bernal Casasola, D.; Cerbán Jiménez, M. Artisanal fishery in Ecuador. A case study of Manta city and its economic policies to improve competitiveness of the sector. Mar. Policy 2021, 124, 104313. [Google Scholar] [CrossRef]
- Alavaa, J.J.; Lindopa, A.; Jacquet, J. Marine fisheries catch reconstructions for continental Ecuador: 1950–2010. Univ. Br. Columbia 2015, 40, 143–145. [Google Scholar]
- UNCTAD. Sustainable fisheries? In Intentional Trade, Trade Policy and Regulatory Issues; United Nations Publication: Geneva, Switzerland, 2016; Volume 40, pp. 407–411. [Google Scholar]
- FAO. Ecuador Globefish Market Profile. Available online: https://www.fao.org/3/cb9695en/cb9695en.pdf (accessed on 25 October 2022).
- Trade Policy Review. World Trade Organization, 2019 (April WT/TPR/383/ Rev.1), 1/174. Pdf. Available online: https://docs.wto.org/dol2fe/Pages/SS/directdoc.aspx?filename=q:/WT/TPR/S383R1.pdf (accessed on 10 November 2022).
- Fishing for the Future: Sustainable Seafood and Food Security. Available online: https://www.theconduit.com/insights/climate-change-sustainability/fishing-for-the-future-sustainable-seafood-and-food-security/ (accessed on 10 September 2022).
- Palomares, M.L.D.; Pauly, D. On the creeping increase of vessels’ fishing power. Ecol. Soc. 2019. [Google Scholar] [CrossRef] [Green Version]
- Hermann, L.J. Ecuador’s Artisanal Fishermen are Fighting against the Current. Available online: https://www.lifegate.com/ecuadors-artisanal-fishermen-are-fighting-against-the-current (accessed on 15 September 2022).
- Delgado, C.L.; Wada, N.; Rosegrant, M.; Meijer, S.; Ahmed, M. Fish to 2020: Supply and Demand in Changing Global Markets; International Food Policy Research Institute: Washington, DC, USA; WorldFish Center: Penang, Malaysia, 2003; p. 226. [Google Scholar]
- Bose, S.; Al Naabi, A.M.R.; Boughanmi, H.; Yousuf, J.B. Domestic Ban Versus Border Rejections: A Case of Oman’s Fish Exports to the EU. SAGE Open 2019, 9. [Google Scholar] [CrossRef]
- Naabi, A.A.; Bose, S. Do Regulatory Measures Necessarily Affect Oman’s Seafood Export-Supply? SAGE Open 2020, 10. [Google Scholar] [CrossRef]
- Loaiza, Y. Ecuador Promises More Openness of Fisheries Information under New Initiative. Available online: https://news.mongabay.com/2022/05/ecuador-promises-more-openness-of-fisheries-information-under-new-initiative/ (accessed on 25 July 2022).
- UNCTAD. Greening Ecuador’s Exports of Cacao-Chocolate and Fishery Products: No Easy Task. Available online: https://unctad.org/news/greening-ecuadors-exports-cacao-chocolate-and-fishery-products-no-easy-task (accessed on 2 October 2022).
- UNCTAD. Política Nacional de Exportación de Productos Verdes del Ecuador: Cacao–Chocolate y Pesca Sostenible (2015). Available online: https://unctad.org/webflyer/politica-nacional-de-exportacion-de-productos-verdes-del-ecuador-cacao-chocolate-y-pesca (accessed on 25 July 2022).
- United Nations Environment Programme, Partnership for Action on Green Economy. Green Industrial Policy and Trade: A Tool-Box. 2017. Available online: https://wedocs.unep.org/20.500.11822/22915 (accessed on 24 December 2022).
- UNCTAD. Ecuador Becomes First Country to Undergo Innovative UNCTAD Programme to Assess ‘Green Export’ Potential. Available online: https://unctad.org/news/ecuador-becomes-first-country-undergo-innovative-unctad-programme-assess-green-export (accessed on 28 September 2022).
- UNCTAD. Ecuador’s Fisheries Sector Validates a National Action Plan for Green Exports. Available online: https://unctad.org/news/ecuadors-fisheries-sector-validates-national-action-plan-green-exports (accessed on 28 September 2022).
- Jordà, Ò. Estimation and Inference of Impulse Responses by Local Projections. Am. Econ. Rev. 2005, 95, 161–182. [Google Scholar] [CrossRef]
- UNCTAD. National Green Export Reviews. Available online: https://unctad.org/system/files/information-document/NGERs%20explanation%20short.pdf (accessed on 1 September 2022).
- UNCTAD. National Green Export Reviews TOWARDS GREEN ECONOMIES. Pdf. Available online: https://unctad.org/system/files/official-document/osg2015d6_S01_P08.pdf (accessed on 20 July 2022).
- Monterey Bay Aquarium Foundation. Tropical tuna risk profile: Ecuador, Fishing and Processing. Seafood Social Risk Tool V2. 2022. Available online: https://www.seafoodwatch.org/globalassets/sfw/pdf/projects/ssrt/risk-profiles/tropical-tuna/published/seafood-watch-tropical-tuna-ssrt-risk-profile-ecuador-2022.pdf (accessed on 24 December 2022).
- Towers, L. Ecuador’s Tuna Fisheries Suffering Lower Prices. Available online: https://thefishsite.com/articles/ecuadors-tuna-fisheries-suffering-lower-prices (accessed on 6 October 2022).
- BOSSOMA Doriane N’Doua. The Impact of Technical Barriers to Trade and Sanitary and Phytosanitary Measures on Trade in the Forest-Wood-Paper Sector; Bordeaux Economics Working Papers, BxWP2022-01; Univ. Bordeaux, CNRS, BSE, UMR 6060: Pessac, France, 2022. [Google Scholar]
- UNCTAD. Green Exports Can Meet both Economic and Environmental Needs. Available online: https://unctad.org/news/green-exports-can-meet-both-economic-and-environmental-needs (accessed on 3 September 2022).
- UNCTAD. Framework for the Voluntary Sustainability Standards (VSS) Assessment Toolkit; United Nations Publication: Geneva, Switzerland, 2020; Available online: https://unctad.org/system/files/official-document/ditctabinf2020d5_en.pdf (accessed on 12 December 2022).
- UNFSS. Voluntary Sustainability Standards: Sustainability Agenda and Developing Countries. Available online: https://unfss.org/wp-content/uploads/2022/10/UNFSS-5th-Report_14Oct2022_rev.pdf (accessed on 20 November 2022).
- Elamin, N.; Fernandez de Cordoba, S. The Trade Impact of Voluntary Sustainability Standards: A Review of Empirical Evidence; Research Paper No 50; UNCTAD: Geneva, Switzerland, 2020. [Google Scholar]
- Henson, S.; Jaffee, S. Understanding developing country strategic responses to the enhancement of food safety standards. World Econ. 2008, 31, 548–568. [Google Scholar] [CrossRef]
- Swinnen, J.F.M. Global Supply Chains, Standards and the Poor: How the Globalization of Food Systems and Standards Affects Rural Development and Poverty; KU: Leuven, Belgium, 2007. [Google Scholar]
- Fiankor, D.D.D.; Martínez-Zarzoso, I.; Brümmer, B. Exports and governance: The role of private voluntary agrifood standards. Agric. Econ. 2019, 50, 341–352. [Google Scholar] [CrossRef]
- UNCTAD. Private-Sector Standards and National Schemes for Good Agricultural Practices: Implications for. 2008. Available online: https://unctad.org/system/files/official-document/ditcted200713_en.pdf (accessed on 10 August 2022).
- Andersson, A. The trade effect of private standards. Eur. Rev. Agric. Econ. 2019, 46, 267–290. [Google Scholar] [CrossRef]
- Masood, A.; Brümmer, B. Impact of Global GAP Certification on EU Banana Imports: Global Food Discussion Papers (50); Georg-August-Universität Göttingen, Research Training Group (RTG) 1666—GlobalFood: Göttingen, Germany, 2014. [Google Scholar]
- Fiankor, D.D.D.; Flachsbarth, I.; Masood, A.; Brümmer, B. Does Global GAP certification promote agrifood exports? Eur. Rev. Agric. Econ. 2020, 47, 247–272. [Google Scholar]
- Ehrich, M.; Mangelsdorf, A. The Role of Private Standards for Manufactured Food Exports from Developing Countries. World Dev. 2018, 101, 16–27. [Google Scholar] [CrossRef]
- Elder, E.; Elamin, N.; Larrea, C.; Fernandez De Cordoba, S. Understanding Smallholder Farmer Access to VSS-Compliant Markets. In IISD’s State of Sustainability Initiatives Review: Standards and Poverty Reduction; The International Institute for Sustainable Development: Winnipeg, MI, Canada, 2021. [Google Scholar]
- Ramey, V.A.; Zubairy, S. Government spending multipliers in good times and in bad: Evidence from US historical data. J. Political Econ. 2018, 126, 850–901. [Google Scholar] [CrossRef] [Green Version]
- Romer, C.D.; Romer, D.H. Fiscal space and the aftermath of financial crises. Brook. Pap. Econ. Act. 2019, 2019, 239–331. [Google Scholar] [CrossRef]
- Tovar Jalles, J. How do fiscal adjustments change the income distribution in emerging market economies? Int. J. Emerg. Mark. 2017, 12, 310–334. [Google Scholar] [CrossRef]
- Afonso, A.; Jalles, J. Do Fiscal Rules Lower Government Financing Costs? EM—Research in Economics and Mathematics. REM Work. Pap. 2017, 1–21, 015–2017. [Google Scholar]
- Maddala, G.S.; Kim, I. Unit Roots, Cointegration, and Structural Change; Cambridge University Press: Cambridge, UK, 1998. [Google Scholar]
- Benkovskis, K.; Wörz, J. What drives the market share changes? Price versus non-price factors. Struct. Change Econ. Dyn. 2018, 45, 9–29. [Google Scholar] [CrossRef] [Green Version]
- Karagöz, K. Determining Factors of Turkey’s Export Performance: An Empirical Analysis. Procedia Econ. Financ. 2016, 38, 446–457. [Google Scholar] [CrossRef] [Green Version]
- Fugazza, M. Export Performance and Its Determinants: Supply and Demand Constraints, United Nations, New York and Geneva. In UNCTAD Policy Issues in International Trade and Commodities Study Series; UNITED NATIONS: New York, NY, USA; Geneva, Switzerland, 2004. [Google Scholar]
- Dickey, D.A.; Fuller, W.A. Distribution of the estimators for autoregressive time series with a unit root. J. Am. Stat. Assoc. 1979, 74, 427–431. [Google Scholar]
- Phillips, P.C.; Perron, P. Testing for a unit root in time series regression. Biometrika 1988, 75, 335–346. [Google Scholar] [CrossRef]
- Zivot, E.; Andrews, D.W.K. Further evidence on the Great Crash, the oil price shock, and the unit root hypothesis. J. Bus. Econ. Stat. 1992, 10, 251–270. [Google Scholar]
- Iranmanesh, N.; Jalaee, S.A. Testing the long-run neutrality and super neutrality of money in a developing country: Evidence from Iran. MethodsX 2021, 8, 101251. [Google Scholar] [CrossRef] [PubMed]
- Meemken, E.M.; Barrett, C.B.; Michelson, H.C.; Qaim, M.; Reardon, T.; Sellare, J. Sustainability standards in global agrifood supply chains. Nat. Food 2021, 2, 758–765. [Google Scholar] [CrossRef]
- Capgemini Research Institute. Consumer Products and Retail: How Sustainability is Fundamentally Changing Consumer Preference; Capgemini Service: Paris, France, 2020; pp. 1–48. Available online: https://www.capgemini.com/wp-content/uploads/2020/07/20-06_9880_Sustainability-in-CPR_Final_Web-1.pdf (accessed on 15 July 2022).
- Meng, Z.; Zhao, N.; Shen, B.; Zhai, C. Optimal pricing strategy for green products under salience theory. Econ. Res. -Ekon. Istraz. 2022, 35, 2960–2983. [Google Scholar] [CrossRef]
- Hoque, M.Z.; Akhter, N.; Chowdhury, M.S.R. Consumers ‘Preferences for the Traceability Information of Seafood Safety. Foods 2022, 11, 1675. [Google Scholar] [CrossRef] [PubMed]
- O’hara, C. Developing-country Producers and the Challenge of Traceability. In USAID Frontiers in Development; Create Space Independent Pub.: Scotts Valley, CA, USA, 2011. Available online: https://www.usaid.gov/sites/default/files/documents/1868/CoryOHara.pdf (accessed on 19 October 2022).
- Athukorala, P.C.; Jayasuriya, S. Food safety issues, trade and WTO rules: A developing country perspective. World Econ. 2003, 26, 1395–1416. [Google Scholar] [CrossRef] [Green Version]
- García Martinez, M.; Poole, N. The development of private fresh produce safety standards: Implications for developing Mediterranean exporting countries. Food Policy 2004, 29, 229–255. [Google Scholar] [CrossRef] [Green Version]
- UNCTAD. The Unseen Impact of Non-Tariff Measures: Insights from a New Database. 2017. Available online: https://unctad.org/meetings/en/SessionalDocuments/ditc-tab-MC11-UNCTAD-NTMs.pdf (accessed on 25 October 2022).
- Cerri, J.; Testa, F.; Rizzi, F. The more I care, the less I will listen to you: How information, environmental concern and ethical production influence consumers’ attitudes and the purchasing of sustainable products. J. Clean. Prod. 2018, 175, 343–353. [Google Scholar] [CrossRef]
- Emam, A.; Leibrecht, M.; Chen, T. Fish Exports and the Growth of the Agricultural Sector: The Case of South and Southeast Asian Countries. Sustainability 2021, 13, 11177. [Google Scholar] [CrossRef]
- Sandaruwan, K.P.G.L.; Weerasooriya, S.A. Non-Tariff Measures and Sustainable Development: The Case of the European Union Import Ban on Seafood from Sri Lanka; ARTNeT Working Paper Series, No. 185, 2019; ESCAP: Bangkok, Thailand, 2019. [Google Scholar]
- Miao, M.; Liu, H.; Chen, J. Factors affecting fluctuations in China’s aquatic product exports to Japan, the USA, South Korea, Southeast Asia and The EU. Aquac. Int. 2021, 29, 2507–2533. [Google Scholar] [CrossRef]
- Houssa, R.; Verpoorten, M. The Unintended Consequence of an Export Ban: Evidence from Benin’s Shrimp Sector. World Dev. 2015, 67, 138–150. [Google Scholar] [CrossRef] [Green Version]
- UNCTAD. Non-Tariff Measures in Australia, China, India, Japan, New Zealand and the Republic of Korea: Preliminary Findings. 2020. Available online: https://www.eria.org/publications/non-tariff-measures-in-australia-china-india-japan-new-zealand-and-the-republic-of-korea-preliminary-findings/ (accessed on 5 August 2022).
- Thong, N.T.; Solgaard, H.S. Consumer’s food motives and seafood consumption. Food Qual. Prefer. 2017, 56, 181–188. [Google Scholar] [CrossRef]
- Khalifa, K.; Al-subhi, N.; Bose, S.; Al-masroori, H.S. Fishers’ compliance motivations: A case study of the Sultanate of Oman. Mar. Policy 2013, 37, 141–148. [Google Scholar]
- OECD. Use of behavioural insights in consumer policy. OECD Sci. Technol. Innov. Policy Pap. 2017, 36, 1–48. [Google Scholar]
- OECD. Better Policies for Sustainable Development: A New Framework for Policy Coherence. 2016. Available online: https://www.oecd.org/development/better-policies-for-sustainable-development-2016-9789264256996-en.htmT (accessed on 20 June 2022).
Figure 1.
Cumulative Response of MarketShare to NGER.

Figure 2.
Cumulative Response of MarketShare to Dummy2014.

Figure 3.
Cumulative Response of AveragePrice to NGER.

Figure 4.
Cumulative Response of AveragePrice to Dummy2014.

Figure 5.
Cumulative Response of Volume to NGER.

Figure 6.
Cumulative Response of Volume to Dummy2014.


Table 1.
Descriptive Statistics.
| Variable | Obs | Mean | Std. Dev. | Min | Max |
|---|---|---|---|---|---|
| MarketShare | 40 | 0.624 | 0.316 | 0.111 | 1.525 |
| FishProduction | 40 | 0.013 | 0.006 | 0.003 | 0.033 |
| NGER | 40 | 0.125 | 0.335 | 0.000 | 1.000 |
| Real Average Price (kg) | 40 | 18.753 | 8.284 | 4.207 | 37.199 |
| Volume of Exports (Share in World Exports) | 40 | 0.829 | 0.364 | 0.092 | 1.699 |
Table 2.
Unit Root Tests.
| Variable | H0 | ADF Test | PP Test | Conclusion |
|---|---|---|---|---|
| MarketShare | I(2) | −6.853 *** | −6.956 *** | I(1) |
| FishProduction | I(2) | −3.915 *** | −9.438 *** | I(1) |
Note: *** indicates the level of significance at 1%.
Table 3.
Ziviot–Andrews Test.
| Level | 1st Difference | ||||||
|---|---|---|---|---|---|---|---|
| Variable | t-Statistics | Lag | Break Point | t-Statistics | Lag | Break Point | Conclusion |
| MarketShare | −3.332 | 4 | 1995 | −7.246 | 4 | 1993 | I(1) |
| FishProduction | −4.453 | 4 | 1989 | −7.218 | 4 | 1993 | I(1) |
Note: The critical values of the variables are at the level of 1%, 5%, and 10%, −5.34, −4.93, and −4.58.
Table 4.
Horizon-wise OLS Estimations.
| h = 0 | Coef. | St. Err. | p-Value |
|---|---|---|---|
| FishProduction | 0.608 *** | 0.114 | 0.000 |
| MarketShare | −0.269 | 0.165 | 0.113 |
| NGER | −0.257 *** | 0.080 | 0.003 |
| h = 1 | |||
| FishProduction | 0.432 *** | 0.141 | 0.004 |
| MarketShare | −0.156 | 0.123 | 0.214 |
| NGER | −0.42 *** | 0.103 | 0.000 |
| h = 2 | |||
| FishProduction | 0.49 *** | 0.230 | 0.041 |
| MarketShare | −0.27 | 0.173 | 0.129 |
| NGER | −0.643 *** | 0.142 | 0.000 |
| h = 3 | |||
| FishProduction | 0.374 * | 0.214 | 0.090 |
| MarketShare | −0.207 * | 0.118 | 0.089 |
| NGER | −0.842 *** | 0.186 | 0.000 |
| h = 4 | |||
| FishProduction | 0.478 *** | 0.162 | 0.006 |
| MarketShare | −0.306 * | 0.156 | 0.060 |
| NGER | −0.952 *** | 0.213 | 0.000 |
Note: *** p < 0.01, * p < 0.10; MarketShare and FishProduction are in first differences, and a lag of 0 (FishProduction) and lag of 1 (MarketShare) are optimal according to “Hall’s general to specific rule” [48].
Disclaimer/Publisher’s Note: The statements, opinions and data contained in all publications are solely those of the individual author(s) and contributor(s) and not of MDPI and/or the editor(s). MDPI and/or the editor(s) disclaim responsibility for any injury to people or property resulting from any ideas, methods, instructions or products referred to in the content. |
© 2022 by the authors. Licensee MDPI, Basel, Switzerland. This article is an open access article distributed under the terms and conditions of the Creative Commons Attribution (CC BY) license (https://creativecommons.org/licenses/by/4.0/).
Share and Cite
MDPI and ACS Style
Emam, M.A.; Leibrecht, M.; Chen, T. The Impact of a “National Green Export Review” on Competitiveness: Empirical Evidence for Ecuador’s Fish Exports. Agriculture 2023, 13, 62. https://doi.org/10.3390/agriculture13010062
AMA Style
Emam MA, Leibrecht M, Chen T. The Impact of a “National Green Export Review” on Competitiveness: Empirical Evidence for Ecuador’s Fish Exports. Agriculture. 2023; 13(1):62. https://doi.org/10.3390/agriculture13010062
Chicago/Turabian StyleEmam, Md Ali, Markus Leibrecht, and Tinggui Chen. 2023. "The Impact of a “National Green Export Review” on Competitiveness: Empirical Evidence for Ecuador’s Fish Exports" Agriculture 13, no. 1: 62. https://doi.org/10.3390/agriculture13010062
Note that from the first issue of 2016, this journal uses article numbers instead of page numbers. See further details here.