
Assessment of the Grassland Ecological Compensation Policy (GECP) in Qinghai, China

1
College of Agriculture and Animal Husbandry, Qinghai University, Xining 810016, China
2
Qinghai Provincial Key Laboratory of Adaptive Management on Alpine Grassland, Qinghai University, Xining 810016, China
3
College of Grassland Science and Technology, China Agricultural University, Beijing 100193, China
4
College of Information and Electrical Engineering, China Agricultural University, Beijing 100083, China
*
Author to whom correspondence should be addressed.
Agriculture 2022, 12(9), 1479; https://doi.org/10.3390/agriculture12091479
Submission received: 23 July 2022
/
Revised: 29 August 2022
/
Accepted: 8 September 2022
/
Published: 15 September 2022
(This article belongs to the Special Issue Agricultural Development Strategies for Less-Favoured Areas)
Abstract
:The grassland condition in Qinghai Province has changed dramatically after implementation of the Grassland Ecological Compensation Policy (GECP). The changes in grassland Normalized Difference Vegetation Index (NDVI) and those in grassland area and grassland Remote Sensing Ecological Index (RESI) reveal that the policy has indeed played a crucial role in grassland ecological recovery. Although in the first round of policy implementation from 2011–2015, the quality of grassland has not improved significantly, and degradation even occurred in some areas, the second round of the policy implementation reversed this trend. As the world’s only ecological subsidy policy for grassland ecosystems, it should continue to be implemented and monitored for better recovery of grassland ecology and production activities of herders that are concerned.
1. Introduction
Grassland is one of the natural landscapes with the largest surface area, covering 20–40% of the land surface all over the world [1]. However, in the past three decades, grassland degradation has become a worldwide problem [2,3,4]. The various types of grasslands in China account for about 41.4% of its total land area, of which about 84.3% is utilized. Grassland ecosystems constitute an important part of the natural resources in China, especially in Qinghai-Tibet Plateau. Its unique environment and climate provide uncommon biological resources. The ecological environment of the Qinghai-Tibet Plateau has a great impact on global atmospheric and hydrological cycles [5]. The Alpine grasslands cover most of the areas of Tibetan Plateau, and their environmental conditions are very fragile. Protecting its ecological environment should not be ignored.
To protect the environment from over-exploitation, many countries have developed large-scale payment-for-ecosystem-services (PES) programs [6], such as the Conservation Reserve Program in the United States, and the Agri-Environmental Scheme in the European Union. As far as we know, very few ecological compensation projects for grassland ecosystems have been implemented. The Chinese Government launched an ecological compensation program to protect grasslands named the Grassland Ecological Compensation Policy (GECP) in 2011, and it is now in its third round. China’s GECP is a rare example of a PES program. It is the largest PES grassland conservation program in the world in terms of area, number of participants, and total monetary transfers [7].
The GECP areas were divided into two sub-policy zones: forage-livestock balance zones and grazing ban zones, based on grassland conditions. In the forage-livestock balances zones, herders whose the stocking rates (SRs) remain within the prescribed carrying capacity are theoretically eligible for the eco-subsidy. Grazing ban zones are severely degraded grassland from overgrazing and are no longer suitable for grazing, and the pastoralists in these areas are subsidized for stopping grazing all this time.
The policy has a phased implementation. Beginning in 2011, the state established the GECP and incentive mechanism in eight major grassland pastoral provinces and regions, including Inner Mongolia, Tibet, Qinghai, Sichuan, Gansu, Ningxia and Yunnan, and Xinjiang Uyghur Autonomous Region. The first round of policy included 2011–2015, and in 2012, the implementation was expanded to 36 pastoral semi-pastoral counties in five non-major pastoral provinces, including Heilongjiang, covering 268 pastoral counties. The subsidy was 1.5 CNY per standard mu per year for forage-livestock balance areas and 6 CNY for grazing ban areas.
In 2016, in the second five-year phase, the government modestly increased the subsidy rate to 2.5 CNY per standard mu per year for herders in forage-livestock balancing areas and 7 CNY for grazing ban zones in an attempt to improve the effect of livestock reduction.
However, few studies have evaluated the effects of the GECP with limited research scope. Liu’s research shows that the implementation of the policy has significantly promoted the quality of grasslands in Inner Mongolia [8]. Hu analyzed the impacts of policies on livestock production, which reflects that policy incentives have no obvious relationship with the reduction of sheep feeding, but are related to the reduction of cattle feeding by herdsmen [9]. Hou’s analysis through remote sensing and household surveys found that policies could improve grassland quality and increase herders’ income [7].
2022 is the second year of the third round of the GECP. The ecological restoration in some areas could not be as effective as expected due to the climatic and other factors. Therefore, it is essential to evaluate the effects of the GECP and the changes in grassland ecological quality in Qinghai Province. The ecological effects of the GECP are commonly examined in terms of grassland cover and biomass. The NDVI is based on the remote sensing images of infrared and near-infrared channels and is widely used as an indicator for vegetation cover. In this study, to assess the impact of the GECP policy on grassland ecosystems in Qinghai Province, we used remote sensing imagery to assess its impact on grassland quality in terms of spatial and temporal changes in NDVI, changes in grassland area and RESI ecological index from 2000 to 2020.
2. Materials and Methods
2.1. The Study Area
Qinghai Province is located at latitude 31°36′–39°19′ north and longitude 89°35′–103°04′ east (Figure 1). More than four-fifths of its area is plateau. According to the bulletin of the Third National Land Survey in 2021, the national grassland area is 264,503,100 hectares. Qinghai has 39,470,800 hectares of grassland, accounting for about 15% of the national grassland area. Among the grassland area, the natural pasture area is the largest, with 36.6639 million hectares, accounting for 92.89%. The grasslands are mainly distributed in Yushu and Haixi Tibetan Autonomous Prefectures, accounting for 69.11% of their total grasslands. The grasslands in Qinghai Province are divided into 9 grassland types and 7 sub-types. Among these categories, alpine meadows are the main body of natural grasslands, accounting for about 64% of the area. Of the total grassland area, usable grassland accounts for about 86%.
2.2. The GECP
In 2011, the Chinese Government implemented the Grassland and Ecological Compensation Policy (GECP), also called Subsidy and Incentive System for Grassland Conservation (SISGC) in eight major grassland provinces and regions, including Inner Mongolia, Xinjiang, Tibet, Qinghai, Sichuan, and Gansu. The goal is to divide grasslands into “forage-livestock balance zone” and “grazing ban zone” and provide herders with productive subsidies. The GECP has also achieved good ecological benefits, with the first period of GECP from 2011 to 2015, the second period from 2016 to 2020, and the third period from 2021 to 2025.
2.3. Satellite Data
The grassland area data was obtained online from the MODIS Terra Aqua Combined Land Cover product MCD12Q1. The version of the International Geosphere-Biosphere Project (IGBP) global vegetation classification was used for the analysis in this study, which included 11 natural vegetation classes, 3 non-vegetated land classes, and 3 human-altered classes (Gang et al., 2015; Liu et al., 2019).
Data from 2000–2011 are from a Landsat 5 ETM sensor. These images contain 4 visible and near-infrared (VNIR) bands and 2 short-wave infrared (SWIR) bands processed to orthorectified surface reflectance, and one thermal infrared (TIR) band processed to orthorectified brightness temperature. Similarly, data in 2012 is from the Landsat 7 ETM + sensor, and data in 2013–2020 are from the Landsat 8 OLI/TIRS sensors.
2.4. RESI Ecological Index
The RSEI evaluation model is based on the indexes of greenness, humidity, heat, and dryness. It is completely depended on remote sensing information and natural factors, which can quickly evaluate regional eco-environment quality [10]. The four metrics can be composited into a four-band image and then calculated using the covariance matrix for PC1 with image analyzing software using the PCA function.
2.4.1. NDVI
The Normalized Difference Vegetation Index (NDVI) is the most widely used in remote sensing monitoring of vegetation cover, which is a measure of grassland quality [11]. It was constructed based on infrared and near-infrared channel remote sensing images. NDVI values range between [−1, 1], with larger values representing higher vegetation cover. NDVI is calculated as follows.
where
is denote near-infrared band reflectance.
is the red band reflectance.
2.4.2. Wet
Humidity indicators (Wet) are widely used in ecological monitoring, with Wet values ranging between [−1, 1] and higher values indicating higher humidity. The humidity indicator can be represented by the Wet component given in the K-T variation, and the formula used is not consistent in terms of different sensors of Landsat.
where
represents the blue wavelength reflectance.
represents the green wavelength reflectance.
represents the red wavelength reflectance.
represents the IR band reflectance.
represents shortwave IR1 reflectance.
represents shortwave IR2 reflectance.
2.4.3. NDSI
Buildings and bare soil can cause the land to dry out and seriously affect the ecological conditions of a watershed. The NDSI ranges between [−1, 1], with higher values indicating higher levels of drying out. The dryness indicator is a composite of the building index IBI and the soil index SI.
2.4.4. LST
LST is expressed in terms of surface temperature. In this paper, the surface temperature is obtained by correcting for brightness temperature. The formula for LST has been summarized in several papers [12,13].
Landsat 8 TIRS sensor has two thermal infrared bands (TIRS bands 10 and 11), and band 11 has a calibration problem due to the out-of-field stray light [14]. So, some data come from The MOD11A2 V6.1 product, which provides an average 8-day land surface temperature (LST) in a 1200 × 1200 km grid.
3. Results
3.1. Changes in NDVI in Qinghai Province in the Last Two Decades
The grassland quality measured by NDVI has been slightly improved after GECP implementation.
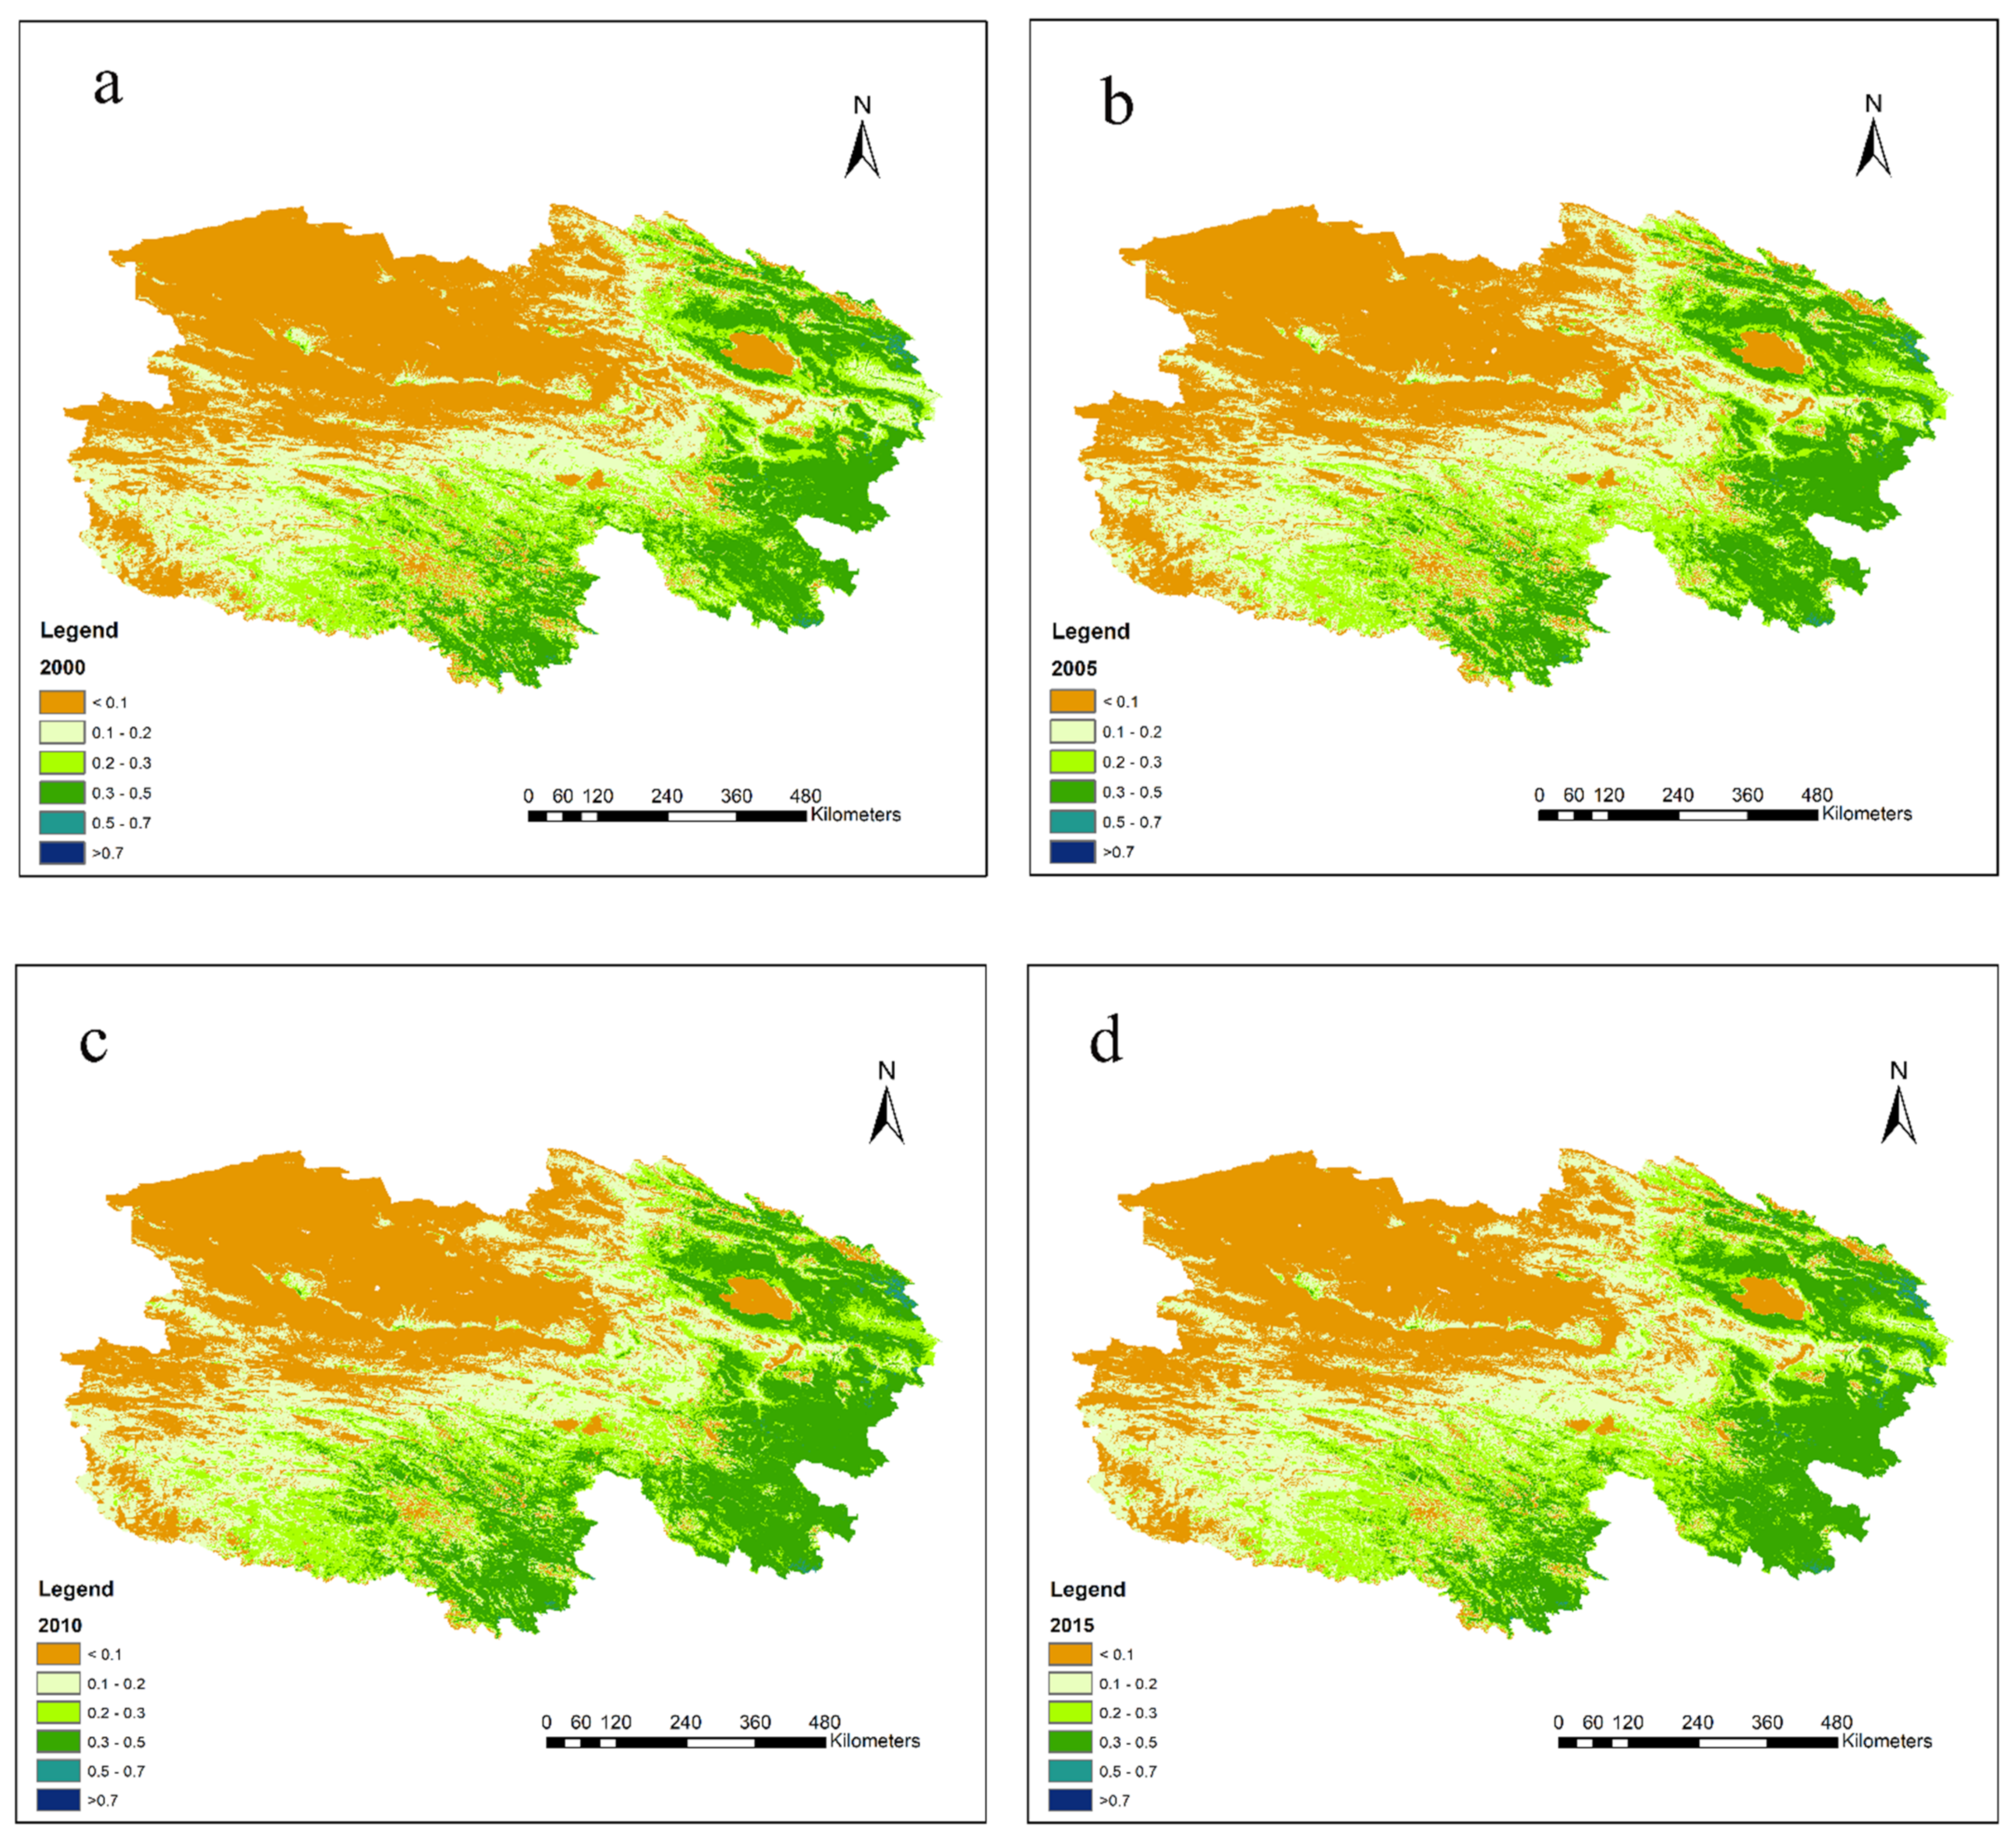
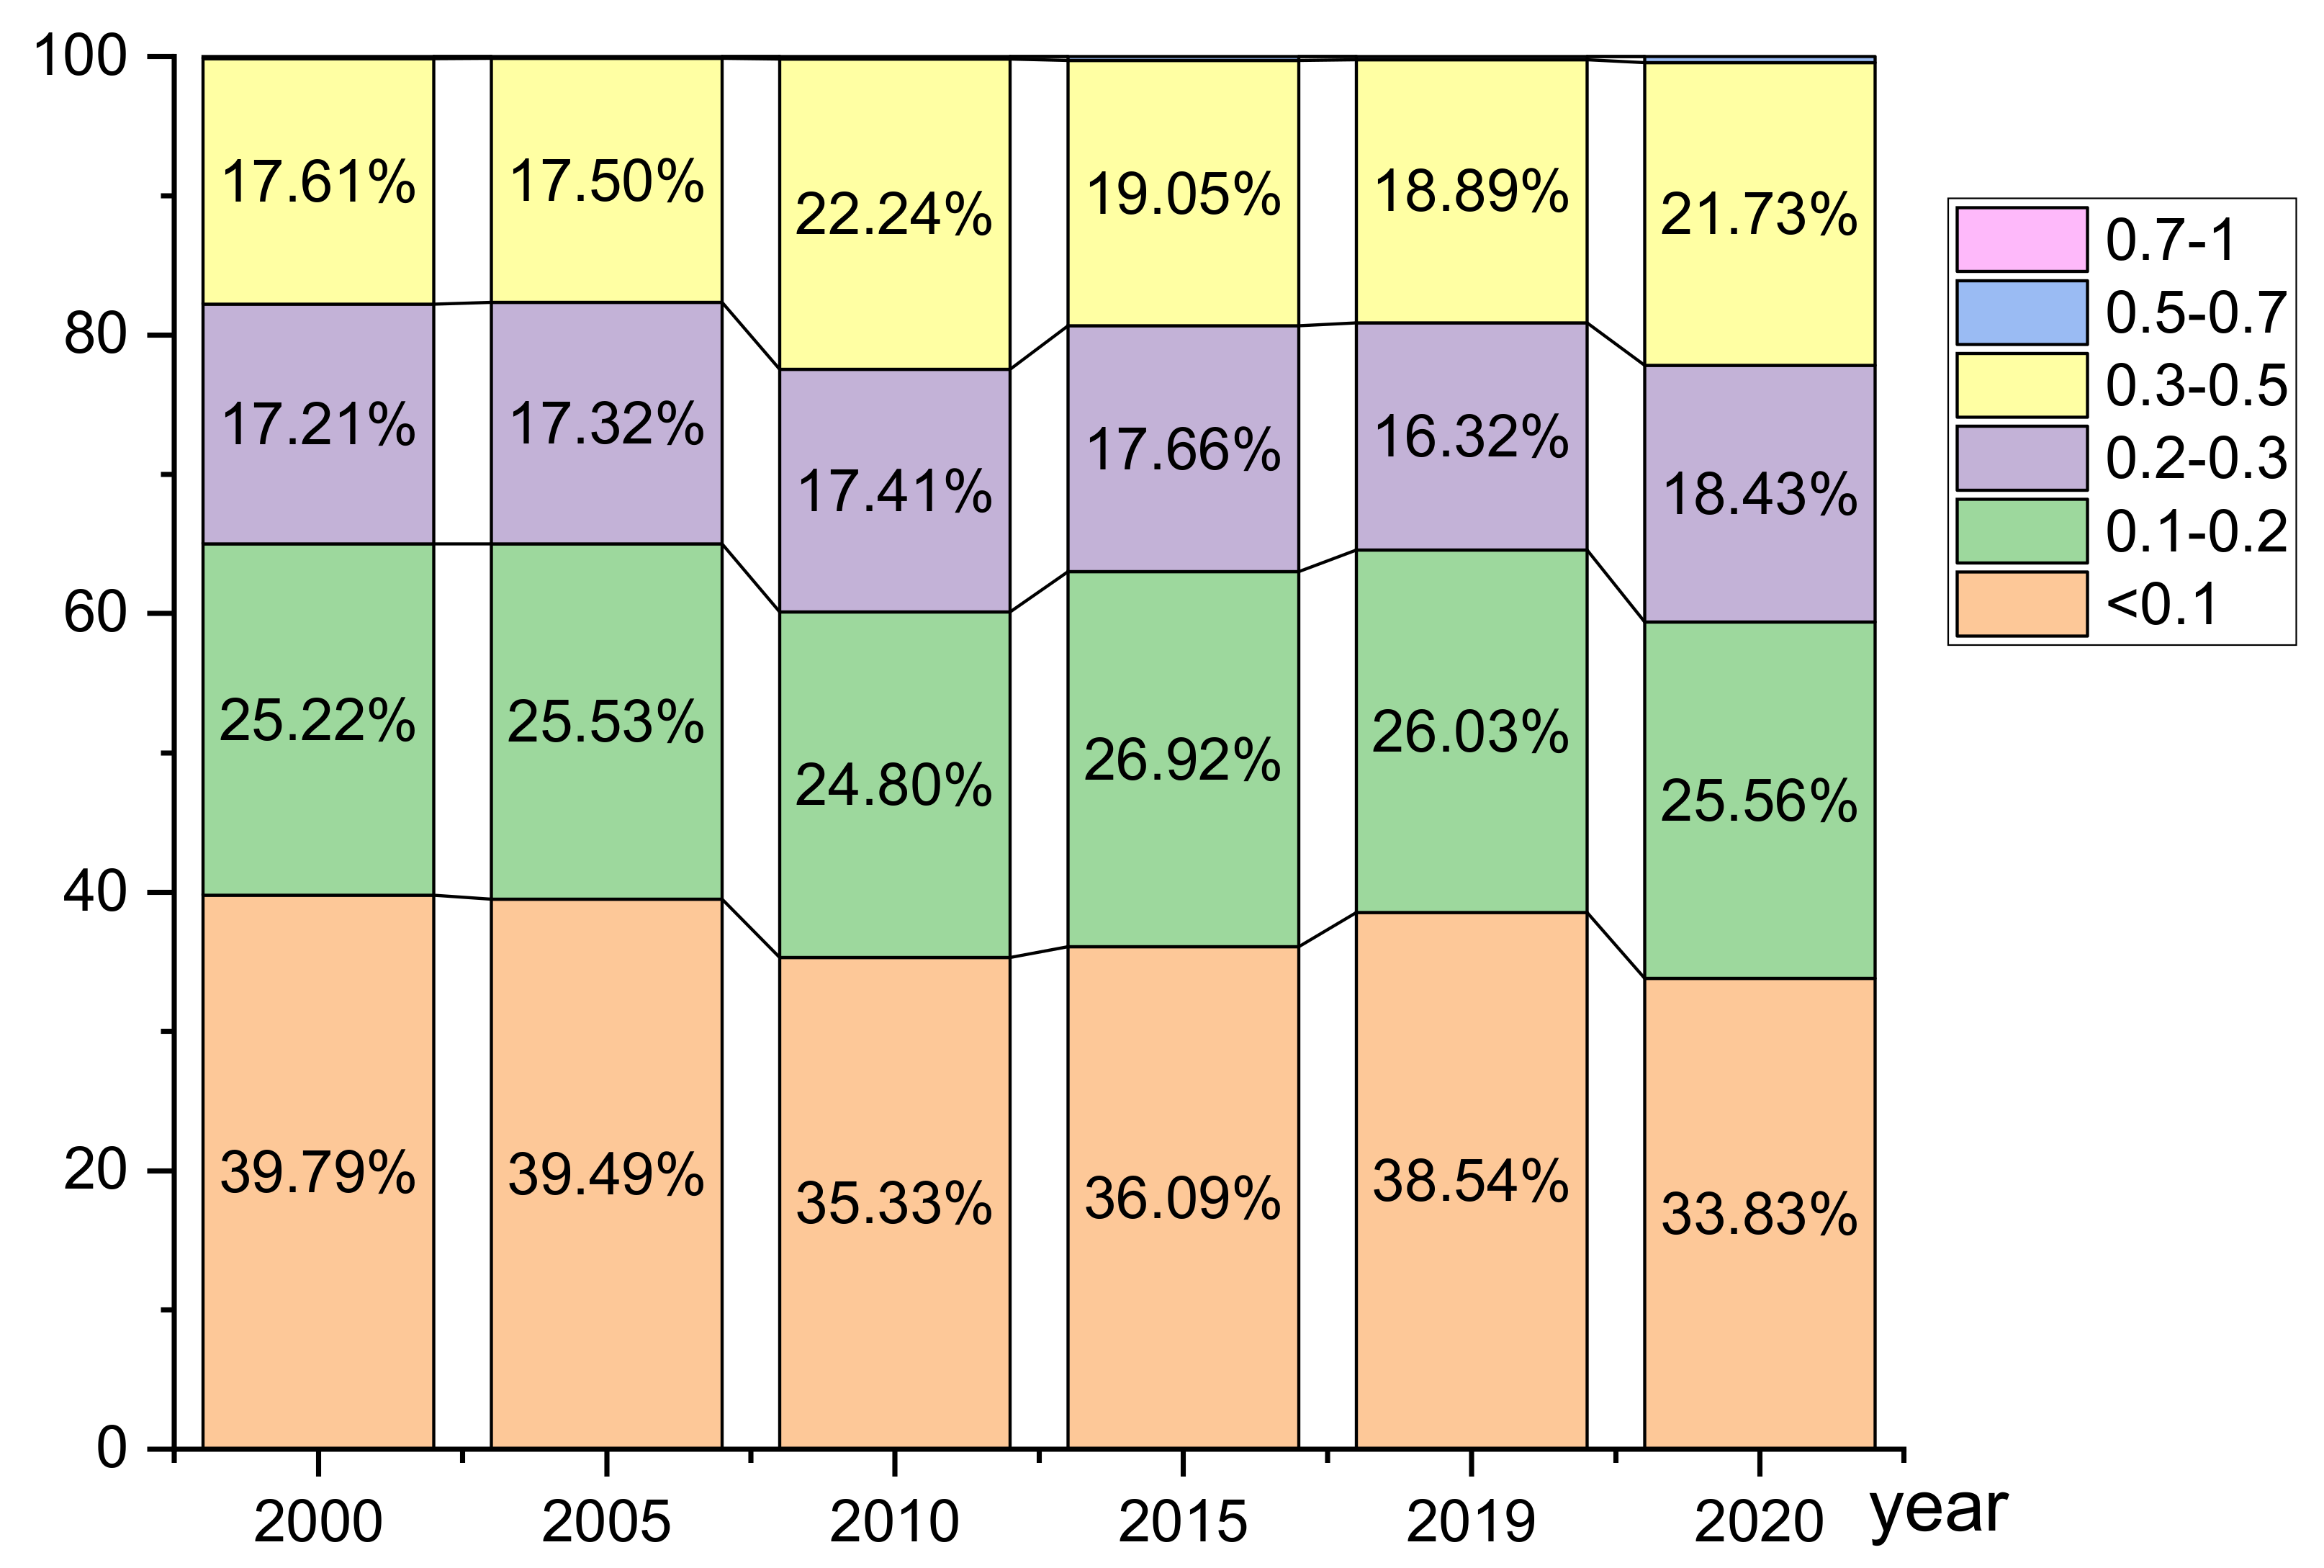
Before the implementation of the GECP, grassland NDVI showed a slightly increasing trend. The proportion of grassland NDVI (greater than 0.3) increased from 17.18% in 2000 (Figure 2a) to 22.45% in 2010 (Figure 2c). After the first phase of GECP, the proportion of grassland NDVI (greater than 0.3) decreased to 19.33% in 2015 (Figure 2d), and recovered to 22.18% in 2020 after the second phase. In the past 20 years, the grassland NDVI proportion of 0.7 to 1 was 0 (Table A1), and the proportion of 0.5 to 0.7 did not exceed 1%, but there is an increasing trend. The ratio of 0.3 to 0.5 has also been increasing year by year. The ratio of less than 0.1 is gradually decreasing (Figure 3).
A provincial difference-in-difference (DID) method is used for the average NDVI values in 2001–2005, 2006–2010, 2011–2015, and 2016–2020, which represent the period before the GECP implementation and the first and the second phases. The average NDVI values for the four phases are shown in Table A1 and Figure 4.
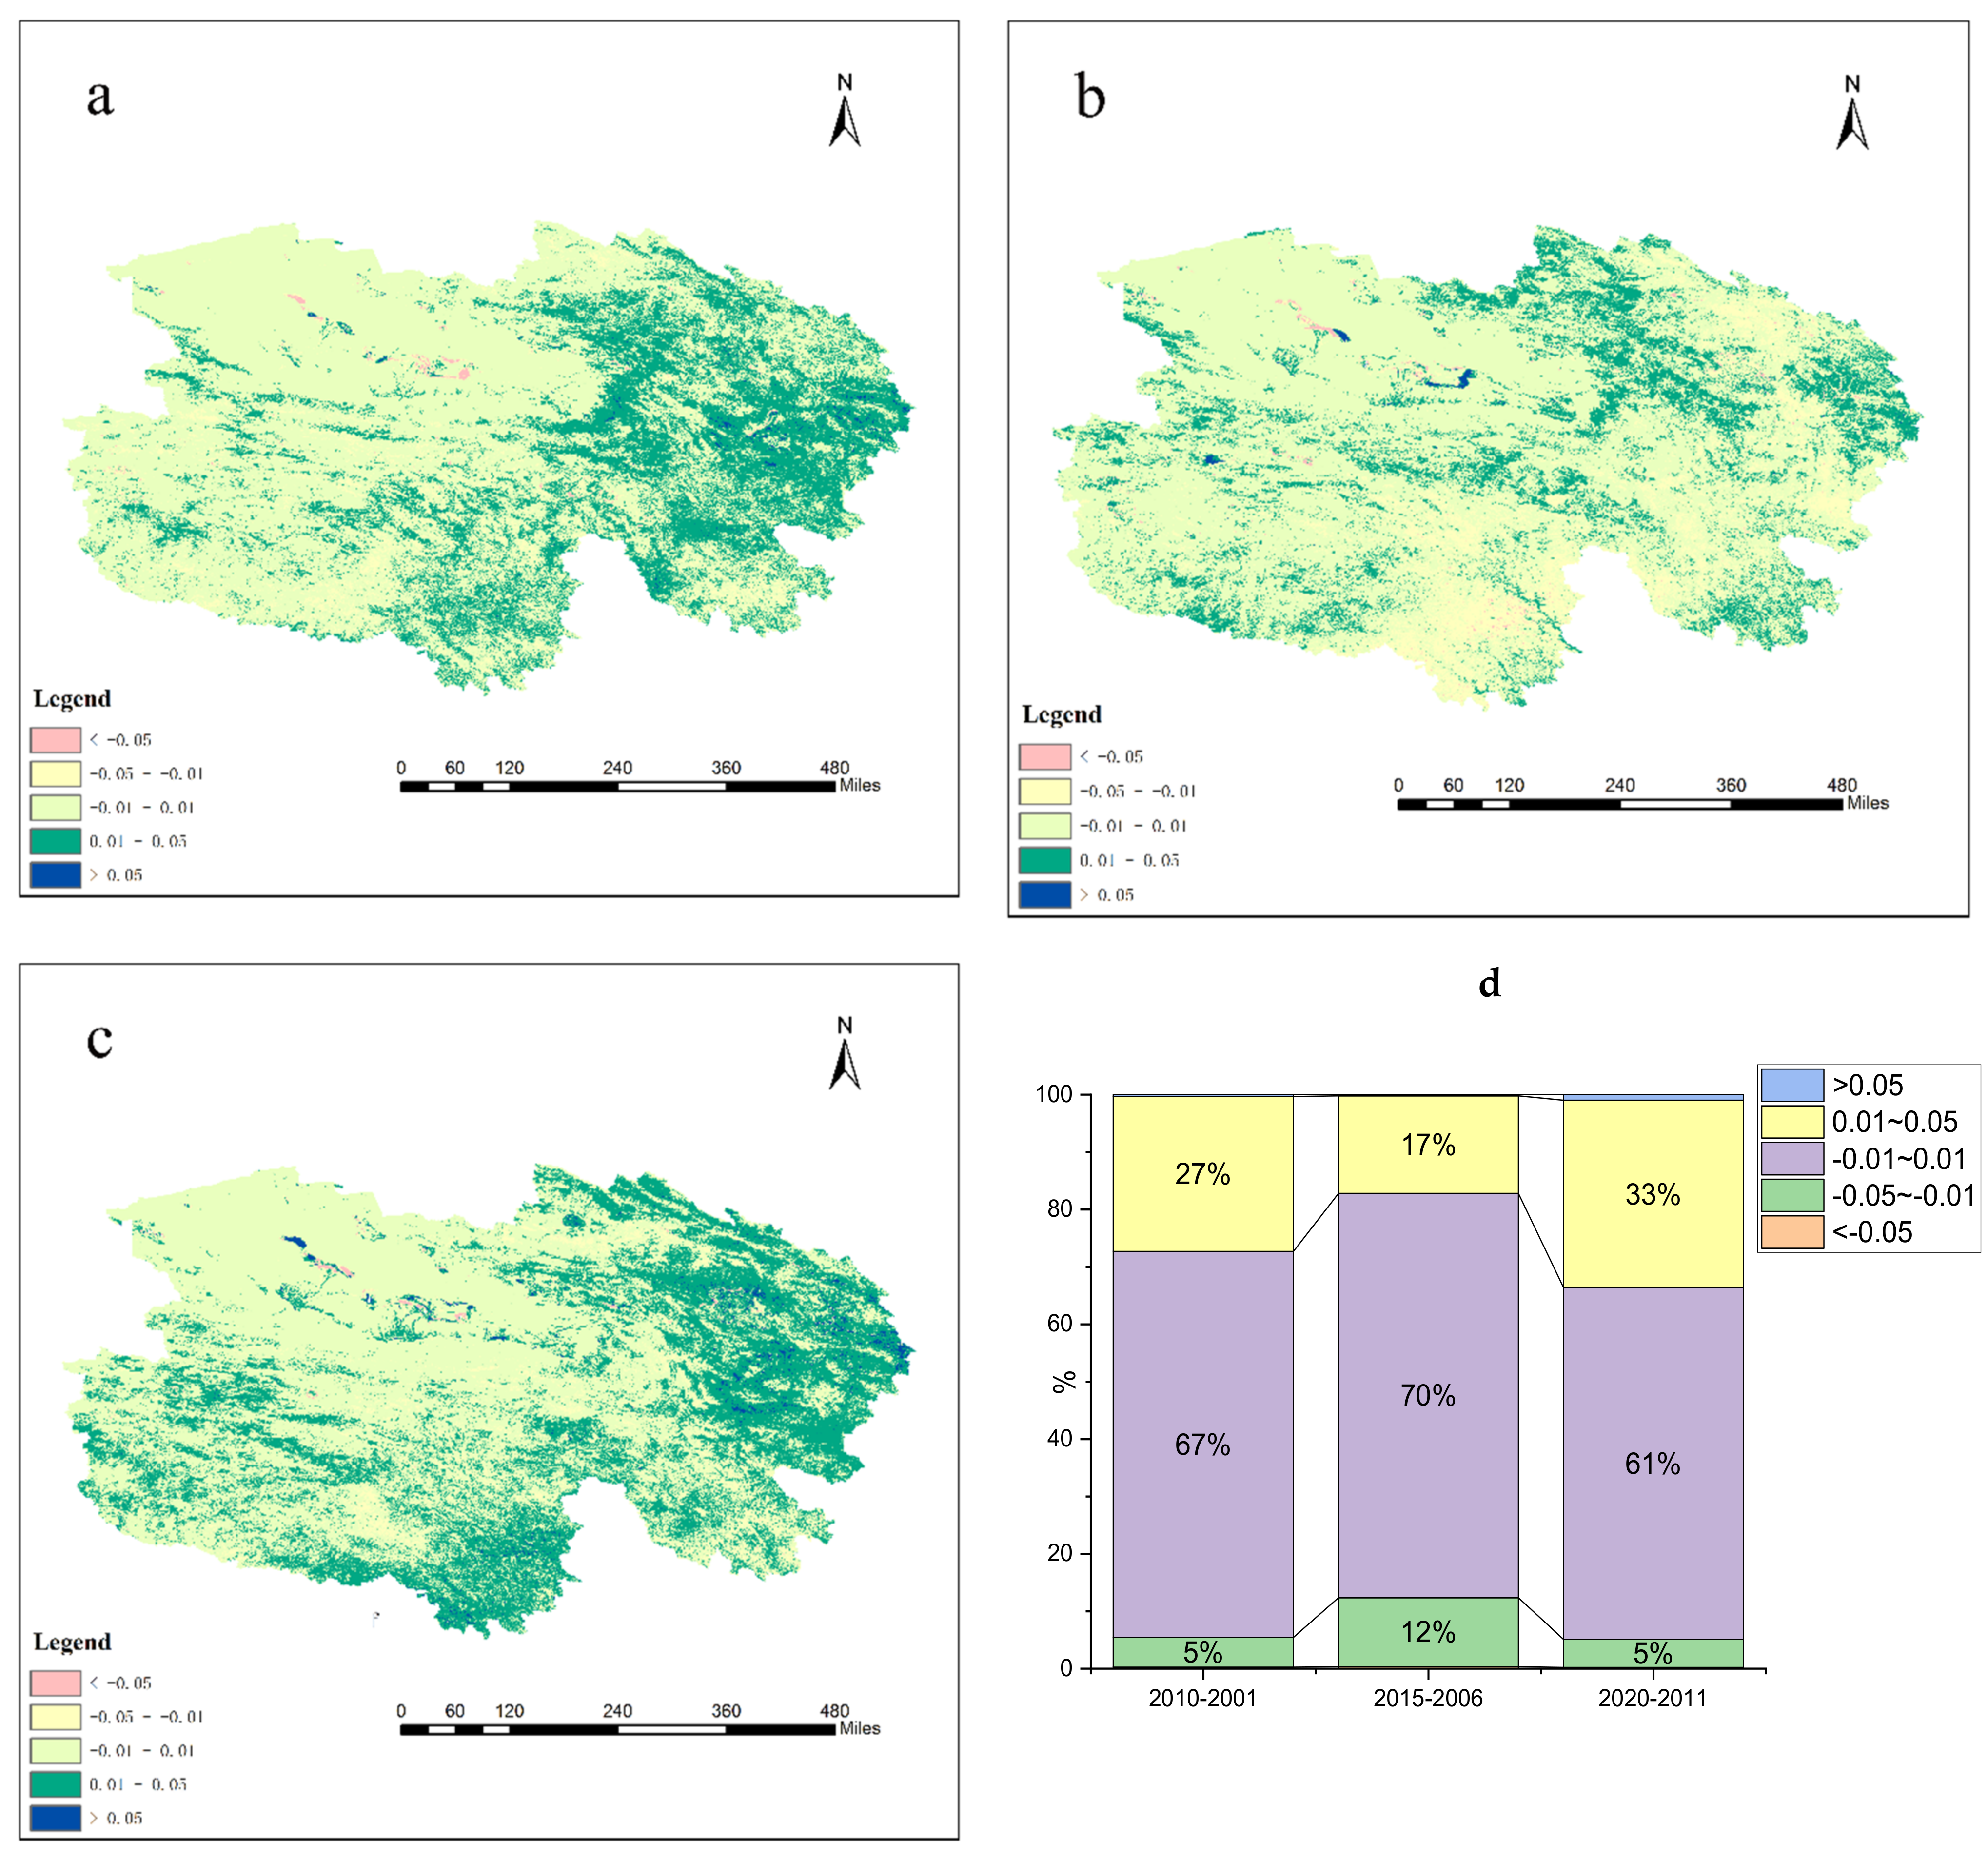
In comparison, before and after the implementation of GECP (2006–2015) showed that the grassland NDVI in most areas was maintained at the status, with an increase in the range of −0.01–0.01, accounting for 70.43% (Table A2). In the range of −0.01–0.01 from 2000 to 2010, the proportion was 67.22%. After the first round of GECP implementation, the grassland NDVI in most areas of Qinghai Province remained unchanged (Figure 4). However, after the first phase, the proportion of grassland NDVI that increased (higher than 0.01) was only 17.19%, which was lower than 27.33% before the implementation of the policy. In some areas, the ecological quality was degraded, with 12.38% of NDVI values (less than −0.01) higher than 5.45% (2001–2010). After the second phase of policy implementation, the grass NDVI (gather than 0.01) rose to 33.58%, higher than 27.33% before the policy (2001–2010). The NDVI value in the 0.01–0.05 area increased by 15.63% compared to the first phase of policy implementation, nearly doubling.
Before the implementation of the GECP, there was an increase in NDVI values. Most of the areas with increasing values were located in the eastern and southern regions of Qinghai, which was due to the implementation of some provincial policies such as returning farmland to grass. After the first round of GECP, the effect turned out to be poor and had a limited impact on the overall ecological quality improvement. After the second phase, a significant increase in NDVI values was shown in most areas. In some areas, the NDVI values decreased consistently, mainly in the north-western Tsaidam Basin. The overall ecology of the southeastern region is improving.
The grassland NDVI from 2011 to 2015 did not increase significantly compared to that in the pre-policy period, and only in the second phase did it increase significantly. The proportion of NDVI increasing in the range of 0.01–0.05 increased from 17% to 33%, indicating that the average NDVI value during the second round of policy years was higher than that of the first round of policies. From 2020 to 2011, the ratio of NDVI growth in the range of −0.05 to −0.01 was 5%, which was the same from 2010 to 2001. The proportion of the increase in the range of −0.01–0.01 decreased from 67% to 61%. It shows that after the implementation of the GECP policy, the grassland NDVI values in most regions tend to increase. In 2011–2017, the proportion of grassland NDVI (gather than 0.3) increased from 55.07% to 58%. After the implementation of the policy, it showed a slight increasing trend in general grassland NDVI; the NDVI of 72.5% of the grassland area was on the rise, while that of 27.5% of the grassland area was declining [15].
The herders in a same municipality receive the same amount of compensation. The price is related to the grassland quality, and municipalities with higher-quality grassland receive higher amount of compensation. Specifically, the compensation levels for the Tibetan Autonomous Prefecture of Huangnan were the highest (CNY 17.5/mu/year), followed by Hainan and Haibei (CNY 12.3/mu/year), Guoluo and Yushu (CNY 6.4/mu/year), and Haixi (CNY 3.6/mu/year) in 2020 [16]. The price is higher than that in the first round of compensation (Table A4). In the third round of GECP, the grazing ban zone area did not increase.
3.2. Changes in Grassland Area in Qinghai Province in the Last Two Decades
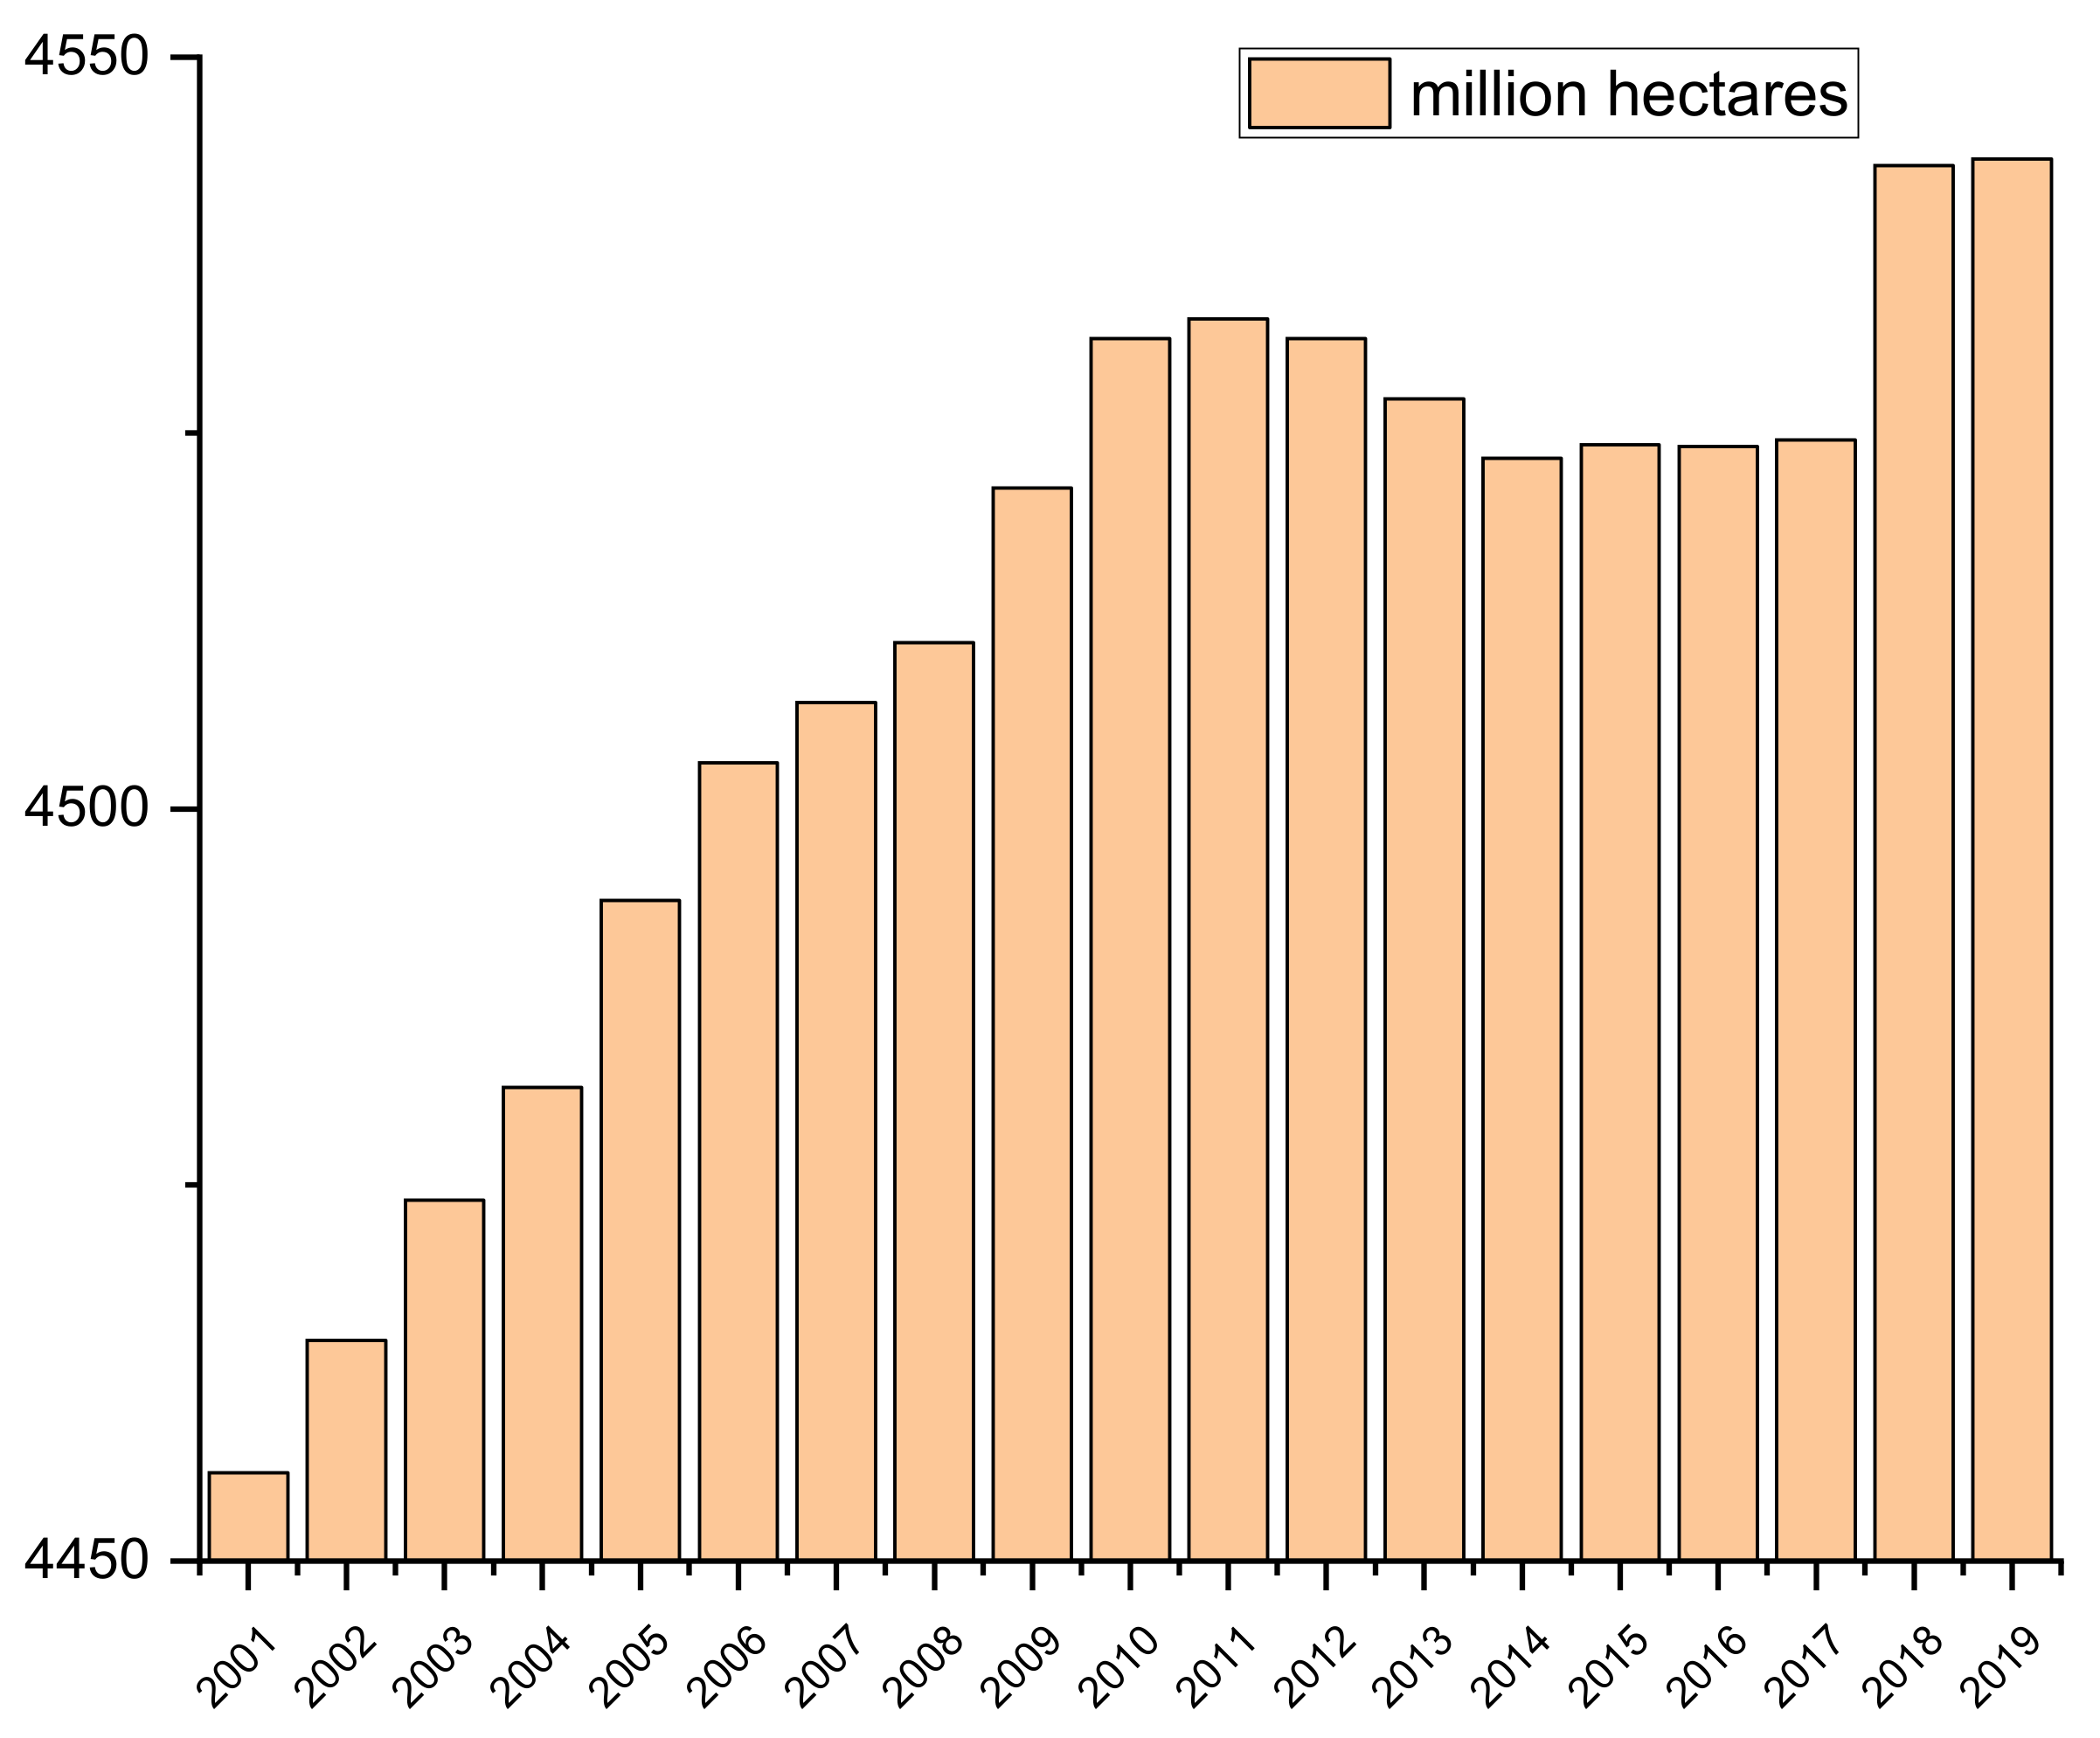
From the 1980s to 2000, the grassland area has decreased by 2.59 million hm2 in arid and semiarid China. The primary driving factor was the cultivation of grassland. From 1980 to 2000, the grassland area had been declining. From 2000 to 2008, it started to increase [2] (Figure 5).
The implementation of the GECP led to an increase in grassland cover in most cases [15]. However, there was no significant increase in the area of grassland. The area of grassland in Qinghai had been increasing year by year after 2001. But after the GECP was implemented, the area showed a slightly decreasing trend from 2012–2014, remained basically unchanged from 2014–2017, and had an obvious increasing trend from 2017–2019. In the first and second rounds, grasslands were only classified as non-grazing areas and grass-livestock balance areas, and the classification did not change in five years after the initial delineation of the GECP. In the third phase (2021–2025), the non-grazing areas and grass-livestock balance areas are again divided into contracted and uncontracted areas (Table A5) depending on the contracting status of the grassland. For example, uncontracted grasslands in Cocoa Cyrus Nature Reserve are managed as grazing ban or grass-livestock balance area but are not eligible for subsidies.
Zhou used remote sensing to study the degradation of China’s grasslands from 1982 to 2010, and the grasslands in Qinghai Province showed slight restoration [17]. As a result of the national project Grain to Green Program in 1999 and the Returning Grazing Land to Grass Program in 2003, this study got the same result. The changes in vegetation cover in the north-western grasslands (including Qinghai) show that the area of grassland has decreased from 1990 to 2010. Although grassland area has decreased gradually over the past 30 years, the NDVI in most areas showed that the vegetation was gradually restored [18].
3.3. Changes in the Remote Sensing Ecological Index RSEI in Qinghai Province in the Last Two Decades
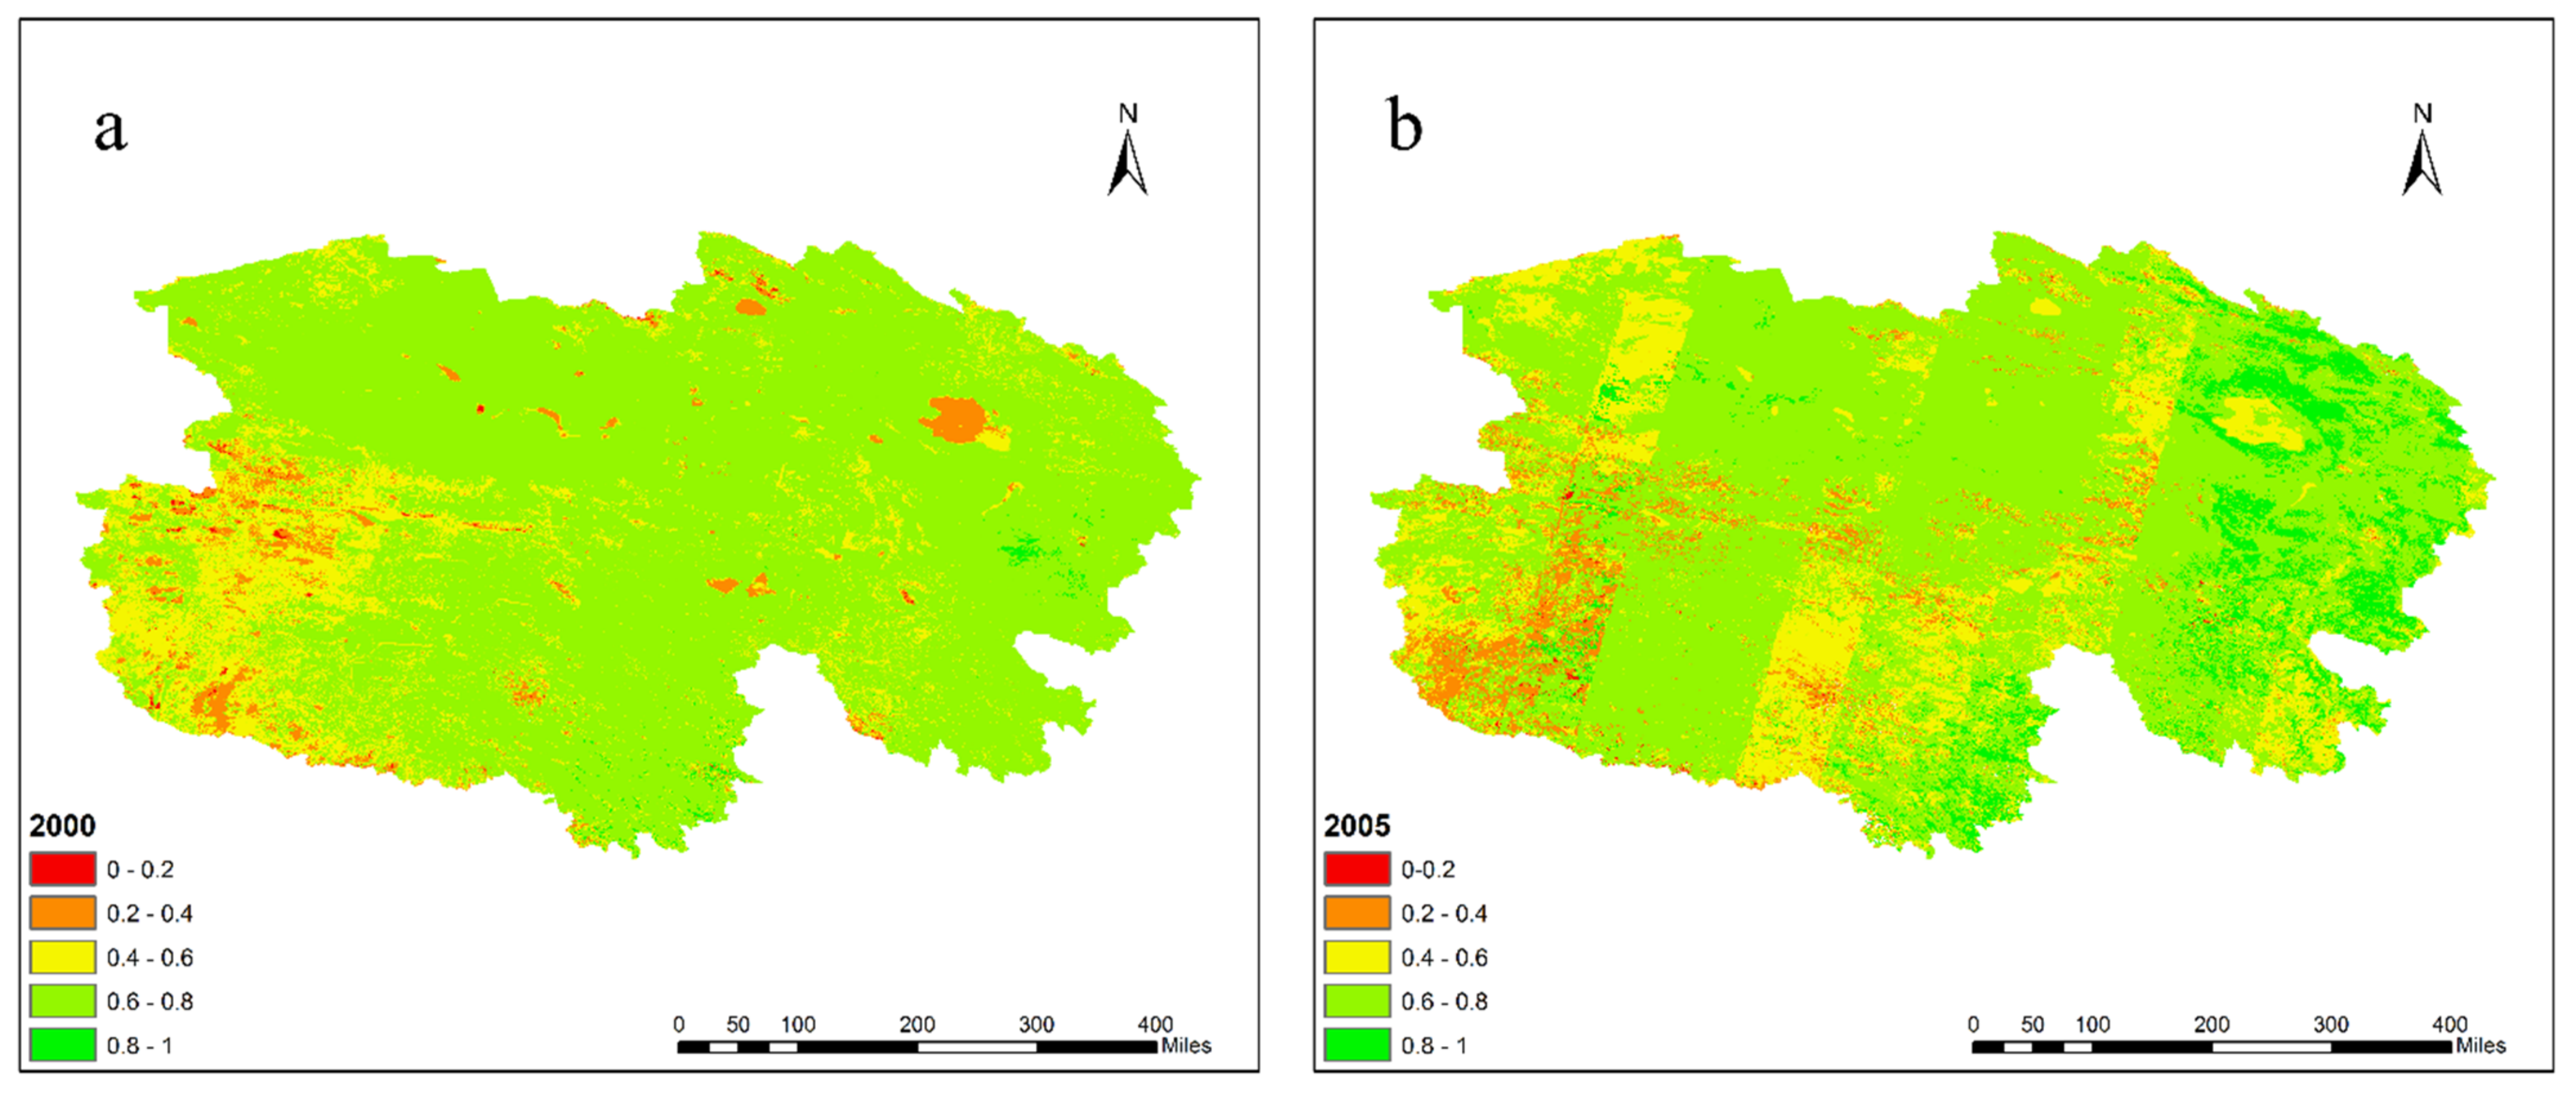
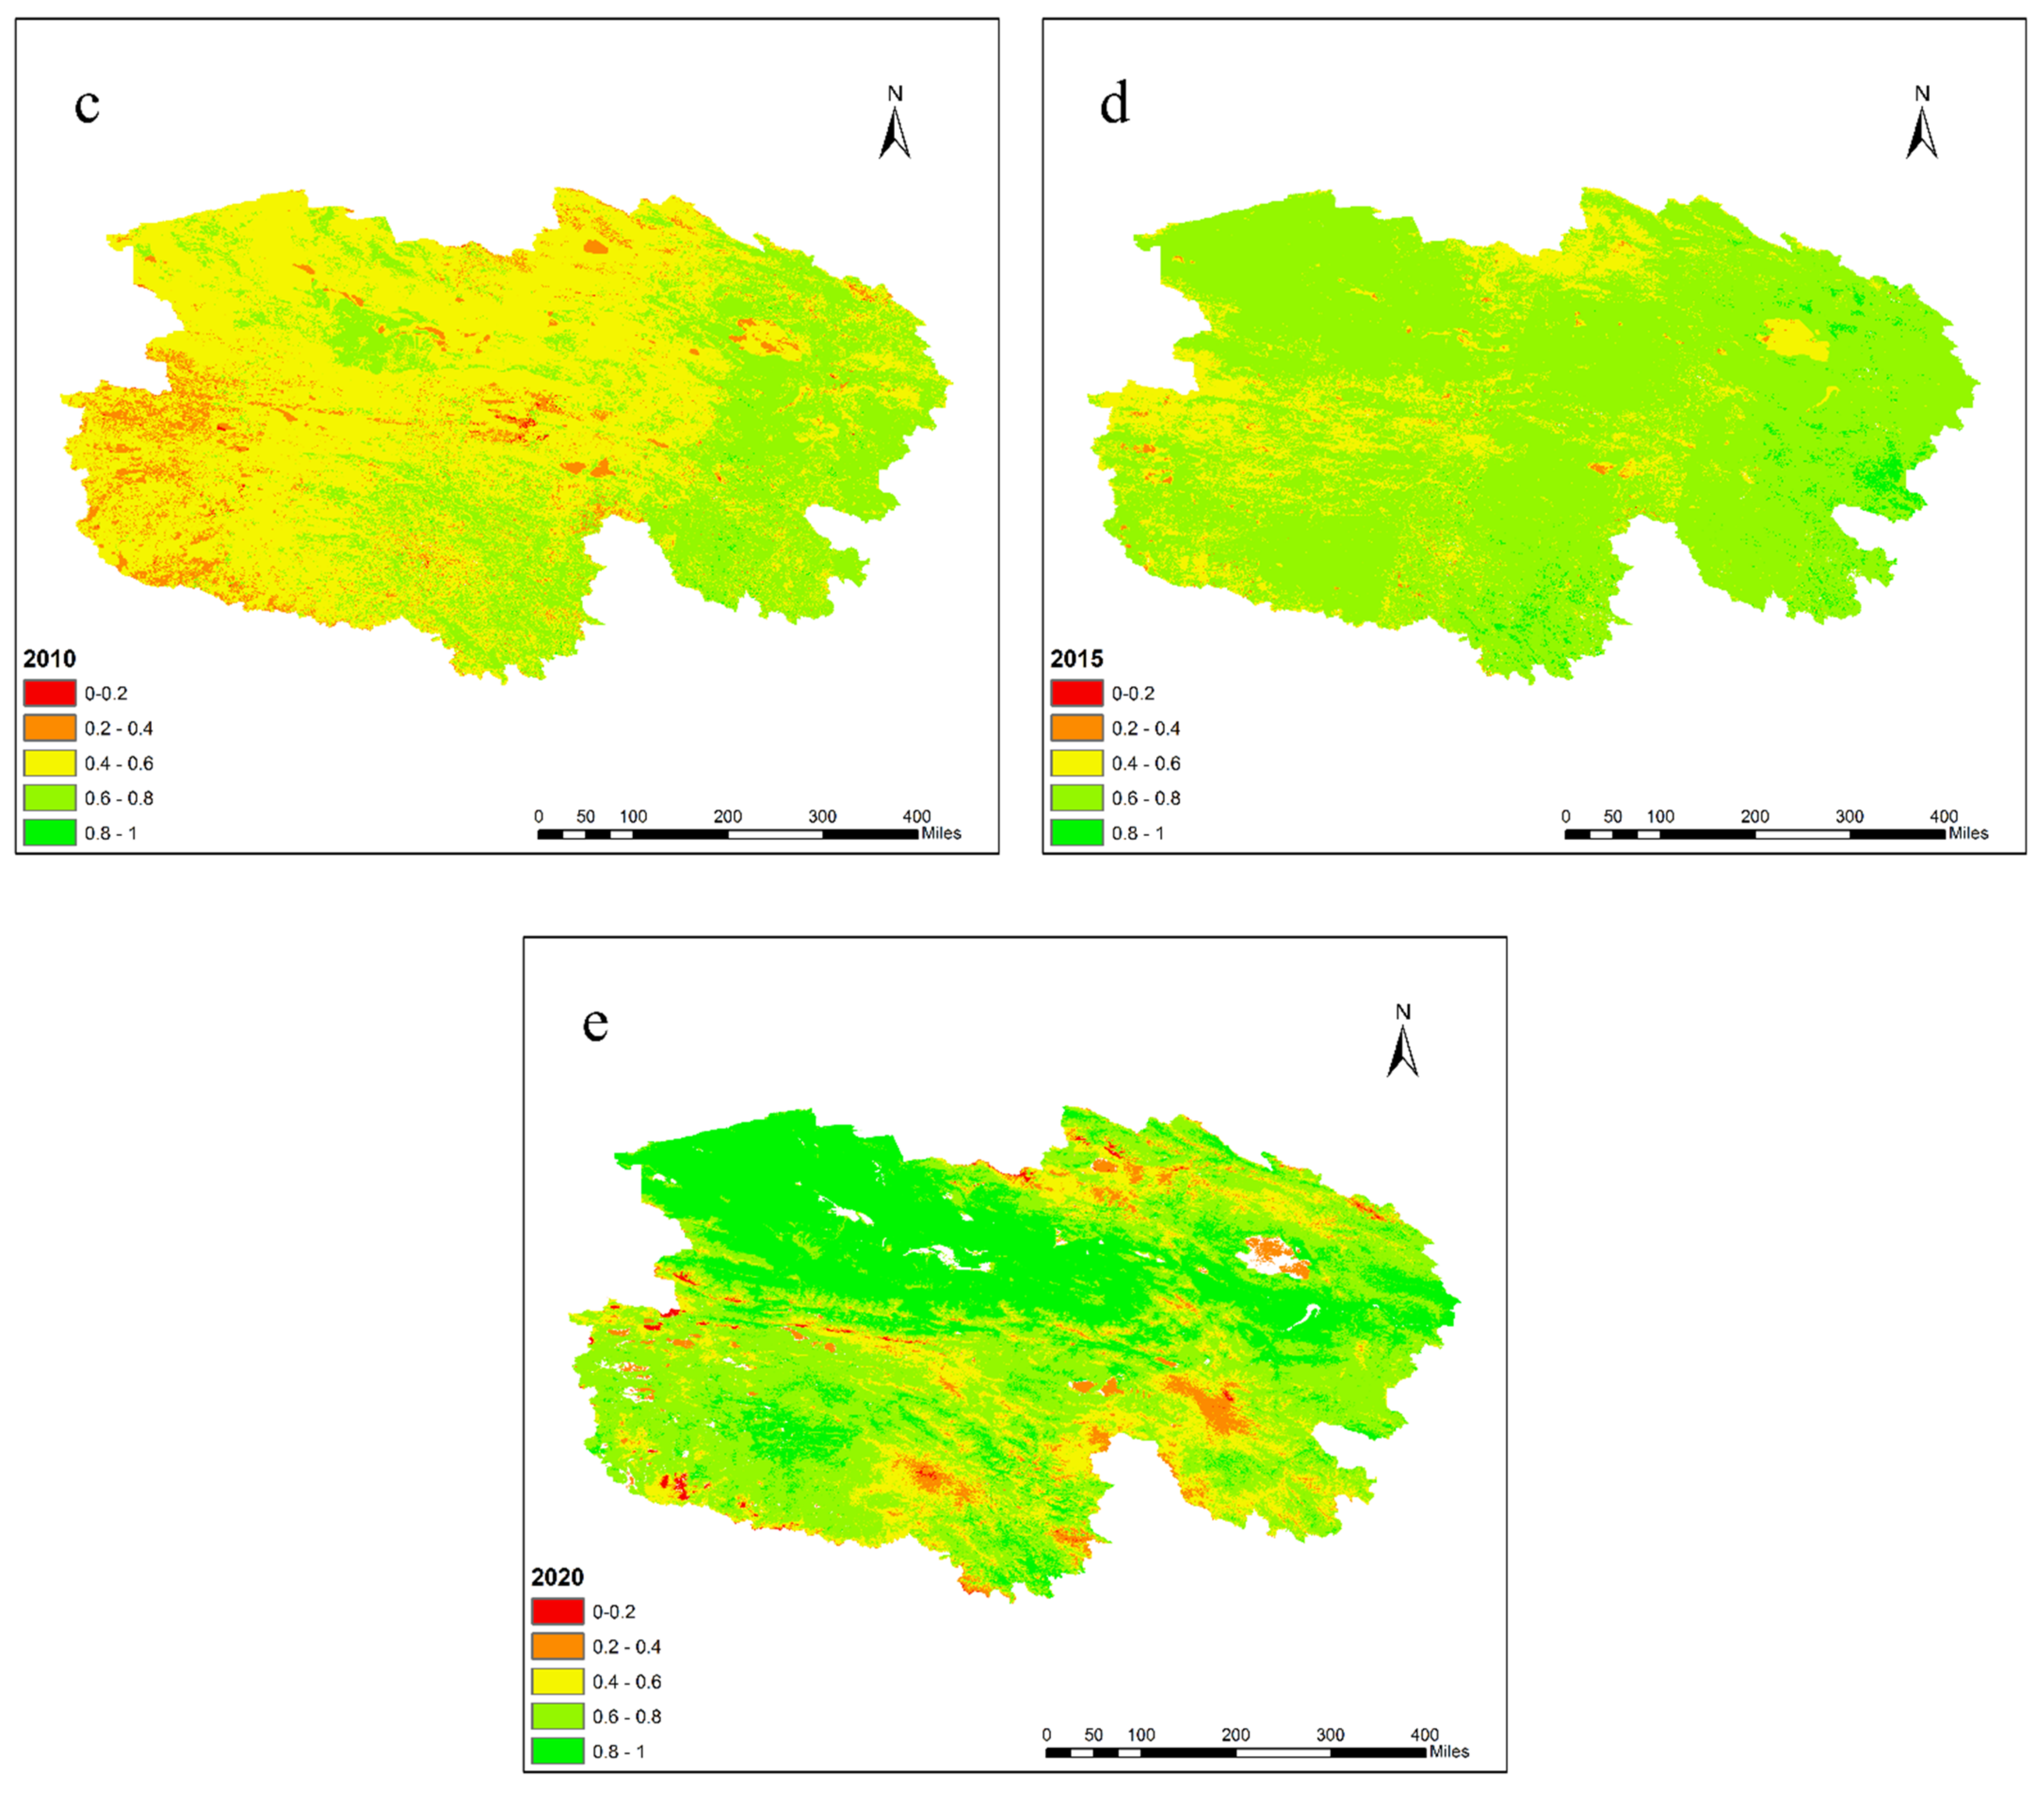
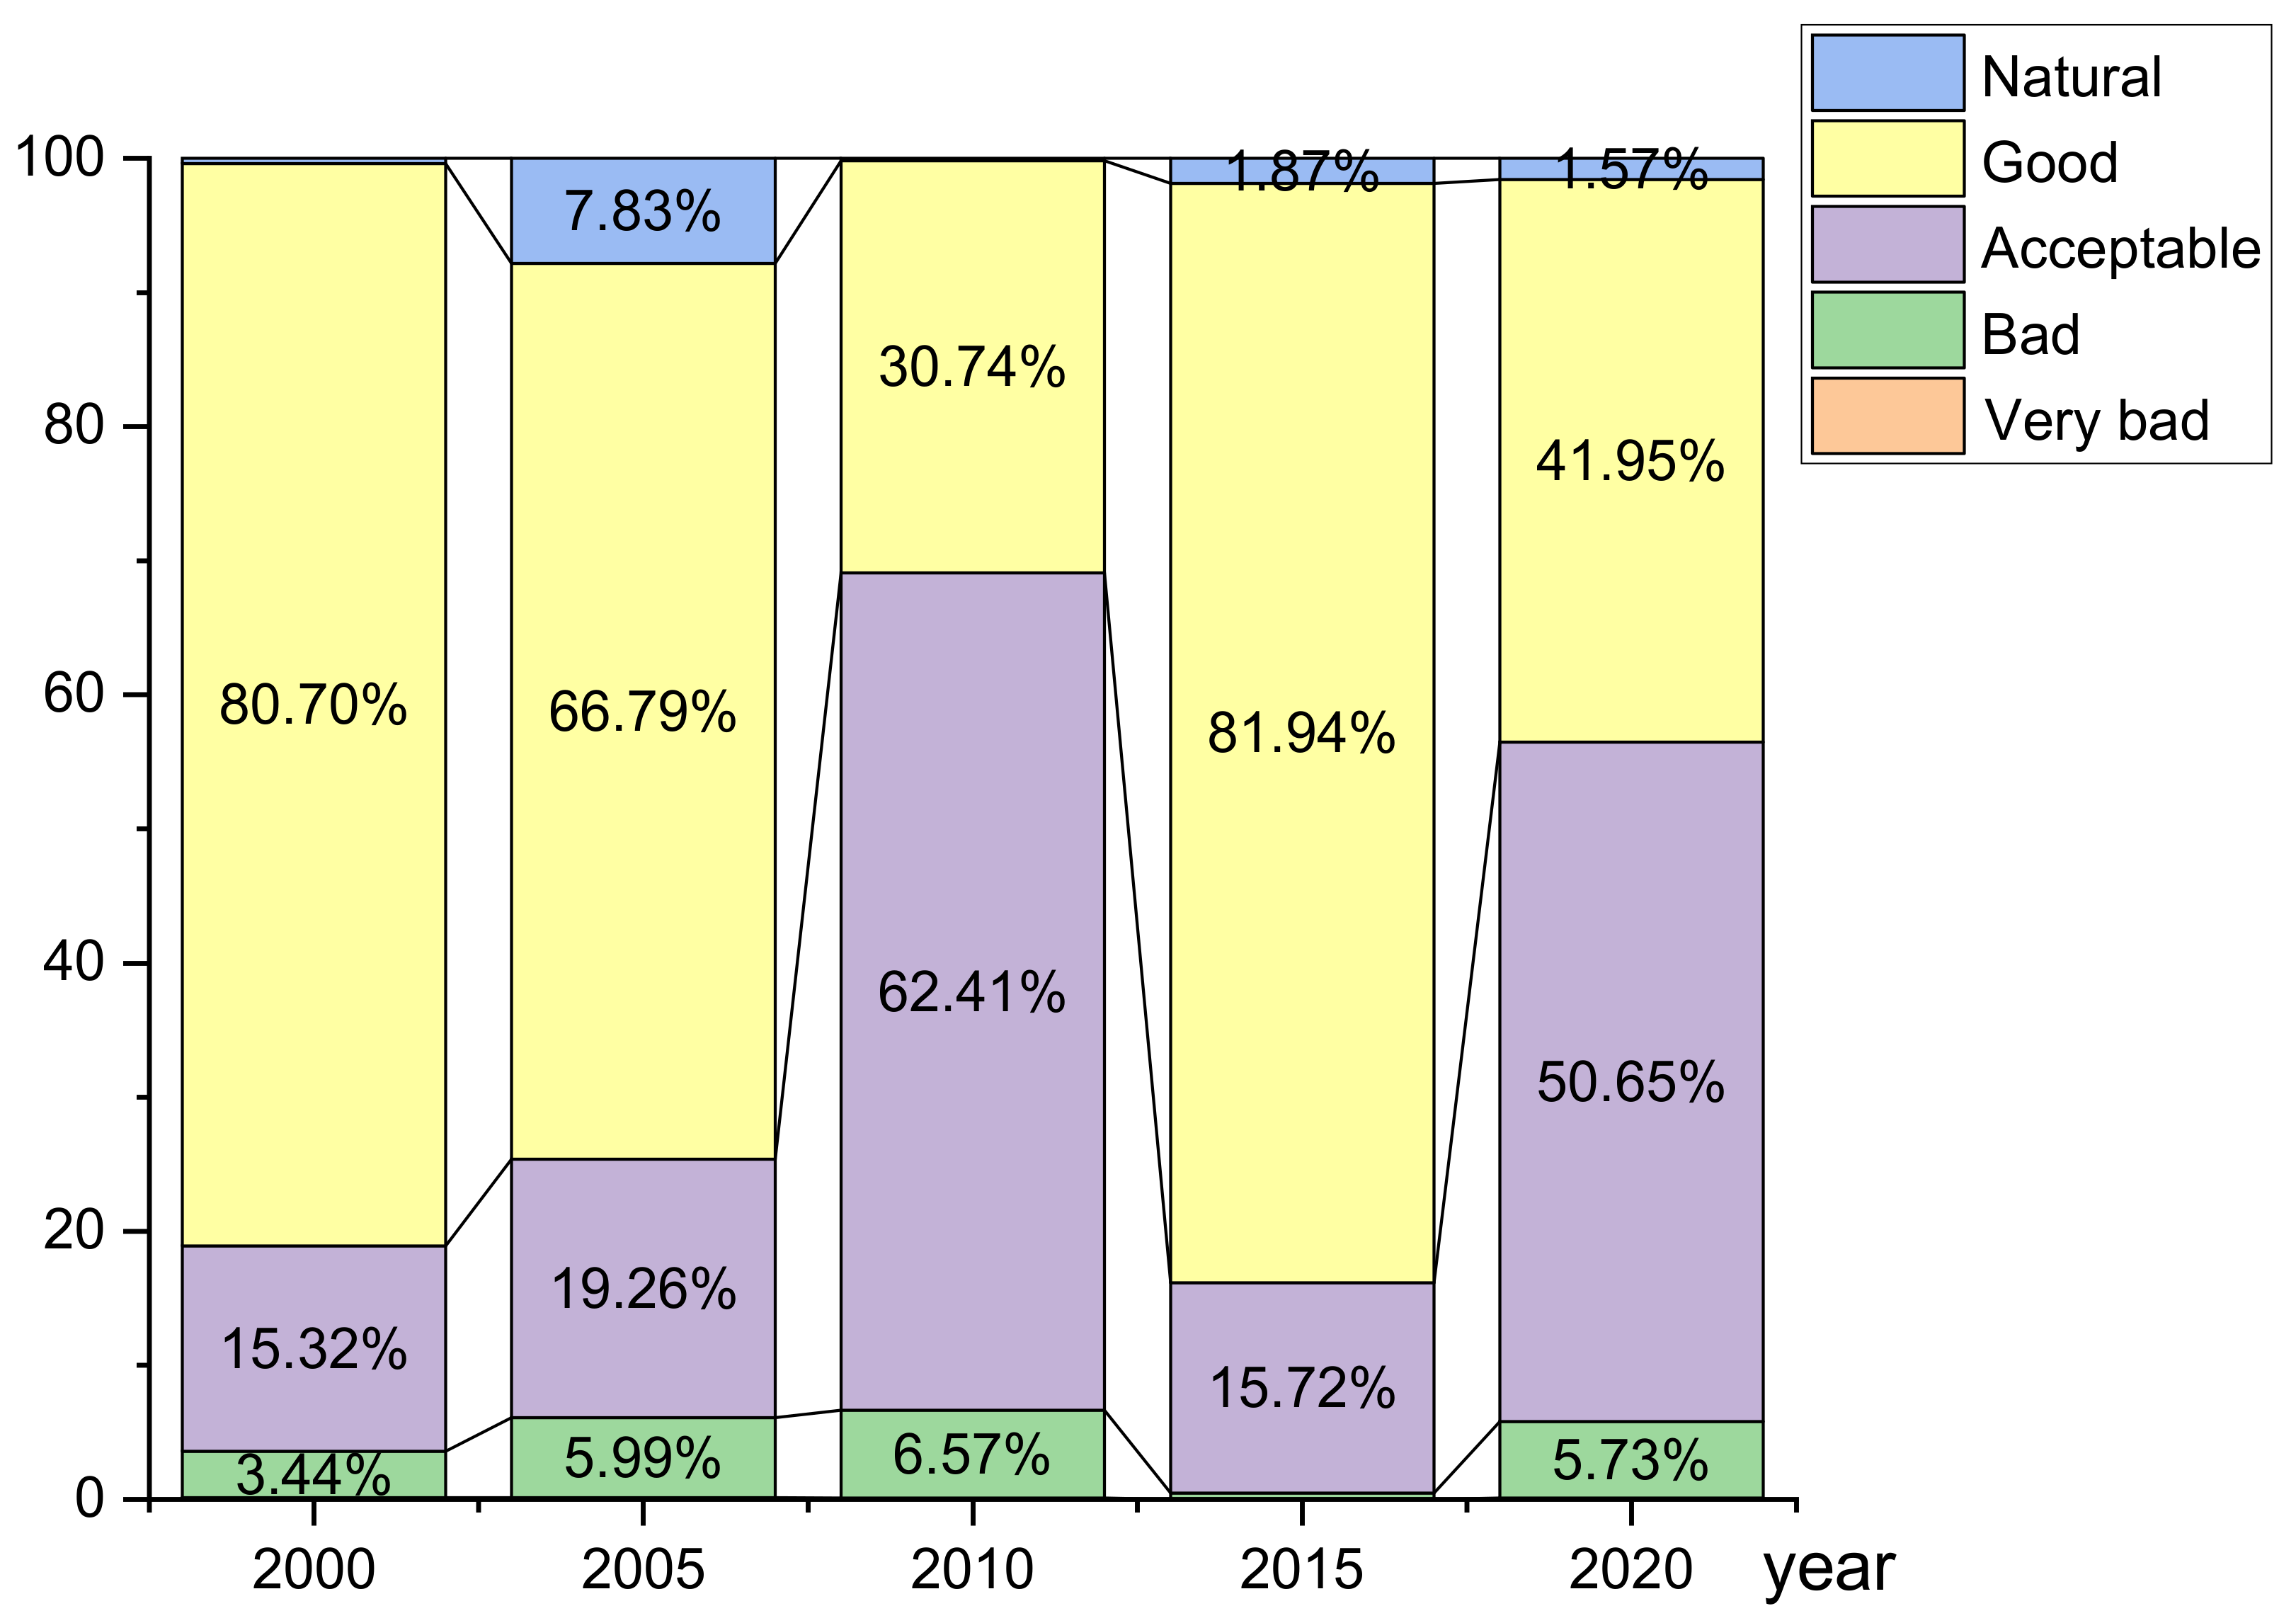
RSEI is a spatially-continuous measure of ecological quality, which is formed by calculating and scoring the PC1 of the four indices according to their attributes. Table 1 is the PCA data for RSEI in 20 years. PC1 has the largest eigenvalue among the four principal components, which exceeded 90% from 2000–2020. The main factor PC1 accounted for more than 90%. The RSEI was subtracted from 1 and then normalized within [0, 1]. This procedure gives scores for RSEI on a common scale of 0 to 1 for easy comparison with 0, which indicates very bad ecological quality, and 1, representing natural ecological quality. To analyze the representativeness of the RESI, the ecological index was graded at 0.2 intervals, representing five grades, very bad, bad, acceptable, good, and natural, as shown in Figure 6. Therefore, the final RSEI score represents the degree of naturalness of a study area (Figure 7).
Through the analysis and comparison of the RSEI values, it is found that the ecological index presents a trend that is different from the previous trend of NDVI. The proportion of the very bad grassland RSEI in Qinghai is less than 0.2% in all 20 years (Table A3). The trend of the RSEI from 2000 to 2010 is decreasing. The trend of the RSEI from 2010 to 2020 is increasing and then decreasing. It is possible that this was because of April 14th Yushu earthquake in 2010. Also, Covid-19 caused many industries to slow down in 2020. Overall, although the RSEI fluctuated over the 20 years, the proportion of bad was decreasing (Figure 7).
Some research has a different view. From 2000–2017, the RSEI for China showed that Qinghai Province was among the ecological improvement areas from 2000–2009, ecological degradation areas from 2009–2014, and then became one of the ecological improvement areas in 2014–2017 [19]. Due to the high temperatures in four seasons in 2014, the national average temperature is 0.5 C higher than that of the average year, and it was the sixth warmest year since 1961, along with 1999. The poor RSEI in 2014 may be due to the high temperature in that year, which affected the share of parameters. The poor ecological quality shown by this study in 2015 may be affected. The spatiotemporal evaluation of China’s ecological quality by RSEI was mainly concentrated in some key protected areas of ecologically fragile areas, the ecotone of agriculture and animal husbandry in the north of China [20,21], Northwest Desert Oasis [18,22], Qinghai-Tibet Plateau [23], and Loess Plateau [24].
From the perspective of spatial distribution, both ecological improvement and degradation occur in the western region and the area to the west of “Heihe–Tengchong Line”, including Qinghai Province [19]. Moreover, the northwestern region is relatively arid, and the environment is more susceptible to temperature and precipitation.
It is possible that the RSEI index shows no significant increase in grassland ecological quality, but some studies have shown an increase in grassland productivity during this period. Lin et al. contrasted the climate and actual net primary productivity (NPP) before (2004–2010) and after (2011–2017) the implementation of GECP and found an increase in all grasslands with the implementation of the policy [25].
The grassland restoration in the Qinghai-Tibet Plateau is mainly influenced by human activities and has been slightly restored from 2000 to 2013 [26]. Precipitation variability has benefited the recovery and protection of grasslands, while temperature and solar radiation variability exacerbated the grassland degradation [27,28]. Since 2000 and 2003, the Returning Farmland to Grassland and Rangeland to Grassland programs have given subsidies to farmers and livestock herders who transform their farmland or rangeland into grasslands within three to five years. Huang’s research concluded that grassland conservation programs, especially the two projects mentioned above, had significantly restored and protected the grassland ecosystem structure and functions [3].
The changes in the grassland ecological quality index RSEI in Qinghai Province also show that the GECP has helped to improve the quality of grassland. Although it achieved a good result in improving the grassland ecological quality in the first round between 2011 and 2015, no good result has been delivered in the second phase, and no specific reason can be speculated for the time being. In conjunction with the previous section, we can say that although the ecological quality RSEI did not perform well, the overall vegetation index was still good, probably due to the climatic factors in June–July.
4. Discussion
Studies have shown that from 2000 to 2010, the ecological environment quality in the Sanjiangyuan area in the southern part of Qinghai was in a trend of improvement, and the area of mild deterioration was greatly reduced [29]. As NDVI also varies seasonally, the interannual averages are used for this data, and temperate grassland NDVI changes are more correlated with temperature [25].
After the implementation of the first round of policies from 2011 to 2015, the rising trend of grassland NDVI values is not obvious, which may be because people’s grazing activities have not been adjusted in the early stage of the policy.
Hu found that grassland herders in Inner Mongolia did not significantly reduce livestock numbers and grazing intensity during the first phase of policy implementation, and the policy only led to a reduction in some sheep numbers and had no effects on cattle numbers [8]. Dong found that the more subsidy, the more livestock. In the forage-livestock balance zone, the subsidy level was up from 1.5 CNY (2011–2015) to 2.5 CNY (2016–2020), and the livestock number was still over the carrying capacities [30]. It is speculated that the quality of grassland may not have improved as expected, probably because the herdsmen were not satisfied with the compensation amount. Tang conducted a sample survey in the Qinghai and Gansu provinces, and most people thought that the compensation standard was too low [16]. To make a living, some herders may still engage in overgrazing and stealth grazing. As the policy is mandatory, their behaviors are illegal. Li et al. also found that the grazing intensity decreased significantly after implementation of the GECP, but the grassland NDVImax did not increase as expected in the northern Tibetan Plateau.
The GECP policy requires the grassland to maintain the same state for five years, and the increase in the grassland area may be the improvement of the regional microecology. The reduction in grassland area may be due to the weather. In the first round of the GECP, there was no significant increase in grassland area and NDVI values. In the second round, the grassland area started to improve, probably due to the accumulation of time latitude. The grassland area is expanding slowly due to the accumulation of ecological restoration. The second reason could be climatic factors. The National Bureau of Statistics of China on climatic disasters in Qinghai Province reveals that from 2011–2017, there was a large range of droughts [31,32], wind and hailstorms, and low temperatures [33], which tested the fragile grasslands.
Some researchers have also argued that the RESI is biased in assessing ecological quality in cities and other residential areas [34]. Liu analyzed the RESI in the Beijing region and found that the RESI could underestimate the proportion of poor and poorer ecology and sometimes overestimate that of excellent ecology [35]. However, it does play certain roles in assessing the changes of ecological quality in the entire space-time state. It also observed that natural factors, such as temperature, potential evapotranspiration, and precipitation had the greatest influence on the overall ecological quality. The rapid increase in regional population and human activity played an important role in the variation of regional RSEI [24].
The trend of RSEI in this study is not consistent with that of NDVI, which may be because the data of RESI are only selected from June to July for analysis. Qinghai Province is located on the Qinghai-Tibet Plateau, and the vegetation grows most vigorously from June to July in summer. Poor growth due to environmental factors such as climate will also affect the evaluation of the ecological index.
The government has some statistics on the effect of GECP. According to the National Forestry and Grassland Bureau, the comprehensive vegetation cover of grasslands nationwide has increased from 51% in 2011 to 56.1% in 2020, with fresh grass production reaching 1.1 billion tons. Herders in the 13 provinces implementing the GECP receive 700 yuan per year in bonus funds, and the average household income increases by nearly 1500 yuan per year. The 2016 data show that during the five years of the GECP, the average cover of pasture in Qinghai increased by 3.4 percentage points, and the livestock overload dropped to 9.9% from 35.8% in 2010. The annual increase of outbound water from the Sanjiangyuan exceeded 20 billion cubic meters, close to the historical maximum.
This study has certain limitations. Our study found that although grassland NDVI and RSEI values fluctuated during the GECP implementation years, the overall grassland ecological quality in Qinghai Province still showed a trend of improvement. For grassland ecology, in addition to the policy support of GECP, herder behavior and climate factors will also affect the changes in grassland ecological quality. This also requires more research and policy to regulate.
5. Conclusions
We provide additional evidence for the impact of the GECP, by far the world’s largest grassland-focused PES program to date. According to the changes in the ecological quality in Qinghai Province from 2000–2020 by NDVI, the ecological quality tended to improve between 2000 and 2010. The grassland ecology did not improve significantly in the first round of policy implementation from 2011 to 2015.
However, in 2016–2020, the grassland ecology quality improved significantly in the second round of policy implementation by reducing livestock production. In fact, these findings are consistent with those found in Hou et al. [7].
The grassland area in Qinghai Province gradually increased, but then increased slowly between 2012 and 2017, showing a relatively stable trend.
The GECP is still helpful in improving the ecological quality. GECP policy design should follow PES theory more closely, as this will enhance monitoring and program efficiency. We hope it will continue to be implemented.
Author Contributions
Conceptualization, F.Y. and J.X.; formal analysis, J.X.; data curation, X.Z.; writing—original draft preparation, F.Y.; writing—review and editing, J.X., X.W. and Y.X.; visualization, X.Z. All authors have read and agreed to the published version of the manuscript.
Funding
This research was funded by Qinghai Provincial Science and Technology Major Project (2018-NK-A2).
Institutional Review Board Statement
Not applicable.
Data Availability Statement
The data presented in this study are available upon request from the corresponding author.
Acknowledgments
The constructive comments and suggestions from reviewers are highly appreciated.
Conflicts of Interest
The authors declare no conflict of interest.
Abbreviation
| GECP | Grassland Ecological Compensation Policy |
| NDVI | Normalized Difference Vegetation Index |
| PES | Payment-for-ecosystem-services |
| RSEI | Grassland Remote Sensing Ecological Index |
| SRs | Stocking rates |
| SISGC | Subsidy and Incentive System for Grassland Conservation |
| IGBP | International Geosphere-Biosphere Project |
| VNIR | Visible and near-infrared |
| SWIR | Short-wave infrared |
| TIR | Thermal infrared |
| LST | Land surface temperature |
Appendix A

Table A1.
The proportion of NDVI graded area in Qinghai Province from 2000 to 2020.
| NDVI | 2000 | 2005 | 2010 | 2015 | 2019 | 2020 |
|---|---|---|---|---|---|---|
| <0.1 | 39.79% | 39.49% | 35.33% | 36.09% | 38.55% | 33.83% |
| 0.1–0.2 | 25.22% | 25.53% | 24.80% | 26.92% | 26.04% | 25.56% |
| 0.2–0.3 | 17.21% | 17.32% | 17.41% | 17.66% | 16.32% | 18.43% |
| 0.3–0.5 | 17.61% | 17.50% | 22.24% | 19.05% | 18.89% | 21.73% |
| 0.5–0.7 | 0.17% | 0.15% | 0.21% | 0.28% | 0.22% | 0.45% |
| 0.7–1 | 0.00% | 0.00% | 0.00% | 0.00% | 0.00% | 0.00% |
Table A2.
Percentage of eco-environment quality dynamics by difference NDVI in the Qinghai before and after the GECP.
Table A2.
Percentage of eco-environment quality dynamics by difference NDVI in the Qinghai before and after the GECP.
| Difference Value | 2010–2001 | 2015–2006 | 2020–2011 |
|---|---|---|---|
| <−0.05 | 0.29% | 0.36% | 0.23% |
| −0.05~−0.01 | 5.16% | 12.02% | 4.90% |
| −0.01~0.01 | 67.22% | 70.43% | 61.28% |
| 0.01~0.05 | 27.03% | 16.99% | 32.62% |
| > 0.05 | 0.30% | 0.20% | 0.96% |
Table A3.
Percentage of RSEI classification by classification in Qinghai Province, 2000–2020.
| RESI | 2000 | 2005 | 2010 | 2015 | 2020 |
|---|---|---|---|---|---|
| Very bad [0–0.2) | 0.15% | 0.13% | 0.11% | 0.00% | 0.10% |
| Bad [0.2–0.4) | 3.44% | 5.99% | 6.57% | 0.47% | 5.73% |
| Acceptable [0.4–0.6) | 15.32% | 19.26% | 62.41% | 15.72% | 50.65% |
| Good [0.6–0.8) | 80.71% | 66.79% | 30.74% | 81.94% | 41.95% |
| Natural [0.8–1.0) | 0.39% | 7.83% | 0.17% | 1.87% | 1.57% |
Table A4.
Two rounds of the subsidy and incentive standards of the GECP for grazing prohibition in Qinghai province.
Table A4.
Two rounds of the subsidy and incentive standards of the GECP for grazing prohibition in Qinghai province.
| The Allowance Standard for Grazing Prohibition (CNY/mu/Year) | |
|---|---|
| 2011–2015 Year | 2016–2020 year |
| Huangnan (CNY 14) | Huangnan (CNY 17.5) |
| Hainan and Haibei (CNY 10) | Hainan and Haibei (CNY 12.3) |
| Guoluo and Yushu (CNY 5) | Guoluo and Yushu (CNY 6.4) |
| Haixi (CNY 3) | Haixi (CNY 3.6) |
Table A5.
The area affected by natural disasters in Qinghai Province in the past 20 years (unit: thousand hectares).
Table A5.
The area affected by natural disasters in Qinghai Province in the past 20 years (unit: thousand hectares).
| Value | Area Affected by Drought | Area Affected by Floods, Geological Hazards and Typhoons | Area Affected by Wind and Hail Damage | Area Affected by Low Temperature Freeze and Snow |
|---|---|---|---|---|
| 2010 | 46.1 | 22.3 | 42.9 | - |
| 2011 | 184.7 | 27.7 | 65.8 | 7.3 |
| 2012 | 33.3 | 36 | 49.4 | 36.2 |
| 2013 | 41.7 | 15.5 | 30.8 | 83.2 |
| 2014 | 23.9 | 14.1 | 67.5 | 64.3 |
| 2015 | 126.5 | 9.8 | 49.8 | 34.4 |
| 2016 | 38.3 | 13.5 | 66.5 | 16.4 |
| 2017 | 225.3 | 5 | 42.1 | - |
| 2018 | 14.6 | 25.3 | 10.8 | 1.2 |
| 2019 | - | 21 | 38.2 | 11.1 |
| 2020 | - | 22.5 | 17.2 | 3.4 |
References
- Food And Agriculture Organization (FAO). Are Grasslands Under Threat? Brief Analysis of FAO Statistical Data on Pasture and Fodder Crops. 2008. Available online: http://www.fao.org/uploads/media/grass_stats_1.pdf (accessed on 15 July 2022).
- Huang, L.; Xiao, T.; Zhao, Z.; Sun, C.; Liu, J.; Shao, Q.; Fan, J.; Wang, J. Effects of grassland restoration programs on ecosystems in arid and semiarid China. J. Environ. Manag. 2013, 117, 268–275. [Google Scholar] [CrossRef] [PubMed]
- Bardgett, R.D.; Bullock, J.M.; Lavorel, S.; Manning, P.; Schaffner, U.; Ostle, N.; Chomel, M.; Durigan, G.; LFry, E.; Johnson, D.; et al. Combatting global grassland degradation. Nat. Rev. Earth Environ. 2021, 2, 720–735. [Google Scholar] [CrossRef]
- Gang, C.; Zhou, W.; Chen, Y.; Wang, Z.; Sun, Z.; Li, J.; Qi, J.; Odeh, I. Quantitative assessment of the contributions of climate change and human activities on global grassland degradation. Environ. Earth Sci. 2014, 72, 4273–4282. [Google Scholar] [CrossRef]
- Yihui, D. Effects of the Qinghai-Xizang (Tibetan) Plateau on the Circulation Features over the Plateau and Its Surrounding Areas. Adv. Atmos. Sci. 1992, 9, 112–130. [Google Scholar] [CrossRef]
- Sandra, U.; Li, F.; Zhen, L.; Cao, X. Payments for Grassland Ecosystem Services: A Comparison of Two Examples in China and Germany. J. Resour. Ecol. 2010, 1, 319–330. [Google Scholar]
- Hou, L.; Xia, F.; Chen, Q.; Huang, J.; He, Y.; Rose, N.; Rozelle, S. Grassland ecological compensation policy in China improves grassland quality and increases herders’ income. Nat. Commun. 2021, 12, 4683. [Google Scholar] [CrossRef]
- Liu, M.; Dries, L.; Heijman, W.; Huang, J.; Zhu, X.; Hu, Y.; Chen, H. The Impact of Ecological Construction Programs on Grassland Conservation in Inner Mongolia, China. Land Degrad. Dev. 2018, 29, 326–336. [Google Scholar] [CrossRef]
- Hu, Y.; Huang, J.; Hou, L. Impacts of the Grassland Ecological Compensation Policy on Household Livestock Production in China: An Empirical Study in Inner Mongolia. Ecol. Econ. 2019, 161, 248–256. [Google Scholar] [CrossRef]
- Xu, H. A remote sensing urban ecological index and its application. Acta Ecol. Sin. 2013, 33, 7853–7862. [Google Scholar] [CrossRef]
- Goetz, S.J. Multi-sensor analysis of NDVI, surface temperature and biophysical variables at a mixed grassland site. Int. J. Remote Sens. 1997, 18, 71–94. [Google Scholar] [CrossRef]
- Xu, H.; Wang, M.; Shi, T.; Guan, H.; Fang, C.; Lin, Z. Prediction of ecological effects of potential population and impervious surface increases using a remote sensing based ecological index (RSEI). Ecol. Indic. 2018, 93, 730–740. [Google Scholar] [CrossRef]
- Xiong, Y.; Xu, W.; Huang, S.; Wu, C.; Dai, F.; Wang, L.; Lu, N.; Kou, W. Ecological environment quality assessment of Xishuangbanna rubber plantations expansion (1995–2018) based on multi-temporal Landsat imagery and RSEI. Geocarto Int. 2020, 37, 3441–3468. [Google Scholar] [CrossRef]
- Montanaro, M.; Gerace, A.; Lunsford, A.; Reuter, D. Stray Light Artifacts in Imagery from the Landsat 8 Thermal Infrared Sensor. Remote Sens. 2014, 6, 10435–10456. [Google Scholar] [CrossRef]
- Lin, H.; Zhao, Y.; Kalhoro, G.M. Ecological Response of the Subsidy and Incentive System for Grassland Conservation in China. Land 2022, 11, 358. [Google Scholar] [CrossRef]
- Tang, J.; Xin, M.; Wang, X. Herdsmen’s willingness to accept compensation for grazing ban compliance: Empirical evidence from pastoral China. J. Clean. Prod. 2022, 361, 132102. [Google Scholar] [CrossRef]
- Zhou, W.; Yang, H.; Huang, L.; Chen, C.; Lin, X.; Hu, Z.; Li, J. Grassland degradation remote sensing monitoring and driving factors quantitative assessment in China from 1982 to 2010. Ecol. Indic. 2017, 83, 303–313. [Google Scholar] [CrossRef]
- Chang, J.; Tian, J.; Zhang, Z.; Chen, X.; Chen, Y.; Chen, S.; Duan, Z. Changes of Grassland Rain Use Efficiency and NDVI in Northwestern China from 1982 to 2013 and Its Response to Climate Change. Water 2018, 10, 1689. [Google Scholar] [CrossRef]
- Liao, W.; Jiang, W. Evaluation of the Spatiotemporal Variations in the Eco-environmental Quality in China Based on the Remote Sensing Ecological Index. Remote Sens. 2020, 12, 2462. [Google Scholar] [CrossRef]
- Li, W.L.; Shi, Y.Z.; Lu, D.M.; Wu, T.H. The Spatio-temporal Evolution of Drought Vulnerability in the Ecotone between Agriculture and Animal Husbandry in the North of China. J. Nat. Resour. 2018, 33, 1599–1612. [Google Scholar]
- Hu, Y.; Nacun, B. An Analysis of Land-Use Change and Grassland Degradation from a Policy Perspective in Inner Mongolia, China, 1990–2015. Sustainability 2018, 10, 4048. [Google Scholar] [CrossRef]
- Abliz, A.; Tiyip, T.; Ghulam, A.; Halik, Ü.; Ding, J.L.; Sawut, M.; Zhang, F.; Nurmemet, I.; Abliz, A. Effects of shallow groundwater table and salinity on soil salt dynamics in the Keriya Oasis, Northwestern China. Environ. Earth Sci. 2016, 75, 260. [Google Scholar] [CrossRef]
- Xu, X.K.; Chen, H.; Levy, J.K. Spatiotemporal vegetation cover variations in the Qinghai-Tibet Plateau under global climate change. Chin. Sci. Bull. 2008, 53, 915–922. [Google Scholar]
- Sun, C.; Li, X.; Zhang, W.; Li, X. Evolution of Ecological Security in the Tableland Region of the Chinese Loess Plateau Using a Remote-Sensing-Based Index. Sustainability 2020, 12, 3489. [Google Scholar] [CrossRef] [Green Version]
- Piao, S.; Mohammat, A.; Fang, J.; Cai, Q.; Feng, J. NDVI-based increase in growth of temperate grasslands and its responses to climate changes in China. Glob. Environ. Change 2006, 16, 340–348. [Google Scholar] [CrossRef]
- Liu, Y.; Zhang, Z.; Tong, L.; Khalifa, M.; Wang, Q.; Gang, C.; Wang, Z.; Li, J.; Sun, Z. Assessing the effects of climate variation and human activities on grassland degradation and restoration across the globe. Ecol. Indic. 2019, 106, 105504. [Google Scholar] [CrossRef]
- Gao, Q.Z.; Wan, Y.F.; Xu, H.M.; Li, Y.; Jiangcun, W.Z.; Borjigidai, A. Alpine grassland degradation index and its response to recent climate variability in Northern Tibet, China. Quatern. Int. 2010, 226, 143–150. [Google Scholar] [CrossRef]
- Wang, Z.; Zhang, Y.; Yang, Y.; Zhou, W.; Gang, C.; Zhang, Y.; Li, J.; An, R.; Wang, K.; Odeh, I.; et al. Quantitative assess the driving forces on the grassland degradation in the Qinghai–Tibet Plateau, in China. Ecol. Inf. 2016, 33, 32–44. [Google Scholar] [CrossRef]
- Chen, W.; Huang, H.; Tian, Y.; Du, Y.Y. Monitoring and Assessment of the Eco-Environment Quality in the Sanjiangyuan Region based on Google Earth Engine. J. Geo-Inf. Sci. 2019, 21, 1382–1391. [Google Scholar]
- Dong, J.; Zhang, X.; Liu, X.; Ren, Z. Impact of precipitation on the two-stage grassland eco-subsidy policy effect on stocking reduction in Inner Mongolia, China. Grassl. Sci. 2022. [Google Scholar] [CrossRef]
- Clark, J.; Luce, C.; Patel-Weynand, T. Effects of Drought on Forests and Rangelands; U.S. Department of Agriculture, Forest Service, Climate Change Resource Center: Washington, DC, USA, 2016.
- Zhang, B.; Zhu, J.; Liu, H.; Pan, Q. Effects of extreme rainfall and drought events on grassland ecosystems. Chin. J. Plant Ecol. 2014, 9, 1008–1018. [Google Scholar]
- Wingler, A.; Hennessy, D. Limitation of Grassland Productivity by Low Temperature and Seasonality of Growth. Front. Plant Sci. 2016, 7, 1130. [Google Scholar] [CrossRef] [PubMed]
- Li, Y.; Wu, L.; Han, Q.; Wang, X.; Zou, T.; Fan, C. Estimation of remote sensing based ecological index along the Grand Canal based on PCA-AHP-TOPSIS methodology. Ecol. Indic. 2021, 122, 107214. [Google Scholar] [CrossRef]
- Liu, Y.; Dang, C.; Yue, H.; Lyu, C.; Qian, J.; Zhu, R. Comparison between modified remote sensing ecological index and RSEI. Natl. Remote Sens. Bull. 2022, 26, 683–697. [Google Scholar]
Figure 1.
Spatial distribution of the study area (from 2020 ESA World Cover image).

Figure 2.
Temporal and spatial trends of NDVI. (a–c) NDVI before implementation of the Grassland Ecological Compensation Program (GECP) (2000, 2005, and 2010); (d,e) NDVI after GECP implementation (2015 and 2020); NDVI stands for the Normalized Difference Vegetation Index, which is a measure of grassland quality. It was constructed based on infrared and near-infrared channel remote sensing images and has been widely used as an indicator for vegetation coverage.


Figure 3.
Eco-environment quality dynamics by classified NDVI in Qinghai Province from 2000 to 2020; NDVI proportions that are less than 1% are not marked in the figure.
Figure 3.
Eco-environment quality dynamics by classified NDVI in Qinghai Province from 2000 to 2020; NDVI proportions that are less than 1% are not marked in the figure.

Figure 4.
Temporal difference of NDVI. (a) Represents the mean for 2006–2010 minus the mean for 2001–2005. (b) Represents the mean for 2011–2015 minus the mean for 2006–2010. (c) Represents the mean for 2016–2020 minus the mean for 2011–2015. (d) Represents eco-environment quality dynamics by different NDVI in Qinghai before and after implementation of the GECP; values less than 1% are not marked in the figure.

Figure 5.
Changes in grassland area in 2001–2019.Unit: million hectares.

Figure 6.
RSEI changes in Qinghai Province in the last two decades. (a–c) represent RSEI of 2000, 2005, and 2010 before the implementation of GECP. (d,e) RSEI of 2015 and 2020 after GECP. RESI (0–1) is divided into 5 levels according to the value, representing very bad (0–0.2), bad (0.2–0.4), acceptable (0.4–0.6), good (0.6–0.8), and natural (0.8–1).


Figure 7.
Percentage of RSEI by classification in Qinghai Province, 2000–2020.

Table 1.
Principal component analysis of four variables.
| Year | PC1 | Percent Eigenvalue% | PC2 | Percent Eigenvalue% | PC3 | Percent Eigenvalue% | PC4 | Percent Eigenvalue% |
|---|---|---|---|---|---|---|---|---|
| 2000 | 1.42 | 97.66% | 0.02 | 1.50% | 0.01 | 0.51% | 0.00 | 0.33% |
| 2001 | 1.41 | 97.79% | 0.02 | 1.51% | 0.01 | 0.43% | 0.00 | 0.27% |
| 2002 | 1.16 | 97.50% | 0.02 | 1.47% | 0.01 | 0.56% | 0.01 | 0.47% |
| 2003 | 1.87 | 97.87% | 0.02 | 1.14% | 0.01 | 0.69% | 0.01 | 0.30% |
| 2004 | 1.17 | 96.02% | 0.03 | 2.05% | 0.02 | 1.25% | 0.01 | 0.69% |
| 2005 | 1.53 | 97.23% | 0.02 | 1.43% | 0.01 | 0.90% | 0.01 | 0.43% |
| 2006 | 1.84 | 98.24% | 0.02 | 0.87% | 0.01 | 0.63% | 0.00 | 0.26% |
| 2007 | 1.16 | 94.04% | 0.05 | 3.91% | 0.02 | 1.35% | 0.01 | 0.70% |
| 2008 | 1.64 | 97.40% | 0.03 | 1.50% | 0.01 | 0.77% | 0.01 | 0.33% |
| 2009 | 1.04 | 91.29% | 0.07 | 6.55% | 0.02 | 1.36% | 0.01 | 0.80% |
| 2010 | 0.98 | 94.62% | 0.03 | 2.83% | 0.02 | 1.57% | 0.01 | 0.99% |
| 2011 | 0.97 | 96.32% | 0.01 | 1.39% | 0.01 | 1.21% | 0.01 | 1.07% |
| 2012 | 1.10 | 93.21% | 0.06 | 4.85% | 0.01 | 1.06% | 0.01 | 0.88% |
| 2013 | 1.35 | 97.28% | 0.02 | 1.30% | 0.01 | 0.87% | 0.01 | 0.55% |
| 2014 | 1.17 | 97.61% | 0.02 | 1.25% | 0.01 | 0.62% | 0.01 | 0.52% |
| 2015 | 1.18 | 98.03% | 0.02 | 1.26% | 0.01 | 0.55% | 0.00 | 0.16% |
| 2016 | 1.15 | 98.11% | 0.01 | 1.26% | 0.01 | 0.53% | 0.00 | 0.10% |
| 2017 | 1.25 | 97.93% | 0.02 | 1.26% | 0.01 | 0.70% | 0.00 | 0.12% |
| 2018 | 1.85 | 98.10% | 0.02 | 0.85% | 0.01 | 0.73% | 0.01 | 0.32% |
| 2019 | 0.87 | 97.58% | 0.02 | 1.76% | 0.01 | 0.67% | 0.00 | 0.00% |
| 2020 | 1.02 | 94.02% | 0.04 | 3.75% | 0.02 | 1.57% | 0.01 | 0.66% |
Publisher’s Note: MDPI stays neutral with regard to jurisdictional claims in published maps and institutional affiliations. |
© 2022 by the authors. Licensee MDPI, Basel, Switzerland. This article is an open access article distributed under the terms and conditions of the Creative Commons Attribution (CC BY) license (https://creativecommons.org/licenses/by/4.0/).
Share and Cite
MDPI and ACS Style
Yang, F.; Xu, J.; Zhao, X.; Wang, X.; Xiong, Y. Assessment of the Grassland Ecological Compensation Policy (GECP) in Qinghai, China. Agriculture 2022, 12, 1479. https://doi.org/10.3390/agriculture12091479
AMA Style
Yang F, Xu J, Zhao X, Wang X, Xiong Y. Assessment of the Grassland Ecological Compensation Policy (GECP) in Qinghai, China. Agriculture. 2022; 12(9):1479. https://doi.org/10.3390/agriculture12091479
Chicago/Turabian StyleYang, Fuyu, Jingjing Xu, Xin Zhao, Xuekai Wang, and Yi Xiong. 2022. "Assessment of the Grassland Ecological Compensation Policy (GECP) in Qinghai, China" Agriculture 12, no. 9: 1479. https://doi.org/10.3390/agriculture12091479
Note that from the first issue of 2016, this journal uses article numbers instead of page numbers. See further details here.