Article

Environmental Assessment of Underdrain Designs for Granular Media Filters in Drip Irrigation Systems

by
Joan Pujol
1,*,
Francesc X. Espinach
2,
Miquel Duran-Ros
1,
Gerard Arbat
1,
Toni Pujol
3,
Francisco Ramírez de Cartagena
1 and
Jaume Puig-Bargués
1
1
Department of Chemical and Agricultural Engineering and Technology, University of Girona, C/Maria Aurèlia Capmany 61, 17003 Girona, Spain
2
Design, Development and Product Innovation, Department of Organization, Business, University of Girona, 17071 Girona, Spain
3
Department of Mechanical Engineering and Industrial Construction, University of Girona, C/Universitat de Girona 4, 17003 Girona, Spain
*
Author to whom correspondence should be addressed.
Agriculture 2022, 12(6), 810; https://doi.org/10.3390/agriculture12060810
Submission received: 12 May 2022 / Revised: 31 May 2022 / Accepted: 1 June 2022 / Published: 3 June 2022

Abstract

:
Irrigation is very important for global food production and, therefore, it is key to moving towards increasingly sustainable irrigation systems. However, the adoption of more efficient water-use techniques, such as drip irrigation, increases energy consumption. A large part of the efficiency of drip irrigation systems depends on the equipment used, such as filters. The environmental impact of three media filters (a prototype with a porous media underdrain and two commercial filters, with inserted domes and collector arms underdrains, respectively) with different bed heights, filtration rates, and medium materials was studied using the life cycle analysis (LCA). Under the operating conditions that minimize the impact, the inserted domes design has the lowest overall impact, achieving reductions of up to 432% and 18% in some impacts regarding the porous media and the collector arm, respectively. A porous media filter has a better energy performance, but its prototype status hinders it in the raw material, building, and end-of-life phases. Conversely, the arm collector has the worst environmental performance. This work shows that filter designs should prioritize solutions that allow for minimizing the energy consumption during their operation to increase its sustainability.

1. Introduction

Remarkable advances in water resource use for agriculture for coping with population growth and rising food demand have been obtained in the last 60 years. While the world’s population has grown from 2.5 billion in 1950 to its current figure of 7 billion, the irrigated area has doubled, and the water extraction has tripled. Irrigation is the world’s largest water user, accounting for about 70% of the total water consumed. Worldwide irrigated land accounts for about 20% of the total agricultural surface but produces 40% of total food production. However, the water use efficiency of most of the irrigation systems remains low. With increasing water use competition from other sectors, such as industry and urban uses, irrigation is under pressure to reduce its share of water use [1]. Conflicts for water use can rise especially in those areas with water scarcity and drought such as the Mediterranean basin. In this area, depending on the country, between 50% and 90% of the total water demand is used by irrigation, and is expected to increase by 18% at the end of the century [2], but freshwater availability is likely to decline by 2 to 15% due to a 2 °C increase in global temperature caused by climate change [3].
A common strategy for increasing water use efficiency is replacing surface irrigation with drip irrigation. This approach has been prioritized by irrigation modernization policies adopted in different countries [4]. For instance, in Spain the area using drip irrigation increased by 26.4% from 2010 to 2020, reaching 52.8% of the irrigated area in 2020 [5]. This reduced overall irrigation water consumption in Spain between 2010 and 2018 by 3.9% [6]. In addition to water consumption, energy consumption must be considered because irrigation is the main energy consumer in agricultural systems [7]. In this sense, energy accounts for approximately 40% of the costs of the operation and maintenance of irrigation equipment [8]. Therefore, in drip irrigation systems, both the improvement of water and energy use efficiency should be considered [9]. However, when assessing water resources, not only the quantitative consumption of water is important, but also the effects on its quality [10] such as eutrophication, acidification, and ecotoxicity. Thus, the assessment of irrigation sustainability is key, especially in those areas where rainfall is scarce and/or irregular.
Life cycle assessment (LCA) is a standard method used to analyze the environmental sustainability of a process or system throughout its life cycle [11] and plays an important role in the environmental assessment of water use efficiency measures [12]. This is the reason why a lot of LCA focused work research has been carried out on irrigation systems, with very different approaches. For instance, some recent works compare alternative irrigation systems for rice using LCA. Thus, Shew et al. [13] assessed traditional cascade flooded and alternative multiple inlet irrigation; Leon et al. [14] analyzed the mitigation of methane emissions of the alternate wetting and drying compared with conventional rice irrigation; and Zoli et al. [15] studied the environmental benefits related to the adoption of an alternative water management characterized by an additional aeration period during stem elongation. On the other hand, Parada et al. [16] and Martín-Górriz et al. [17] focused on greenhouse tomato production (the first analyzed different fertigation management practices, while the second studied different effluent management systems); Canaj et al. [18], Maeseele and Roux [19], and Kalboussi et al. [20] studied the use of reclaimed effluents (the first was a case study for agricultural irrigation in Italy; the second reviewed 30 LCA case studies of wastewater reuse for different uses, including irrigation; and Kalboussi et al. developed an LCA-based tool that supports the selection of reclaimed effluents for irrigation in different scenarios considering three parameters: tertiary treatment technologies, availability of conventional water sources, and energy mix composition); Gao et al. [21] conducted a comparative analysis of different irrigation systems in maize cultivation in China; and Chen et al. [22] studied the impact of 60 irrigation projects in northern China.
In those cases in which sprinkler irrigation is replaced by drip irrigation, eco-efficiency is increased by improving water use efficiency [23] and reducing energy consumption [24]. Romero-Gámez et al. [25], who used LCA to analyze the sustainability of leaf crops, concluded that reducing the environmental impact of irrigation equipment should be a priority. However, most LCA applied in irrigation, e.g., [26,27,28] only considers pumps and pipes without including the filters. This is a critical omission since filters ensure the long-term performance of drip irrigation systems [29] and therefore increase their sustainability. Parada et al. [16] and Martín-Górriz et al. [17] considered the filters in their studies but they were included in the irrigation equipment as a whole and did not analyze their specific effect.
Filtration is a key operation for the successful operation of drip irrigation systems since it prevents emitter clogging, which is still the main drawback of this irrigation technique. Sand media filters offer the best performance, especially when low-quality irrigation water is used [29,30]. However, the pressure drops, and therefore the energy consumption related, across the media filters are not negligible. The pressure drops are mainly caused by the two main auxiliary elements of these filters, i.e., the inlet diffuser plate [31] and the underdrain [32]. Various studies have analyzed the performance of different underdrain designs. Mesquita et al. [32] studied the effects of the internal auxiliary elements (the diffuser plate and the underdrains) and its interaction to sand particle size and media bed depth on the head loss as a function of the water flow velocity at clean water conditions. Arbat et al. [33] developed an analytical equation to compute the total pressure drop in a sand filter taking into account the pressure drop in the underdrain and validated this equation experimentally. Pujol et al. [34] analyzed the effect of four nozzle geometries on the pressure drop of a sand filter, first experimentally and then with an analytical model. Arbat et al. [35], Bové et al. [36], and Pujol et al. [37] used computational fluid dynamics (CFD) to study the hydraulic performance of different underdrain designs and pointed out that the flow uniformity through the filter was crucial to achieve low pressure drop values. Bové et al. [38] also used CFD to assess the performance of a new underdrain design, which achieved higher energy and water use efficiencies. Although the environmental impact of sand filters must be calculated for a full assessment of their performance, this aspect has not been considered in the previous studies, as the focus has been on reducing the pressure drop in the filter.
To the best of our knowledge, LCA has hardly ever been used to consider the sustainability issues when comparing filters for drip irrigation systems. An exception would be Bové et al. [9], who used an LCA approach in a theoretical study, i.e., without experimental data, to evaluate different design alternatives for drip irrigation sand filters from an environmental perspective. The result of this study suggested a potential alternative underdrain design for a granular media filter, which was different from commercially available underdrains. Considering this previous work as the starting point, the main purpose of the present paper is to assess the environmental performance of three media filters for drip irrigation systems with different underdrain designs (arm collector and inserted domes, which are both commercially available, and the prototype issued by Bové et al. [38]) working with different media bed height, filtration velocity, and type of filter media material.

2. Materials and Methods
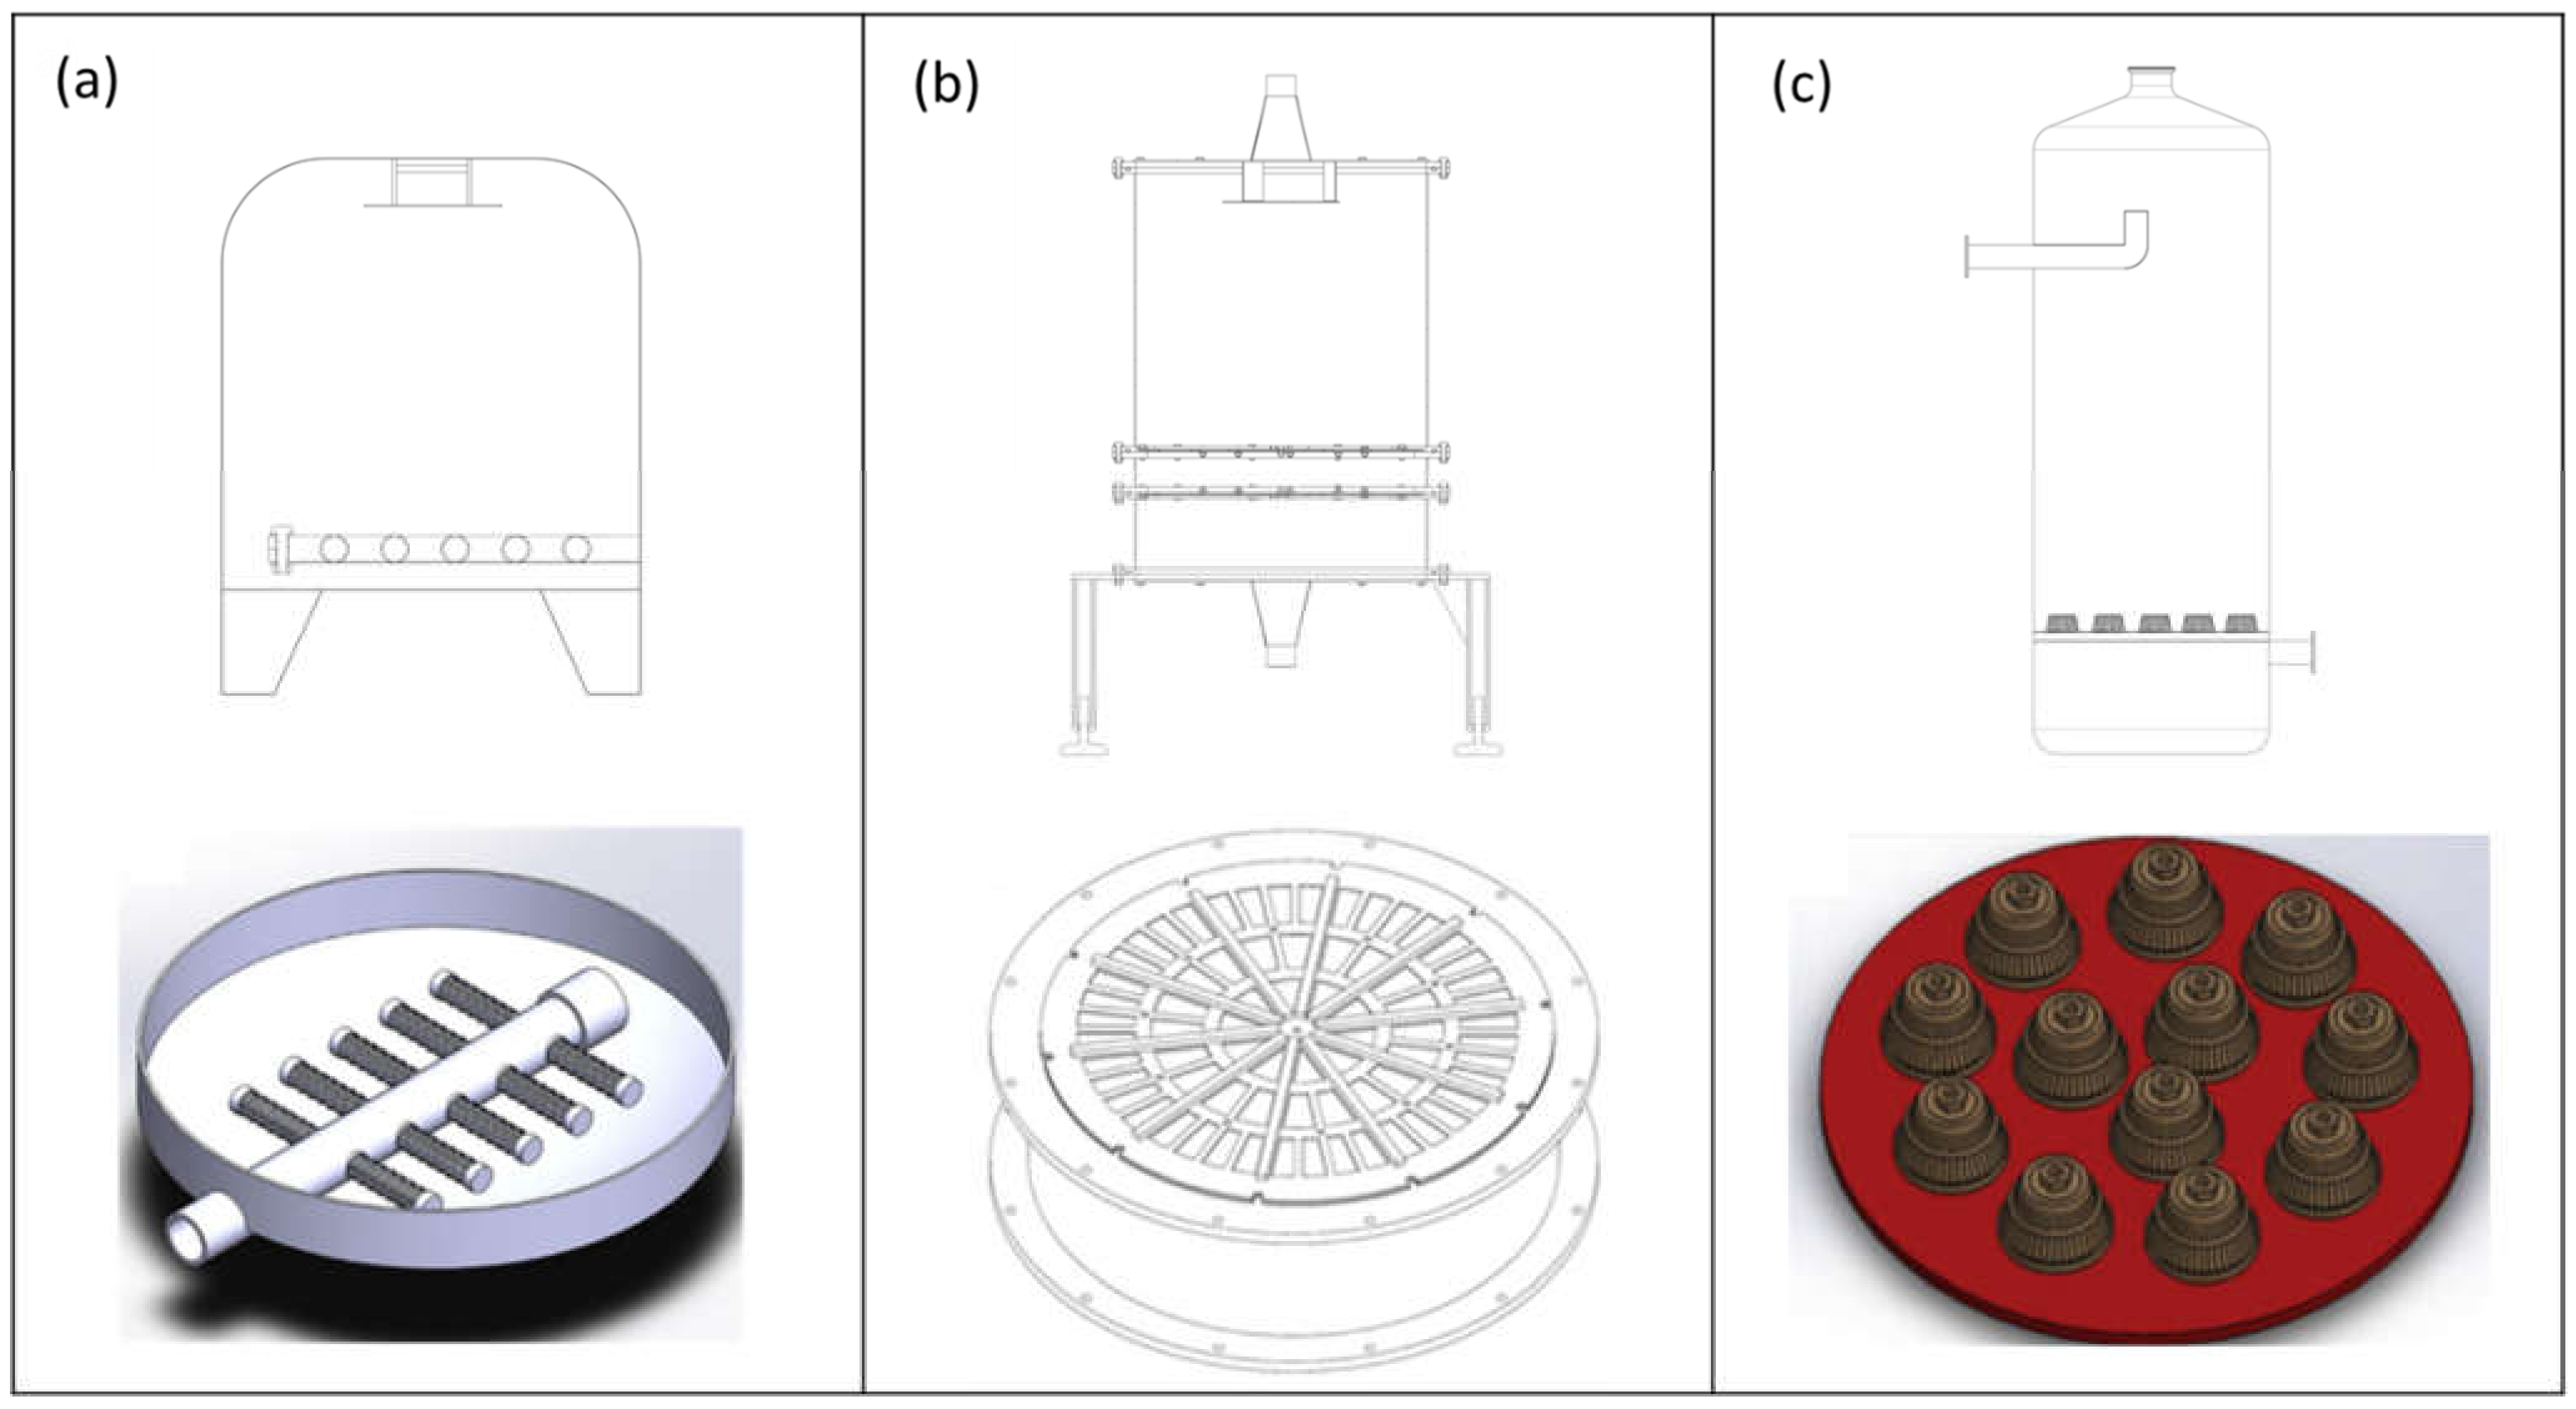
2.1. Filters

In the experimental irrigation system, three different media filters were used, all of which had a similar filter body diameter (about 0.5 m) (Figure 1). The first one was a filter model FA1M (Lama, Gelves, Spain), whose underdrain consisted of 7 pieces with slots that overlapped each other by forming striated tubes converging in a central tube which worked as a manifold, with a total of 10 striated tubes (5 tubes on each side of the manifold). The second one was the prototype filter built with an underdrain designed by Bové et al. [38], which consisted of a cylinder that occupied the entire filtration surface of the filter. This cylinder was confined by two 0.75 mm meshes, one at the top and one at the bottom, and was filled with silica sand sieved to 0.75–0.85 mm grain size. The third one was the filter model FA-F2-188 (Regaber, Parets del Vallès, Spain), whose underdrain consisted of 12 pyramidal-shaped domes mounted on a manifold and inserted in a backplate.
All the designs had a steel housing, where the inlet and outlet water pipes were inserted, and two access ports, one vertical located at the top of the filter and the other horizontal located at the bottom. Both access ports were sealed with 3 mm thick nitrile butadiene rubber (NBR) covers. Table 1 shows the main characteristics of the different sand filters used.
Two different materials were used as a filter bed. The first one was CA-07MS silica sand (Sibelco Minerales, Bilbao, Spain) with an effective diameter (D10, size opening which passes 10% by dry weight of the filter material) of 0.48 mm, a uniformity coefficient (ratio of the size opening which passes 60% of the sand through the size opening which passes 10% through) of 1.73, and a porosity (fraction of the volume of voids over the total medium volume, which was determined following Bové et al. [40] with the ratio between the bulk and real densities experimentally measured) of 0.39. The second medium was NW2 recycled glass (Nature Works Tecnologías, L’Alfàs del Pi, Spain) with an effective diameter D10 of 0.44 mm, a uniformity coefficient of 1.59, and a porosity of 0.54.
Each one of the three filters and bed material were tested for 250 h under the same experimental conditions: 2 bed heights (0.2 and 0.3 m), and 2 filtration velocities (30 and 60 m/h), which yielded a total of 24 filtration scenarios. Experiments with silica sand took place between March and November 2018, and those with recycled glass from June 2019 to March 2020. Filtration runs were carried out using a reclaimed effluent and lasted until total pressure loss reached 50 kPa when filters were backwashed [39]. A DMED300T2 energy meter (Lovato Electric, Gorle, Italy) allowed the determination of the electrical energy consumption of the pump with each combination of media material, bed height, filtration velocity, and filter design. This information was recorded in a supervisory control and data acquisition (SCADA) system previously developed [41]. Those cycles which did not reach a 50 kPa head loss or those for which some recorded data were not valid for the whole cycle (e.g., due to maintenance, calibrating processes, scaled-down sensors, lower nominal filtration flow, or forced backwashing issues) were discarded for data treatment. Thus, the number of filtration cycles for each experimental condition is shown in Table 2.

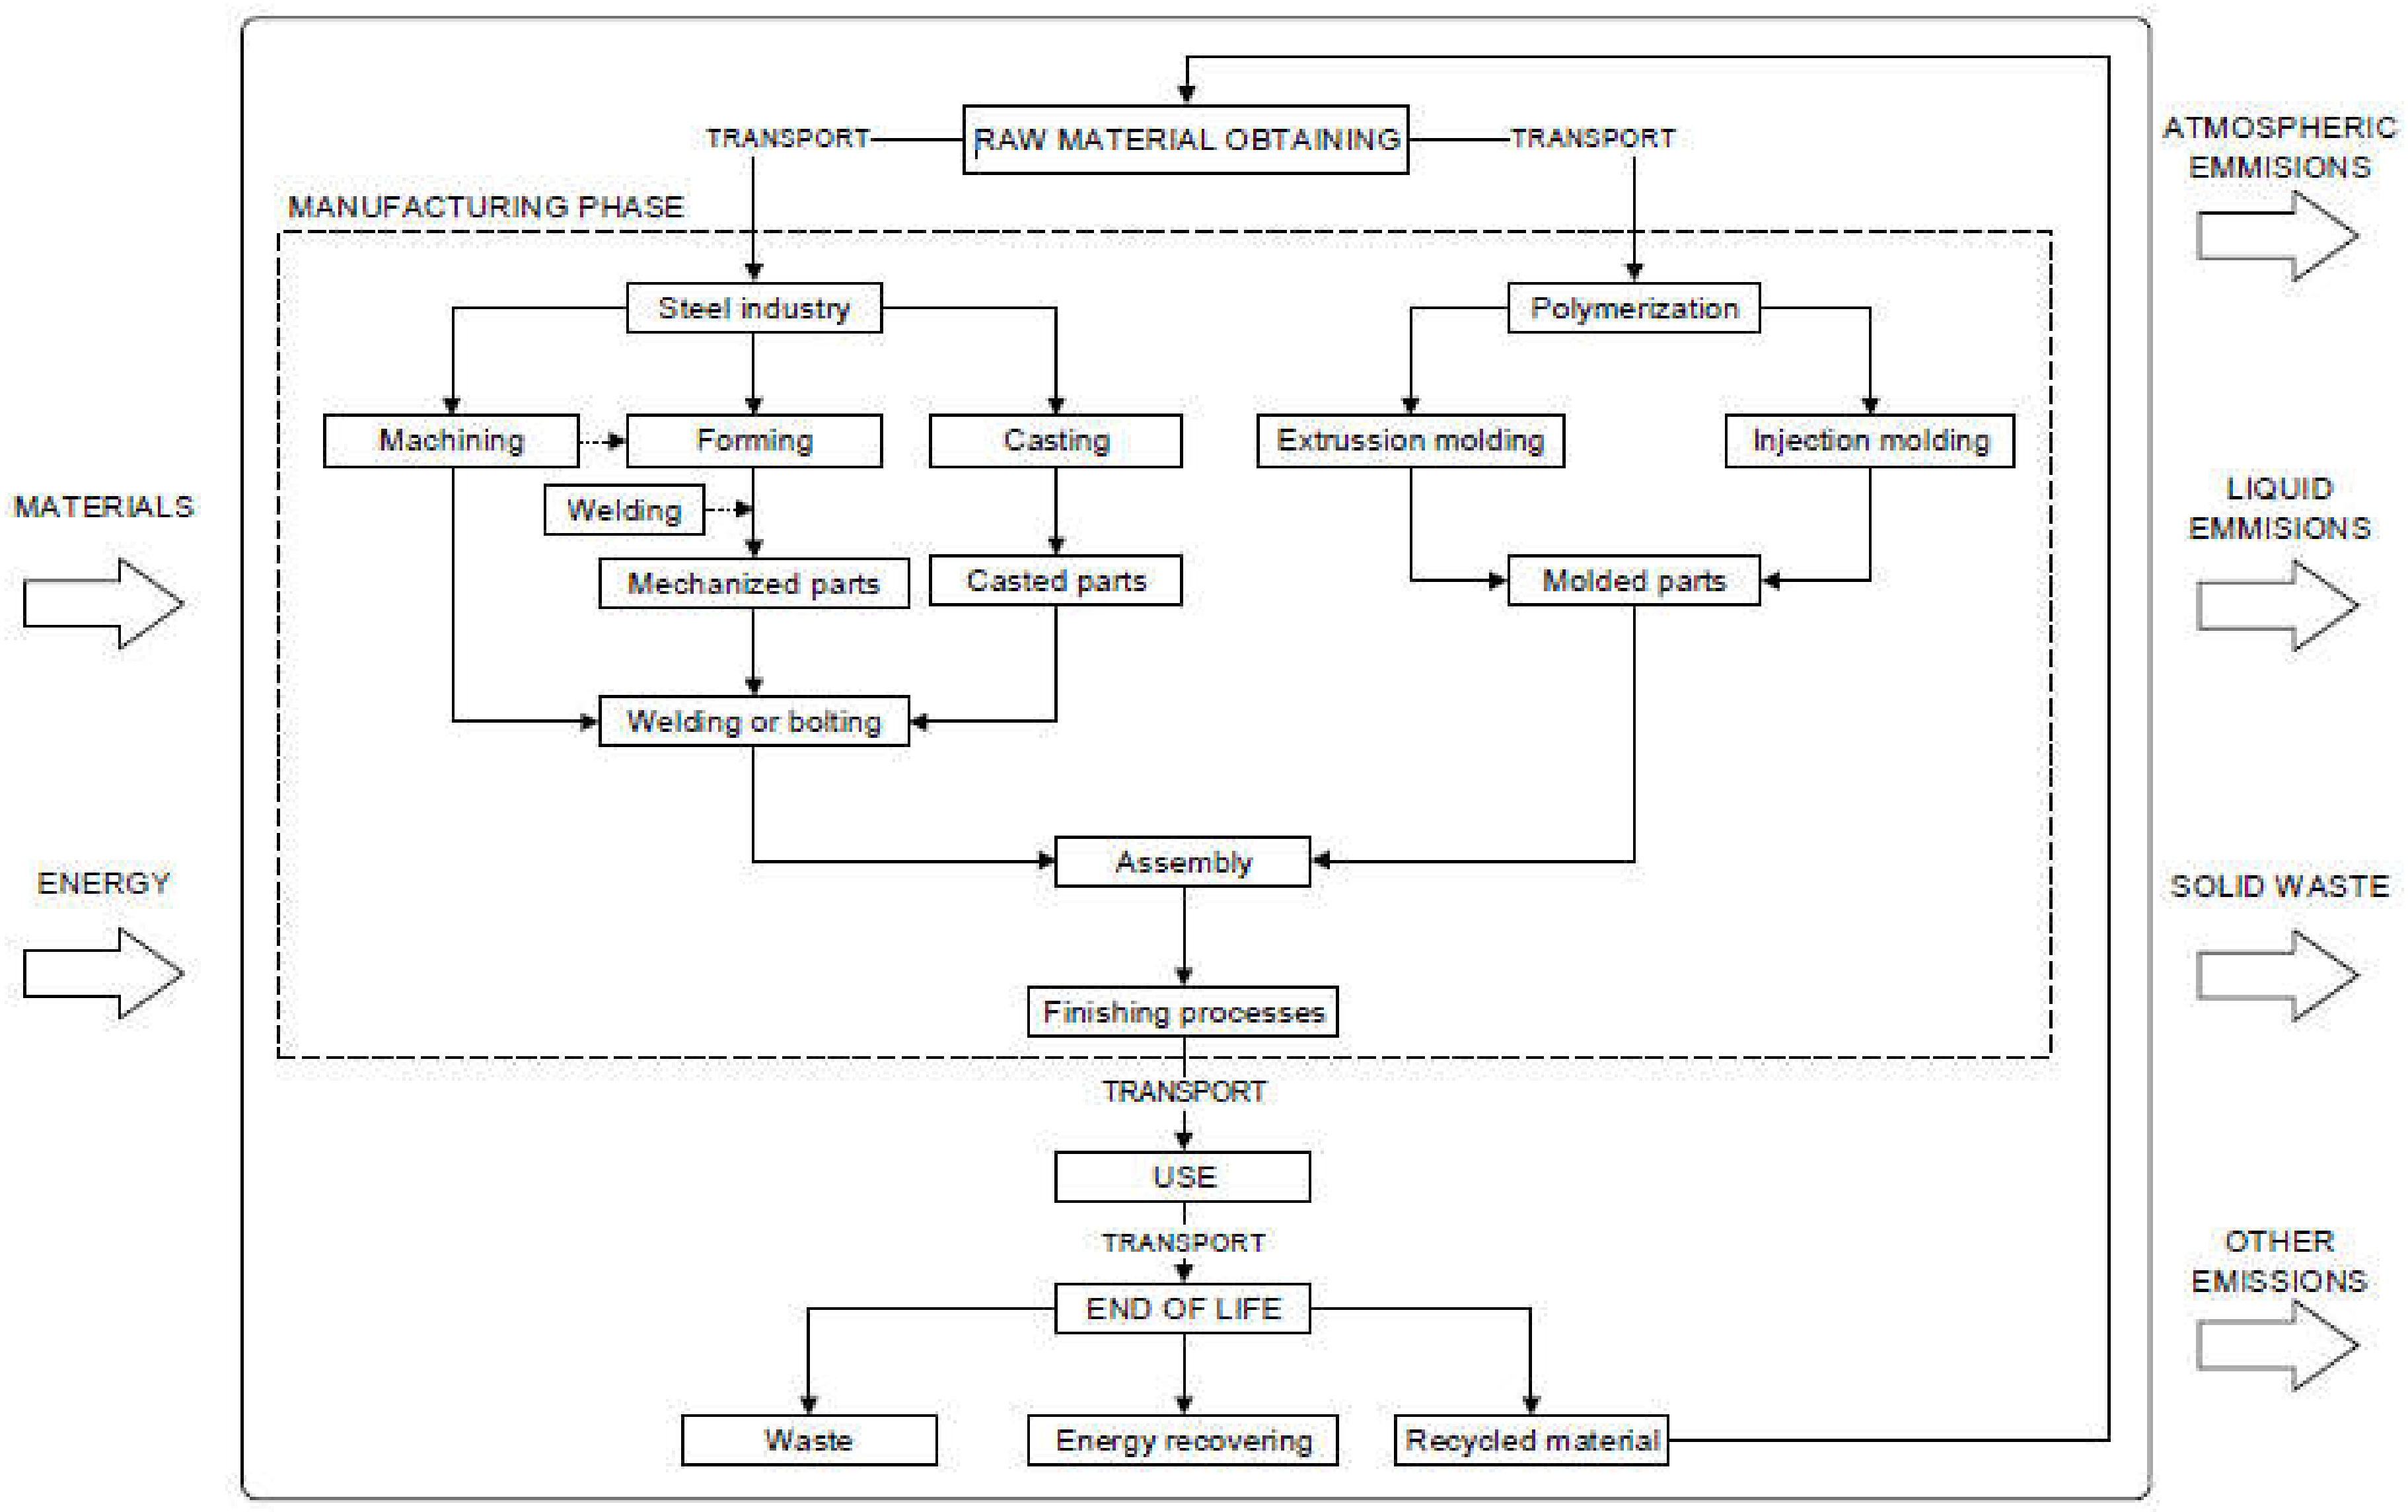
2.2. Approach to Life Cycle Assessment, Functional Unit, and Scope

A cradle-to-grave LCA was used to assess the environmental performance of each filter design. Cradle-to-grave is the complete LCA from resource extraction (“cradle”) to the use and disposal phases (“grave”). The analysis followed the procedure recommended by ISO 14044 (2006), i.e., the definition of the purpose and scope of the study, life cycle inventory, evaluation, and interpretation of impact.
The functional unit is the unit in which all the inputs and outputs of the system are referred to. To define the functional unit in this study we started with the following hypothesis. The working flow of the filters was between 5 and 20 m3/h. The flow rate was chosen at a velocity of 60 m/h, which was 11.78 m3/h. We assumed that each year the filter would be used to irrigate for 8 h every 2 days for 4 months and that the lifespan of the filter was 15 years. In this case, the filter would filter 84,672 m3 of water over its lifetime. In this study, the functional unit is defined as “the use of a filter to filter 84,672 m3 of water.” When performing the calculations, it was considered that the inserted dome filter had a slightly larger diameter (50.8 cm), as well as scenarios that used a lower filtration velocity (30 m/h) would require twice the irrigation time to provide the same water volume.
The typical phases of the filter life cycle are summarized in Figure 2. They were simplified as raw material obtainment, filter manufacturing, transport, use, and end-of-life phases. The first phase analyzed the obtainment of the raw materials that entered the following phases; these materials came from mining or recycling plants. The manufacturing phase included all the necessary processes to obtain a ready-to-use filter, taking into consideration the manufacture of the components and the complete filter, in addition to the auxiliary operations. For the use phase, the energy consumption during the functional life of the filter was considered, as well as the periodic renewal of the filter bed. However, filter backwashing water was not considered. According to previous studies [29,42,43], the volume of water used to backwash the filter using reclaimed effluent ranged between 1.14 and 5.7% of the filtered effluent volume and, therefore, it should have little effect on results. The end-of-life phase included the recovery of material and energy and/or the landfilling of the filter parts at their end of life. The end-of-life impact of the media bed was not considered, as the replaced sand can be used as filler material on the same farm without any associated environmental impact. Recycled glass was used so as to avoid having to account for its impact twice. Transport was considered a single phase, but it was needed in all phases to move raw material to manufacture, take components from manufacturing to assembly, move finished filters from assembly to point of use, and from point of use to a recycling/waste center. These processes are further detailed in Section 2.3.
Despite this initial grouping of phases, two major groups of elements were considered for analyzing the results: the use phase and the manufacturing and end-of-life phases (which would include the other phases). This allow separating the impacts related to use, which will vary depending on the intensity of use of the filter; and the rest, which will generate fixed impacts that are independent of the filtration time.
Simapro 9.1.1.7 (PRé Sustainability, 2020, Amersfoort, The Netherlands), a widely used LCA software tool, was used to perform the LCA.

2.3. Life Cycle Inventory

For the assembly of an inventory, a mass and energy balance of the input (consumption) and output (emissions) system was performed, assuming that the process was located in Europe.
Two types of materials (metals and polymers) are used in the manufacture of the filters. The polymeric materials (polypropylene and NBR) were transformed by injection or extrusion to obtain parts such as domes and tubes. The NBR was also used to make joints. In the injection process, a yield of 95% by weight of useful material was considered with the consumed one. Extrusion losses were considered negligible.
Metals (steel and stainless steel) have always been subjected to more than one process. There are two major groups: machining and shaping, and foundry. For the machined parts, it was considered appropriate to start from an area of the laminated sheet of the proper thickness and size to minimize the loss of material to machine the piece. Machining processes included shear cutting, laser cutting, turning, drilling, threading, and punching. Forming processes include folding, surfacing, drawing, wiredrawing, forging, and bending. As for the forming, the pieces were made of gravity-filled sand mold. The process that generated the most surplus material was cutting and punching, as it started from pieces of sheet metal with a rectangular shape and with the minimum sizes that allowed the whole piece to be included inside (bounding box). The difference between the weight and the weight of the piece was surplus material. In the case of turning, drilling, and threading the loss of material coincides with the volume machined in each piece. Forming processes did not suffer from material loss. For the foundry, an additional 20% of the material was considered necessary with respect to the weight of the piece, which corresponded to the bale and the feeding ducts.
Some parts included a welding process (either in the manufacture of an individual part or in the final assembly of the filter). The steel filters (those with inserted domes and arm collector underdrains) were finished with a cleaning and painting process.
Regarding the transport, distances of 900 km by truck (from the factory to distributor warehouse) and 50 km by van (from distributor to customer) were considered. These were estimated values, but they were the same for all the analyzed filters and, therefore, the relative importance of transportation would not be a critical parameter when comparing the different filters. Other transport, such as those corresponding to the phase of extraction and preparation for the use of raw materials, were not considered specific processes, but they were included in the information related to raw materials that was obtained from databases.
Emissions during the use phase were calculated from experimentally measured data of electrical energy consumption.
Another entry for the use phase was the mass of the media bed used per filtered volume. According to the instructions of the filter manufacturer [43], the lifespan of the media was considered to be 1000 h. Therefore, based on the calculation of the operation time required to achieve the functional unit, the number of times the bed had to be changed was determined (15, once rounded), as well as the media amount needed in each of the scenarios considered.
At the end of the filter lifespan, three major groups of materials used in the manufacture of the filter were considered: metals (steel or stainless steel), plastics (polypropylene), and NBR. The final destination of the materials at the end of their functional life was estimated from statistical data at the European level (Table 3).
All data for which a different source (experimental or bibliographic) which is not specified was obtained from the Ecoinvent 3 database [47], using the allocation of point of substitution approach, included in the Simapro software.

2.4. Life Cycle Impact Assessment

ReCiPe 2016 Midpoint (H) V1.04 [48] was the selected methodology to perform the impact assessment. The ReCiPe provides a harmonized implementation of cause-effect pathways for the calculation of both midpoint and endpoint characterization factors [49]. This procedure, applied at the midpoint level allows assessment of the following impacts: global warming, stratospheric ozone depletion, ionizing radiation, ozone formation (human health), fine particulate matter formation, ozone formation (terrestrial ecosystems), terrestrial acidification, freshwater eutrophication, marine eutrophication, terrestrial ecotoxicity, freshwater ecotoxicity, marine ecotoxicity, human carcinogenic toxicity, human non-carcinogenic toxicity, land use, mineral resource scarcity, fossil resource scarcity, and water consumption.
The impact on water consumption was not assessed since backwashing water was not taken into account.
These impact categories were analyzed at two levels: for the whole life cycle, and also specifically for the use phase. This allowed distinguishing between the impacts related to the use, which will vary depending on the intensity of use of the filter, and the rest, which will generate fixed impacts, independent of the filter operation time.

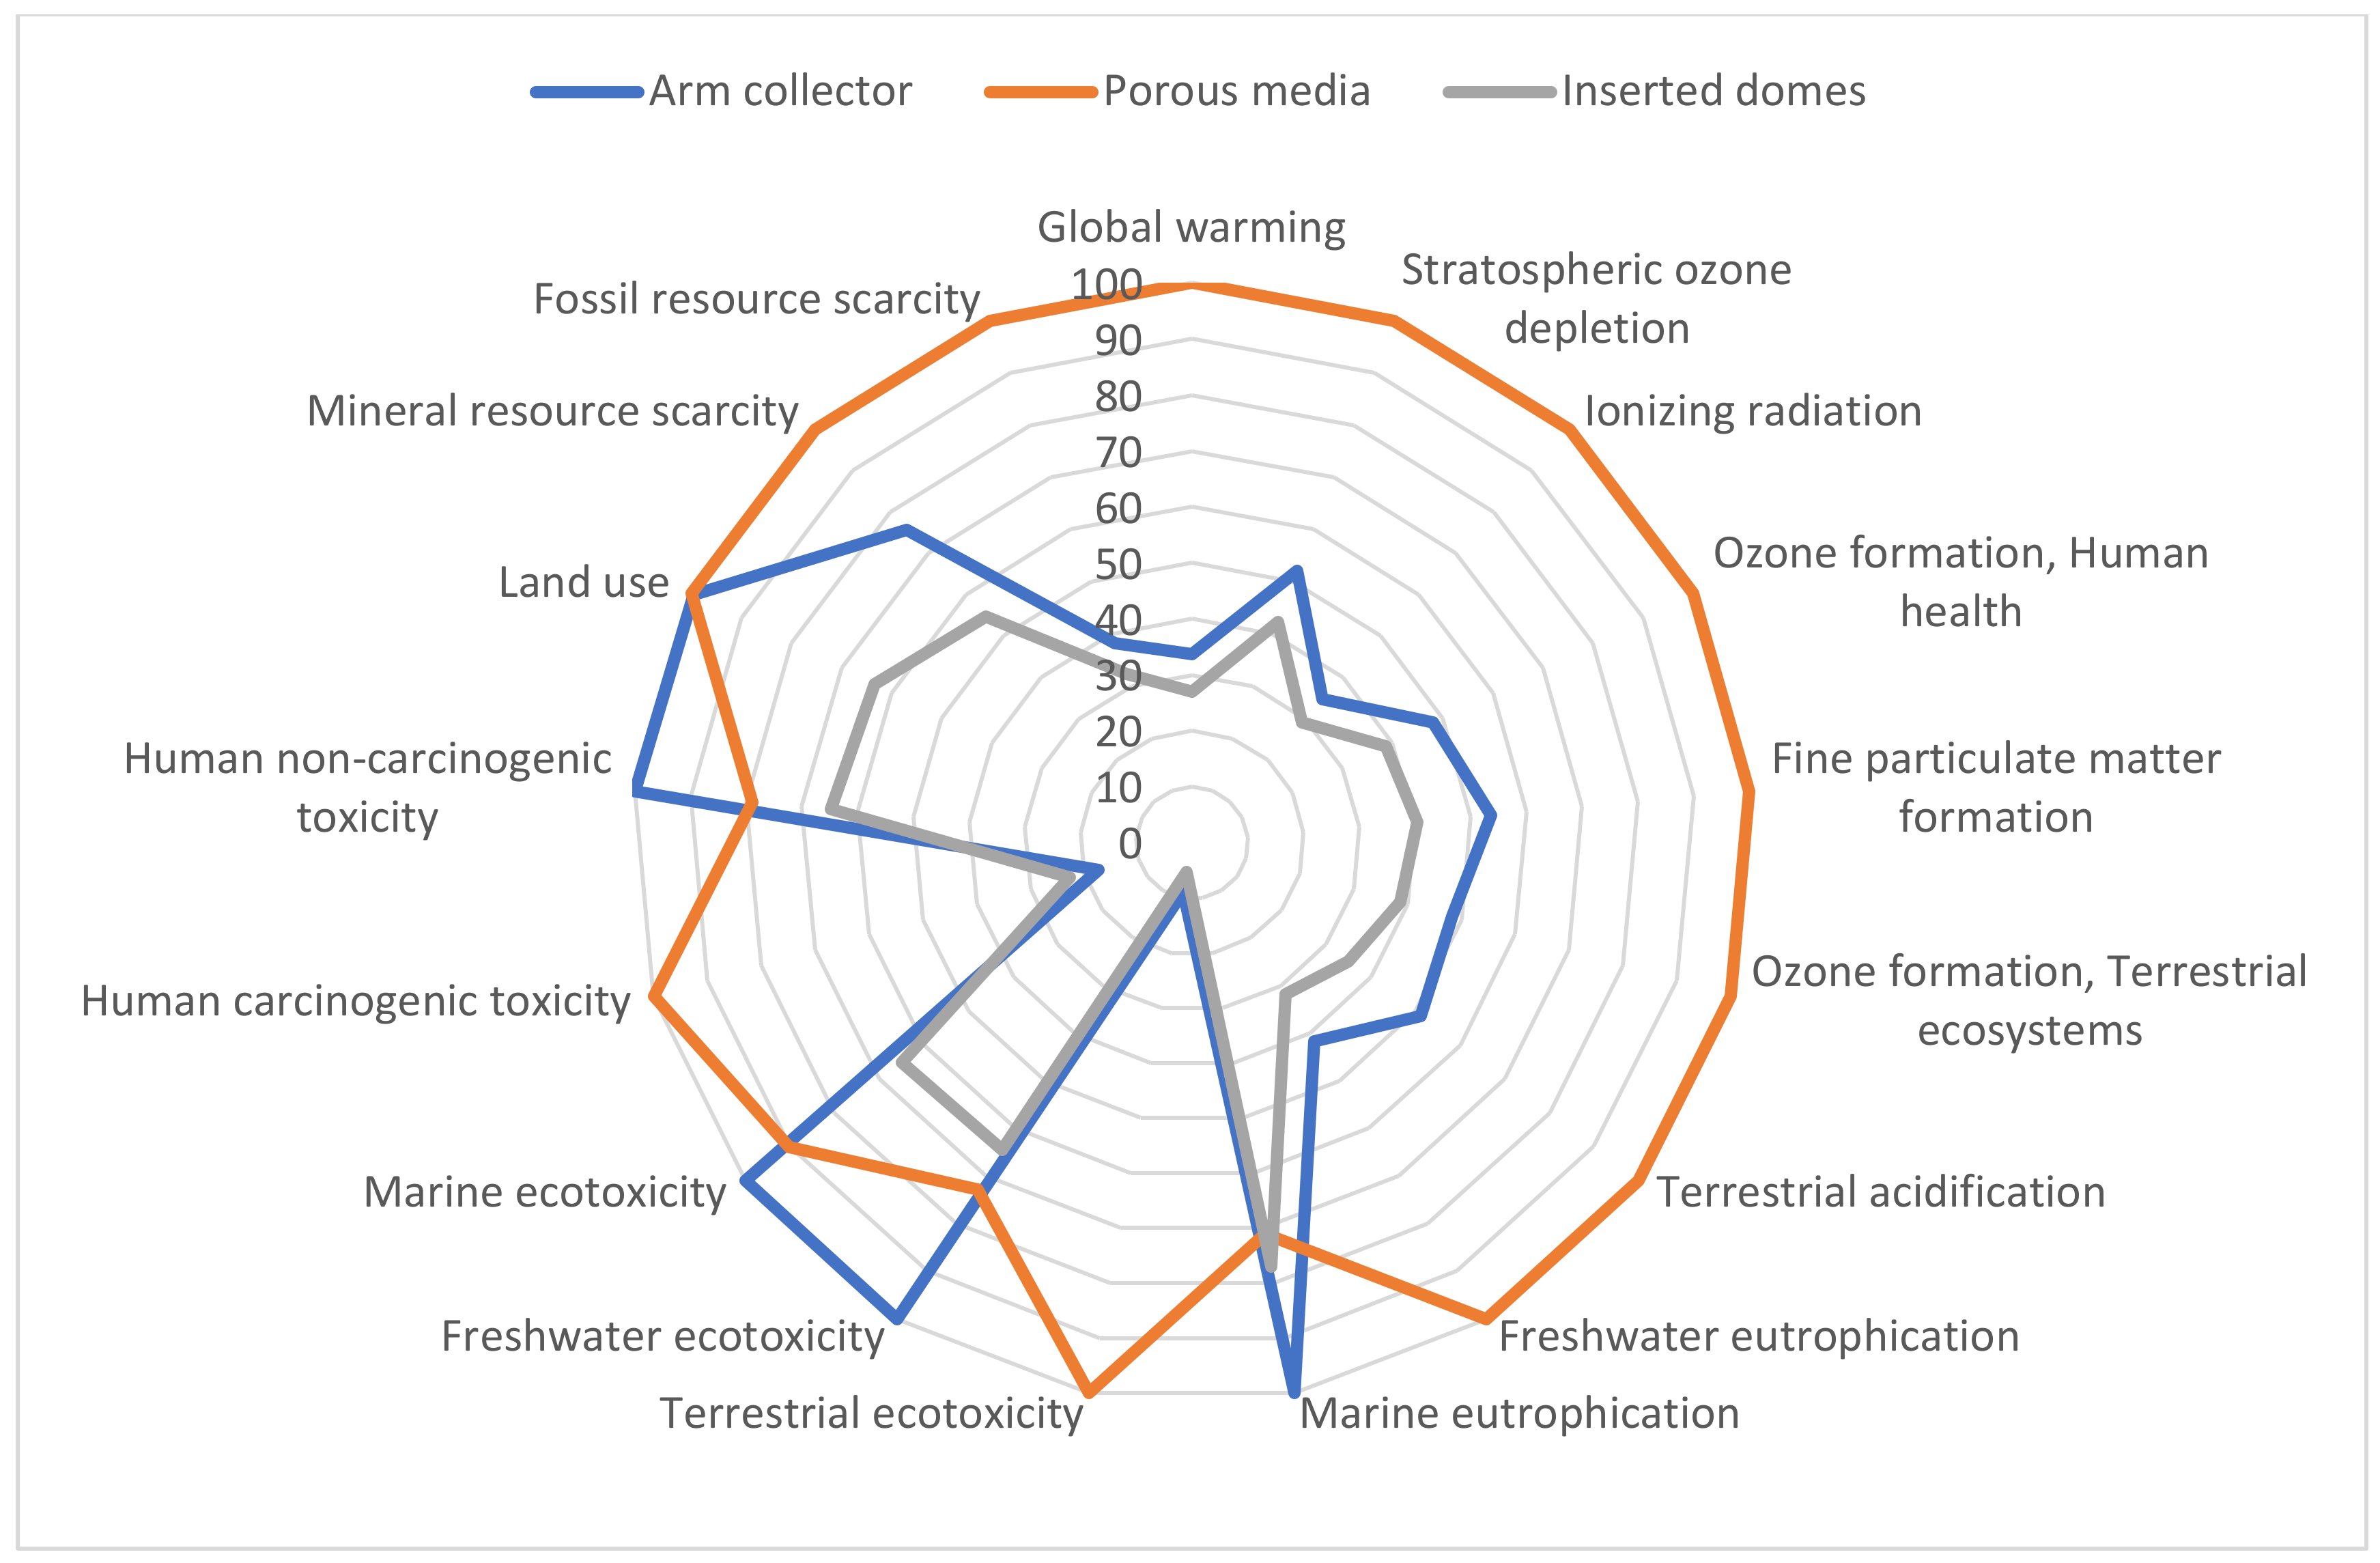
3. Results and Discussion

The experimental results for the electrical energy consumption per filtered volume for each combination of filter type, bed material, and filtration velocity are shown in Table 2.
The results of the impacts related to the functional unit for each scenario are shown in Table 4.
For a given filter type, the scenario of the minimum impact was the same (ARM-3, POR-1, and DOM-3, respectively) for all the impact indicators. A bed height of 0.2 m caused the minimum impacts for all three filter types, while a 60 m/h filtration velocity yielded the minimum environmental impacts for ARM-3 and DOM-3 and 30 m/h for POR-1.
The lower environmental impact achieved using sand as a filter bed compared to recycled glass was because, although in neither of them the impact at the end of its lifespan (see starting hypothesis in Section 2.2) was considered, the preparation of glass for being reused (which involved a crushing process) needs more energy consumption than sand obtainment. On the other hand, it makes sense that those working conditions that require less filtration bed (i.e., less bed height) have a reduced associated impact since the amount of material is lower.
The scenario with the lowest impact, considering the three filter types, was DOM-3 for most of the indices. If the optimal combination of operating conditions for each filter is compared with the overall optimal (DOM-3), the choice of porous media filter increased between 1.3 and 423% the different impacts, with the exception of marine eutrophication, which was reduced by 1.2%. Compared to DOM-3, the arm collector filter increased the different impact categories between 1.6 and 18.1%, except for human carcinogenic toxicity, which was decreased by 10.2%.
DOM-3 scenario did not yield the minimum impact value in only two categories: human carcinogenic toxicity and marine eutrophication. The main factor involved in human carcinogenic toxicity is electricity consumption. The equipment used for generating electricity, including that of renewable energies such as photovoltaic solar, requires large amounts of steel. The steel needs Chromium VI for its production, which has a human carcinogenic impact [50]. However, the specific difference between ARM-3 and DOM-3 is due to the use of more steel sheets for building the filter in DOM-3. The electricity consumption was also the main factor that contributed to marine eutrophication, but the differences observed between POR-1 and DOM-3 were caused by the different manufacturing processes, namely in the replacement of steel foundry of DOM-3 with a carved laminated sheet in POR-1 for the upper filter cover. However, the differences in this impact between these two scenarios were very small.
The worst working condition for each filter (ARM-5, POR-8, and DOM-4), when compared with the overall optimum (DOM-3), showed increases between 1.6% (for human carcinogenic toxicity) and 34.1% (terrestrial ecotoxicity) for the arm collector underdrain; between 8.1% (marine eutrophication) and 432% (terrestrial ecotoxicity) for porous media; and between 5.0% (human carcinogenic toxicity) and 9.5% (ionizing radiation) for the inserted domes. The highest increases in the impact of terrestrial ecotoxicity are explained by the higher consumption of stainless steel for manufacturing POR-8. However, electrical consumption is also higher with POR-8 than with DOM-3. Thus, this impact is penalized with POR-8 for its energy consumption as well as for its raw material needs.
The differences between the use phase and the rest were also considered Figure 3 shows the impacts once the use phase was excluded. This case was identified as “Extended manufacturing phase”, which includes raw materials, manufacturing, and lifespan.
If the impacts shown in Figure 3 are compared with those in Table 4, then as the extended manufacturing phase only happens one time in 15 years, it has little importance regarding the use phase. When the use phase is not considered, the only impacts that account for more than 20% are terrestrial ecotoxicity, human carcinogenic toxicity, and mineral resource scarcity. With the porous media filter, global warming, freshwater eutrophication, and fossil resource impacts were also higher than 20%.
The porous media filter had the highest impact of the three filters assessed in the manufacturing phase due to the more artisanal manufacturing process typical of a prototype than on the specific design of this filter. The manufacture of this filter needed more material than a serial manufacturing process at the industrial level. If this filter went to industrial production, it is expected that environmental impacts would be reduced and more similar to the other commercial filters. When the two commercial filters (inserted domes and arm collector) are compared, the arm collector filter showed impacts that were 23% lower (for human carcinogenic toxicity) and 66% higher (for terrestrial ecotoxicity) than the inserted domes filter. In fact, the average for all the impacts was 33% higher for the arm collector than the inserted domes filter. As an example, for terrestrial ecotoxicity, the most relevant contributions came from casting and the use of rolled steel.
Overall, the importance of the impacts produced by the other phases are smaller than the use phase, with the previously highlighted exceptions.
The results of the use phase show that, for a given filter, the scenario with the minimum environmental impact is the same for all the impact indices, without any exception: ARM-3, POR-1, and DOM-3, with POR-1 and DOM-3 presenting the lowest absolute values, with few differences between them. Considering that the use phase needs energy and bed material, when these consumptions were analyzed, the values shown in Table 5 were obtained.
If the results shown in Table 4 are compared to those of the impacts in the use phase, it can be seen that energy consumption during the filter use is more important than the amount of bed material when determining those conditions that minimize the environmental impact. The conditions for lower energy consumption are the same, for each underdrain design as those that achieved the minimum total impact as commented previously. On the other hand, the conditions with less bed material consumption were, for all the filters, scenarios 3 and 7, which had the same working conditions, i.e., v = 60 m/h and H = 0.2 m.
Since, in the common practice, the use conditions can be very variable, the average energy consumption for each filter was computed for all the use conditions that were analyzed. Thus, the energy consumption of the arm collector underdrain was 10,815 kWh, for porous media 10,212 kWh, and the inserted domes 10,233 kWh. The differences between the latter two were small, but they were greater with the arm collector filter.
Bové et al. [9] compared the sustainability of porous media and inserted domes and concluded that the first one could have a more sustainable performance than the second one. They studied a hypothetical porous media since it was only designed at that stage and the LCA carried out was very simplified and was not based on an authentic manufacturing process, which is the case of the present work. The results of both pieces of work are not contradictory because the energy consumption of the porous media is good, but the analysis of the manufacturing process of a prototype filter, with a building process that does not promote material saving. However, the ease of manufacturing without specialized resources has penalized this filter in the phases of raw material, manufacturing, and end of life.
Finally, it should be pointed out that the analyzed impacts will have more relative importance for small farms than larger ones. According to Chen et al. [21] for irrigating a given surface, the need for auxiliary facilities such as pipes and filters is lower in large scale irrigation projects than in micro-projects.

4. Conclusions

The inserted domes underdrain shows the lowest environmental impact working in the optimal conditions. When compared with the most unfavorable scenarios, the inserted domes filter achieves 432% and 34% smaller environmental impacts than the porous media and arm collector, respectively. These results were observed for most of the impact categories that were analyzed.
The use phase is the most important for the environmental impacts, due to the filters have quite a long lifespan. The phases of raw material obtainment, manufacturing, and end of life show important differences between designs because the porous media underdrain is a handcrafted prototype, with more material consumption.
Energy consumption is key in the use phase. The best results according to its consumption were achieved with the porous media and inserted domes underdrain, each one with different use conditions. In both cases, the optimum bed height was 0.2 m, and in the case of the porous underdrain the best filtration velocity was 30 m/h, while with the inserted domes underdrain it was 60 m/h. To obtain conclusions closer to the great variability in use conditions that can be found during its implementation in a real farm, the average energy consumption under different conditions was calculated and it was observed that the porous media has the lowest consumption, saving 0.2% for inserted domes but a noticeable 5.9% with the arm collector filter.
The inserted domes filter achieved the best environmental performance. The porous media had a better energy consumption, but its conditions as a prototype worsened its performance in the phases of raw material, manufacturing, and end of life. If this filter was industrially manufactured, it has the potential for being as sustainable as the inserted domes one. In contrast, the arm collector had a worse environmental performance than the other two filters.
According to the present conclusions, future filter designs should prioritize solutions that allow for minimizing the energy consumption in the use phase to optimize its sustainability.

Author Contributions

Conceptualization, J.P.-B. and J.P.; methodology, J.P. and J.P.-B.; resources, investigation and validation, J.P., F.X.E., J.P.-B., M.D-R., G.A., T.P. and F.R.d.C.; formal analysis, J.P.; writing—original draft preparation, J.P. and J.P-B.; writing—review and editing, M.D.-R., G.A., T.P. and F.R.d.C.; supervision, J.P.-B. and F.R.d.C.; project administration, J.P-B.; funding acquisition, J.P.-B. All authors have read and agreed to the published version of the manuscript.

Funding

The authors would like to express their gratitude to the Spanish Research Agency and the European Regional Development Fund for their financial support through Grants AGL2015-63750-R and RTI2018-094798-B-100.

Institutional Review Board

Not applicable.

Data Availability Statement

The data presented in this study are available on request from the corresponding author.

Acknowledgments

The authors would like to express their gratitude to Faust Seculi Díaz (Department of Organization, Business Management and Product Design of the University of Girona) for the information regarding the industrial processes in the filter manufacturing. The authors would also like to thank the Municipality of Celrà for their help in carrying out this experiment. Nature Works Tecnologías is acknowledged for the kind donation of recycled glass media.

Conflicts of Interest

The authors declare no conflict of interest.

References

  1. FAO. Irrigation Management Factsheet (I4591E/1/04.15). Available online: https://www.fao.org/land-water/water/water-management/irrigation-management/en/ (accessed on 5 November 2021).
  2. United Nations Environment Programme/Mediterranean Action Plan; Plan Bleu. State of the Environment and Development in the Mediterranean; Technical Report; United Nations: Nairobi, Kenya, 2020. [Google Scholar]
  3. MedEEC Network. Risks Associated to Climate and Environmental Changes in the Mediterranean Region, a Preliminary Assessment by the Mediterranean Experts on Climate and Environmental Change (MedECC); Network Science-Policy Interface: Marseille, France, 2019. [Google Scholar]
  4. Tarjuelo, J.M.; Rodriguez-Diaz, J.A.; Abadía, R.; Camacho, E.; Rocamora, C.; Moreno, M.A. Efficient Water and Energy Use in Irrigation Modernization: Lessons from Spanish Case Studies. Agric. Water Manag. 2015, 162, 67–77. [Google Scholar] [CrossRef]
  5. MAPAMA. Survey on Crop Areas and Yields. Report about Irrigation in Spain; Spanish Ministry of Agriculture, Food and Environment: Madrid, Spain, 2020.
  6. INE (Spanish Statistics Institute). Survey on the Use of Water in the Agricultural Sector. Available online: https://www.ine.es/jaxiT3/Tabla.htm?tpx=48823 (accessed on 21 February 2022).
  7. Pelletier, N.; Audsley, E.; Brodt, S.; Garnett, T.; Henriksson, P.; Kendall, A.; Kramer, K.J.; Murphy, D.; Nemecek, T.; Troell, M. Energy Intensity of Agriculture and Food Systems. Annu. Rev. Environ. Resour. 2011, 36, 223–246. [Google Scholar] [CrossRef]
  8. Rodríguez-Díaz, J.A.; Pérez-Urrestarazu, L.; Camacho-Poyato, E.; Montesinos, P. The Paradox of Irrigation Scheme Modernization: More Efficient Water Use Linked to Higher Energy Demand|La Paradoja de La Modernización de Zonas Regables: Uso Más Eficiente Del Agua Vinculado Al Aumento de La Demanda Energética. Span. J. Agric. Res. 2011, 9, 1000–1008. [Google Scholar] [CrossRef] [Green Version]
  9. Bové, J.; Pujol, J.; Arbat, G.; Duran-Ros, M.; Ramírez de Cartagena, F.; Puig-Bargués, J. Environmental Assessment of Underdrain Designs for a Sand Media Filter. Biosyst. Eng. 2018, 167, 126–136. [Google Scholar] [CrossRef]
  10. Kowalczyk, Z.; Kuboń, M. Assessing the Impact of Water Use in Conventional and Organic Carrot Production in Poland. Sci. Rep. 2022, 12, 3522. [Google Scholar] [CrossRef]
  11. ISO. ISO 14040:2006—Environmental Management—Life Cycle Assessment—Principles and Framework; ISO (International Standards Organisation): Geneva, Switzerland, 2006. [Google Scholar]
  12. Notarnicola, B.; Sala, S.; Anton, A.; McLaren, S.J.; Saouter, E.; Sonesson, U. The Role of Life Cycle Assessment in Supporting Sustainable Agri-Food Systems: A Review of the Challenges. J. Clean. Prod. 2017, 140, 399–409. [Google Scholar] [CrossRef]
  13. Shew, A.M.; Nalley, L.L.; Durand-Morat, A.; Meredith, K.; Parajuli, R.; Thoma, G.; Henry, C.G. Holistically Valuing Public Investments in Agricultural Water Conservation. Agric. Water Manag. 2021, 252, 106900. [Google Scholar] [CrossRef]
  14. Leon, A.; Minamikawa, K.; Izumi, T.; Chiem, N.H. Estimating Impacts of Alternate Wetting and Drying on Greenhouse Gas Emissions from Early Wet Rice Production in a Full-Dike System in a Giang Province, Vietnam, through Life Cycle Assessment. J. Clean. Prod. 2021, 285, 125309. [Google Scholar] [CrossRef]
  15. Zoli, M.; Paleari, L.; Confalonieri, R.; Bacenetti, J. Setting-up of Different Water Managements as Mitigation Strategy of the Environmental Impact of Paddy Rice. Sci. Total Environ. 2021, 799, 149365. [Google Scholar] [CrossRef]
  16. Parada, F.; Gabarrell, X.; Rufí-Salís, M.; Arcas-Pilz, V.; Muñoz, P.; Villalba, G. Optimizing Irrigation in Urban Agriculture for Tomato Crops in Rooftop Greenhouses. Sci. Total Environ. 2021, 794, 148689. [Google Scholar] [CrossRef]
  17. Martin-Gorriz, B.; Maestre-Valero, J.F.; Gallego-Elvira, B.; Marín-Membrive, P.; Terrero, P.; Martínez-Alvarez, V. Recycling Drainage Effluents Using Reverse Osmosis Powered by Photovoltaic Solar Energy in Hydroponic Tomato Production: Environmental Footprint Analysis. J. Environ. Manag. 2021, 297, 113326. [Google Scholar] [CrossRef]
  18. Canaj, K.; Mehmeti, A.; Morrone, D.; Toma, P.; Todorović, M. Life Cycle-Based Evaluation of Environmental Impacts and External Costs of Treated Wastewater Reuse for Irrigation: A Case Study in Southern Italy. J. Clean. Prod. 2021, 293, 126142. [Google Scholar] [CrossRef]
  19. Maeseele, C.; Roux, P. An LCA Framework to Assess Environmental Efficiency of Water Reuse: Application to Contrasted Locations for Wastewater Reuse in Agriculture. J. Clean. Prod. 2021, 316, 128151. [Google Scholar] [CrossRef]
  20. Kalboussi, N.; Biard, Y.; Pradeleix, L.; Rapaport, A.; Sinfort, C.; Ait-mouheb, N. Life cycle assessment as decision support tool for water reuse in agriculture irrigation. Sci. Total Environ. 2022, 836, 155486. [Google Scholar] [CrossRef]
  21. Gao, J.; Xu, C.; Luo, N.; Liu, X.; Huang, S.; Wang, P. Mitigating Global Warming Potential While Coordinating Economic Benefits by Optimizing Irrigation Managements in Maize Production. J. Environ. Manag. 2021, 298, 113474. [Google Scholar] [CrossRef]
  22. Chen, X.; Thorp, K.R.; van Oel, P.R.; Xu, Z.; Zhou, B.; Li, Y. Environmental Impact Assessment of Water-Saving Irrigation Systems across 60 Irrigation Construction Projects in Northern China. J. Clean. Prod. 2020, 245, 118883. [Google Scholar] [CrossRef]
  23. Maia, R.; Silva, C.; Costa, E. Eco-Efficiency Assessment in the Agricultural Sector: The Monte Novo Irrigation Perimeter, Portugal. J. Clean. Prod. 2016, 138, 217–228. [Google Scholar] [CrossRef] [Green Version]
  24. Mehmeti, A.; Todorovic, M.; Scardigno, A. Assessing the Eco-Efficiency Improvements of Sinistra Ofanto Irrigation Scheme. J. Clean. Prod. 2016, 138, 208–216. [Google Scholar] [CrossRef]
  25. Romero-Gámez, M.; Audsley, E.; Suárez-Rey, E.M. Life Cycle Assessment of Cultivating Lettuce and Escarole in Spain. J. Clean. Prod. 2014, 73, 193–203. [Google Scholar] [CrossRef]
  26. Eranki, P.L.; El-Shikha, D.; Hunsaker, D.J.; Bronson, K.F.; Landis, A.E. A Comparative Life Cycle Assessment of Flood and Drip Irrigation for Guayule Rubber Production Using Experimental Field Data. Ind. Crops Prod. 2017, 99, 97–108. [Google Scholar] [CrossRef]
  27. Foteinis, S.; Chatzisymeon, E. Life Cycle Assessment of Organic versus Conventional Agriculture. A Case Study of Lettuce Cultivation in Greece. J. Clean. Prod. 2016, 112, 2462–2471. [Google Scholar] [CrossRef]
  28. Pradeleix, L.; Roux, P.; Bouarfa, S.; Jaouani, B.; Lili-Chabaane, Z.; Bellon-Maurel, V. Environmental Impacts of Contrasted Groundwater Pumping Systems Assessed by Life Cycle Assessment Methodology: Contribution to the Water-Energy Nexus Study. Irrig. Drain. 2015, 64, 124–138. [Google Scholar] [CrossRef]
  29. Duran-Ros, M.; Puig-Bargués, J.; Arbat, G.; Barragán, J.; Ramírez de Cartagena, F. Effect of Filter, Emitter and Location on Clogging When Using Effluents. Agric. Water Manag. 2009, 96, 67–79. [Google Scholar] [CrossRef]
  30. Capra, A.; Scicolone, B. Recycling of Poor Quality Urban Wastewater by Drip Irrigation Systems. J. Clean. Prod. 2007, 15, 1529–1534. [Google Scholar] [CrossRef]
  31. Mesquita, M.; de Deus, F.P.; Testezlaf, R.; Da Rosa, L.M.; Diotto, A.V. Design and Hydrodynamic Performance Testing of a New Pressure Sand Filter Diffuser Plate Using Numerical Simulation. Biosyst. Eng. 2019, 183, 58–69. [Google Scholar] [CrossRef]
  32. Mesquita, M.; Testezlaf, R.; Ramirez, J.C.S. The Effect of Media Bed Characteristics and Internal Auxiliary Elements on Sand Filter Head Loss. Agric. Water Manag. 2012, 115, 178–185. [Google Scholar] [CrossRef]
  33. Arbat, G.; Pujol, T.; Puig-Bargués, J.; Duran-Ros, M.; Montoro, L.; Barragán, J.; Ramírez de Cartagena, F. An Experimental and Analytical Study to Analyze Hydraulic Behavior of Nozzle-Type Underdrains in Porous Media Filters. Agric. Water Manag. 2013, 126, 64–74. [Google Scholar] [CrossRef]
  34. Pujol, T.; Arbat, G.; Bové, J.; Puig-Bargués, J.; Duran-Ros, M.; Velayos, J.; Ramírez de Cartagena, F. Effects of the Underdrain Design on the Pressure Drop in Sand Filters. Biosyst. Eng. 2016, 150, 1–9. [Google Scholar] [CrossRef]
  35. Arbat, G.; Pujol, T.; Puig-Bargués, J.; Duran-Ros, M.; Barragán, J.; Montoro, L.; Ramírez de Cartagena, F. Using Computational Fluid Dynamics to Predict Head Losses in the Auxiliary Elements of a Microirrigation Sand Filter. Trans. ASABE 2011, 54, 1367–1376. [Google Scholar] [CrossRef]
  36. Bové, J.; Arbat, G.; Pujol, T.; Duran-Ros, M.; Ramírez de Cartagena, F.; Velayos, J.; Puig-Bargués, J. Reducing Energy Requirements for Sand Filtration in Microirrigation: Improving the Underdrain and Packing. Biosyst. Eng. 2015, 140, 67–78. [Google Scholar] [CrossRef]
  37. Pujol, T.; Puig-Bargués, J.; Arbat, G.; Vegas, A.; Duran-Ros, M.; Pujol, J.; Ramírez de Cartagena, F. Numerical Study of the Effects of Pod, Wand and Spike Type Underdrain Systems in Pressurised Sand Filters. Biosyst. Eng. 2020, 200, 338–352. [Google Scholar] [CrossRef]
  38. Bové, J.; Puig-Bargués, J.; Arbat, G.; Duran-Ros, M.; Pujol, T.; Pujol, J.; Ramírez de Cartagena, F. Development of a New Underdrain for Improving the Efficiency of Microirrigation Sand Media Filters. Agric. Water Manag. 2017, 179, 296–305. [Google Scholar] [CrossRef]
  39. Solé-Torres, C.; Puig-Bargués, J.; Duran-Ros, M.; Arbat, G.; Pujol, J.; Ramírez de Cartagena, F. Effect of Underdrain Design, Media Height and Filtration Velocity on the Performance of Microirrigation Sand Filters Using Reclaimed Effluents. Biosyst. Eng. 2019, 187, 292–304. [Google Scholar] [CrossRef]
  40. Bové, J.; Arbat, G.; Duran-Ros, M.; Pujol, T.; Velayos, J.; Ramírez de Cartagena, F.; Puig-Bargués, J. Pressure Drop across Sand and Recycled Glass Media Used in Micro Irrigation Filters. Biosyst. Eng. 2015, 137, 55–63. [Google Scholar] [CrossRef]
  41. Duran-Ros, M.; Puig-Bargués, J.; Arbat, G.; Barragán, J.; Ramírez de Cartagena, F. Definition of a SCADA System for a Microirrigation Network with Effluents. Comput. Electron. Agric. 2008, 64, 338–342. [Google Scholar] [CrossRef]
  42. Tajrishy, M.A.; Hills, D.J.; Tchobanoglous, G. Pretreatment of Secondary Effluent for Drip Irrigation. J. Irrig. Drain. Eng. 1994, 120, 716–731. [Google Scholar] [CrossRef]
  43. Elbana, M.; Ramírez de Cartagena, F.; Puig-Bargués, J. Effectiveness of Sand Media Filters for Removing Turbidity and Recovering Dissolved Oxygen from a Reclaimed Effluent Used for Micro-Irrigation. Agric. Water Manag. 2012, 111, 27–33. [Google Scholar] [CrossRef]
  44. European Recycling Industries’ Confederation. EuRIC—Statistics. Available online: https://www.euric-aisbl.eu/facts-figures/statistics (accessed on 10 July 2021).
  45. European Parliament. Plastic Waste and Recycling in the EU: Facts and Figures|News|European Parliament. Available online: https://www.europarl.europa.eu/news/en/headlines/society/20181212STO21610/plastic-waste-and-recycling-in-the-eu-facts-and-figures (accessed on 10 July 2021).
  46. European Tyre & Rubber Manufacturers’ Association. Circular Economy—ETRMA. Available online: https://www.etrma.org/key-topics/circular-economy/ (accessed on 10 July 2021).
  47. Wernet, G.; Bauer, C.; Steubing, B.; Reinhard, J.; Moreno-Ruiz, E.; Weidema, B. The Ecoinvent Database Version 3 (Part I): Overview and Methodology. Int. J. Life Cycle Assess. 2016, 21, 1218–1230. [Google Scholar] [CrossRef]
  48. Huijbregts, M.A.J.; Steinmann, Z.J.N.; Elshout, P.M.F.; Stam, G.; Verones, F.; Vieira, M.; Zijp, M.; Hollander, A.; van Zelm, R. ReCiPe2016: A Harmonised Life Cycle Impact Assessment Method at Midpoint and Endpoint Level. Int. J. Life Cycle Assess. 2017, 22, 138–147. [Google Scholar] [CrossRef]
  49. Dekker, E.; Zijp, M.C.; van de Kamp, M.E.; Temme, E.H.M.; van Zelm, R. A Taste of the New ReCiPe for Life Cycle Assessment: Consequences of the Updated Impact Assessment Method on Food Product LCAs. Int. J. Life Cycle Assess. 2020, 25, 2315–2324. [Google Scholar] [CrossRef] [Green Version]
  50. United Nations Economic Comission for Europe. Life Cycle Assessment of Electricity Generation Options; United Nations Publications: Geneva, Switzerland, 2021. [Google Scholar]
Figure 1. Different filter and underdrain designs: arm collector (a), porous media (b), and inserted domes (c).
Agriculture 12 00810 g001
Figure 2. Filter life cycle.
Agriculture 12 00810 g002
Figure 3. Impacts of the extended manufacturing phase for each filter type, shown in percentage on the maximum value of each impact.
Agriculture 12 00810 g003
Table 1. Underdrain design and main operational characteristics of the different filters used in the experiment. Data was obtained from manufacturers (arm collector and inserted domes) and from Solé-Torres et al. [39] (porous media).
Filter Underdrain Design
Arm CollectorPorous MediaInserted Domes
Filter nominal diameter (mm)500500508
Filter filtration surface (m2)0.19600.19600.2026
Maximum filtration flow (m3/h)232018
Maximum filtration height (m)0.400.700.69
Number of underdrains10112
Mean slot width (m)2.5 × 10⁻⁴Not appl.4.5 × 10−4
Number of slots by underdrain140Not appl.90
Underdrain opening area per underdrain unit (m2)9.11 × 10−47.44 × 10−26.26 × 10⁻⁴
Underdrain total opening area (m2)0.00910.07440.0075
Underdrain effective area (ratio of underdrain opening area to filter surface area, %)4.6537.953.71
Table 2. Energy consumption regarding filtered volume was experimentally measured in the different filtration cycles.
Total Electrical Energy Consumption Per Filtered Volume (kWh/m3)
ScenarioFilter TypeBed MaterialFiltration Velocity (m/h)Media Bed Height (m)Filtration
Cycles
AverageStandard Deviation
ARM-1Arm collectorSand300.2640.1180.003
ARM-2Arm collectorSand300.3350.1240.013
ARM-3Arm collectorSand600.2290.1170.003
ARM-4Arm collectorSand600.3840.1310.011
ARM-5Arm collectorGlass300.2140.1450.019
ARM-6Arm collectorGlass300.3320.1310.010
ARM-7Arm collectorGlass600.2290.1270.011
ARM-8Arm collectorGlass600.31400.1360.011
POR-1Porous mediaSand300.2210.1150.002
POR-2Porous mediaSand300.3100.1180.002
POR-3Porous mediaSand600.2770.1200.024
POR-4Porous mediaSand600.3750.1260.016
POR-5Porous mediaGlass300.2170.1250.016
POR-6Porous mediaGlass300.3270.1190.014
POR-7Porous mediaGlass600.2300.1250.027
POR-8Porous mediaGlass600.3700.1290.027
DOM-1Inserted domesSand300.2550.1210.010
DOM-2Inserted domesSand300.3360.1220.004
DOM-3Inserted domesSand600.2420.1150.006
DOM-4Inserted domesSand600.31110.1260.008
DOM-5Inserted domesGlass300.2210.1240.007
DOM-6Inserted domesGlass300.3180.1210.009
DOM-7Inserted domesGlass600.2350.1190.012
DOM-8Inserted domesGlass600.3780.1240.009
Table 3. Data related to the filter construction materials end of life.
Material
Steel *Polypropylene **NBR ***
Recycling90%30%47%
Waste10%31%9%
Energy recovering0%39%44%
* [44], ** [45], *** [46].
Table 4. Impacts (cradle to grave) for each underdrain design and scenario of working condition. The lowest impact scenario for each impact category and filter type are marked in light gray. The absolute minimum value for each impact category is marked in dark gray.
Arm Collector
Impact CategoryUnitsARM-1ARM-2ARM-3ARM-4ARM-5ARM-6ARM-7ARM-8
Global warmingkg CO2 eq36893840365840404386403539114163
Stratospheric ozone depletionkg CFC11 eq0.001980.002060.001960.002170.002360.002170.002100.00224
Ionizing radiationkBq Co-60 eq21442240212423672587236422852445
Ozone formation (human health)kg NOx eq11.912.411.813.014.213.012.613.4
Fine particulate matter formationkg PM2.5 eq8.899.258.829.7310.569.729.4210.03
Ozone formation (terrestrial ecosystems)kg NOx eq11.912.511.813.114.313.112.713.5
Terrestrial acidificationkg SO2 eq22.223.122.024.326.524.323.525.1
Freshwater eutrophicationkg P eq1.621.691.611.771.921.771.721.82
Marine eutrophicationkg N eq0.1590.1650.1580.1730.1860.1730.1680.178
Terrestrial ecotoxicitykg 1,4-DCB16,99717,51016,89218,18719,36118,17117,74918,606
Freshwater ecotoxicitykg 1,4-DCB496515492540584540524556
Marine ecotoxicitykg 1,4-DCB619643615675729674654694
Human carcinogenic toxicitykg 1,4-DCB288296287306324306300313
Human non-carcinogenic toxicitykg 1,4-DCB54115608537158676316586156996027
Land usem2a crop eq725754719791856790767814
Mineral resource scarcitykg Cu eq23.924.423.825.126.225.124.625.5
Fossil resource scarcitykg oil eq986102797810801173107910461113
Porous media
Impact categoryUnitsPOR-1POR-2POR-3POR-4POR-5POR-6POR-7POR-8
Global warmingkg CO2 eq43234399439546024558438445164683
Stratospheric ozone depletionkg CFC11 eq0.002080.002120.002120.002230.002210.002110.002180.00227
Ionizing radiationkBq Co-60 eq21482197219423262298218722712377
Ozone formation (human health)kg NOx eq12.512.812.713.413.312.713.113.7
Fine particulate matter formationkg PM2.5 eq9.479.669.6510.1510.049.629.9410.34
Ozone formation (terrestrial ecosystems)kg NOx eq12.612.912.813.513.412.813.213.8
Terrestrial acidificationkg SO2 eq23.023.523.524.824.523.424.225.3
Freshwater eutrophicationkg P eq1.861.891.891.981.961.891.942.02
Marine eutrophicationkg N eq0.1470.1500.1500.1580.1560.1490.1540.161
Terrestrial ecotoxicitykg 1,4-DCB75,56875,82675,81476,51576,36775,77476,22376,789
Freshwater ecotoxicitykg 1,4-DCB465475474501495473490511
Marine ecotoxicitykg 1,4-DCB597609608641634606627654
Human carcinogenic toxicitykg 1,4-DCB836840839850848839846854
Human non-carcinogenic toxicitykg 1,4-DCB50705169516454325376514953215537
Land usem2 a crop eq710724724762754721746777
Mineral resource scarcitykg Cu eq27.627.927.928.628.427.828.328.8
Fossil resource scarcitykg oil eq11221142114111961185113811731218
Inserted domes
Impact categoryUnitsDOM-1DOM-2DOM-3DOM-4DOM-5DOM-6DOM-7DOM-8
Global warmingkg CO2 eq36673720353138413762369536073758
Stratospheric ozone depletionkg CFC11 eq0.001980.002000.001900.002070.002030.001990.001940.00203
Ionizing radiationkBq Co-60 eq21712206208522822232219021342230
Ozone formation (human health)kg NOx eq11.912.011.412.412.212.011.712.2
Fine particulate matter formationkg PM2.5 eq8.798.928.479.219.028.868.659.01
Ozone formation (terrestrial ecosystems)kg NOx eq11.912.111.512.512.312.011.712.3
Terrestrial acidificationkg SO2 eq22.022.421.223.122.622.221.622.6
Freshwater eutrophicationkg P eq1.601.621.541.671.641.611.571.63
Marine eutrophicationkg N eq0.1540.1560.1490.1610.1580.1550.1520.158
Terrestrial ecotoxicitykg 1,4-DCB14,89615,07714,43515,48715,22114,99314,69315,206
Freshwater ecotoxicitykg 1,4-DCB476483459498488480469488
Marine ecotoxicitykg 1,4-DCB594603573622609599585609
Human carcinogenic toxicitykg 1,4-DCB326329319335331327323331
Human non-carcinogenic toxicitykg 1,4-DCB50915160491553175215512850135209
Land usem2 a crop eq698708672730715703686715
Mineral resource scarcitykg Cu eq20.620.820.121.220.920.720.420.9
Fossil resource scarcitykg oil eq9851000949103210119939691010
Table 5. Consumptions during the use phase for the different filters. Grey shadow shows the scenario with the lowest consumption, for each filter and consumable material.
Arm Collector
ConsumptionUnitsARM-1ARM-2ARM-3ARM-4ARM-5ARM-6ARM-7ARM-8
EnergykWh9984.910,440.49891.611,039.412,078.711,025.010,650.611,411.3
Sandkg940.81411.2501.8752.60.00.00.00.0
Glasskg0.00.00.00.0302.9454.3161.5242.3
Porous media
ConsumptionUnitsPOR-1POR-2POR-3POR-4POR-5POR-6POR-7POR-8
EnergykWh9732.49961.49949.710,570.810,440.49914.810,313.310,813.8
Sandkg940.81411.2501.8752.60.00.00.00.0
Glasskg0.00.00.00.0292.2438.3146.1219.2
Inserted domes
ConsumptionUnitsDOM-1DOM-2DOM-3DOM-4DOM-5DOM-6DOM-7DOM-8
EnergykWh10,140.410,300.79732.410,664.010,427.610,226.19961.410,414.8
Sandkg907.61361.5453.8680.70.00.00.00.0
Glasskg0.00.00.00.0302.9454.3161.5242.3
Publisher’s Note: MDPI stays neutral with regard to jurisdictional claims in published maps and institutional affiliations.

