
Probing Differential Metabolome Responses among Wheat Genotypes to Heat Stress Using Fourier Transform Infrared-Based Chemical Fingerprinting


 , and
, and 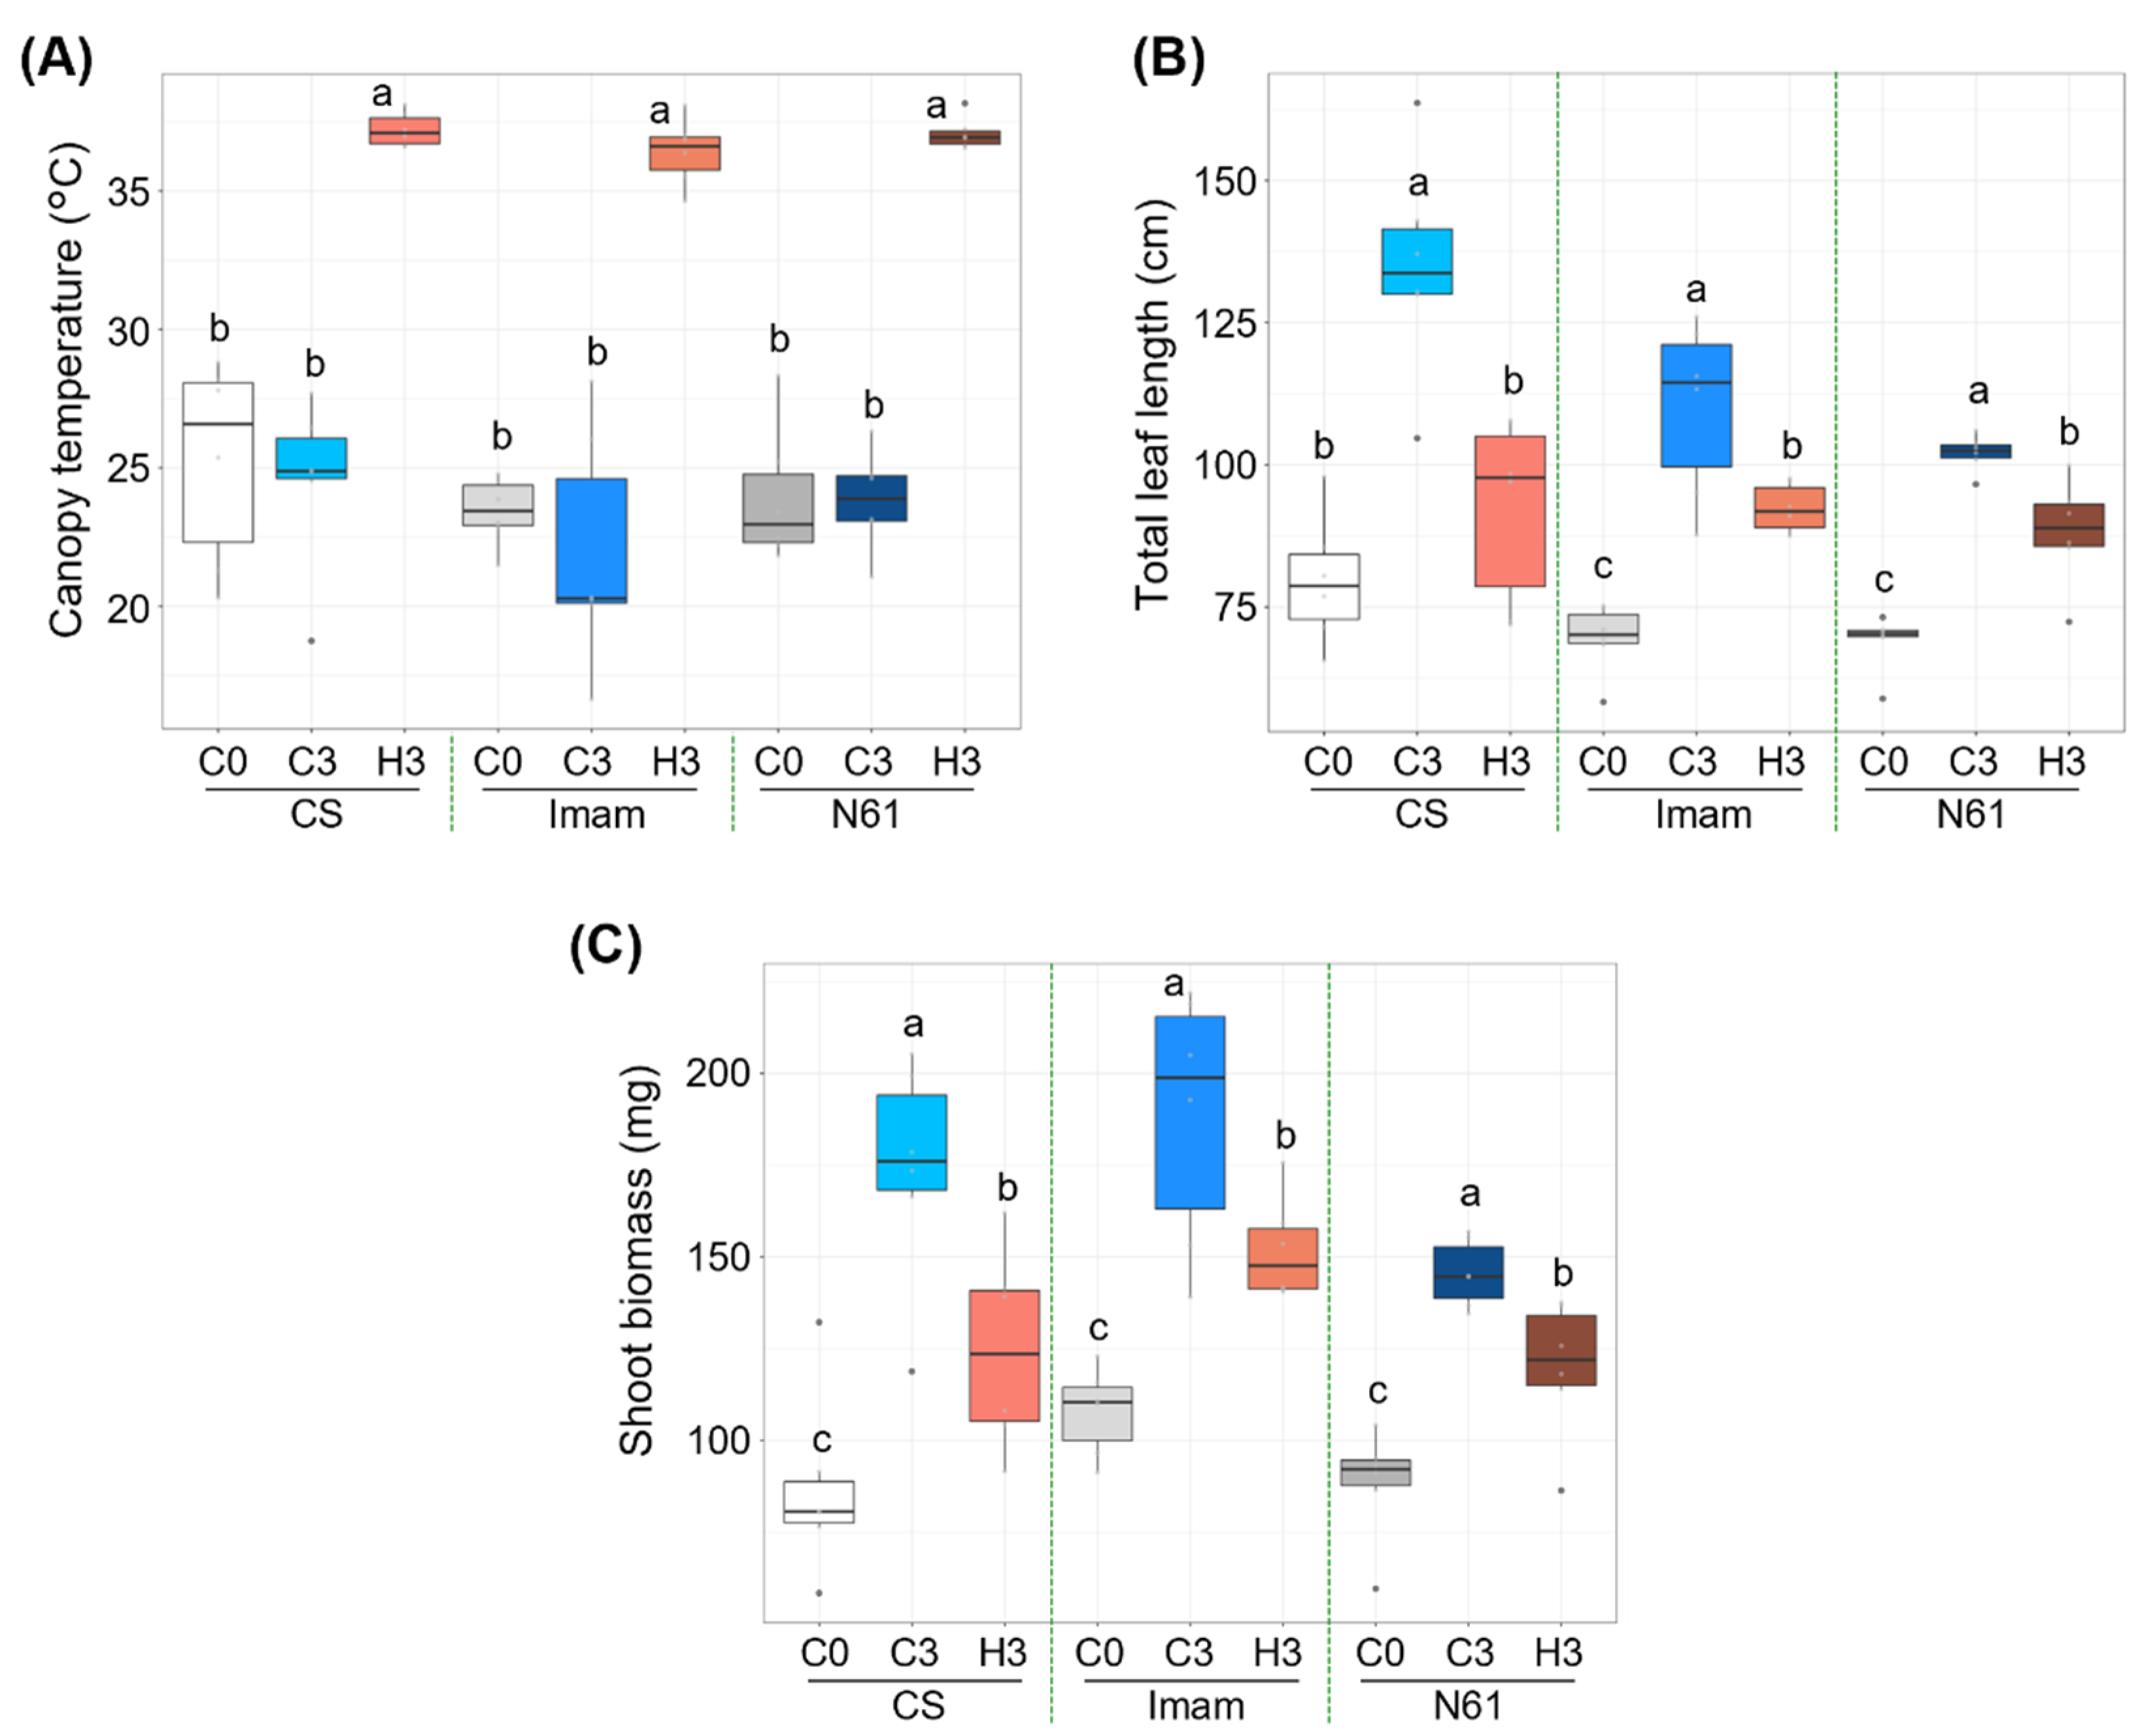
Abstract
:1. Introduction
2. Materials and Methods
2.1. Plant Growth Condition
2.2. Measurement of Canopy Temperature and Plant Growth
2.3. FTIR Spectroscopy
2.4. Chemometrics of FTIR Spectra and Statistical Analyses
3. Results and Discussion
3.1. Growth Response of Three Wheat Genotypes to Heat Stress
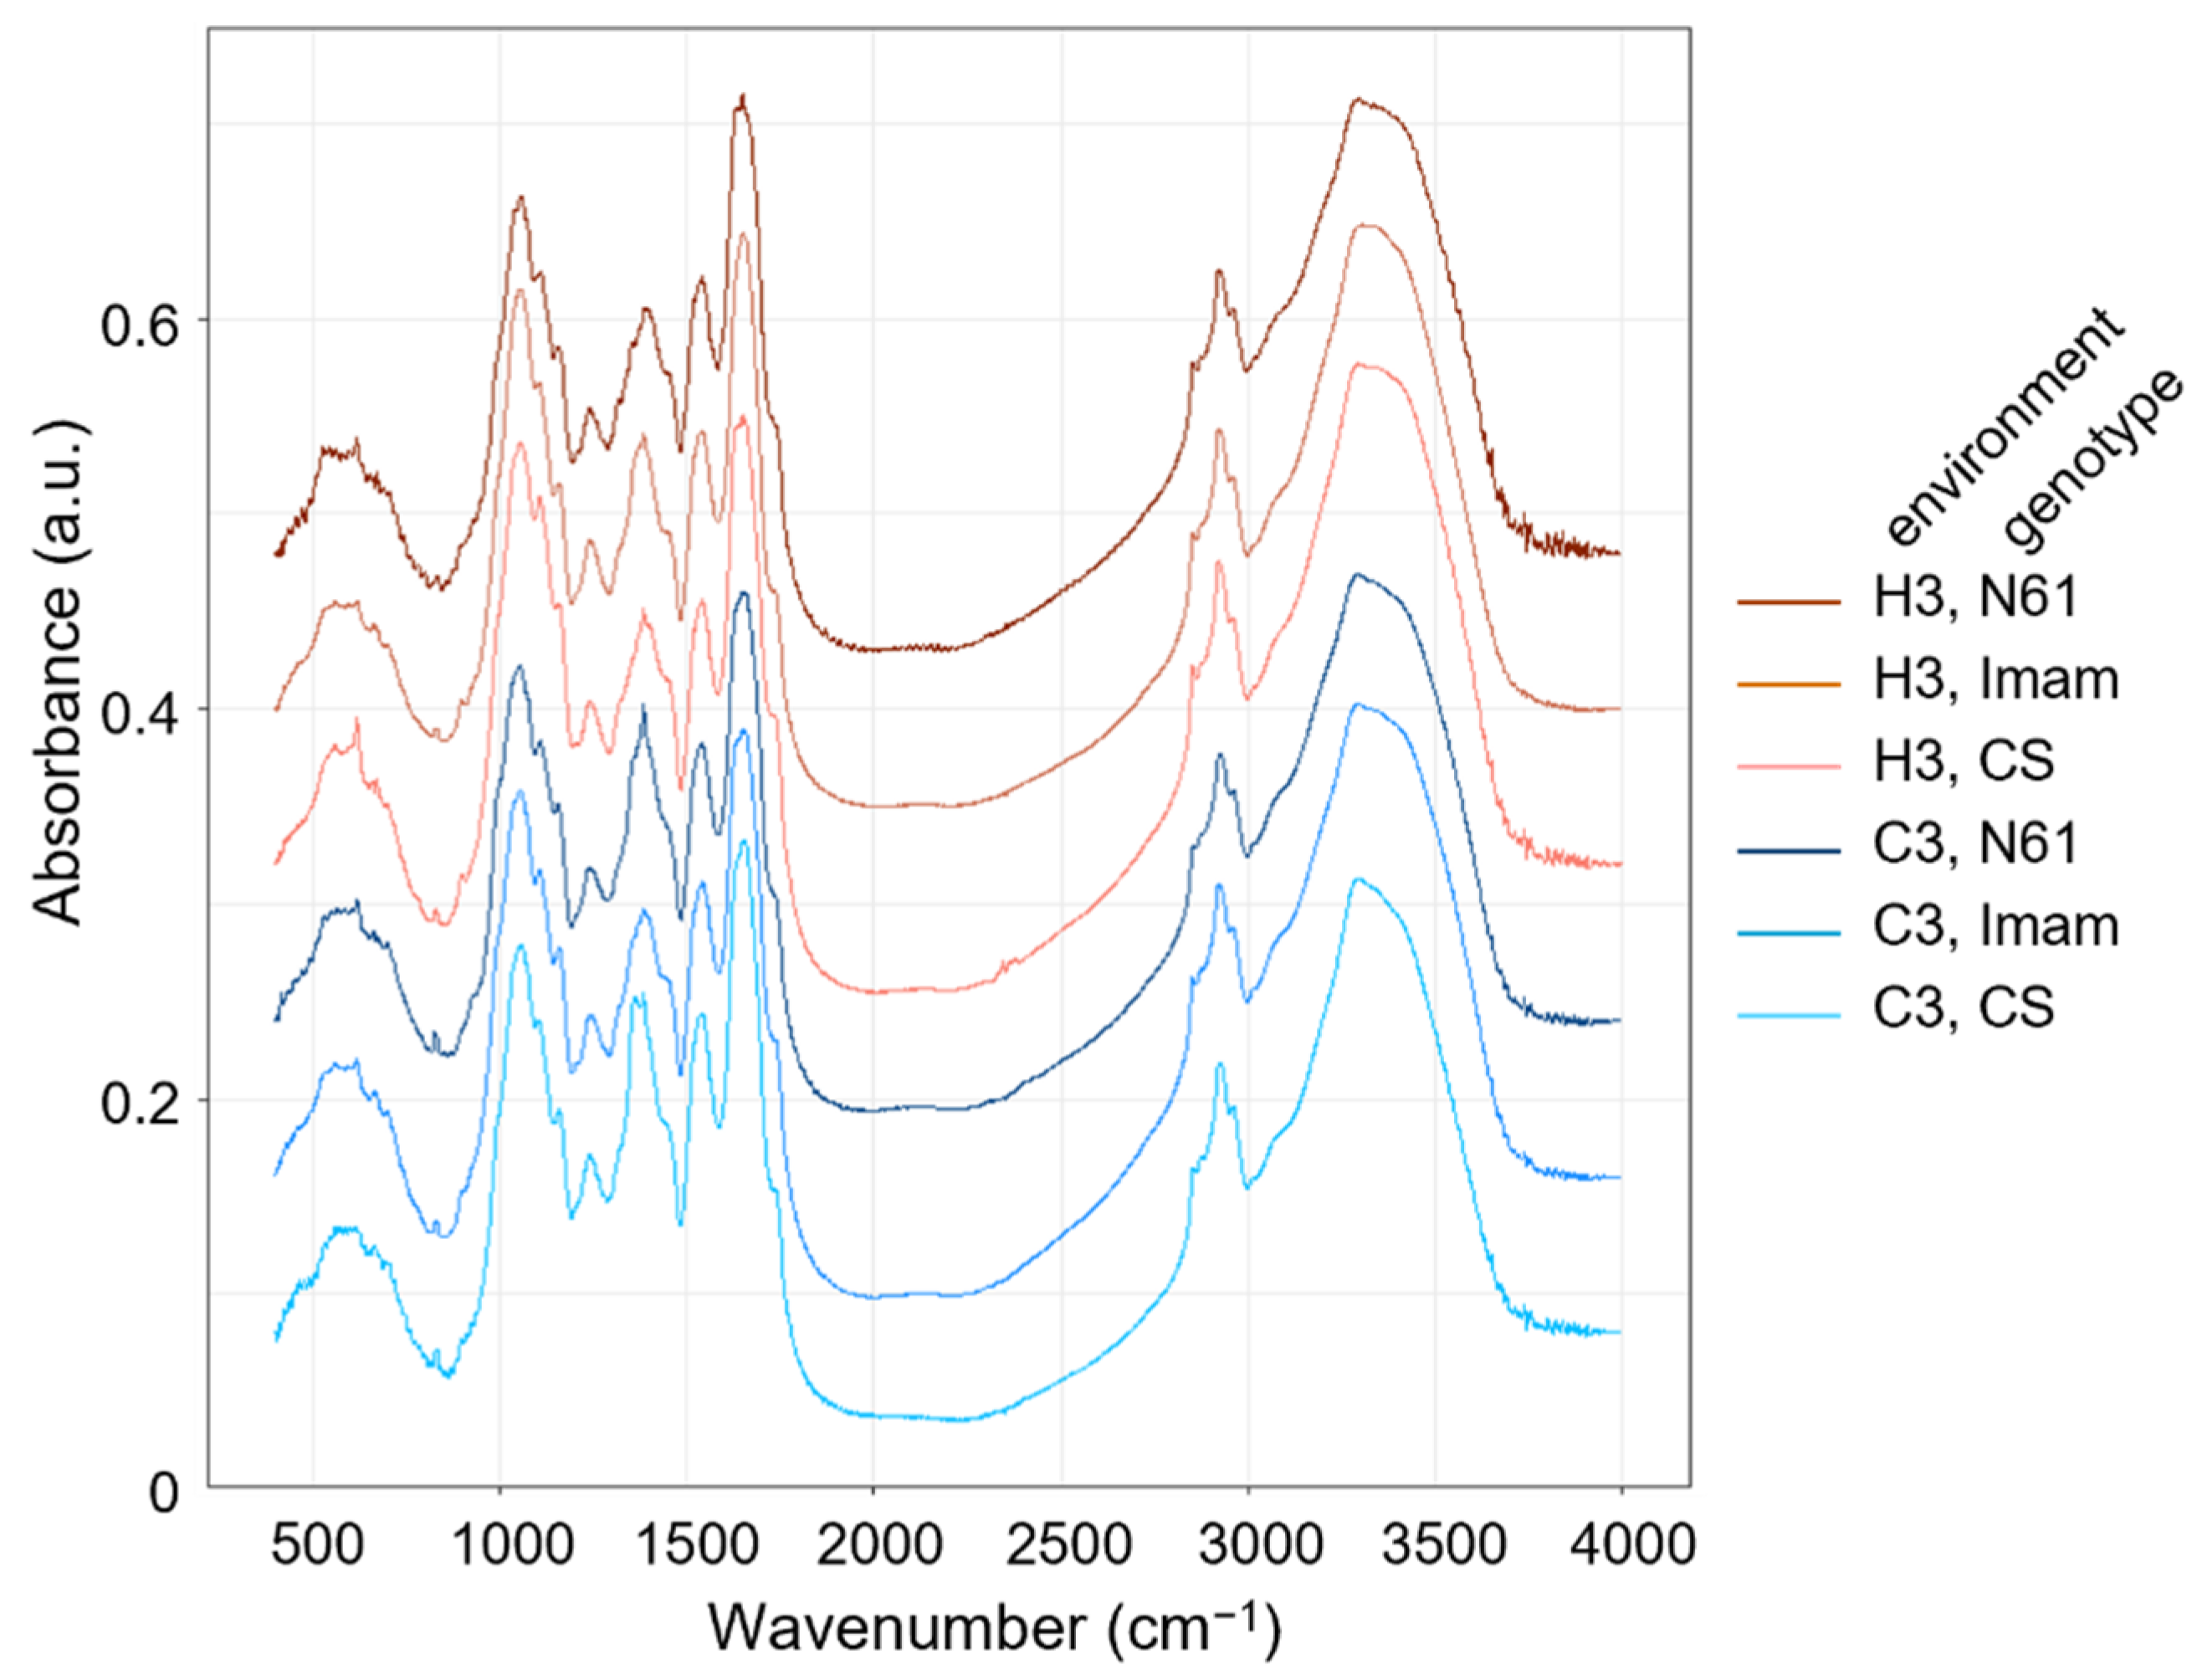
3.2. FTIR Spectra
3.3. Principal Component Analysis
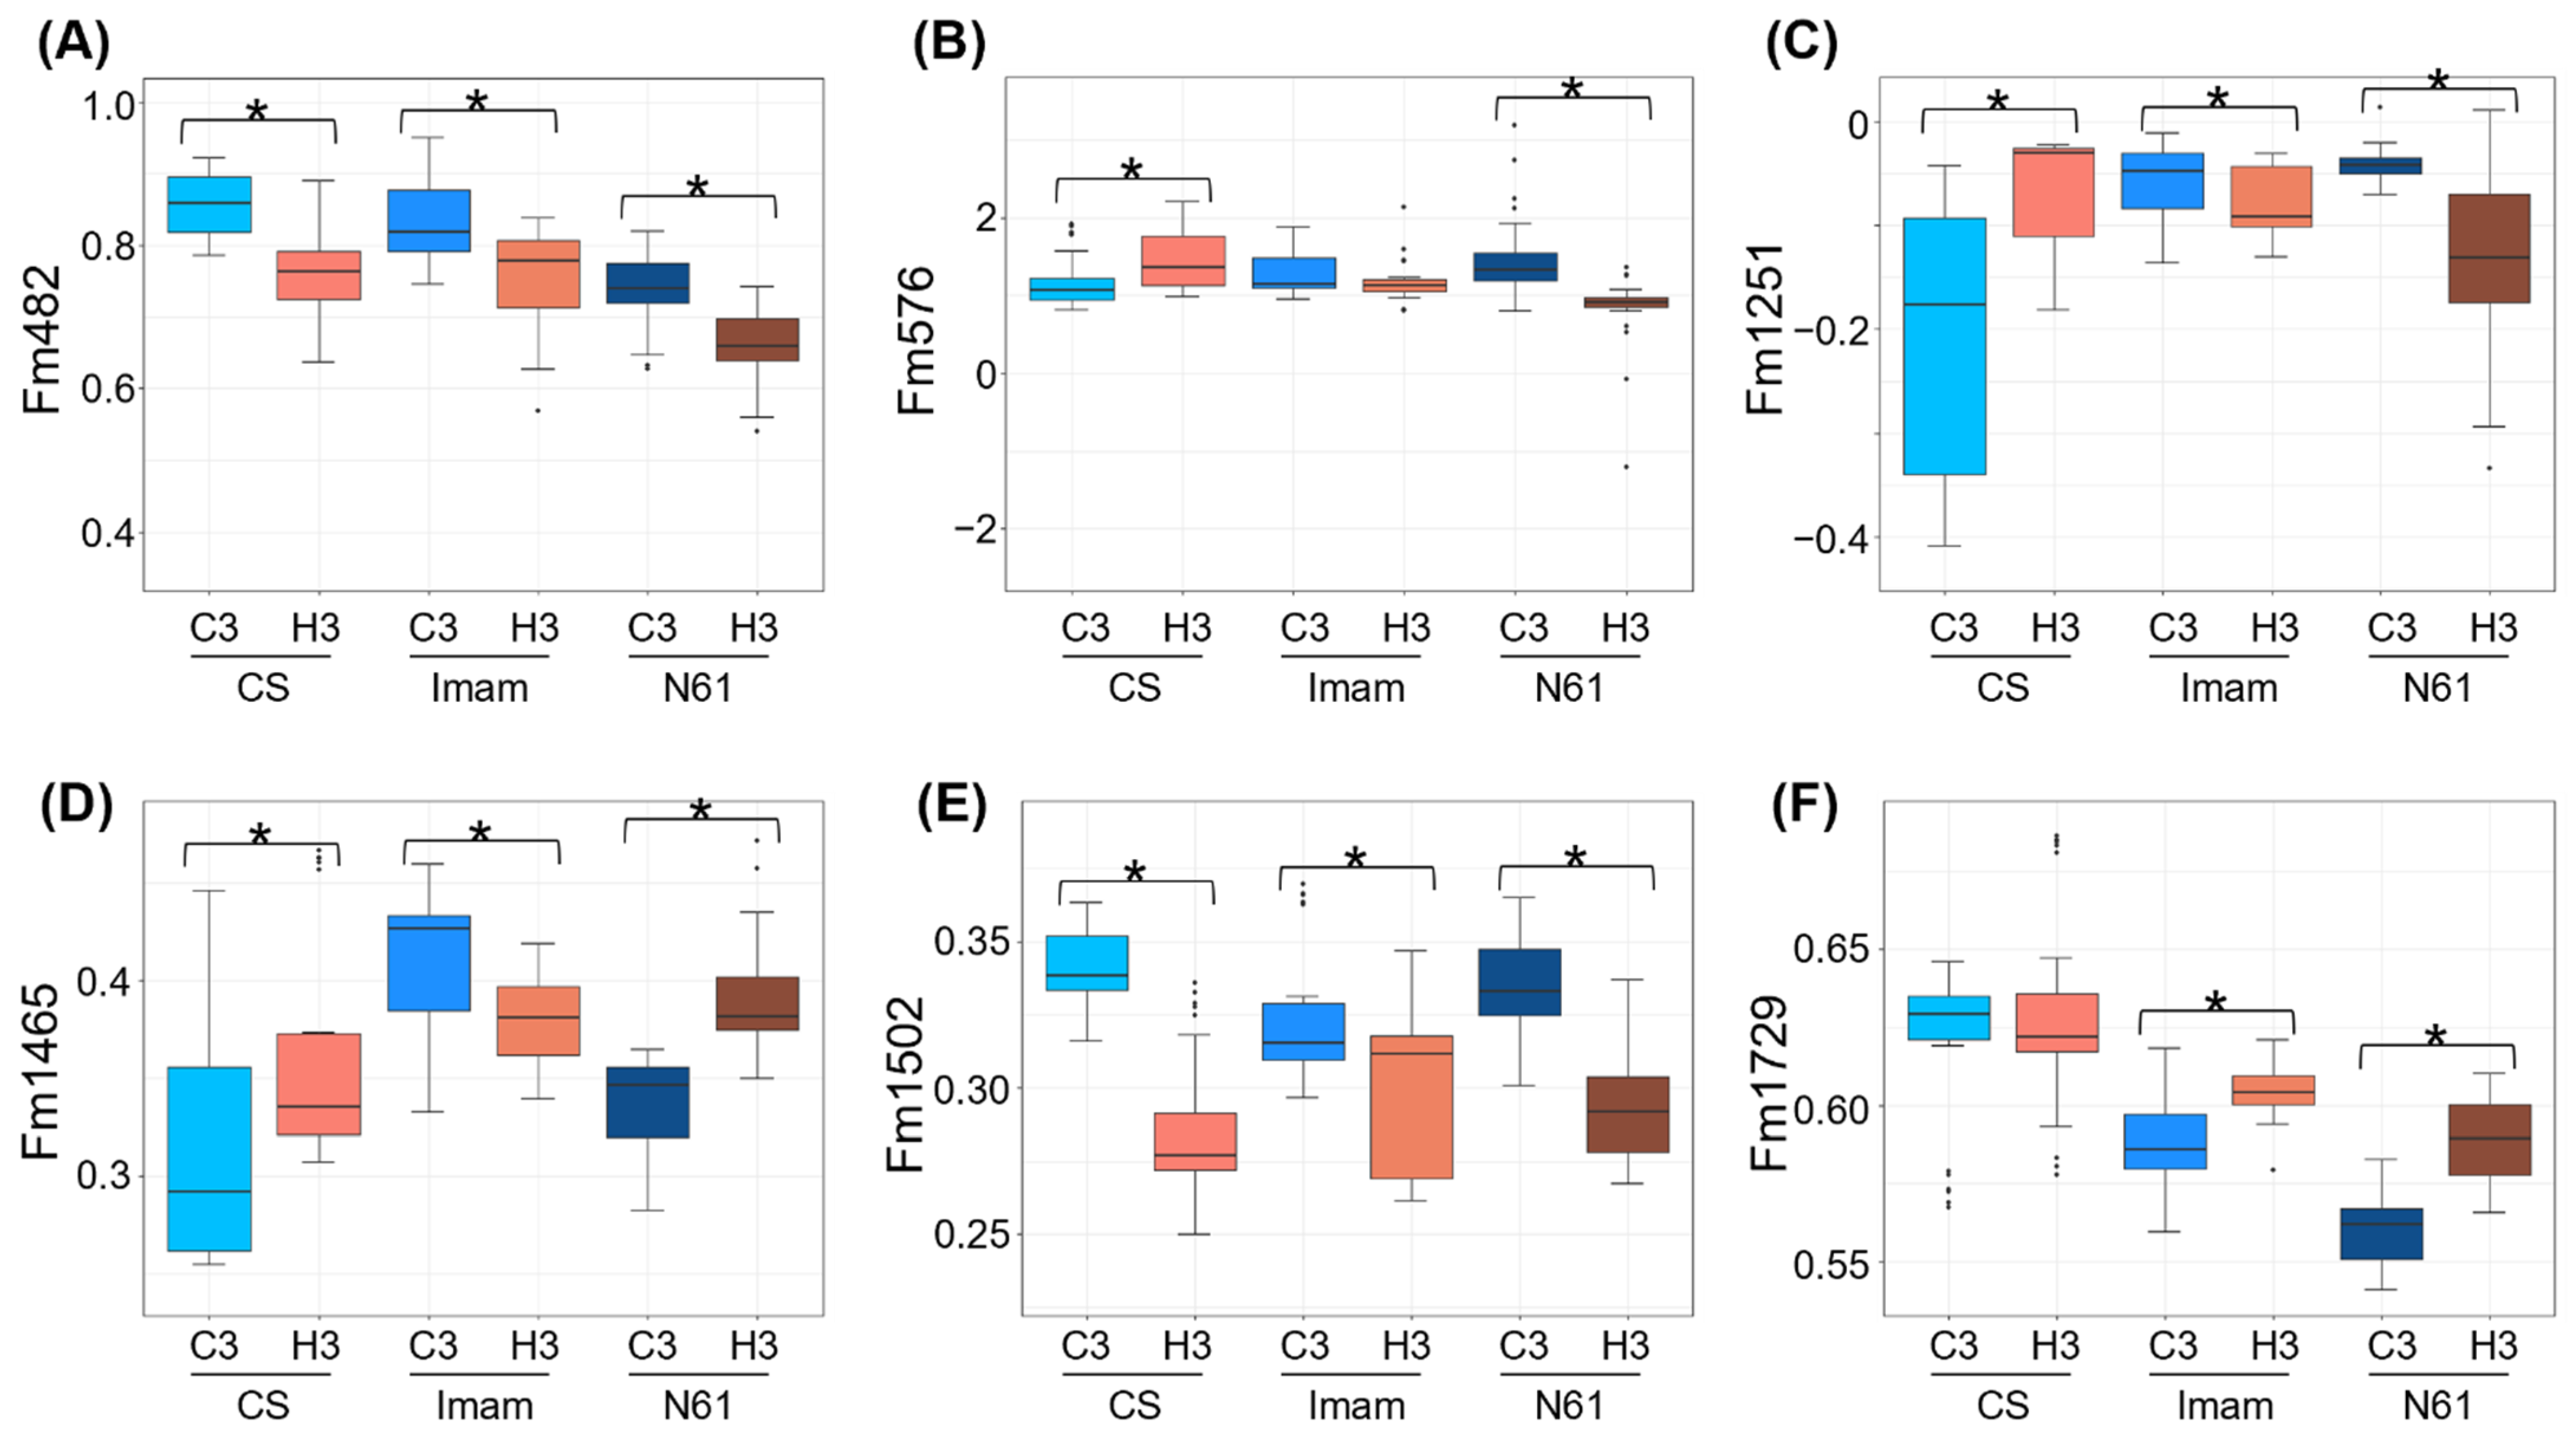
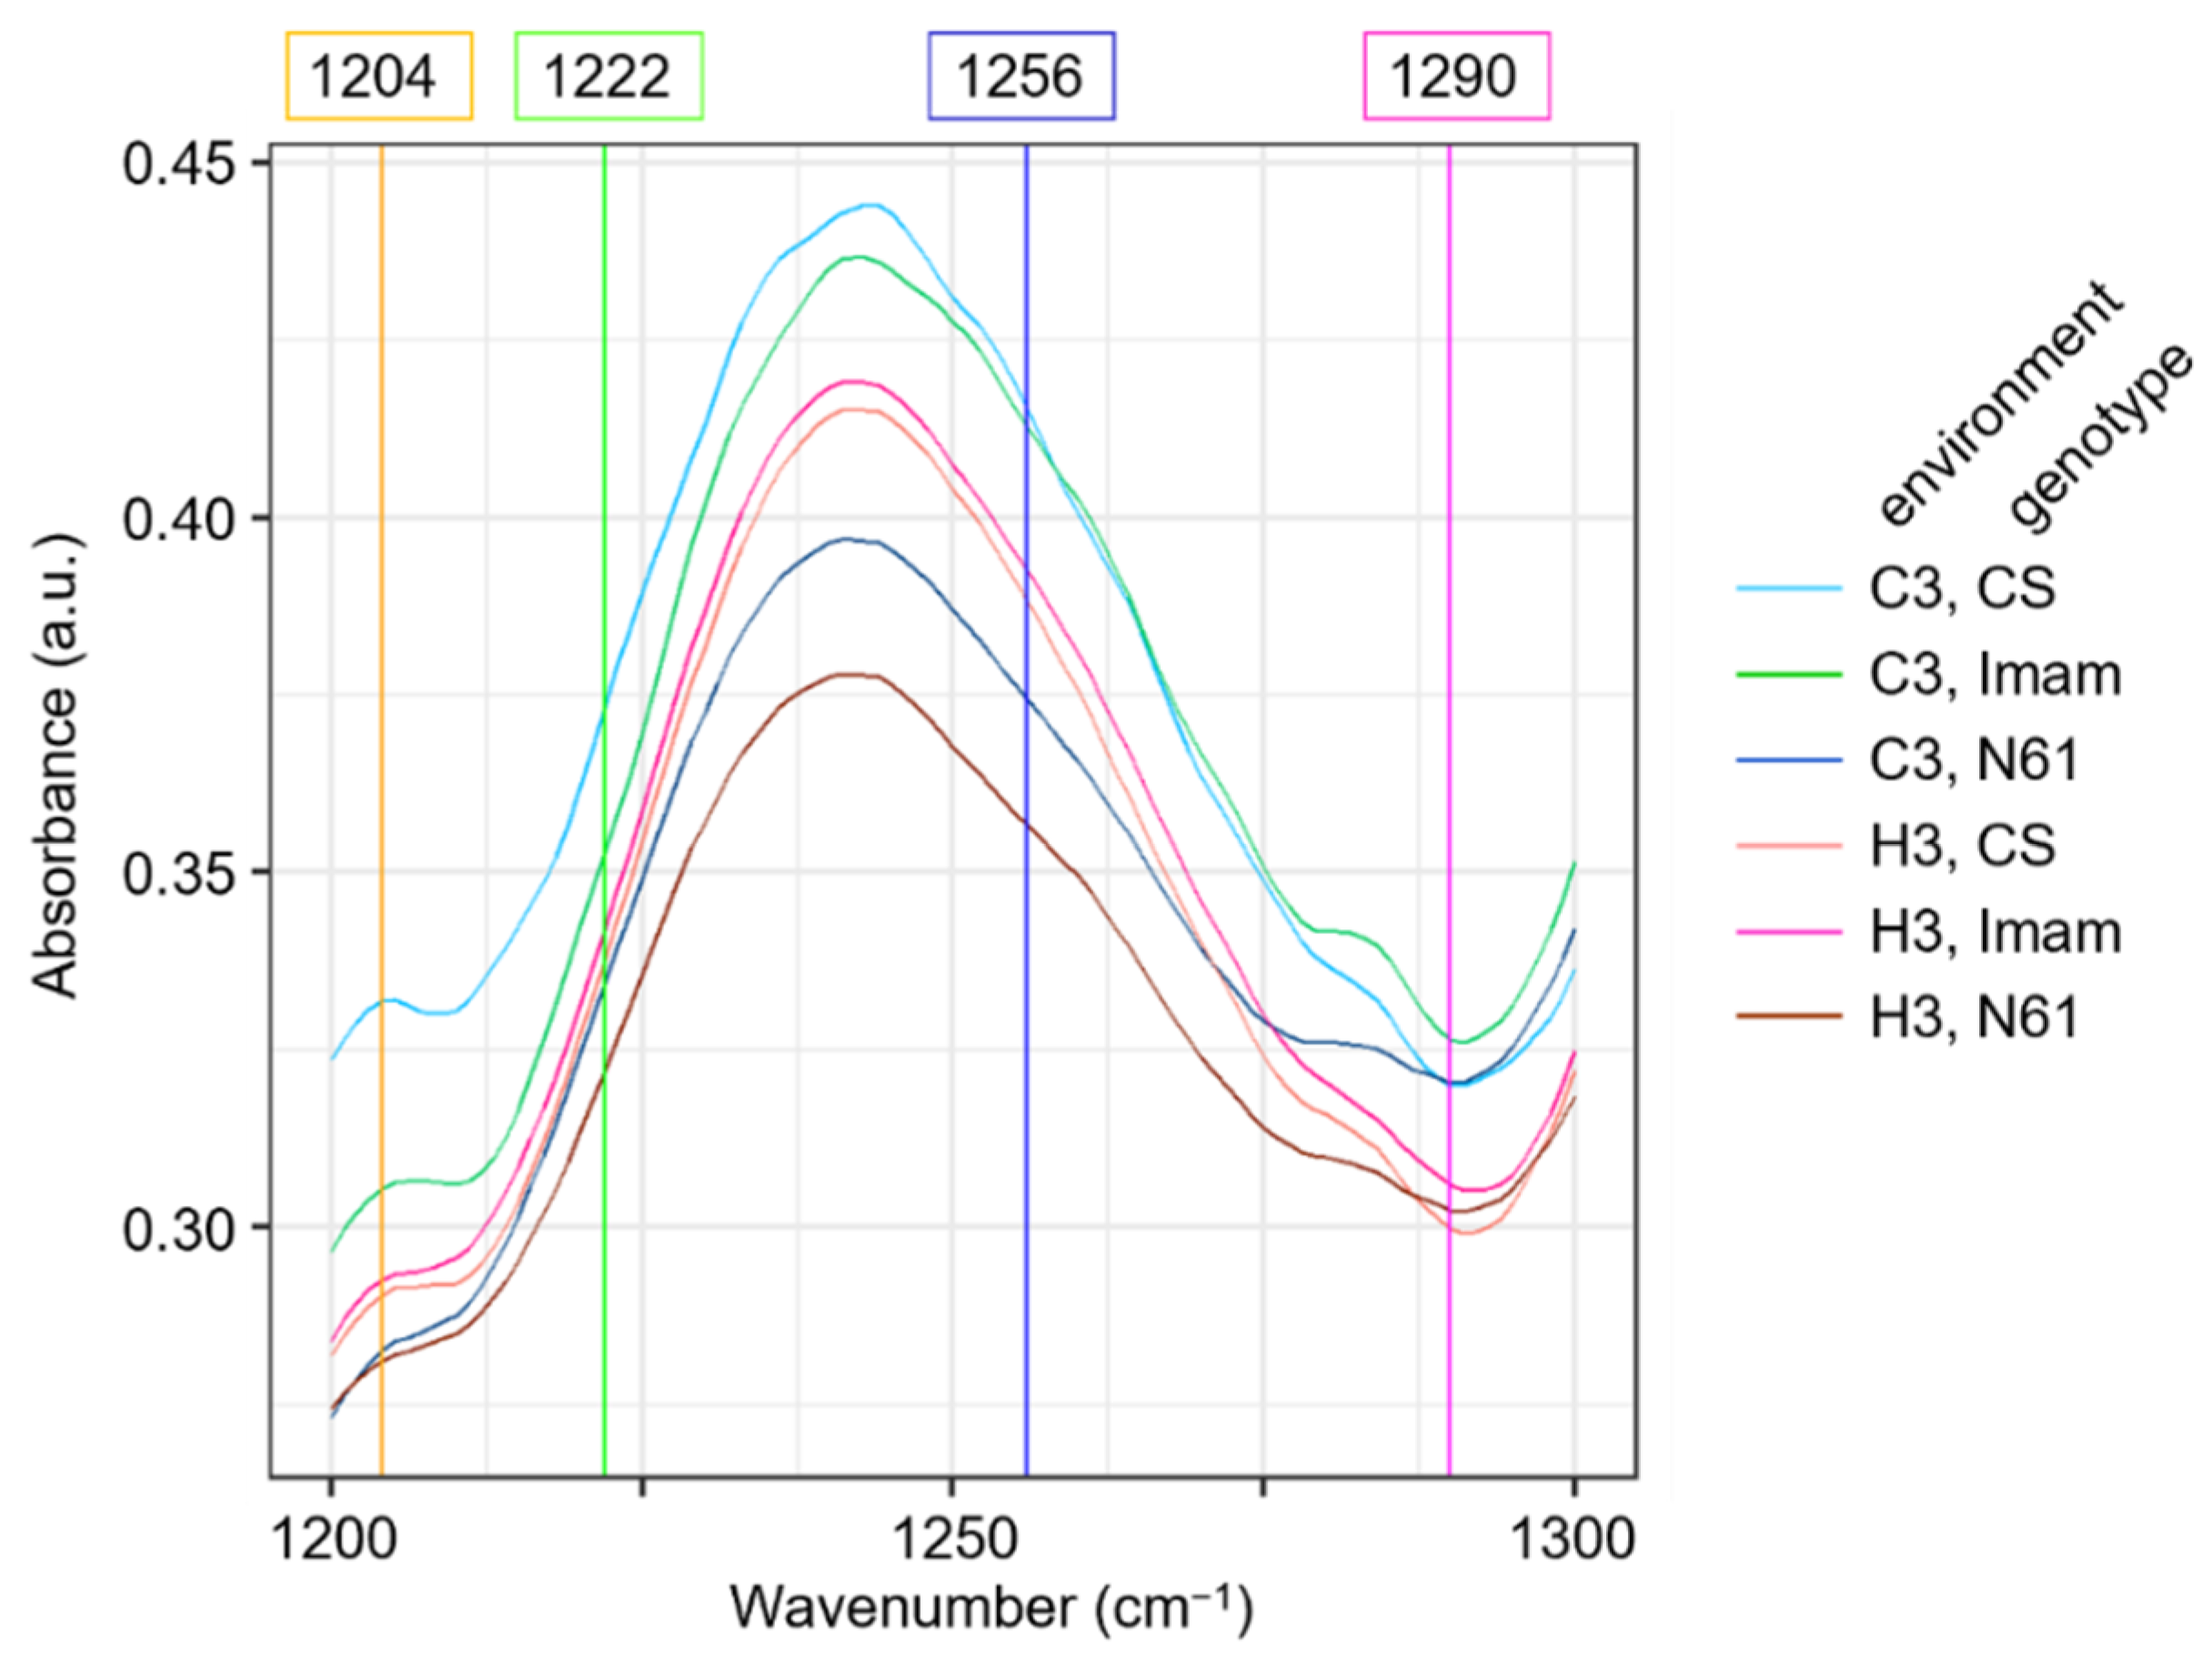
3.4. Behavior of FTIR Biomarkers
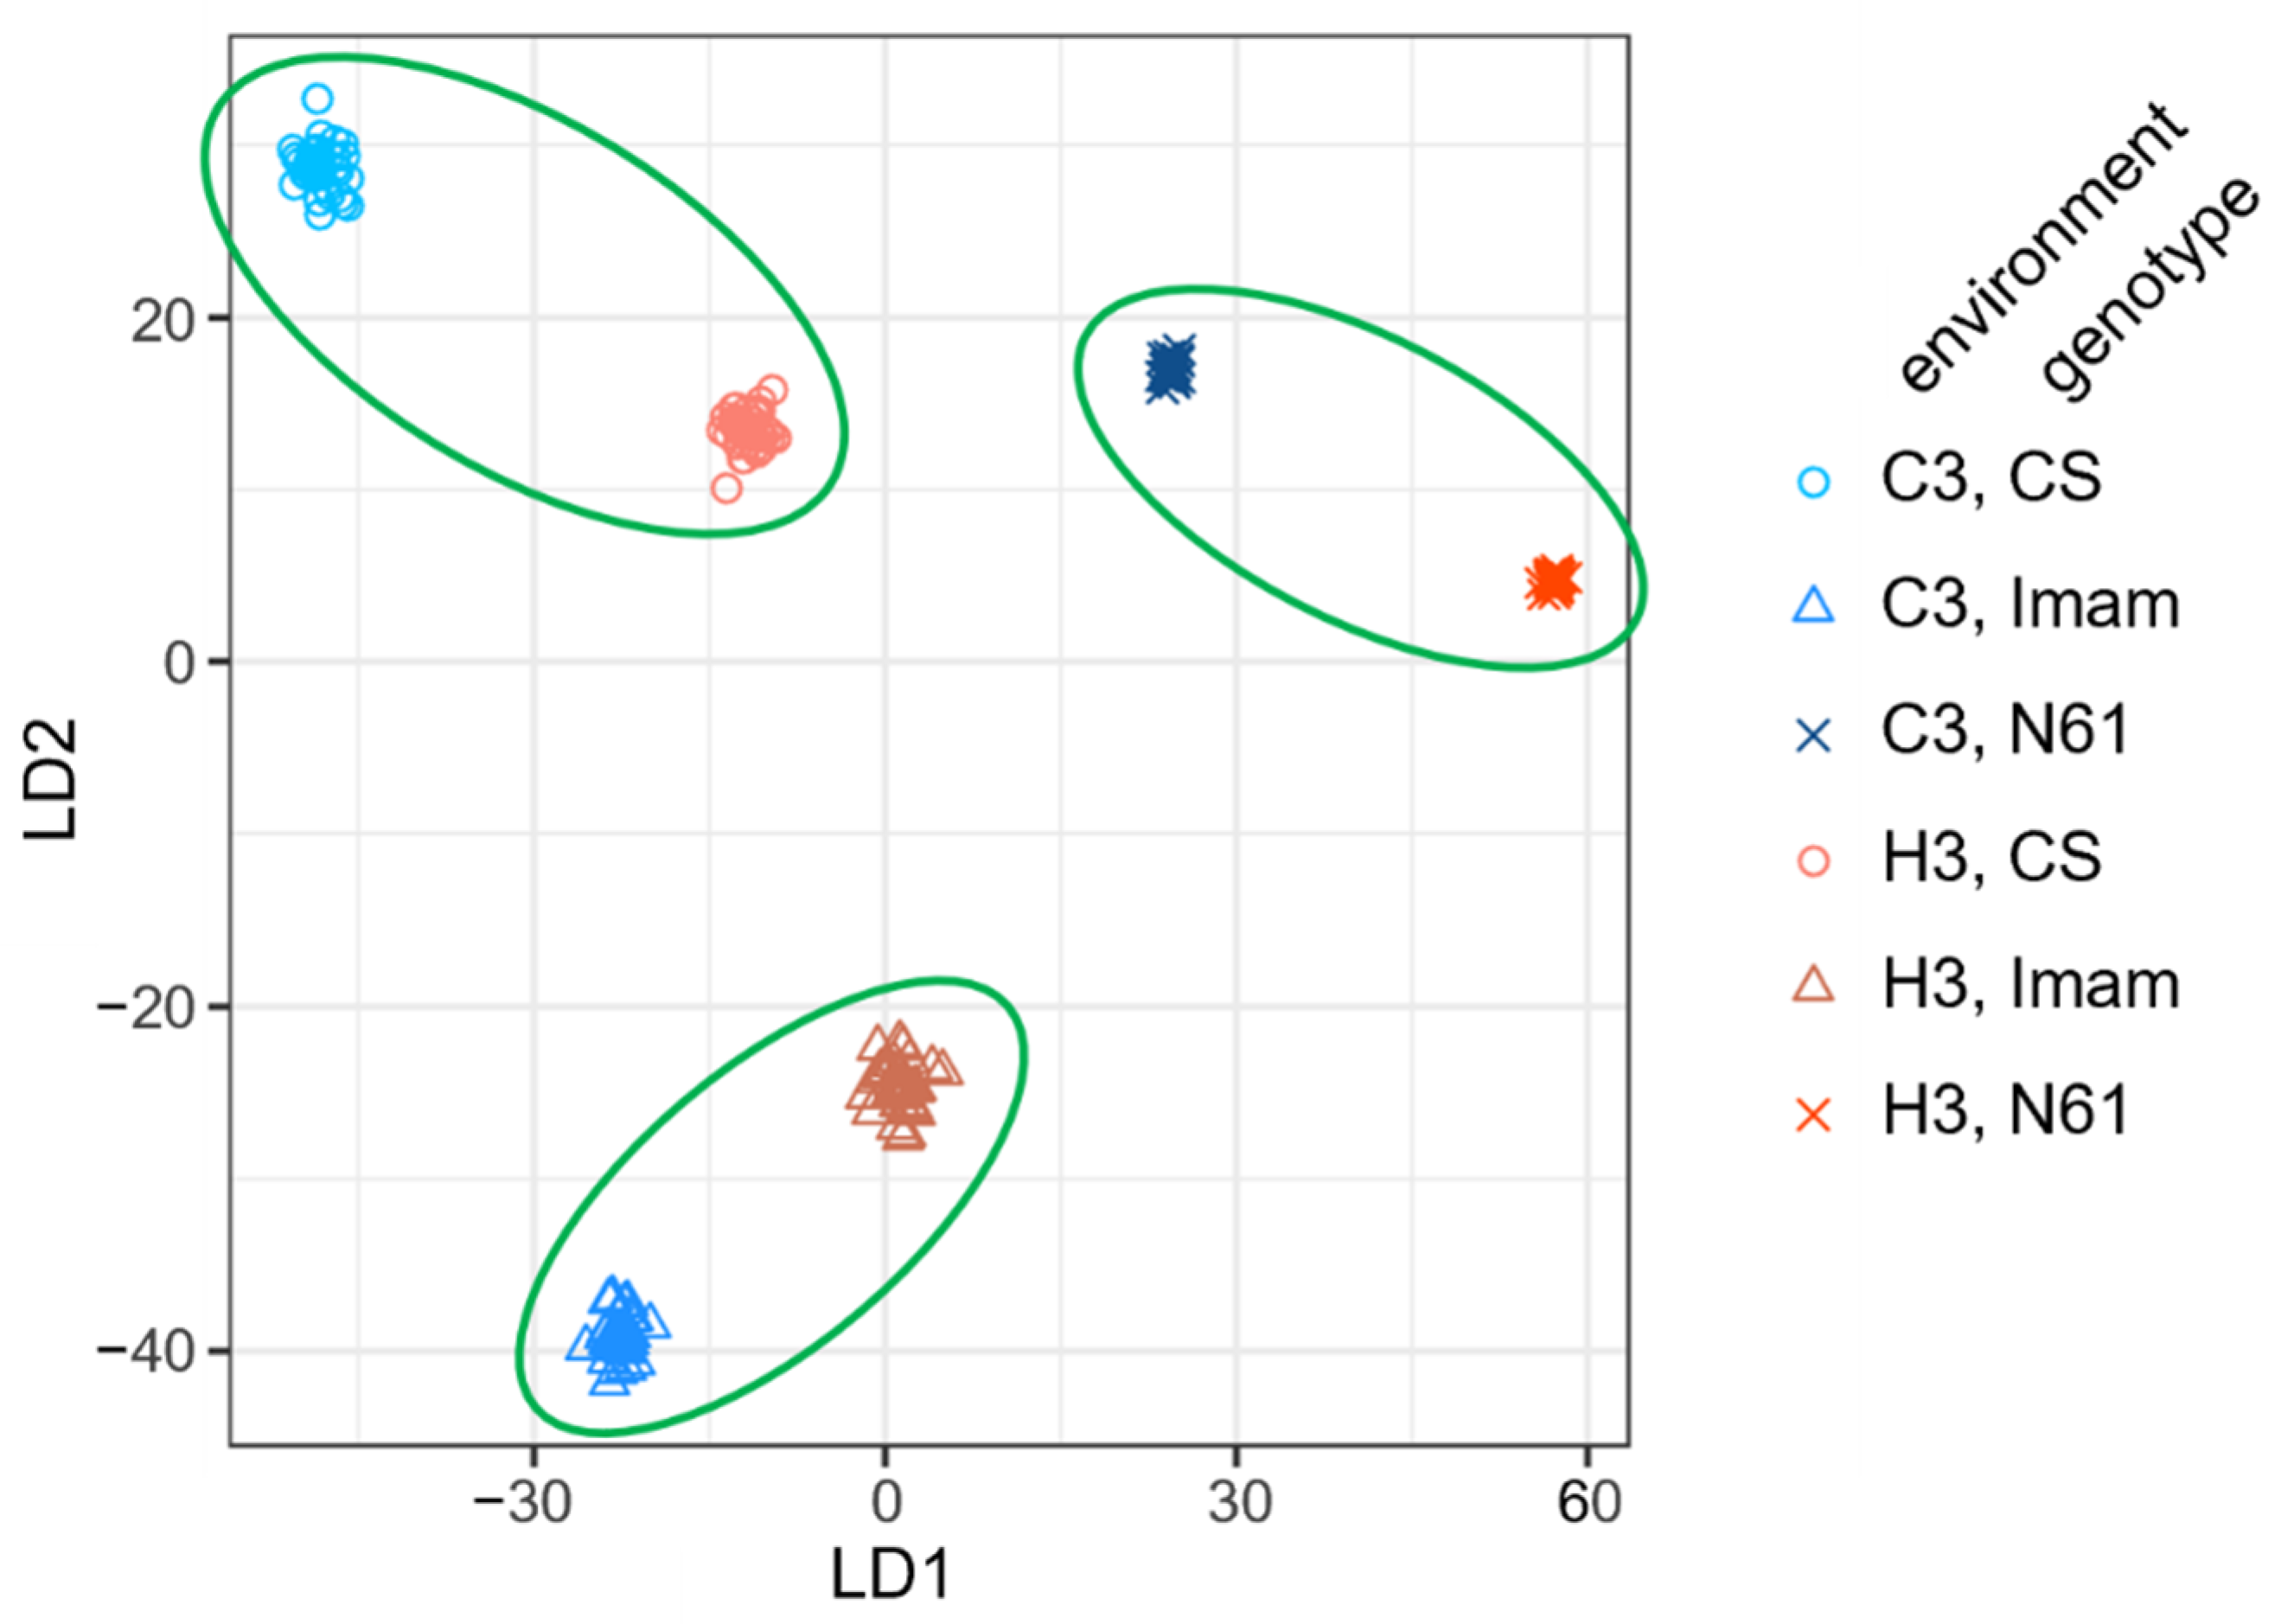
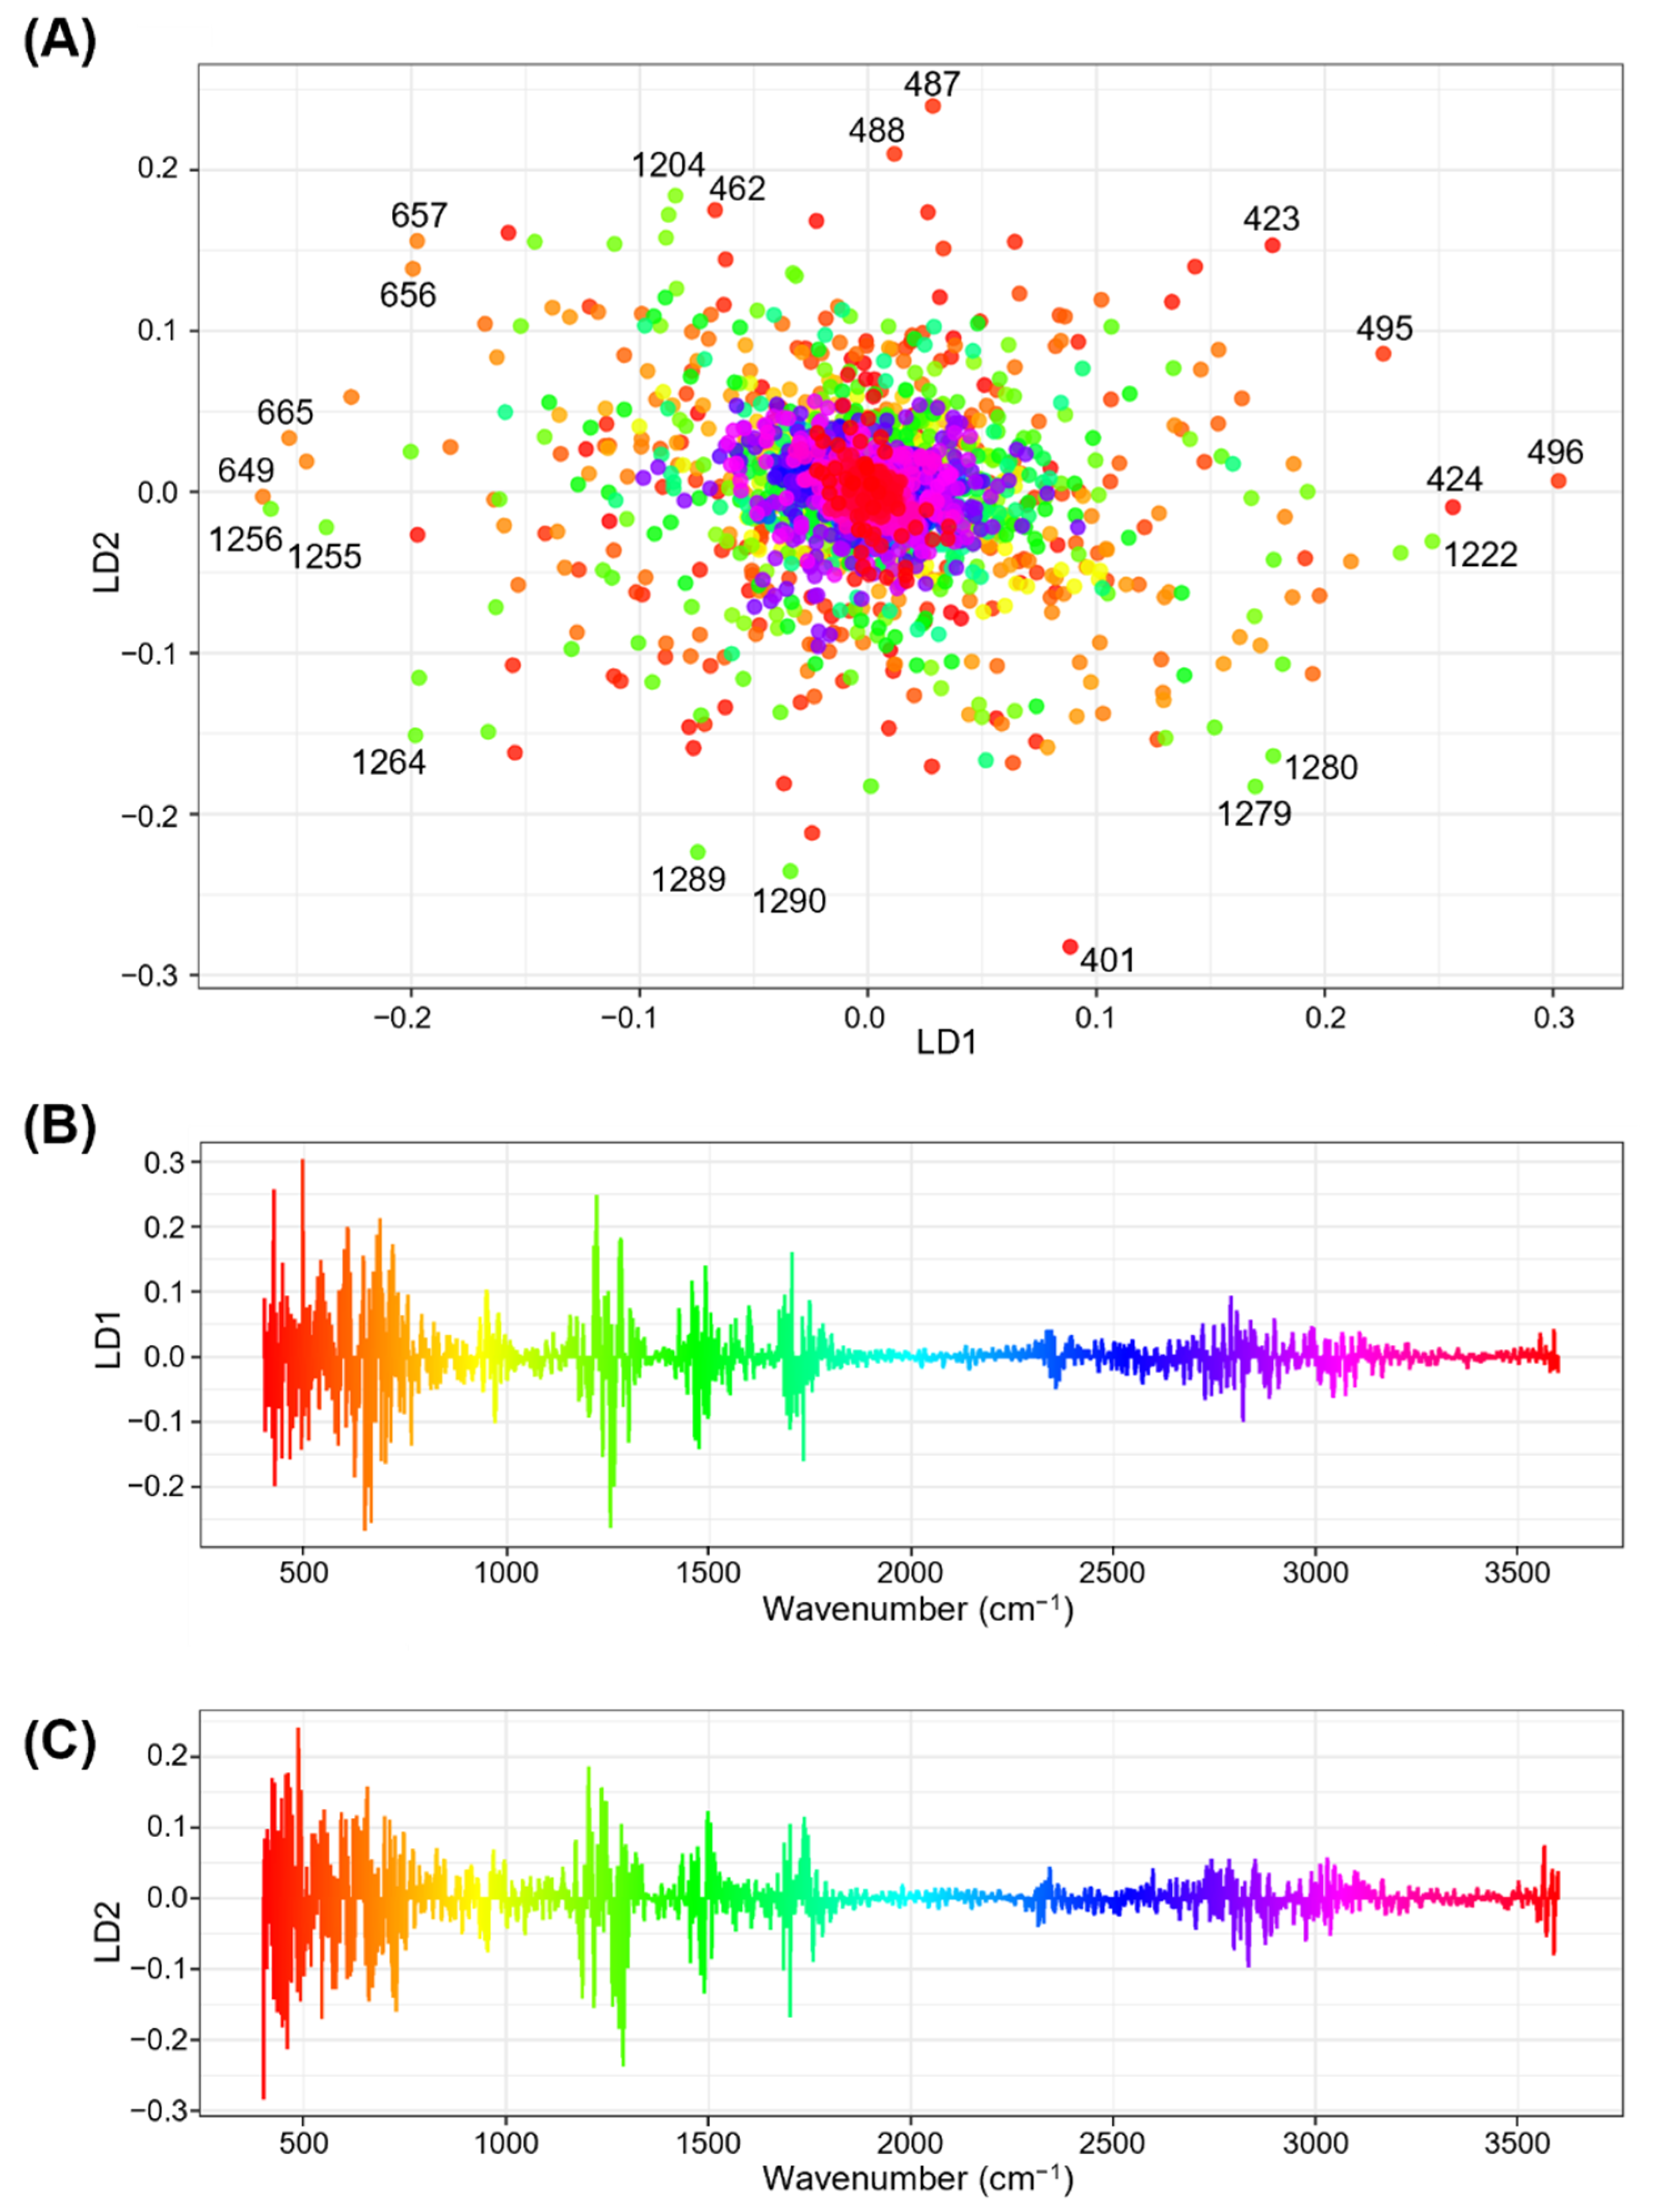
3.5. Linear Discriminant Analysis
4. Conclusions
Supplementary Materials
Author Contributions
Funding
Institutional Review Board Statement
Informed Consent Statement
Data Availability Statement
Acknowledgments
Conflicts of Interest
References
- Shewry, P.R.; Hey, S.J. The contribution of wheat to human diet and health. Food Energy Secur. 2015, 4, 178–202. [Google Scholar] [CrossRef] [PubMed]
- Zhao, C.; Liu, B.; Piao, S.; Wang, X.; Lobell, D.B.; Huang, Y.; Huang, M.; Yao, Y.; Bassu, S.; Ciais, P.; et al. Temperature increase reduces global yields of major crops in four independent estimates. Proc. Natl. Acad. Sci. USA 2017, 114, 9326–9331. [Google Scholar] [CrossRef] [PubMed] [Green Version]
- Mitchell, R.A.C.; Mitchell, V.J.; Driscoll, S.P.; Franklin, J.; Lawlor, D.W. Effects of increased CO2 concentration and temperature on growth and yield of winter wheat at two levels of nitrogen application. Plant Cell Environ. 1993, 16, 521–529. [Google Scholar] [CrossRef]
- Stone, P.J.; Nicolas, M.E. Effect of timing of heat stress during grain filling on two wheat varieties differing in heat tolerance. I. grain growth. Funct. Plant Physiol. 1995, 22, 927–934. [Google Scholar] [CrossRef]
- Semenov, M.A.; Halford, N.G. Identifying target traits and molecular mechanisms for wheat breeding under a changing climate. J. Exp. Bot. 2009, 60, 2791–2804. [Google Scholar] [CrossRef] [PubMed]
- Schittenhelm, S.; Langkamp-Wedde, T.; Kraft, M.; Kottmann, L.; Matschiner, K. Effect of two-week heat stress during grain filling on stem reserves, senescence, and grain yield of European winter wheat cultivars. J. Agron. Crop Sci. 2020, 206, 722–733. [Google Scholar] [CrossRef] [Green Version]
- Matsunaga, S.; Yamasaki, Y.; Toda, Y.; Mega, R.; Akashi, K.; Tsujimoto, H. Stage-specific characterization of physiological response to heat stress in the wheat cultivar Norin 61. Int. J. Mol. Sci. 2021, 22, 6942. [Google Scholar] [CrossRef]
- Solomon, S.; Qin, D.; Manning, M.; Marquis, M.; Averyt, K.; Tignor, M.M.B.; LeRoy Miller, H.; Chen, Z. Climate Change 2007: The Physical Science Basis. Contribution of Working Group I to the Fourth Assessment Report of the Intergovermental Panel on Climate Change; Cambridge University Press: New York, NY, USA, 2007. [Google Scholar]
- Reif, J.C.; Zhang, P.; Dreisigacker, S.; Warburton, M.L.; van Ginkel, M.; Hoisington, D.; Bohn, M.; Melchinger, A.E. Wheat genetic diversity trends during domestication and breeding. Theor. Appl. Genet. 2005, 110, 859–864. [Google Scholar] [CrossRef]
- Gorafi, Y.S.A.; Kim, J.-S.; Elbashir, A.A.E.; Tsujimoto, H. A population of wheat multiple synthetic derivatives: An effective platform to explore, harness and utilize genetic diversity of Aegilops tauschii for wheat improvement. Theor. Appl. Genet. 2018, 131, 1615–1626. [Google Scholar] [CrossRef]
- Balfourier, F.; Bouchet, S.; Robert, S.; de Oliveira, R.; Rimbert, H.; Kitt, J.; Choulet, F.; Paux, E. Worldwide phylogeography and history of wheat genetic diversity. Sci. Adv. 2019, 5, eaav0536. [Google Scholar] [CrossRef] [Green Version]
- Tadesse, W.; Sanchez-Garcia, M.; Assefa, S.G.; Amri, A.; Bishaw, Z.; Ogbonnaya, F.C.; Baum, M. Genetic gains in wheat breeding and its role in feeding the world. Crop Breed. Genet. Genomics 2019, 1, e190005. [Google Scholar] [CrossRef] [Green Version]
- Qaseem, M.F.; Qureshi, R.; Shaheen, H. Effects of pre-anthesis drought, heat and their combination on the growth, yield and physiology of diverse wheat (Triticum aestivum L.) genotypes varying in sensitivity to heat and drought stress. Sci. Rep. 2019, 9, 6955. [Google Scholar] [CrossRef] [PubMed] [Green Version]
- Wang, X.; Hou, L.; Lu, Y.; Wu, B.; Gong, X.; Liu, M.; Wang, J.; Sun, Q.; Vierling, E.; Xu, S. Metabolic adaptation of wheat grain contributes to a stable filling rate under heat stress. J. Exp. Bot. 2018, 69, 5531–5545. [Google Scholar] [CrossRef] [PubMed] [Green Version]
- Qin, D.; Wu, H.; Peng, H.; Yao, Y.; Ni, Z.; Li, Z.; Zhou, C.; Sun, Q. Heat stress-responsive transcriptome analysis in heat susceptible and tolerant wheat (Triticum aestivum L.) by using Wheat Genome Array. BMC Genomics 2008, 9, 432. [Google Scholar] [CrossRef] [Green Version]
- Elbashir, A.A.E.; Gorafi, Y.S.A.; Tahir, I.S.A.; Kim, J.S.; Tsujimoto, H. Wheat multiple synthetic derivatives: A new source for heat stress tolerance adaptive traits. Breed. Sci. 2017, 67, 248–256. [Google Scholar] [CrossRef] [PubMed] [Green Version]
- Elbashir, A.A.; Gorafi, Y.S.; Tahir, I.S.; Elhashimi, A.M.; Abdalla, M.G.; Tsujimoto, H. Genetic variation in heat tolerance-related traits in a population of wheat multiple synthetic derivatives. Breed. Sci. 2017, 67, 483–492. [Google Scholar] [CrossRef] [PubMed] [Green Version]
- Walkowiak, S.; Gao, L.; Monat, C.; Haberer, G.; Kassa, M.T.; Brinton, J.; Ramirez-Gonzalez, R.H.; Kolodziej, M.C.; Delorean, E.; Thambugala, D.; et al. Multiple wheat genomes reveal global variation in modern breeding. Nature 2020, 588, 277–283. [Google Scholar] [CrossRef]
- Iizumi, T.; Ali-Babiker, I.E.A.; Tsubo, M.; Tahir, I.S.; Kurosaki, Y.; Kim, W.; Gorafi, Y.S.; Idris, A.A.; Tsujimoto, H. Rising temperature and increasing demand challenge wheat supply in Sudan. Nat. Food 2021, 2, 19–27. [Google Scholar] [CrossRef]
- Ghatak, A.; Chaturvedi, P.; Weckwerth, W. Metabolomics in plant stress physiology. In Plant Genetics and Molecular Biology; Advances in Biochemical Engineering/Biotechnology Book Series; Springer: Berlin/Heidelberg, Germany, 2018; pp. 187–236. [Google Scholar] [CrossRef]
- Hamany Djande, C.Y.; Pretorius, C.; Tugizimana, F.; Piater, L.A.; Dubery, I.A. Metabolomics: A tool for cultivar phenotyping and investigation of grain crops. Agronomy 2020, 10, 831. [Google Scholar] [CrossRef]
- Matsunaga, S.; Yamasaki, Y.; Mega, R.; Toda, Y.; Akashi, K.; Tsujimoto, H. Metabolome profiling of heat priming effects, senescence, and acclimation of bread wheat induced by high temperatures at different growth stages. Int. J. Mol. Sci. 2021, 22, 13139. [Google Scholar] [CrossRef]
- Sakurai, N. Recent applications of metabolomics in plant breeding. Breed. Sci. 2022, 72, 56–65. [Google Scholar] [CrossRef]
- Bouyanfif, A.; Liyanage, S.; Hewitt, J.E.; Vanapalli, S.A.; Moustaid-Moussa, N.; Hequet, E.; Abidi, N. FTIR imaging detects diet and genotype-dependent chemical composition changes in wild type and mutant C. elegans strains. Analyst 2017, 142, 4727–4736. [Google Scholar] [CrossRef] [PubMed]
- Munz, E.; Rolletschek, H.; Oeltze-Jafra, S.; Fuchs, J.; Guendel, A.; Neuberger, T.; Ortleb, S.; Jakob, P.M.; Borisjuk, L. A functional imaging study of germinating oilseed rape seed. New Phytol. 2017, 216, 1181–1190. [Google Scholar] [CrossRef] [PubMed] [Green Version]
- Petrou, K.; Nielsen, D.A.; Heraud, P. Single-cell biomolecular analysis of coral algal symbionts reveals opposing metabolic responses to heat stress and expulsion. Front. Mar. Sci. 2018, 5, 110. [Google Scholar] [CrossRef] [Green Version]
- Li, H.; Liu, Z.; Mamtimin, A.; Liu, J.; Liu, Y.; Ju, C.; Zhang, H.; Gao, Z. A new linear relation for estimating surface broadband emissivity in arid regions based on FTIR and MODIS products. Remote Sens. 2021, 13, 1686. [Google Scholar] [CrossRef]
- Yalkun, A.; Mamtimin, A.; Liu, S.; Yang, F.; He, Q.; Qi, F.; Liu, Y. Coefficients optimization of the GLASS broadband emissivity based on FTIR and MODIS data over the Taklimakan Desert. Sci. Rep. 2019, 9, 18460. [Google Scholar] [CrossRef] [PubMed] [Green Version]
- McCann, M.C.; Chen, L.; Roberts, K.; Kemsley, E.K.; Sene, C.; Carpita, N.C.; Stacey, N.J.; Wilson, R.H. Infrared microspectroscopy: Sampling heterogeneity in plant cell wall composition and architecture. Physiol. Plant. 1997, 100, 729–738. [Google Scholar] [CrossRef]
- Liu, X.; Renard, C.M.; Bureau, S.; Le Bourvellec, C. Revisiting the contribution of ATR-FTIR spectroscopy to characterize plant cell wall polysaccharides. Carbohydr. Polym. 2021, 262, 117935. [Google Scholar] [CrossRef]
- Zhao, X.; Yang, X.; Shi, Y.; Chen, G.; Li, X. Protein and lipid characterization of wheat roots plasma membrane damaged by Fe and H2O2 using ATR-FTIR method. J. Biophys. Chem. 2013, 4, 28–35. [Google Scholar] [CrossRef] [Green Version]
- Lahlali, R.; Jiang, Y.; Kumar, S.; Karunakaran, C.; Liu, X.; Borondics, F.; Hallin, E.; Bueckert, R. ATR–FTIR spectroscopy reveals involvement of lipids and proteins of intact pea pollen grains to heat stress tolerance. Front. Plant Sci. 2014, 5, 747. [Google Scholar] [CrossRef] [Green Version]
- Westworth, S.; Ashwath, N.; Cozzolino, D. Application of FTIR-ATR spectroscopy to detect salinity response in beauty leaf tree (Calophyllum inophyllum L.). Energy Proc. 2019, 160, 761–768. [Google Scholar] [CrossRef]
- Nikalje, G.C.; Kumar, J.; Nikam, T.D.; Suprasanna, P. FT-IR profiling reveals differential response of roots and leaves to salt stress in a halophyte Sesuvium portulacastrum (L.) L. Biotechnol. Rep. 2019, 23, e00352. [Google Scholar] [CrossRef] [PubMed]
- Osman, S.O.M.; Saad, A.S.I.; Tadano, S.; Takeda, Y.; Konaka, T.; Yamasaki, Y.; Tahir, I.S.A.; Tsujimoto, H.; Akashi, K. Chemical fingerprinting of heat stress responses in the leaves of common wheat by Fourier transform infrared spectroscopy. Int. J. Mol. Sci. 2022, 23, 2842. [Google Scholar] [CrossRef] [PubMed]
- R Core Team. A Language and Environment for Statistical Computing; R Foundation for Statistical Computing: Vienna, Austria, 2020; Available online: http://www.r-project.org/index.html (accessed on 1 October 2020).
- Astatsa. Complex Online Web Statistics Calculator. Available online: https://astatsa.com/ (accessed on 3 April 2022).
- Gupta, N.K.; Agarwal, S.; Agarwal, V.P.; Nathawat, N.S.; Gupta, S.; Singh, G. Effect of short-term heat stress on growth, physiology and antioxidative defense system in wheat seedlings. Acta Physiol. Plant. 2013, 35, 1837–1842. [Google Scholar] [CrossRef]
- Keleş, Y.; Öncel, I. Response of antioxidative defense system to temperature and water stress combinations in wheat seedlings. Plant Sci. 2002, 163, 783–790. [Google Scholar] [CrossRef]
- Stuart, B. Biological Application. In Infrared Spectroscopy: Fundamentals and Applications; Stuart, B., Ed.; John Wiley & Sons Ltd.: Chichester, UK, 2004; pp. 137–165. [Google Scholar]
- Talari, A.C.S.; Martinez, M.A.G.; Movasaghi, Z.; Rehman, S.; Rehman, I.U. Advances in Fourier transform infrared (FTIR) spectroscopy of biological tissues. Appl. Spectrosc. Rev. 2016, 52, 456–506. [Google Scholar] [CrossRef]
- Kamnev, A.A.; Dyatlova, Y.A.; Kenzhegulov, O.A.; Vladimirova, A.A.; Mamchenkova, P.V.; Tugarova, A.V. Fourier transform infrared (FTIR) spectroscopic analyses of microbiological samples and biogenic selenium nanoparticles of microbial origin: Sample preparation effects. Molecules 2021, 26, 1146. [Google Scholar] [CrossRef]
- Ami, D.; Natalello, A.; Mereghetti, P.; Neri, T.; Zanoni, M.; Monti, M.; Doglia, S.M.; Redi, C.A. FT-IR spectroscopy supported by PCA–LDA analysis for the study of embryonic stem cell differentiation. Spectroscopy 2010, 24, 89–97. [Google Scholar] [CrossRef]
- Christou, C.; Agapiou, A.; Kokkinofta, R. Use of FTIR spectroscopy and chemometrics for the classification of carobs origin. J. Adv. Res. 2018, 10, 1–8. [Google Scholar] [CrossRef]
- Tarapoulouzi, M.; Kokkinofta, R.; Theocharis, C.R. Chemometric analysis combined with FTIR spectroscopy of milk and Halloumi cheese samples according to species’ origin. Food Sci. Nutr. 2020, 8, 3262–3273. [Google Scholar] [CrossRef]
- Zhang, Y.; Pan, J.; Huang, X.; Guo, D.; Lou, H.; Hou, Z.; Su, M.; Liang, R.; Xie, C.; You, M.; et al. Differential effects of a post-anthesis heat stress on wheat (Triticum aestivum L.) grain proteome determined by iTRAQ. Sci. Rep. 2017, 7, 3468. [Google Scholar] [CrossRef] [Green Version]
- Kurian, J.K.; Gariepy, Y.; Orsat, V.; Raghavan, V. Microwave-assisted lime treatment and recovery of lignin from hydrothermally treated sweet sorghum bagasse. Biofuels 2015, 6, 341–355. [Google Scholar] [CrossRef]
- Lima, R.B.; dos Santos, T.B.; Vieira, L.G.E.; Ferrarese, M.L.L.; Ferrarese-Filho, O.; Donatti, L.; Boeger, M.R.T.; Petkowicz, C.L.O. Heat stress causes alterations in the cell-wall polymers and anatomy of coffee leaves (Coffea arabica L.). Carbohydr. Polym. 2013, 93, 135–143. [Google Scholar] [CrossRef] [PubMed] [Green Version]
- Stewart, D. Fourier transform infrared microspectroscopy of plant tissues. Appl. Spectrosc. 1996, 50, 357–365. [Google Scholar] [CrossRef]
- Lammers, K.; Arbuckle-Keil, G.; Dighton, J. FTIR study of the changes in carbohydrate chemistry of three New Jersey pine barrens leaf litters during simulated control burning. Soil Biol. Biochem. 2009, 41, 340–347. [Google Scholar] [CrossRef]
- Stuart, B. Biological Applications of Infrared Spectroscopy; ACOL Series; Wiley: Chichester, UK, 1997. [Google Scholar]
- Gorgulu, S.T.; Dogan, M.; Severcan, F. The characterization and differentiation of higher plants by Fourier transform infrared spectroscopy. Appl. Specrosc. 2007, 61, 300–308. [Google Scholar] [CrossRef] [PubMed]
- Mascarenhas, M.; Dighton, J.; Arbuckle, G.A. Characterization of plant carbohydrates and changes in leaf carbohydrate chemistry due to chemical and enzymatic degradation measured by microscopic ATR FTIR spectroscopy. Appl. Spectrosc. 2000, 54, 681–686. [Google Scholar] [CrossRef]
- Baron-Epel, O.; Gharyal, P.K.; Schindler, M. Pectins as mediators of wall porosity in soybean cells. Planta 1988, 175, 389–395. [Google Scholar] [CrossRef]
- Sowa, S.; Connor, K.F.; Towill, L.E. Temperature changes in lipid and protein structure measured by Fourier transform infrared spectrophotometry in intact pollen grains. Plant Sci. 1991, 78, 1–9. [Google Scholar] [CrossRef]
- Oleszko, A.; OlsztyNska-Janus, S.; Walski, T.; Grzeszczuk-Kuć, K.; Bujok, J.; GaBecka, K.; Czerski, A.; Witkiewicz, W.; Komorowska, M. Application of FTIR-ATR spectroscopy to determine the extent of lipid peroxidation in plasma during haemodialysis. Biomed. Res. Int. 2015, 2015, 245607. [Google Scholar] [CrossRef] [Green Version]
- Narayanan, S.; Tamura, P.J.; Roth, M.R.; Prasad, P.V.V.; Welti, R. Wheat leaf lipids during heat stress: I. High day and night temperatures result in major lipid alterations. Plant Cell Environ. 2016, 39, 787–803. [Google Scholar] [CrossRef] [PubMed] [Green Version]
- Xanthopoulos, P.; Pardalos, P.M.; Trafalis, T.B. Linear discriminant analysis. In Robust Data Mining; Springer Briefs in Optimization; Springer: New York, NY, USA, 2012; pp. 27–33. [Google Scholar] [CrossRef]
- Harrison, D.; Rivard, B.; Sánchez-Azofeifa, A. Classification of tree species based on longwave hyperspectral data from leaves, a case study for a tropical dry forest. Int. J. Appl. Earth Obs. Geoinf. 2018, 66, 93–105. [Google Scholar] [CrossRef]
- Álvarez, Á.; Yáñez, J.; Neira, Y.; Castillo-Felices, R.; Hinrichsen, P. Simple distinction of grapevine (Vitis vinifera L.) genotypes by direct ATR-FTIR. Food Chem. 2020, 328, 127164. [Google Scholar] [CrossRef]
- Bona, E.; Marquetti, I.; Link, J.V.; Makimori, G.Y.F.; da Costa Arca, V.; Lemes, A.L.G.; Ferreira, J.M.G.; dos Santos Scholz, M.B.; Valderrama, P.; Poppi, R.J. Support vector machines in tandem with infrared spectroscopy for geographical classification of green arabica coffee. LWT Food Sci. Technol. 2017, 76, 330–336. [Google Scholar] [CrossRef]
- Setser, A.L.; Smith, R.W. Comparison of variable selection methods prior to linear discriminant analysis classification of synthetic phenethylamines and tryptamines. Forensic Chem. 2018, 11, 77–86. [Google Scholar] [CrossRef]
- Stuart, B. Spectral analysis. In Infrared Spectroscopy: Fundamentals and Applications; Stuart, B., Ed.; John Wiley & Sons Ltd.: Chichester, UK, 2004; pp. 45–70. [Google Scholar]
- Zampieri, M.; Ceglar, A.; Dentener, F.; Toreti, A. Wheat yield loss attributable to heat waves, drought and water excess at the global, national and subnational scales. Environ. Res. Lett. 2017, 12, 064008. [Google Scholar] [CrossRef]
- Paymard, P.; Yaghoubi, F.; Nouri, M.; Bannayan, M. Projecting climate change impacts on rainfed wheat yield, water demand, and water use efficiency in northeast Iran. Theor. Appl. Climatol. 2019, 138, 1361–1373. [Google Scholar] [CrossRef]


Publisher’s Note: MDPI stays neutral with regard to jurisdictional claims in published maps and institutional affiliations. |
© 2022 by the authors. Licensee MDPI, Basel, Switzerland. This article is an open access article distributed under the terms and conditions of the Creative Commons Attribution (CC BY) license (https://creativecommons.org/licenses/by/4.0/).
Share and Cite
Osman, S.O.M.; Saad, A.S.I.; Tadano, S.; Takeda, Y.; Yamasaki, Y.; Tahir, I.S.A.; Tsujimoto, H.; Akashi, K. Probing Differential Metabolome Responses among Wheat Genotypes to Heat Stress Using Fourier Transform Infrared-Based Chemical Fingerprinting. Agriculture 2022, 12, 753. https://doi.org/10.3390/agriculture12060753
Osman SOM, Saad ASI, Tadano S, Takeda Y, Yamasaki Y, Tahir ISA, Tsujimoto H, Akashi K. Probing Differential Metabolome Responses among Wheat Genotypes to Heat Stress Using Fourier Transform Infrared-Based Chemical Fingerprinting. Agriculture. 2022; 12(6):753. https://doi.org/10.3390/agriculture12060753
Chicago/Turabian StyleOsman, Salma O. M., Abu Sefyan I. Saad, Shota Tadano, Yoshiki Takeda, Yuji Yamasaki, Izzat S. A. Tahir, Hisashi Tsujimoto, and Kinya Akashi. 2022. "Probing Differential Metabolome Responses among Wheat Genotypes to Heat Stress Using Fourier Transform Infrared-Based Chemical Fingerprinting" Agriculture 12, no. 6: 753. https://doi.org/10.3390/agriculture12060753