1. Introduction
Agriculture is an economic sector that relies on many variables that cannot be easily controlled (i.e., temperature, solar radiation, soil properties). Unfavorable growing conditions can significantly change the productivity of a field in a short time period [
1]. Over the years, with the growth of large-scale agriculture, a need for a quick and reliable assessment of plant physiological state emerged.
Physiological condition reflects the yield potential of plants, which is significantly influenced by climatic conditions, soil fertilization and plant nutrition. Symptoms caused by unfavorable climatic conditions and improper fertilization are often observed in plants. These are related to incorrect photosynthesis and nutrient deficiencies or excesses. Precise assessment of the physiological state of plants conducted mainly on the basis of visual diagnostics (observation of plants and identification of alarming symptoms) or chemical analysis of the substrate, nutrient solutions and plants is not a fully effective method. Accurate assessment of the condition of plants in relation to their nutritional and climatic requirements made with the use of a scanner will increase the efficiency of the system of plant production advisory by rationalizing feeding strategies and optimizing plant production conditions. Thus, it will make it possible to optimize production, and precise diagnostics allowing to conduct rational fertilization will also influence environmental and social aspects.
Different diagnostic methods are used to assess the physiological state of plants, but all are based on chemical analysis of soil and plants and observation of plant appearance, which significantly extends the determination of the cause of occurring symptoms. The subject matter of this research project, a multispectral method of determining the nutritional status of plants, gives the possibility for a quick assessment of the physiological state of plants, allowing measurements and presentations of agrotechnical recommendations in the real conditions of cultivation of a particular plant, which is extremely important for large areas of crops. Therefore, it allows one to quickly verify the problems associated with feeding plants, thereby reducing the incidence of diseases and pests on plants.
Optimizing agricultural production with a cheap and reliable multispectral method of determining the nutritional status of plants will correct errors in fertilization and plant nutrition while reducing the use of crop protection products. It provides opportunities for precise plant fertilization and application of plant protection products, which will increase the resistance of plants to biotic (pathogens) and abiotic (climate) stress. Fast diagnosis and proper nutrition of plants will improve the quantity and quality of obtained crops and increase the nutritional value of plants, while reducing the amount of harmful substances (pesticides, nitrates, heavy metals) and therefore having a positive impact on consumer safety. It will also eliminate excessive feeding of plants, which will have a positive impact on limiting the use of fertilizers and thus reduce soil and groundwater contamination with components originating from fertilizers.
Sustainable growth and development of plants means that their metabolism takes place at the highest energy level that the plant can achieve under current environmental conditions. This means that the products of photosynthesis and carbon assimilation are efficiently distributed in the plant, which then produces active green matter and the most valuable generative organs. These interrelationships are used in crop production for maximum yield with high commercial quality. However, due to often unfavorable climatic conditions both in the field and under cover production, the natural physiological processes of the plants are disrupted and they do not achieve maximum yield and quality. In traditional plant production, the remedy is soil fertilization and plant nutrition conducted on the basis of chemical analyses of the substrate, nutrients and plants, and often only on the basis of visual diagnosis (observation of plants and identification of alarming symptoms). However, the results of chemical analyses reflect only the condition of the sample at the time of sampling. It is also not possible to assess from them what caused any disorders or how much they modified the entire plant organism. Visual diagnosis is subject to the “error of knowledge and skill” of the person making the observations. These aspects cause crops to be grown according to a “human point of view” and do not take into account the actual condition and requirements of the plants. This results in the use of excessive or ill-balanced doses of fertilizers, biostimulants or even plant protection products (susceptibility to disease infections and pest activity is often dependent on plant vigor). The improper use of such inputs is a burden on the environment and generates problems with the biological quality of plant products and even their safety for consumers.
Classical spectroscopic methods provide a single spectrum per measurement comprising overall chemical information from the whole sample volume, while hyperspectral imaging provides thousands of spectra combined into a spectral image where each pixel corresponds to one spectrum. This approach enables obtaining not only the chemical signature of a given material but also a correlation of chemical information with its precise localization within the sample [
2]. The application of hyperspectral imaging varies from a micro-scale or even molecular level in biomedicine and biological samples to landscape or field scale in agriculture, geology and astronomy [
2]. In agriculture, it was first used to determine physical properties such as leaf size or leaf area index [
2]. Further development of this technique allowed for differentiation between various plants based, e.g., on pigment concentration for monitoring plant growth and photosynthetic productivity potential, fertilization efficiency, and finally for detection of the early onset of plant diseases [
2,
3].
To avoid the loss of crops and gain maximum yield, different methods of remote sensing (i.e., RGB, near-infrared (NIR), far-infrared (FIR; thermal), lidar, multi- and hyper-spectral) were introduced for detection of early signs of malnutrition or disease in plants [
4,
5]. Near-infrared (NIR) spectroscopy has been known in agriculture since the 1960s [
2,
6], but since it lacks spectral range and precision, it has been combined with other techniques to become multispectral imaging [
2]. Apart from NIR, broadbands detected by the multispectral sensors comprise RGB, ultraviolet light, red edge and/or thermal bands [
4]. A combination of these can give voluminous information regarding plant nutritional status, and thus be helpful in crop maintenance.
1.1. Elements and Their Function
Two elements that play a vital role in plant growth and nutritional status are nitrogen (N) and calcium (Ca). An appropriate amount of available nitrogen is the key to ensuring maximum plant growth. It plays a role in the growth rate of leaves and fruit quality. Not only does nitrogen deficiency limit plant growth more often than the lack of any other plant nutrient, additionally, plants exposed to its excess are unable to develop roots properly and turn brown and wither [
7].
Plant growth and fruit development also strongly depend on the calcium supply. Calcium is a macronutrient required for cell elongation and cell division [
8], activation of enzymes involved in biosynthesis [
9], and regulation of many metabolic functions [
10]. Ca deficiencies are first seen in the youngest parts of the plant (i.e., young leaves), where the reduction in growth rate is followed by deformations, and chlorosis leading to necrosis [
11]. Interestingly, Ca deficiency often occurs in soils rich in this element [
12]. This may happen when low temperature limits Ca transport in roots [
13]. Unfortunately, these problems can only be identified at the time of the onset of symptoms, while the disease develops earlier, in a way imperceptible to the naked eye. Thus, it seems advisable to develop a remote sensing method that allows for routine check-ups of plant nutritional status at the cultivation site.
1.2. Neural Networks and Computer Vision
A Convolutional Neural Network (CNN) is a class of networks, most commonly applied in computer image processing. CNN is a Deep Learning algorithm designed to automatically and adaptively learn spatial hierarchies of features. For a few years, CNNs have been dominant in various computer vision systems. They have excellent results in video processing, object recognition, picture classification and segmentation [
14].
According to the publication “A review of the use of convolutional neural networks in agriculture” from
The Journal of Agricultural Science in 2018, at that time only 23 research efforts employing CNN existed for addressing various agricultural problems [
15]. This shows that the field of image analysis using artificial intelligence in agriculture is a very new issue. Neural Networks and computer vision have become increasingly important for precision agriculture, which is why more and more publications on this topic have appeared in the last three years [
16,
17,
18].
2. Methodology
The present study aimed to develop technology enabling the assessment of the physiological state and nutrition of plants based on multispectral imaging using Agroscanner and a dedicated IT analytical system for further data analysis based on Neural Networks.
To achieve this goal, we constructed an innovative low-8ju mobile device, i.e., Agroscanner, based on multispectral measurements at a macro-scale (1 pixel less than 1mm2 of a scanned plant). The device was tested on reference crops which were used to simulate deficiencies in fertilization that may occur in real crops, divided into 5 fertilizer groups. The device is supported with an IT analytical system created to achieve automatic analysis of the collected measurements. The main goal of the system was to determine the correct fertilizer group of a particular measurement. Based on that information, farmers can adjust fertilization schemes to maximize future harvests.
2.1. Agroscanner
One of the challenges of the project was to create an optical system that would allow efficient performance of multispectral measurements in field conditions. The system had to take into account different requirements:
- -
Variable optical measurement conditions;
- -
The ability to perform measurements in light winds;
- -
Necessity of recording parameters such as temperature, humidity and GPS position;
- -
Low manufacturing cost.
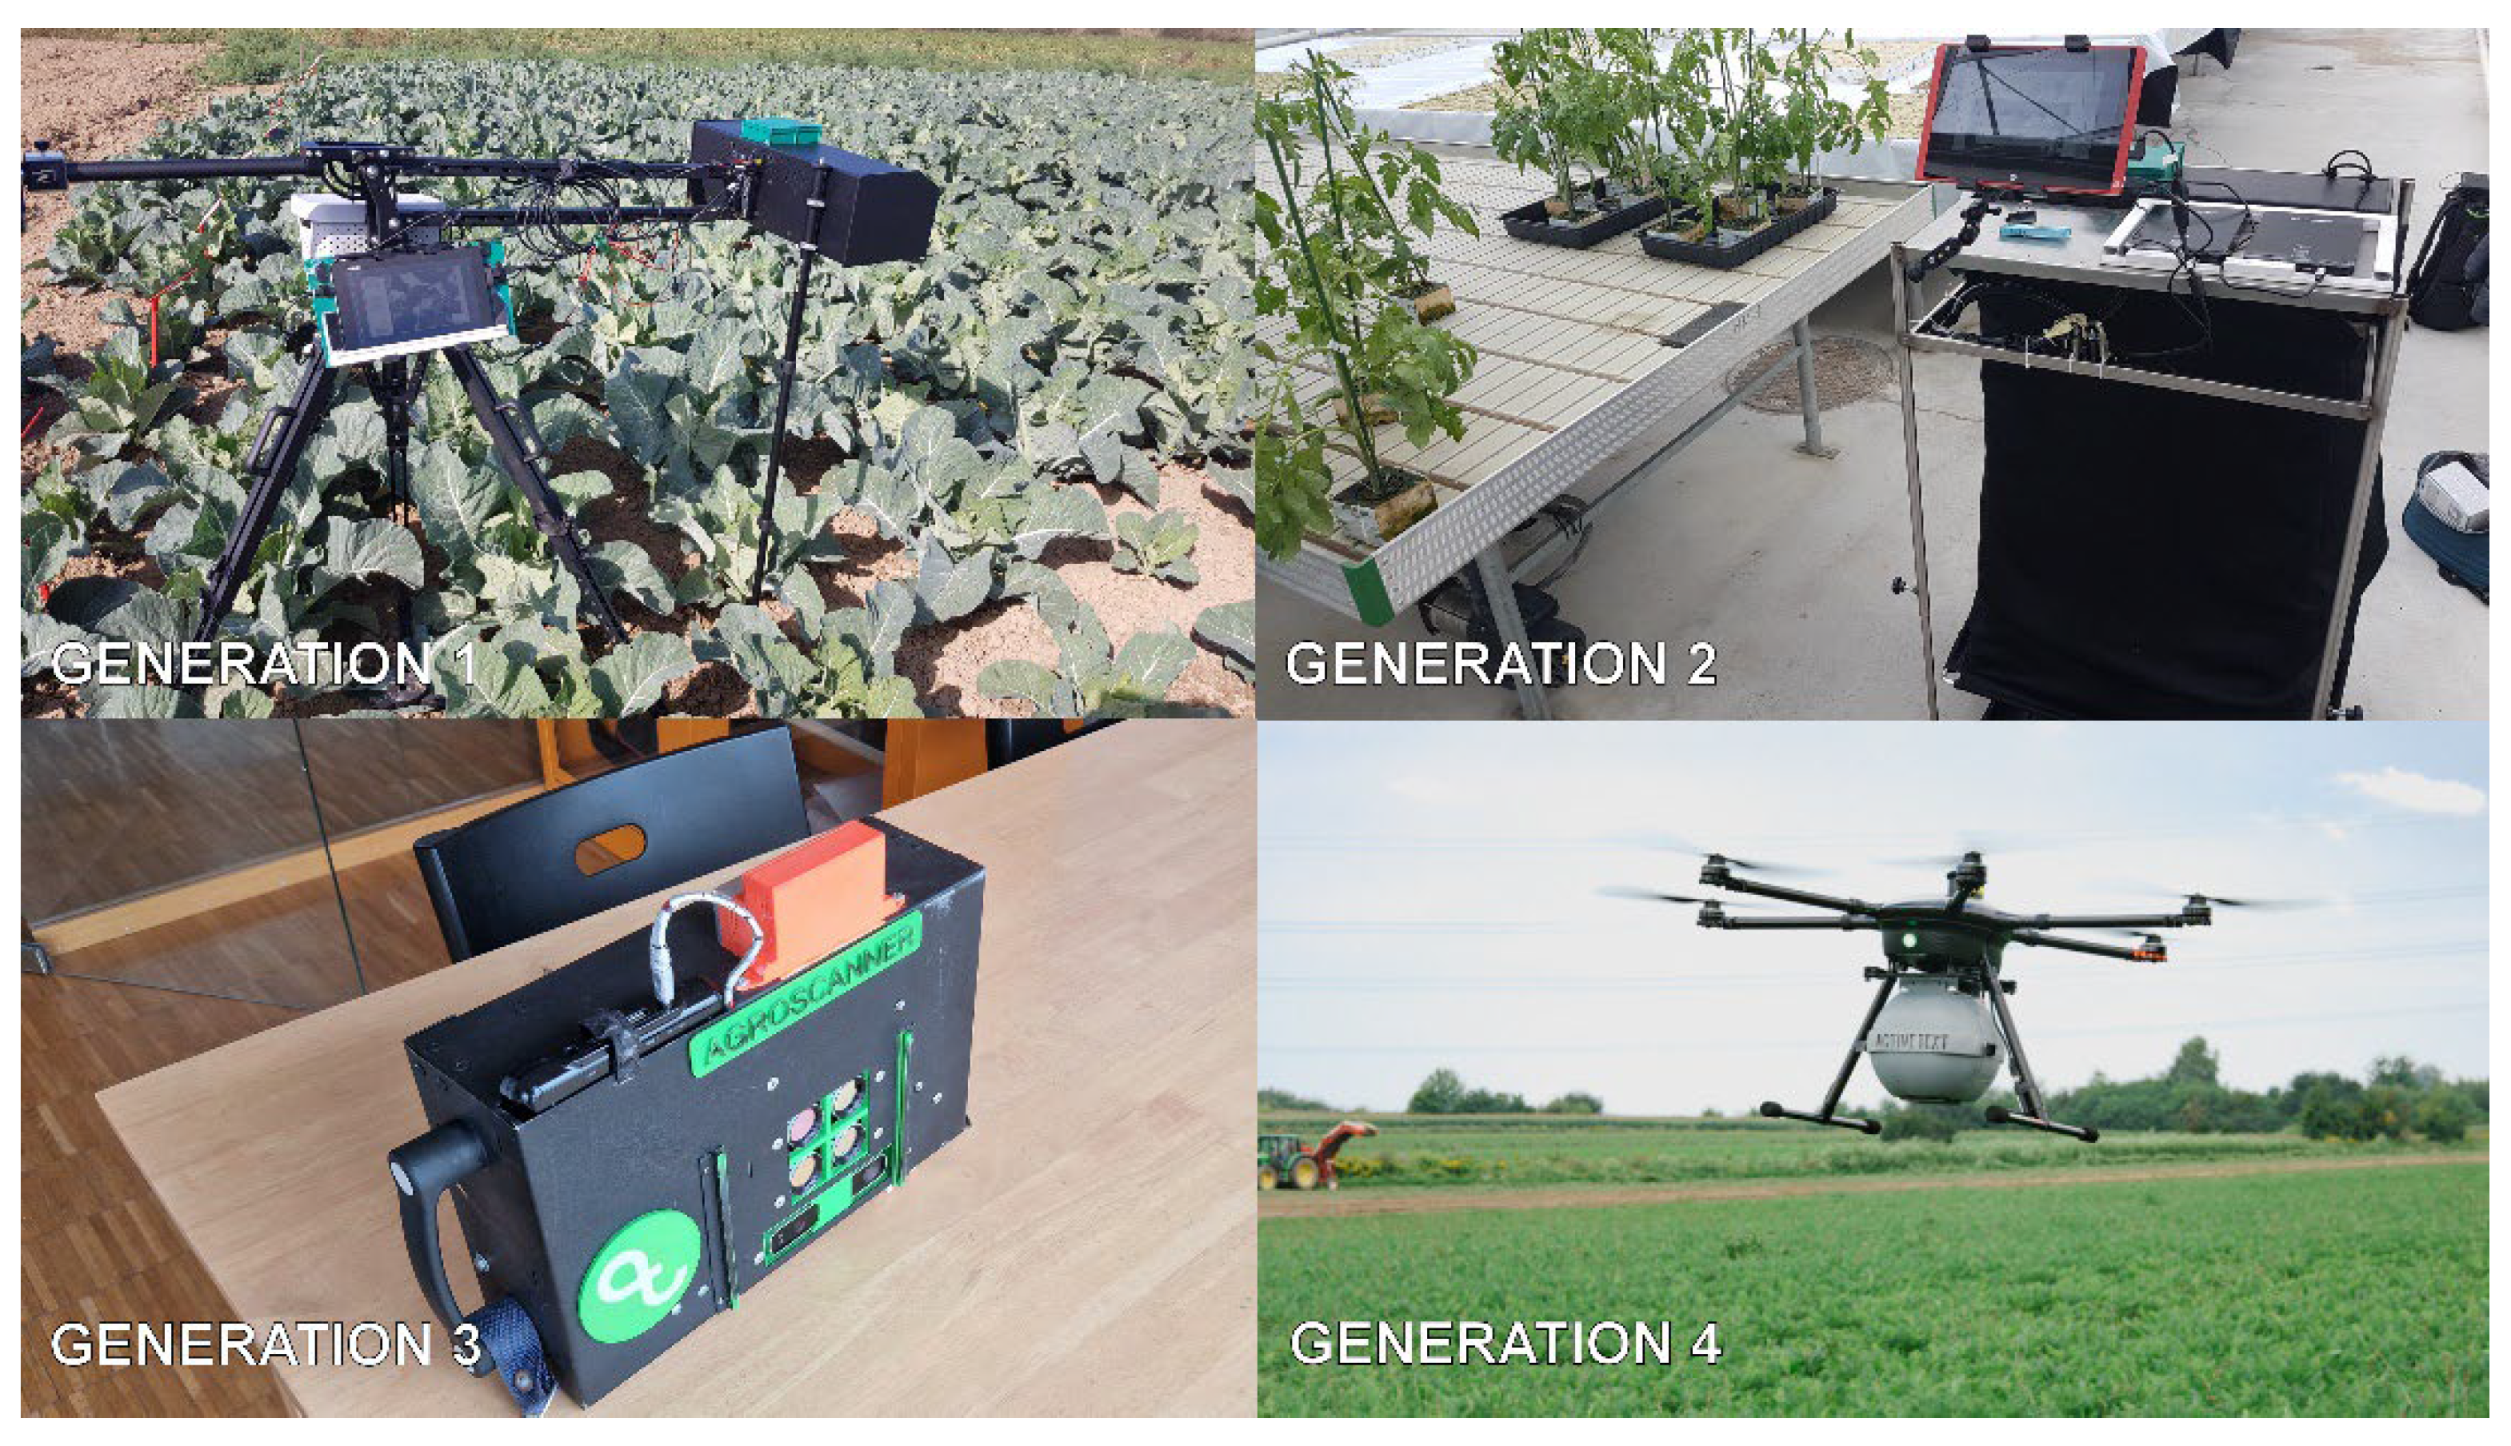
During the project, 4 prototypes of the optical system were created, from a prototype based on a single camera with a filter turret (used in astrophotography) to a lightweight system of 4 spectral cameras (
Figure 1). During the development of the prototypes, different approaches to lighting the measurements were tested, from artificial lighting with daylight blocking to a system using daylight with advanced image normalization techniques. Each change in the optical system forced a change in the algorithms for normalization and analysis of the measurements.
Finally, the Agroscanner is a device constructed by Active Text. Krakow, Poland designed to perform multispectral images based on four simultaneously working spectral cameras—allowing for the collection of 19 images per second. The Agroscanner comprises a Basler daA1600-60um (CS-Mount) camera with a 1/1.8” Teledyne e2v EV76C570 CMOS image sensor providing mono-color images at 60 fps in 2MP resolution (1600 × 1200 px). The device is designed to capture crop images on a macro-scale: one pixel corresponds to less than 1 mm2 of a real plant. This approach enabled us to build an IT analytical system based on the features of both plants and scans (e.g., soil mask-out, leaf vein detection, shape detection, etc.), which was impossible with the currently used high-attitude drone crop scanning.
Each of four cameras is equipped with the following 10 nm Narrow-Band Filter: 470, 550, 640 and 850 nm. Apart from cameras, Agroscanner is equipped with sensors enabling to control both external conditions and geolocation:
Temperature sensor—(“AirTemperature”);
The first light sensor—(“AmbientLight”);
Second light sensor—(“SurfaceAmbientLight”);
UV sensor—(“UV”);
GPS—(“Gps”);
Humidity sensor—(“AirHumidity”);
Compass—(“SurfaceCompass”);
Accelerometer—(“SurfaceAccelerometer”);
Gyroscope—(“SurfaceGyrometer”).
The whole unit is controlled by a central computer based on an Intel i5 CPU, to be able to perform preliminary computer vision analysis. The device is battery powered, allowing up to 60 min of device work.
The final prototype is the outcome of a four-year-long research project and has multiple versions. In most cases, the Agroscanner is used as a handheld device, but the company has also created a drone version.
2.2. Reference and Experimental Crops
The crops were chosen based on their properties, regarding their specific demand for elements and fertilizers and their growth period. The project was focused on cauliflower (Brassica oleracea L. var. botrytis L.)—varieties Gohan F1, Cabral F1 and David F1.
One of the main parts of the project was reference crops grown under specific conditions designed to simulate defined deficiencies in fertilization that may occur in real crops. The following fertilizer groups were defined:
Standard medium (compliant with the nutritional requirements of cauliflower seedlings) with the content of macronutrients: N-NO3 114 mg/L, P 44 mg/L, K 230 mg/L, Mg 49 mg/L and Ca 126 mg/L, Cl 13 mg/L, S-SO4 102 mg/L and the full spectrum of micronutrients;
medium with an increased amount of N 186 mg/L (including N-NO3 160 mg/L, N-NH4 26 mg/L);
medium with a reduced amount of N 60 mg/L with an increased amount of Ca 208 mg/L;
medium with a reduced amount of Ca 88 mg/L.
Crops were monitored by agronomists during the multispectral measurements with the Agroscanner. Additionally, both soil and leaf chemical analyses were conducted simultaneously. Along with the project, cauliflower was cultivated in phytotrons and greenhouses located in the Research Institute of Horticulture, Skierniewice, Poland, and in arable fields scattered over three geographically distant locations: the community of Igolomia-Wawrzenczyce, Malopolska Voivodeship, Poland; community of Pacanow, Swietokrzyskie Voivodeship, Poland; and community of Obrazow, Swietokrzyskie Voivodeship, Poland. Arable fields enabled us to develop normalization and image morphing algorithms in various weather conditions. On the other hand, greenhouses crops which had much more supervised conditions were used to build the final analytical system.
In greenhouses, seedlings were grown in phytotron model 730 DD INOX from Biosell, allowing precise control of temperature (day: +10 °C to +40 °C; night: +3 °C to +40 °C), humidity (30% to 90% RH) and light intensity (LED lamps). Cauliflower seeds were sown into mini rockwool cubes (AO block) soaked in water and placed in vegetation chambers—phytotrons, under optimal climatic conditions (humidity 70–75%, temperature 22 °C, light period 12 h). After germination, seedlings were placed in rockwool seedling cubes (10 × 10 × 7.5 cm) soaked in standard nutrient solution and re-inserted into vegetation chambers, gradually changing the temperature to that appropriate for the given growth stage, i.e., from 20 °C after picking to 16 °C at the stage of at least 4 leaves. After rooting the quilt, each of the objects was fed with a nutrient solution with specific N and Ca content. Plants were fertigated using the underseeded method.
Observations and measurements were made at intervals of 2–3 and 7 days, starting from the stage of 2 proper leaves (i.e., about a week after the introduction of differentiated nutrient solution) until obtaining seedlings that were ready for planting (4 weeks). Next, ready seedlings were transferred to the greenhouse for further cultivation.
2.3. Crop Monitoring
Observations and measurements can be divided into two categories:
Ongoing monitoring process—observations made every 2–3 and every 7 days, starting with the appearance of two true leaves (ca. one week after the introduction of diversified medium) until the seedling was ready to be planted (ca. 4 weeks).
Monitoring during Agroscanner measurement—soli and leaf samples were taken during Agroscanner measurements for subsequent chemical analysis.
2.4. IT Analytical System
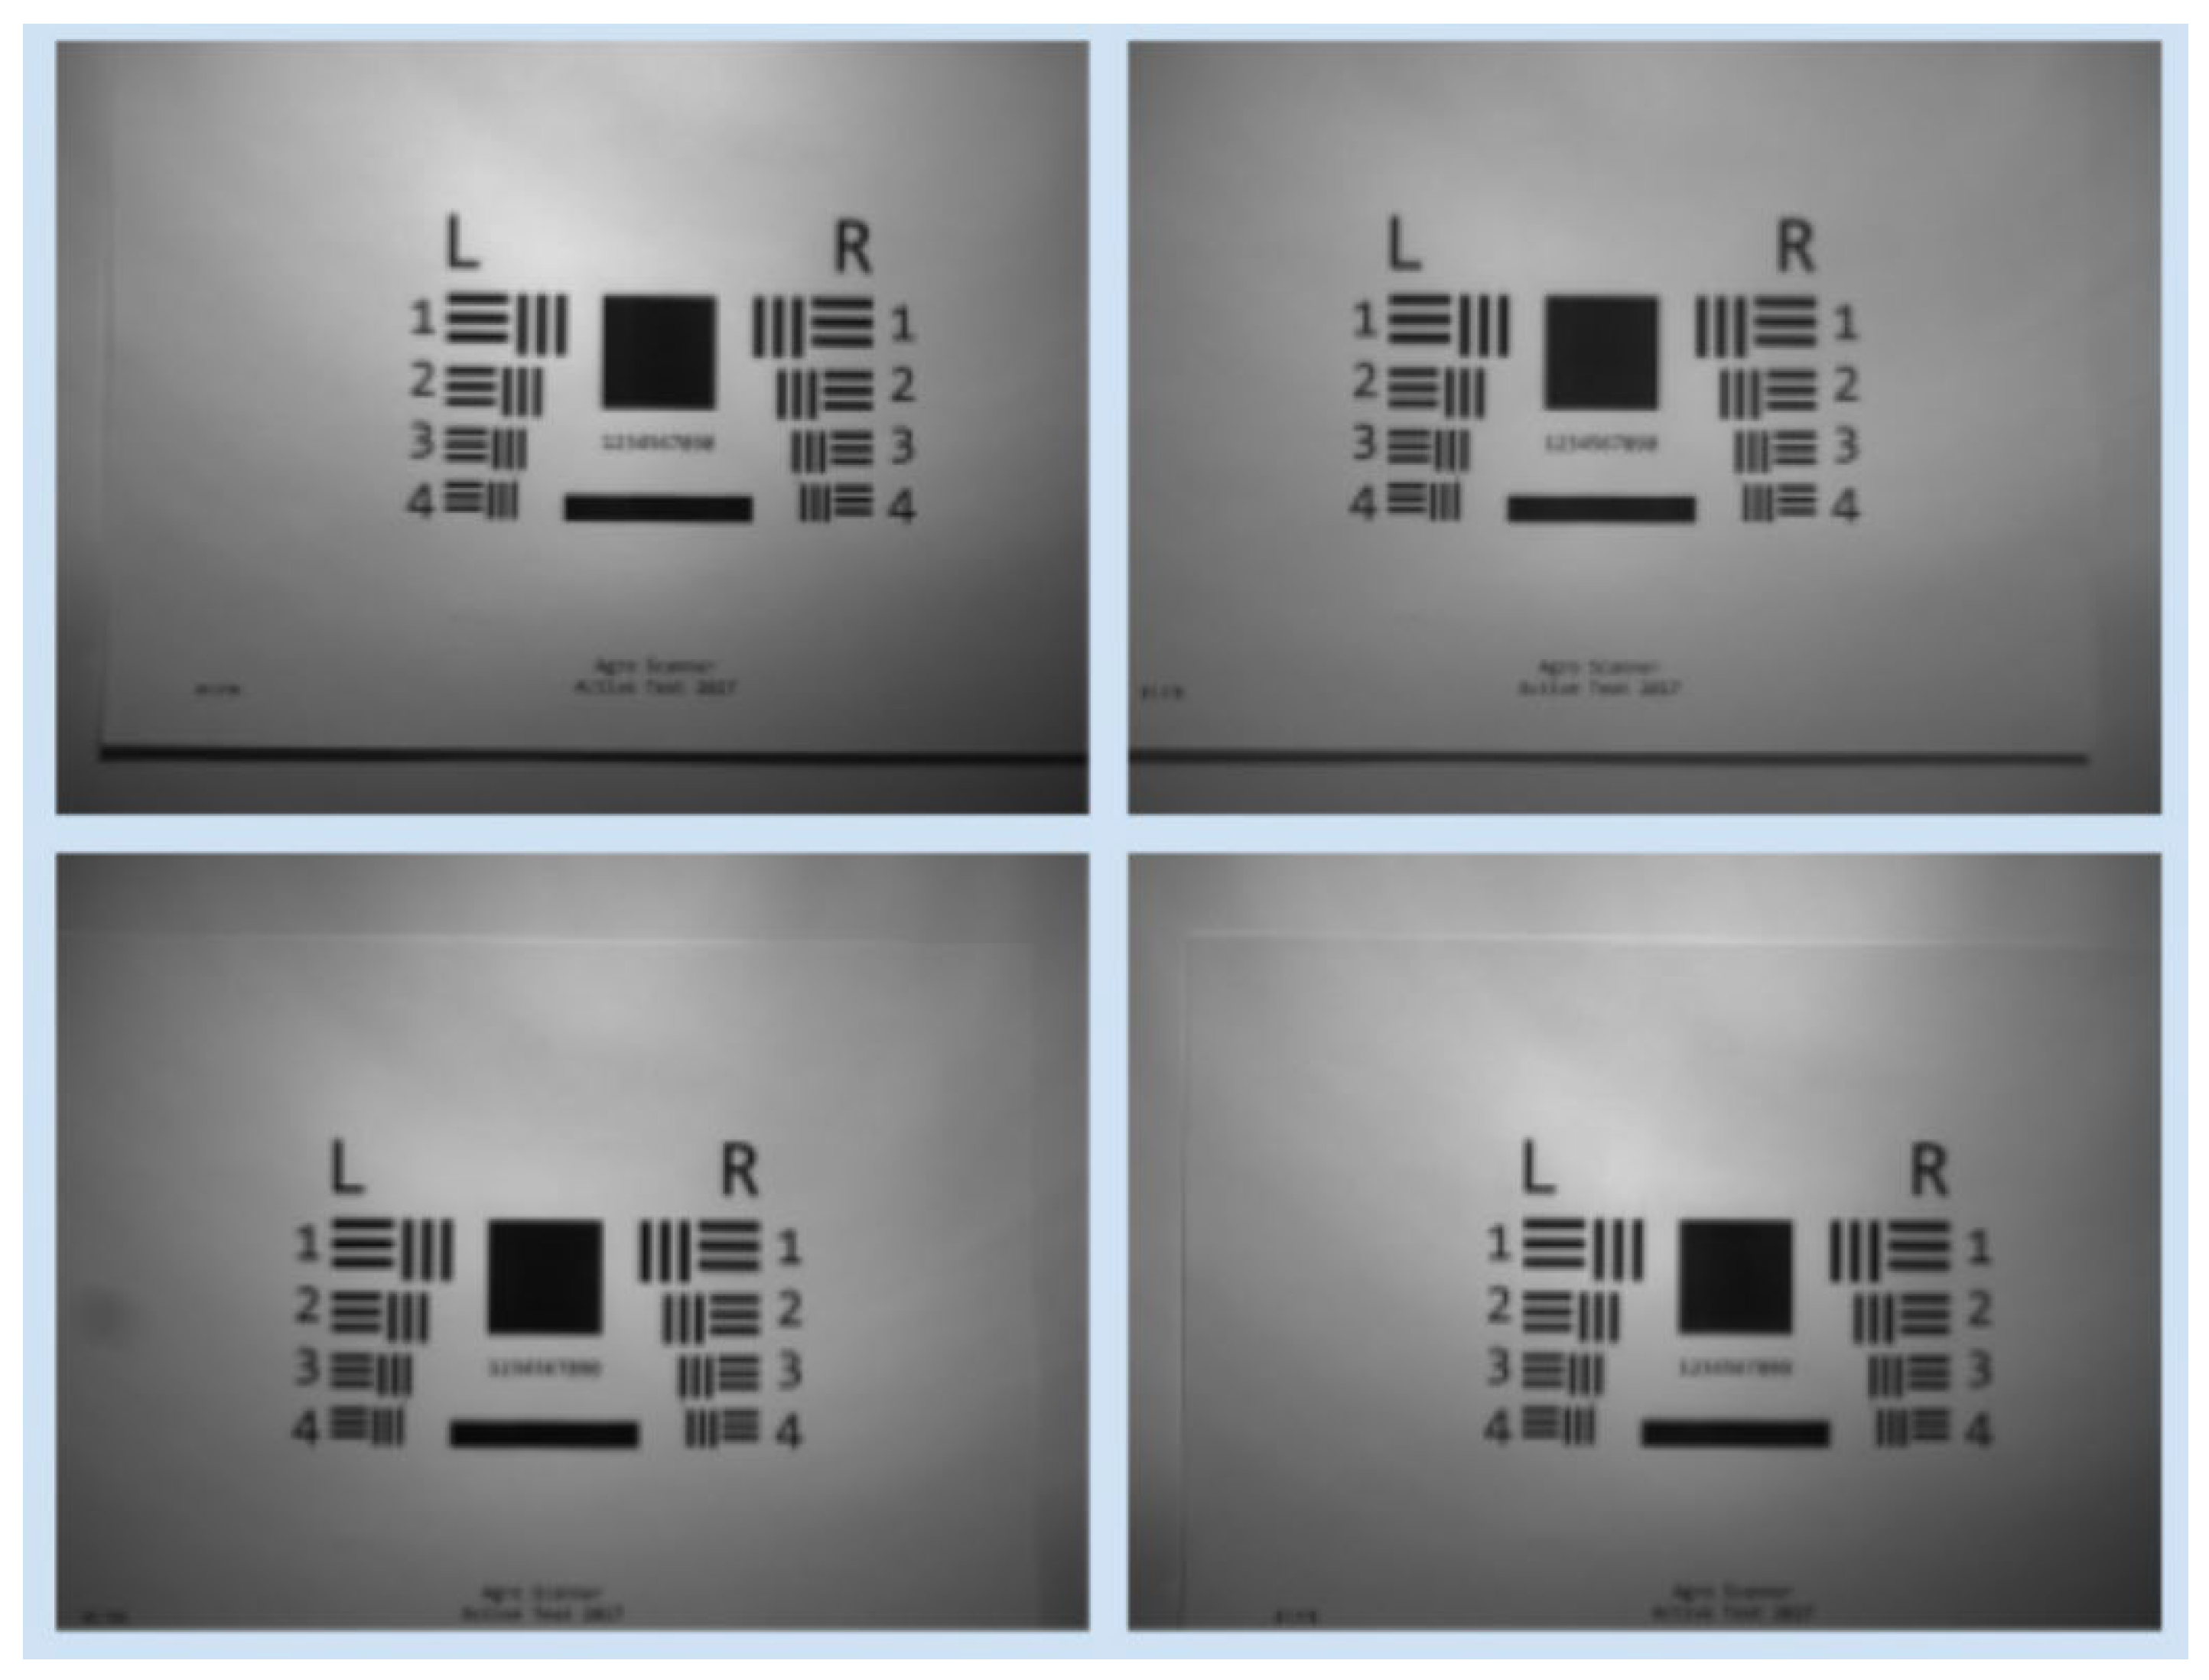
Before each series of measurements, the device was calibrated, to check the operation of all cameras, image sharpness, the relative position of images recorded by different cameras and the operation of additional sensors. The calibration page was printed on a carbon-based tonner, so images look almost the same in all wavelengths, which makes it much easier to analyze and calibrate.
Figure 2 shows the images captured by all four cameras. Due to the translation of the photos, calibration images were recorded to enable the analysis of acquired data.
Each plant was photographed from different perspectives, and the total number of images of one object equaled 30, each of them comprising 4 corresponding pictures from each camera (captured at 470, 550, 640 and 850 nm wavelength). After measurement completion, recorded data were automatically sent to Active Text servers.
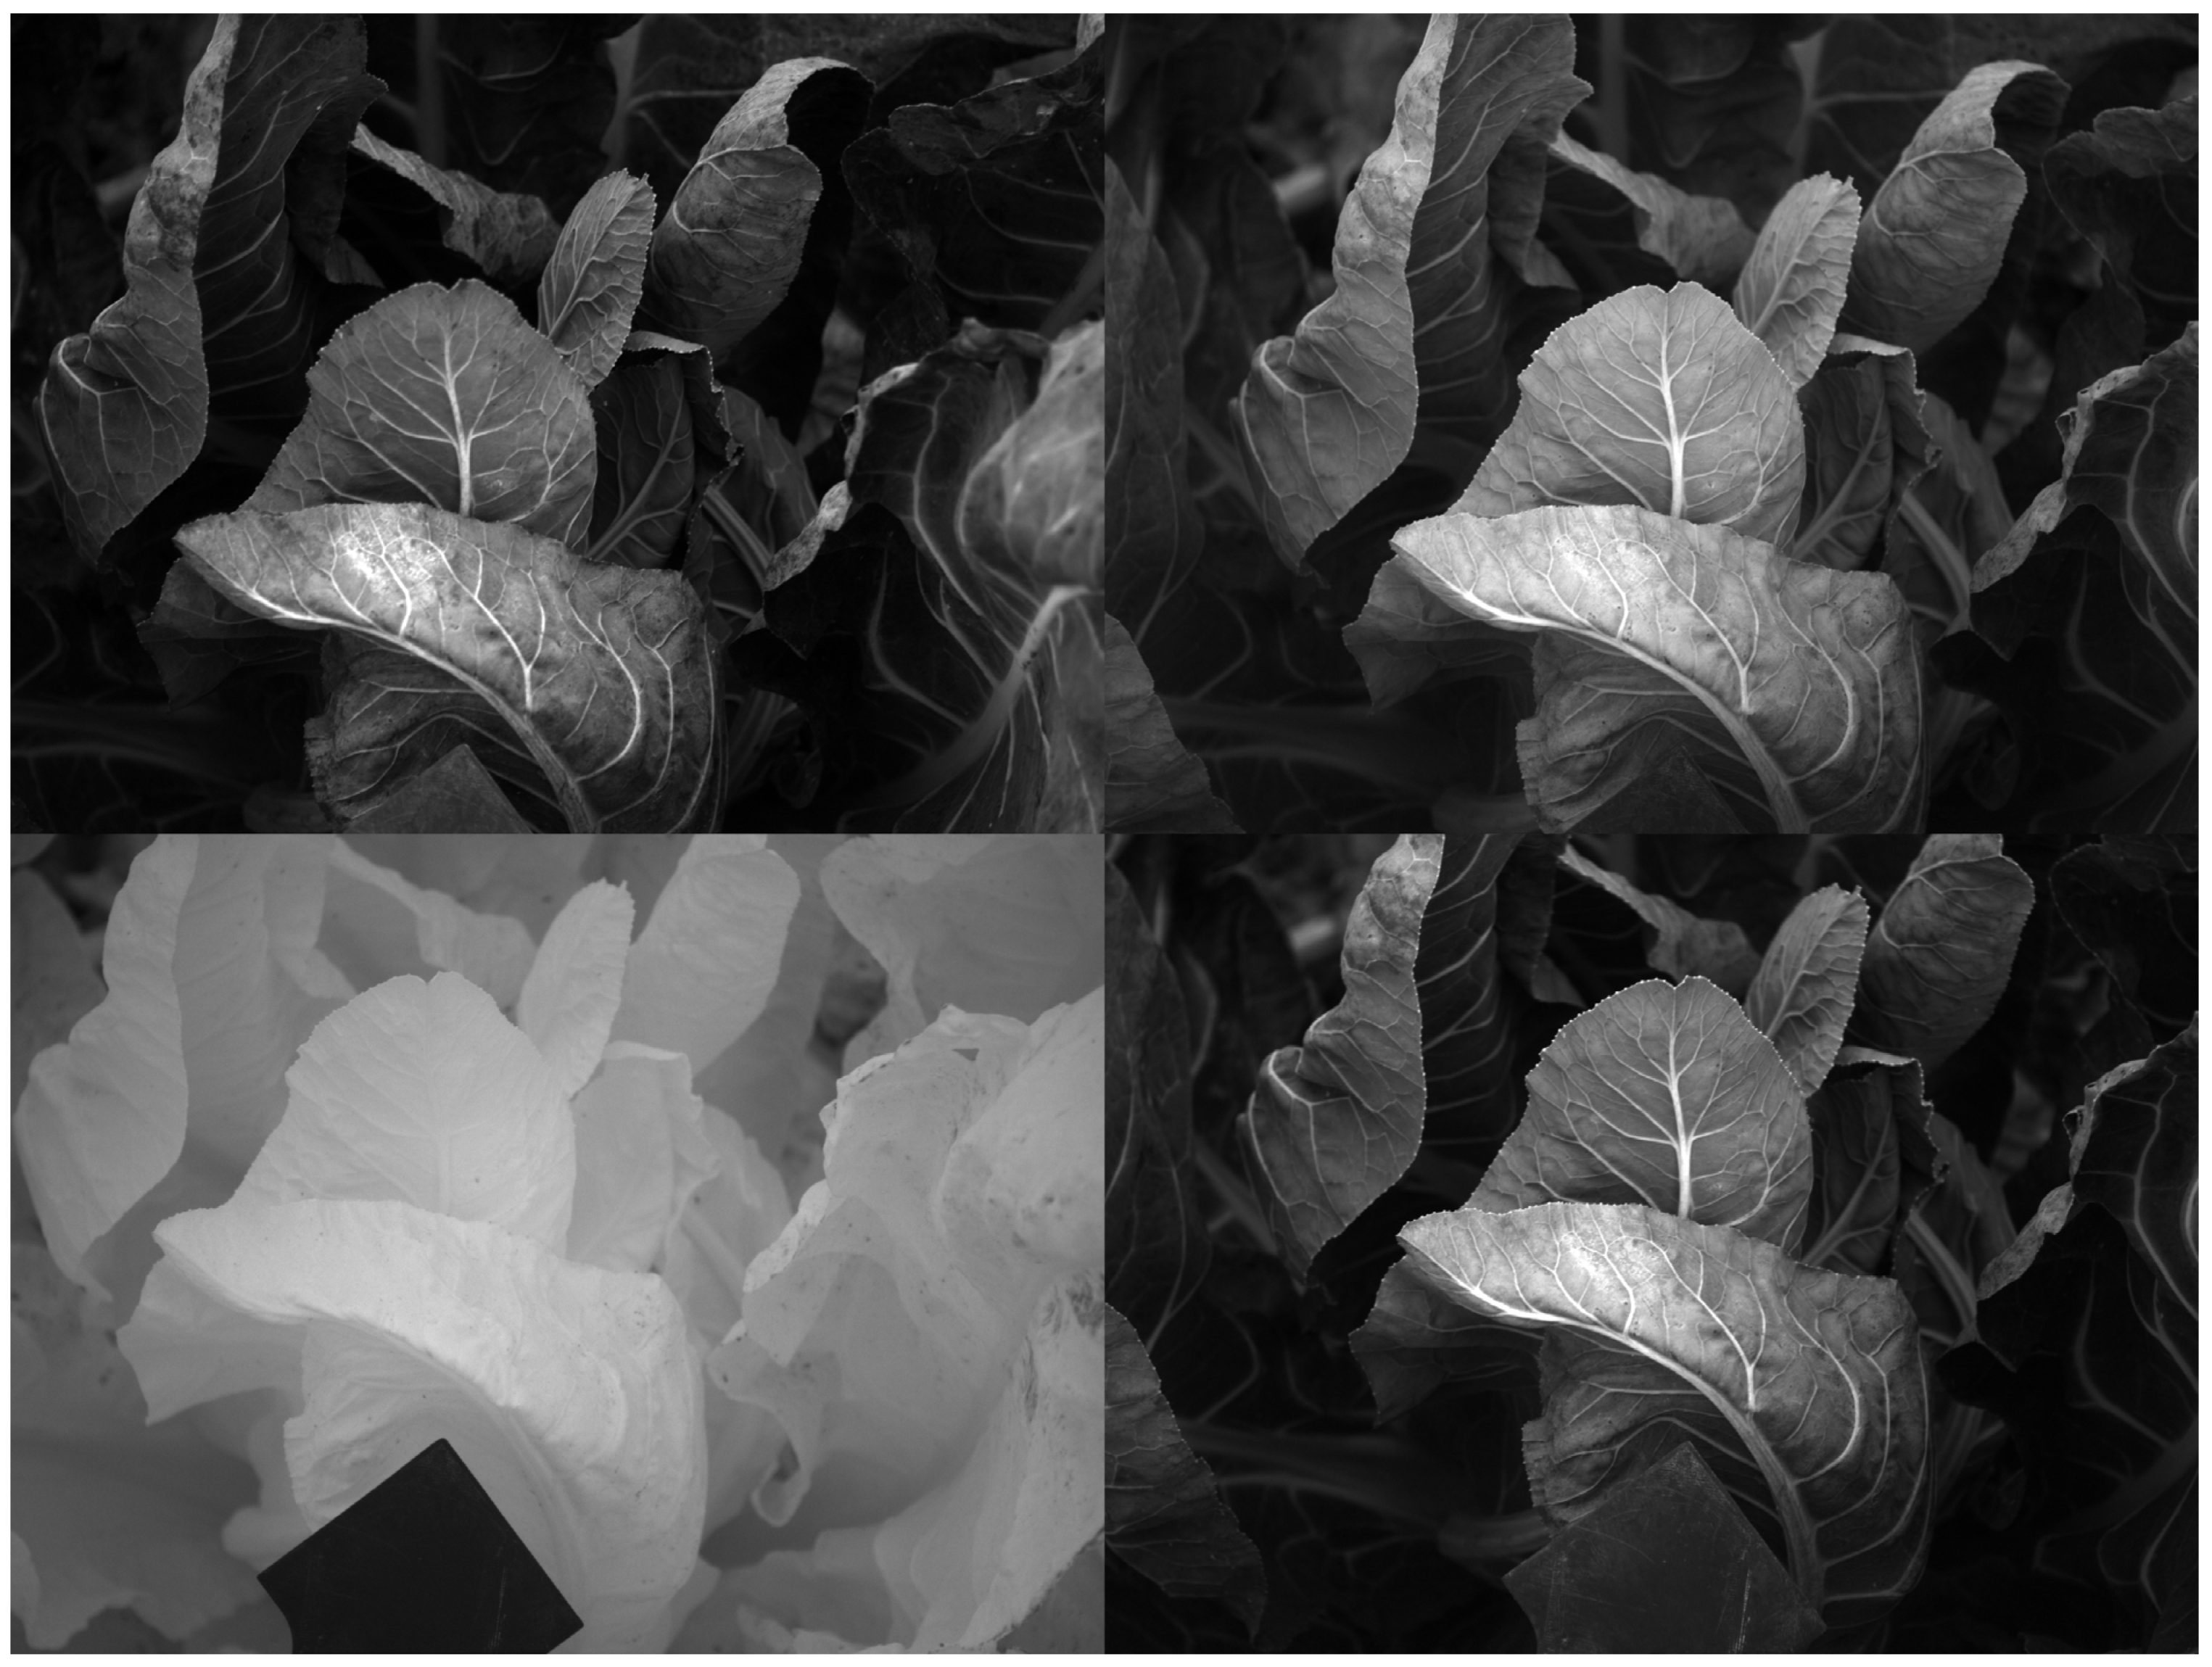
Each measurement consists of 4 greyscale images (one for each wavelength) of 1600 × 1200 pixels (
Figure 3).
Each multispectral measurement was processed using the following algorithm:
Cropping images: Active Text Agroscanner takes 4 spectral images at once using 4 cameras. Each of the images is shifted in relation to the others so as to be able to proceed with the next steps—a common part of the images must be designated.
Image quality assurance: Agroscanner has two implementations, handheld and drone installed. Both implementations are used in motion (limited). Rejected images comprise those captured out of focus, too dark, those comprising the shadow of a drone or Agroscanner operator, or too bright, as the light conditions changed during the image series (light calibration was performed only at the beginning of a measurement series).
Three-dimensional image morphing: The way the cameras were placed makes perspective slightly shifted. Further analysis requires that perspective must be in sync between every multispectral measurement. This was a very important step. Morphing calculations were complicated because each band was different (especially the IR band), so classic photogrammetry algorithms do not apply here.
Soil recognition: Using multiple techniques (also using Neural Network models), soil was detected in images and cut out from further processing.
Leaf and vein recognition: Using multiple techniques (also using Neural Network models), leaf veins were detected. Some physiological indexes were calculated for different plant areas (e.g., vein).
Image normalization: Two normalization methods were created during the project. One was to multiply the measurements by a factor calculated from the ratio of the average measurement value in the vein area to the rest of the leaf. The other was to use a calibration plate and adjust the parameter measurements while taking a series of images. The design of the calibration plate as well as the scanner itself allows for real-time measurement analysis of lighting conditions (
Figure 4).
Physiological index calculation: For each pixel in the synchronized, 3D-morphed and normalized multispectral set we calculated a set of 18 physiological indexes.
ATIndexATLeaf—Active Text normalized index based on leaf detection algorithm;
ATIndexATVein—Active Text normalized index based on vein detection algorithm;
ATIndexCI_RE—Chlorophyll index—red edge;
ATIndexCI_G—Chlorophyll index–green;
ATIndexCVI—Chlorophyll vegetation index;
ATIndexEVI—Enhanced vegetation index;
ATIndexGLI—Green leaf index;
ATIndexgNDVI—Green normalized difference vegetation index;
ATIndexMSAVI—MSAVI index;
ATIndexMTVI2—Second modified triangular vegetation index
ATIndexNGRDI—Normalized green–red difference index;
ATIndexOSAVI—Optimized soil adjusted vegetation index;
ATIndexSAVI—Soil adjusted vegetation index, also known as MSAVI;
ATIndexTVI—Triangular vegetation index;
ATIndexVARI—Visible atmospherically resistant index;
ATIndiciesNDVI—NDVI index;
ATIndiciesSIMPLE—SIMPLE index;
ATIndexATLeafVeinRatio—Active Text normalized index-based vein to leaf index ratio.
Each pixel in the multispectral set (with spectral images) was transformed by calculation of indexes into an 18-dimensional vector.
Physiological Index Analysis: Final goal is to determine which fertilizer group a measured plant belongs to. Therefore, multiple classifiers were built. Input classifiers have an 18-dimension image, as does the output fertilizer group. During the whole project we were testing the following methods:
Statistical methods: Based on data sets gathered during the project we calculated focus points for every fertilizer group. The created metric can define the nearest focus point for each new vector, hence the fertilizer group.
Neural Network method: We tested multiple models—custom-built dense Neural Network model, KNN Classification and CNN model.
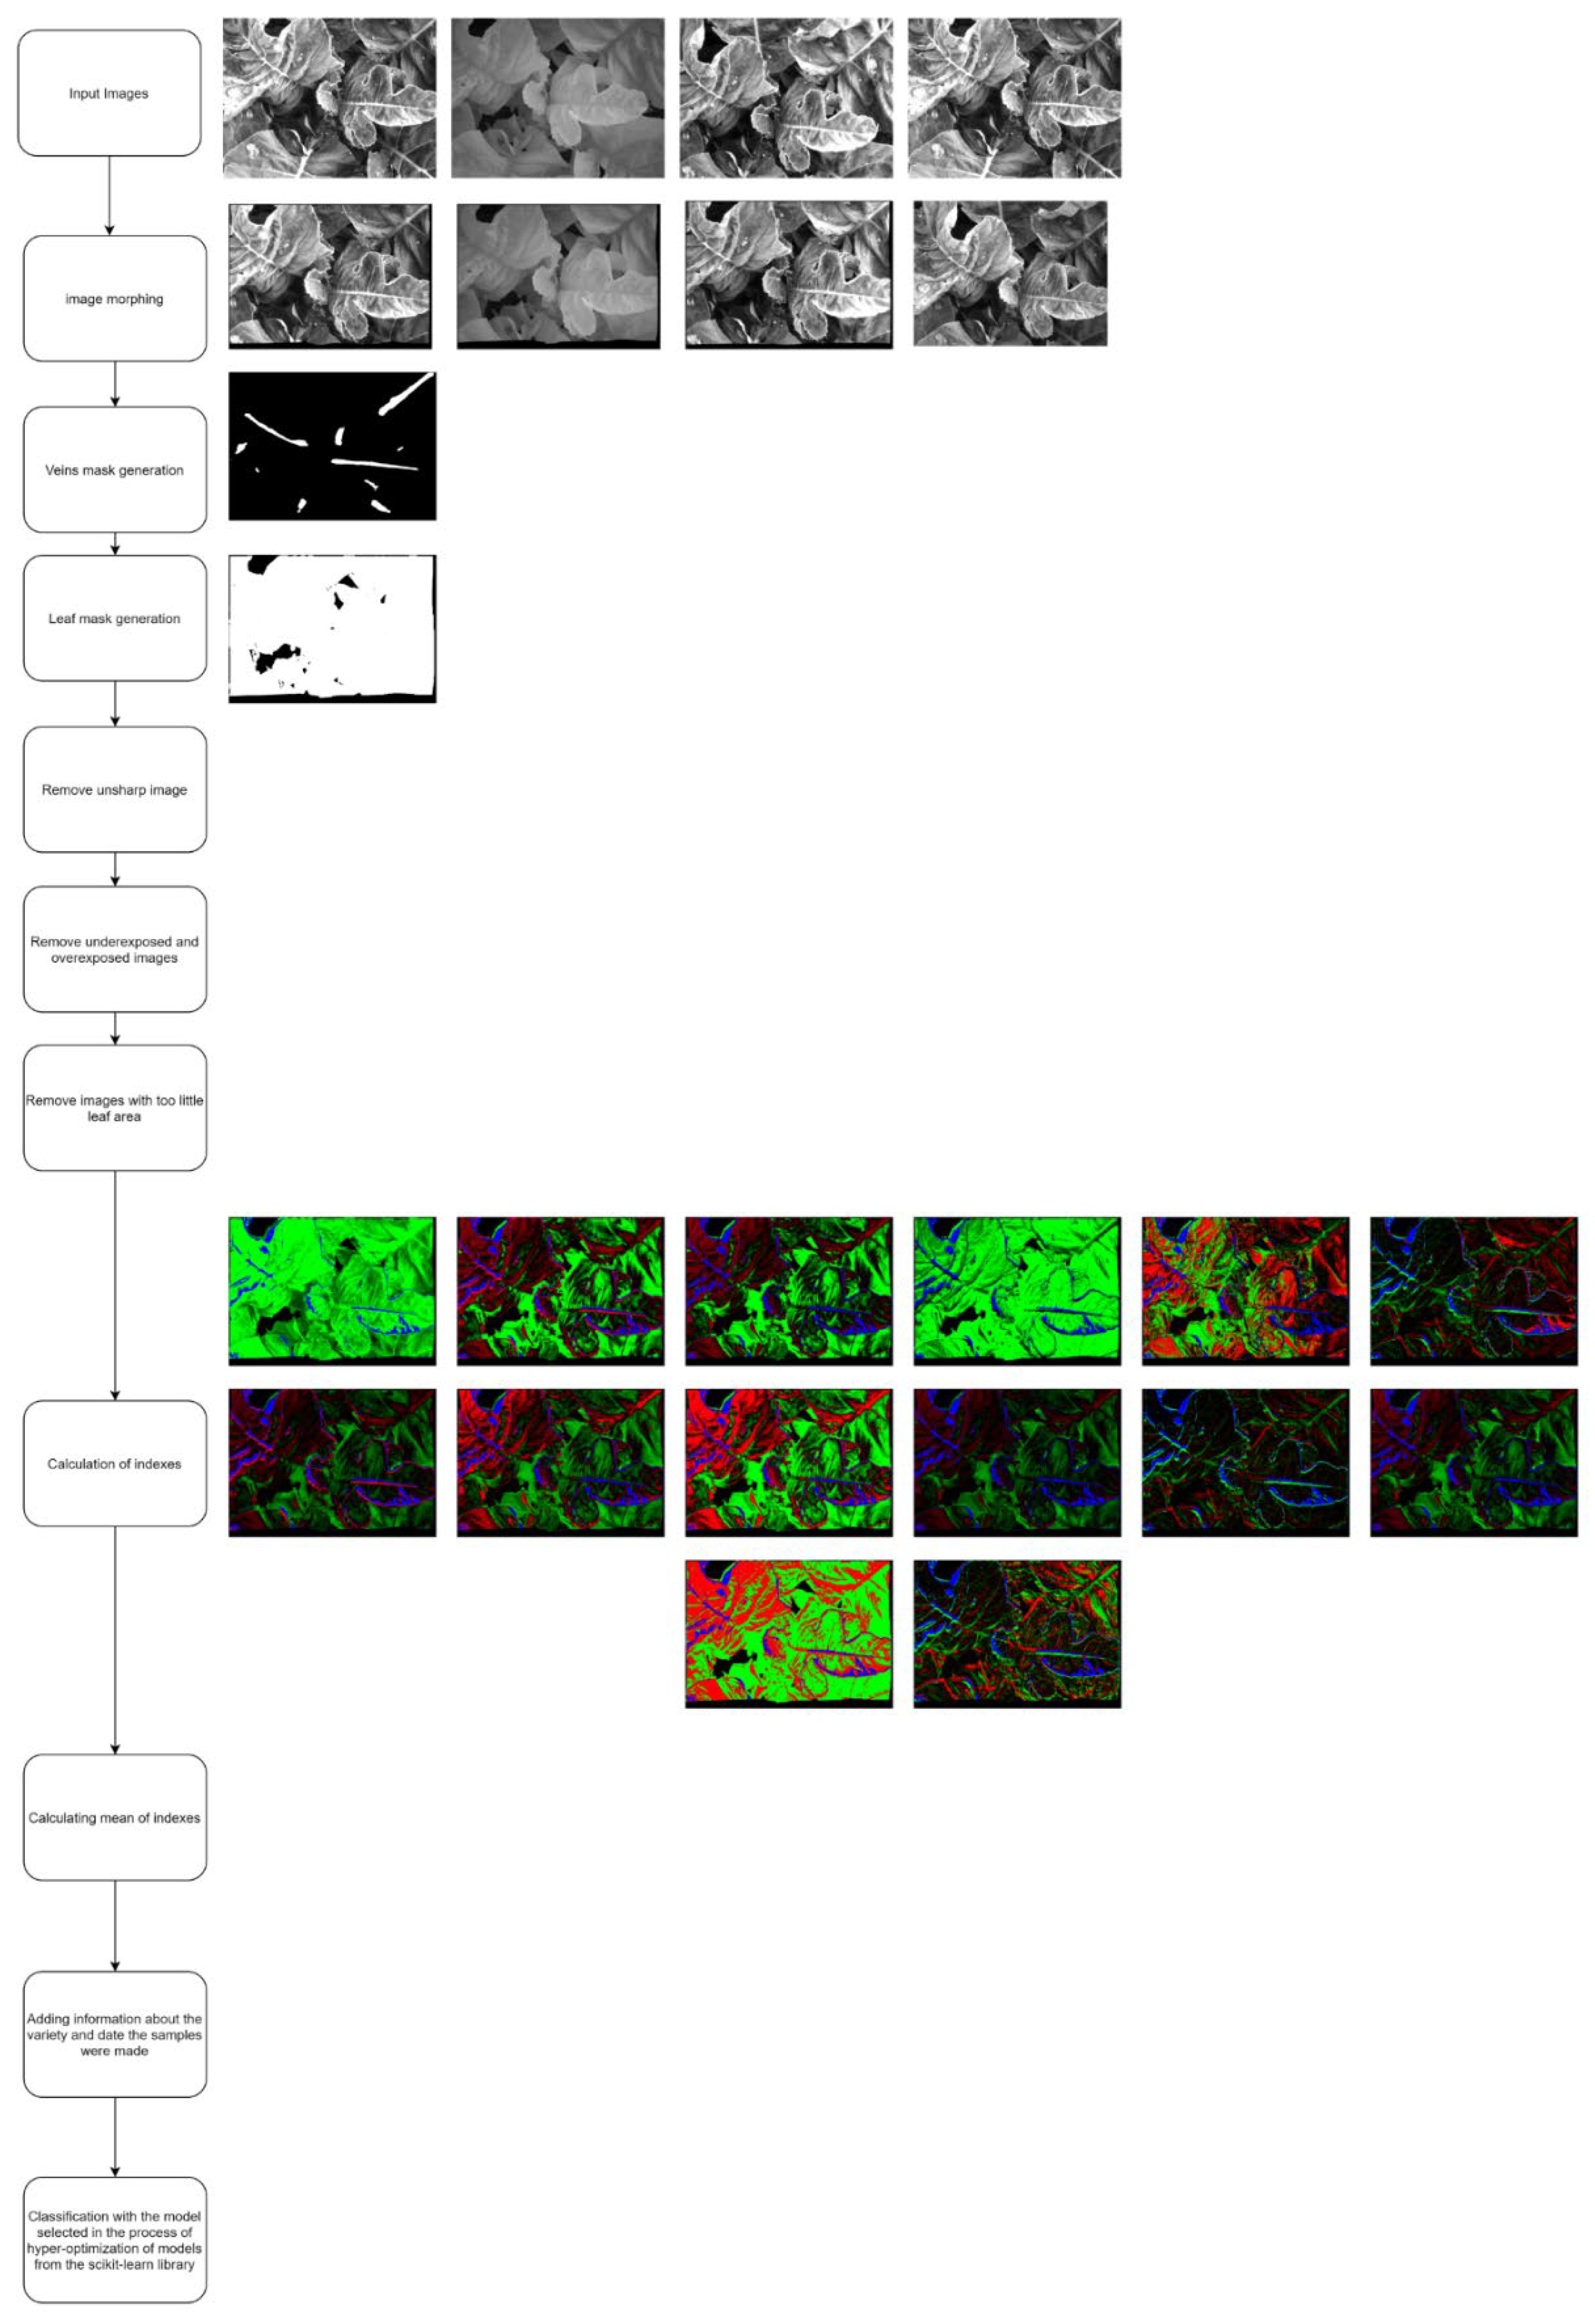
A synthetic version of the algorithm is shown in the
Figure 5.
3. Results
As part of the project, approx. 30,000 multispectral measurements were performed (more than 120,000 single images). During three years of measurements, the Research and Development Team worked on the hardware, Agroscanner, statistical and analytical algorithms. The final measurement batch was used to test the last version of the system. The main research task was to identify the correct fertilizer group of scanned plants using the Agroscanner. Two approaches were used:
Statistical approach—based on defining a proper subset of calculated indexes and metrics to be able to define the focal point for each fertilizer group.
AI approach—based on classifying Convolutional Neural Networks.
3.1. Statistical Approach
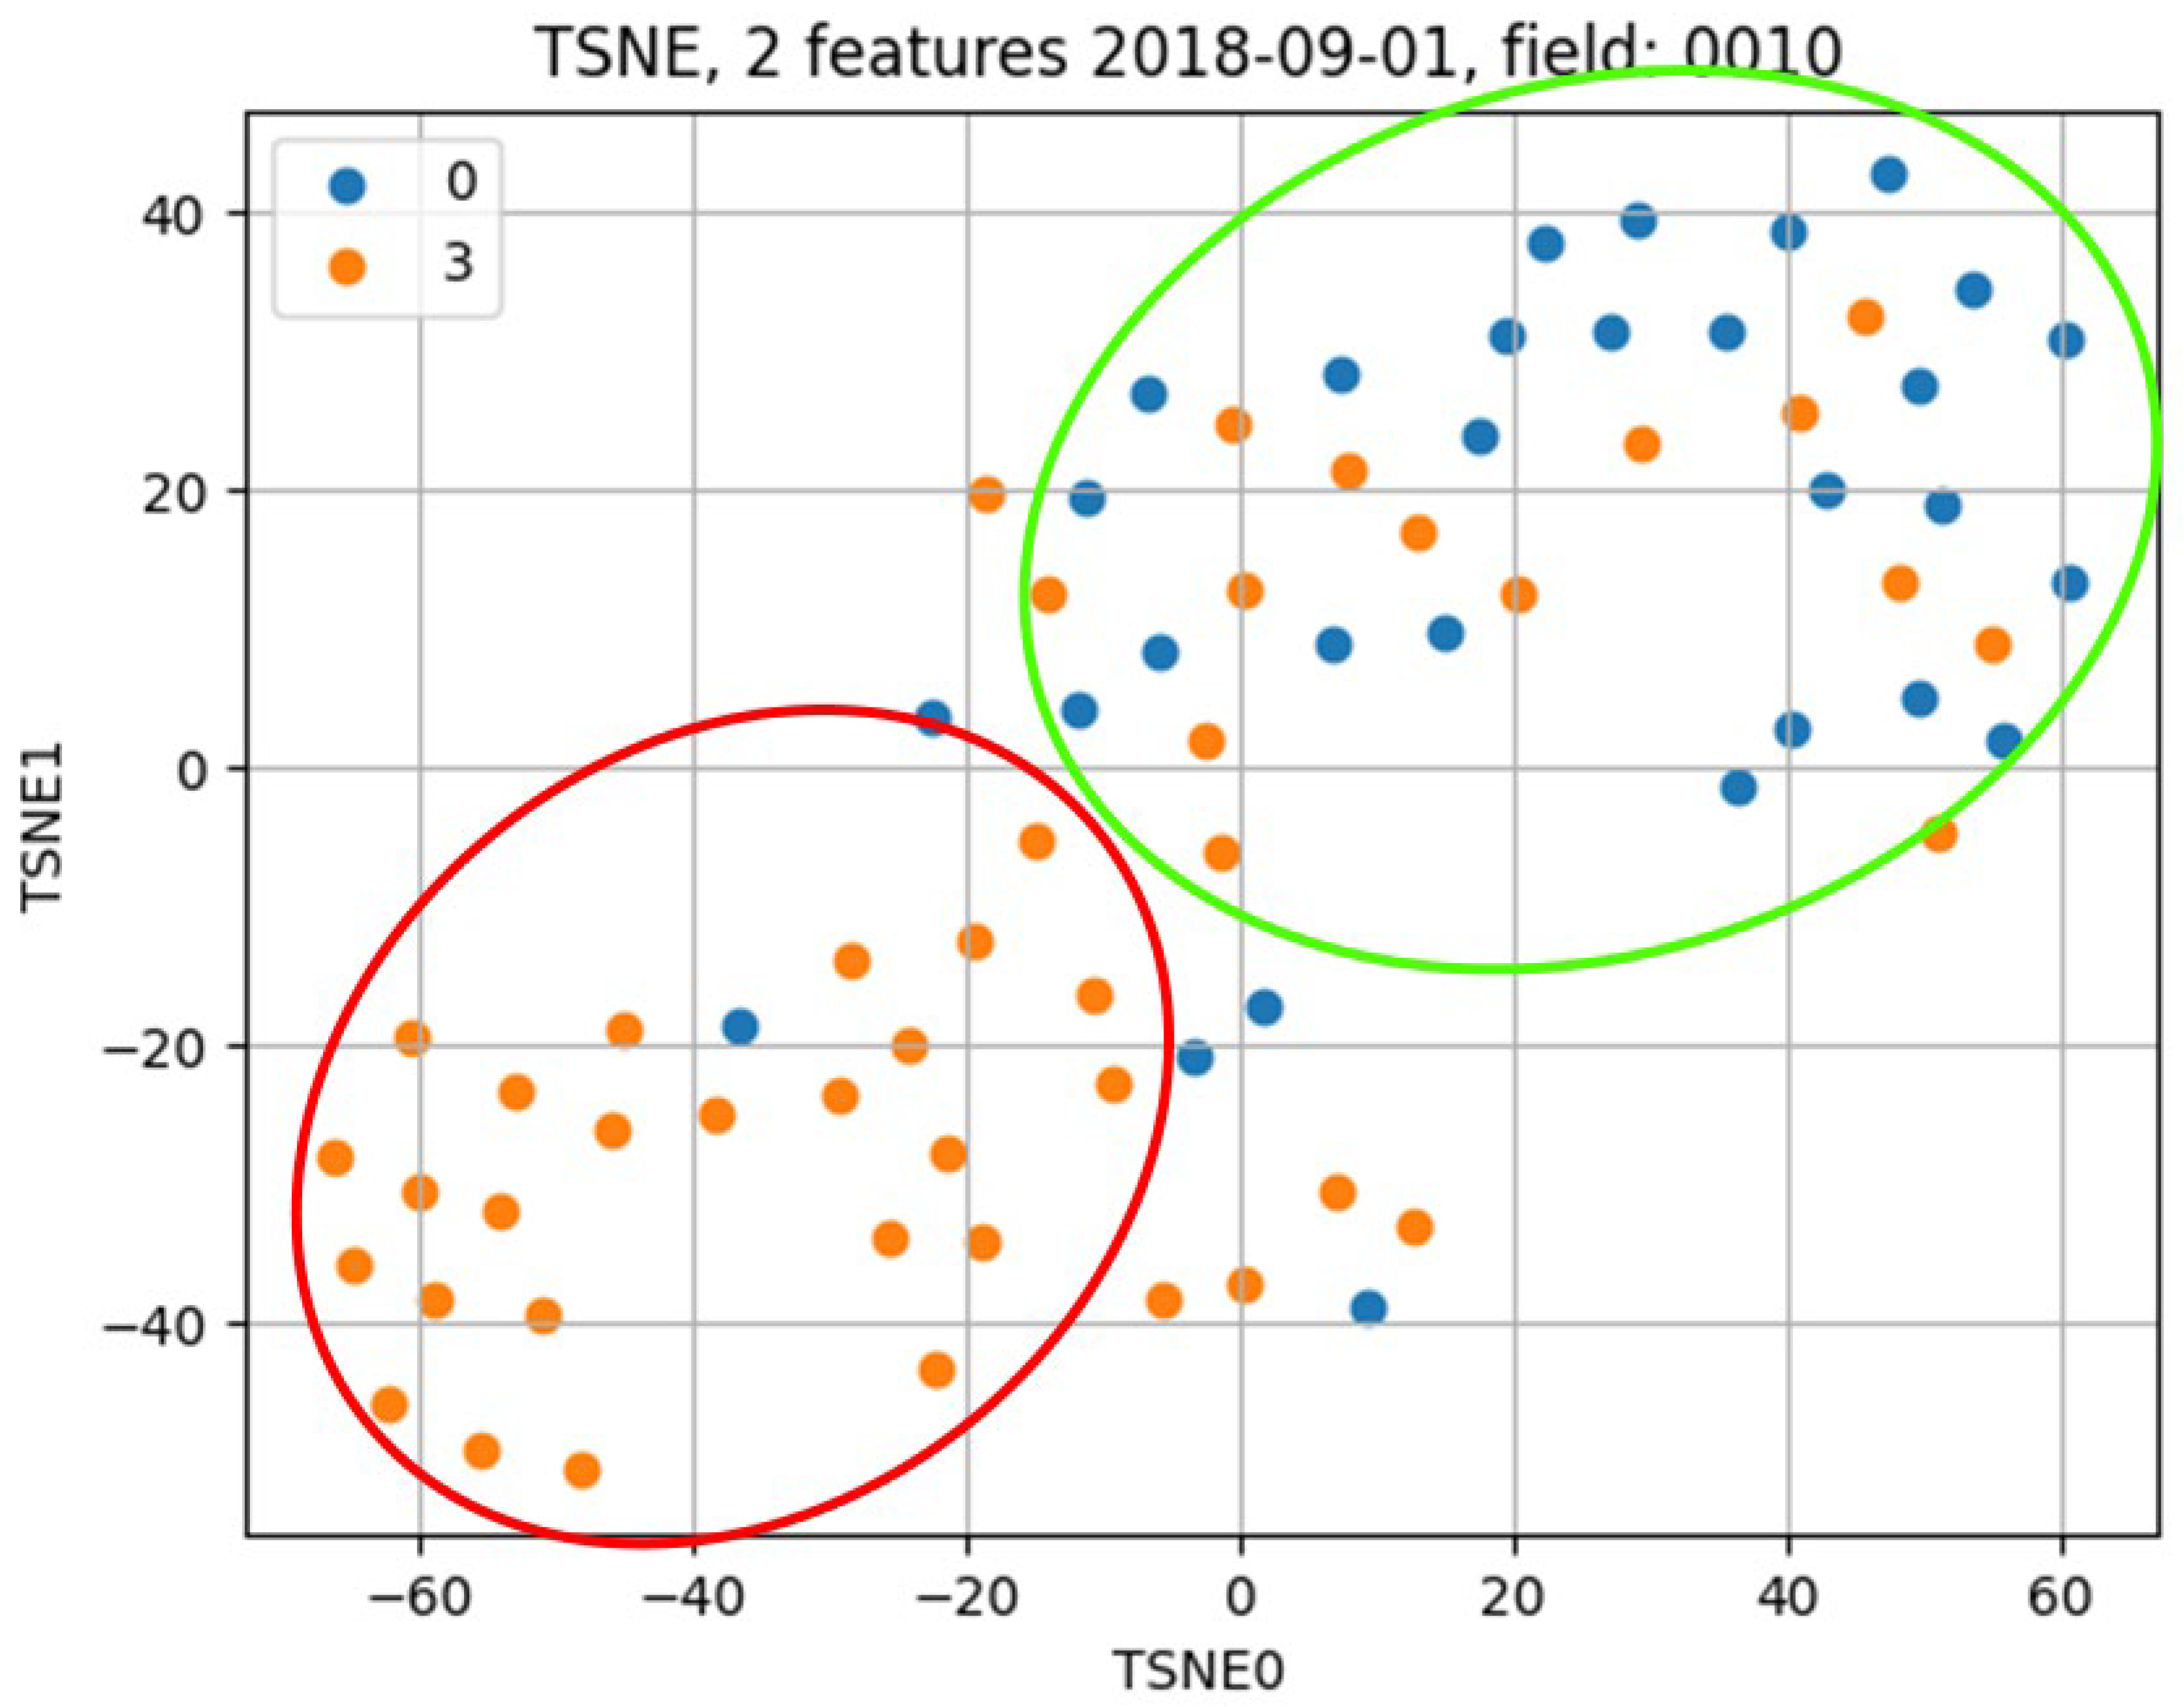
The statistical approach is to look for cluster points in a multidimensional space where each measurement corresponds to an averaged vector of indices. Averaging of indices for measurement takes place only on the green leaf surface (other artifacts from the measurement such as soil are rejected). For each fertilizer group, we looked for a focal point so that as many measurements as possible are located in its proximity. We can visualize this on a two-dimensional plane using the TSNE (t-Distributed Stochastic Neighbor Embedding) method, which reduces the dimensions of a vector to a two-dimensional vector. The blue color signed as zero represents samples with nitrogen deficiency, while the orange color signed as three symbolizes samples without nitrogen deficiency (
Figure 6).
In both cases, there are obvious focal points between the two groups. Nevertheless, in both cases, some measurements are in the wrong surroundings.
We tested multiple statistical approaches to the cluster vector set (Nearest Neighbors—KNN, ExtraTreesClassifier, etc.). The best results gave us a Dens four-layer Neural Network classifier with recognition quality at 71%.
3.2. AI Approach
To be able to achieve the best recognition rate of the fertilizer group, a proper model needed to be used. To achieve that, we set up an extensive Machine Learning process. Using an expanded cluster of multiple AI machines we were able to choose the best CNN model. During that process, we tested multiple models’ designs (test results in
Table 1). As a result of this process, the best model was selected. The selected classifier CNN model has a total of 14 layers and 3 convolutional layers. It has a total of 8,978,181 neurons. As an input, it has a 280 × 280 pixels image and as an output, it has 5 fertilizer groups.
3.3. Final Test
The final test was conducted on the greenhouse-grown cauliflower crops. Measurements were conducted with the use of the Agroscanner on fully grown plants in 5- to 14 day-long intervals. On each measurement day, a sample of a green part of each fertilizer class was taken for the chemical analysis. During the test, the previously trained final model showed recognition accuracy of 86.93% of a single recognition sample (
Table 2).
To increase the recognition ratio, we can assume that plants on neighboring measurements belong to a similar fertilizer group. We predict that by using such an assumption we can increase the outcome by 5%. However, due to too small reference crop fields, calculations necessary to check the accuracy of this procedure were not possible.
4. Discussion
The unique construction of the Agroscanner allows measurements of plant tissues based on light transmittance and absorbance (multispectral measurements) with a high-accuracy assessment of their physiological condition. The novelty of the technology developed by Active Text in the course of R&D works is based on multispectral, macro-scale analysis [
1] of individual plant leaves, rather than entire fields (even when scanning from the air), which makes the method much more sensitive and precise.
One of the biggest challenges for measurements performed on an arable field is the calibration of measurements. It enables a comparative analysis between values of indices calculated from the measurements collected at different periods, times of the day or in different locations. The lack of universal calibration methods is one of the most important barriers to the development of multispectral measurements in agriculture. Therefore, the measurements and their automatic calibration performed in the fields were so important for the project. As a result, a procedure for performing measurements and a calibration method that allows for leveling the measuring factor related to the variability of external measurement conditions (in particular lighting conditions) were developed. This method consists of the following elements: appropriate design of the optical module that allows recording of spectral images with high sensitivity and speed (key for measurements taken from a short distance), an analytical system based on computer image analysis that detects leaf elements, and a system for physiological comparative analysis of leaf element indices.
Two analytical approaches were tested: a statistical method and an AI-based method. The statistical approach to analyze indexes in a comparative way within the elements of a particular leaf of a given plant is innovative. This approach has not yet been used in the agricultural industry because it reverses the way of thinking about indices. Instead of focusing on calibrating spectral images to enable their comparison, we constructed new indices based on a comparison of the values measured within one measurement. Our research has shown that examining the ratio of indices calculated on the area of veins and the rest of the leaf gives important information about the physiological state of the plant. The AI-based approach is particularly innovative because it does not focus on calculating indexes, but leaves whole calculations to the Deep Neural Network.
Considering that the method is to be used on large-scale field crops it is important that the analytical algorithm can cope with very different lighting conditions. Our research has shown that the approach using Convolutional Neural Networks has a higher recognition quality. This is not surprising, since Convolutional Neural Networks can learn more complex relationships than computing indices. These Neural Networks may pay attention to more than just the level of transmittance and absorbance of light (in terms of value), but also more subtle features such as leaf or vein shape. On the other hand, using the Neural Network approach has all the problems associated with the Machine Learning process. It requires a large number of statistically representative learning bases, and also debugging is very difficult. Nevertheless, data are the key.


 ,
, 


