
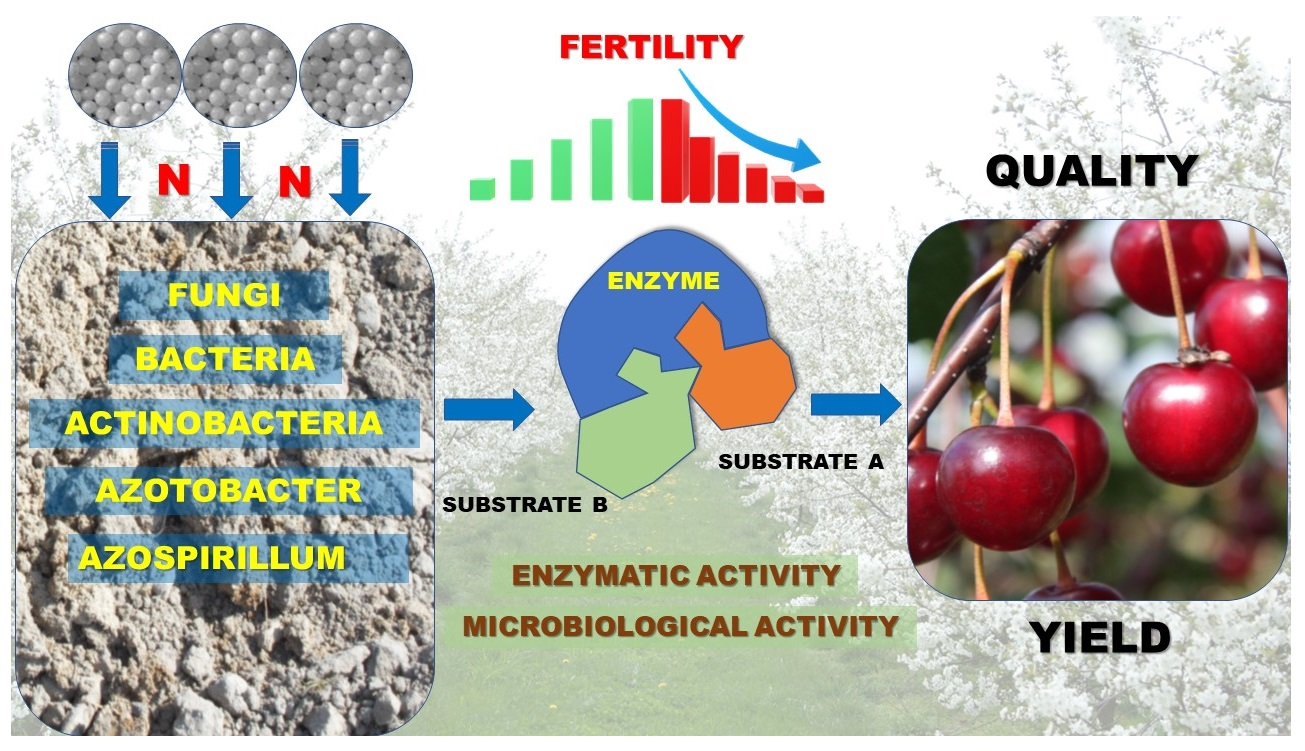
Effect of Nitrogen Fertilization in the Sour Cherry Orchard on Soil Enzymatic Activities, Microbial Population, and Fruit Quality


Abstract
:
1. Introduction
2. Materials and Methods
2.1. Location
2.2. Experiment Layout
- level 0 (N0)—no fertilization,
- level 1 (N60)—fertilization 60 kg N ha−1,
- level 2 (N120)—fertilization 120 kg N ha−1
2.3. Sampling
- (Date I) in the spring, flowering (BBCH 60–69) in end of April, and early May;
- (Date II) in the summer after fruit harvesting, (BBCH 93–97) in late July, and early August;
- (Date III) in the fall, at the end of the vegetation, beginning of dormancy (BBCH 87–89) in October.
2.4. Chemical Analysis
2.5. Microbiological Analyses
- total bacterial count was determined on Merck standard agar after 5 days of incubation at 28 °C,
- actinobacteria on Pochon agar after seven days of incubation at 24 °C [76],
- fungi in Martin medium after five days of incubation at 24 °C [77],
- Azotobacter abundance, assessed according to the method developed by Fenglerowa after four days of incubation at 28 °C [78],
- Azospirillum on liquid NFB medium as a titre according to Döbereiner [59].
2.6. Analysis of Weather Conditions
2.7. Statistical Analysis
3. Results and Discussion
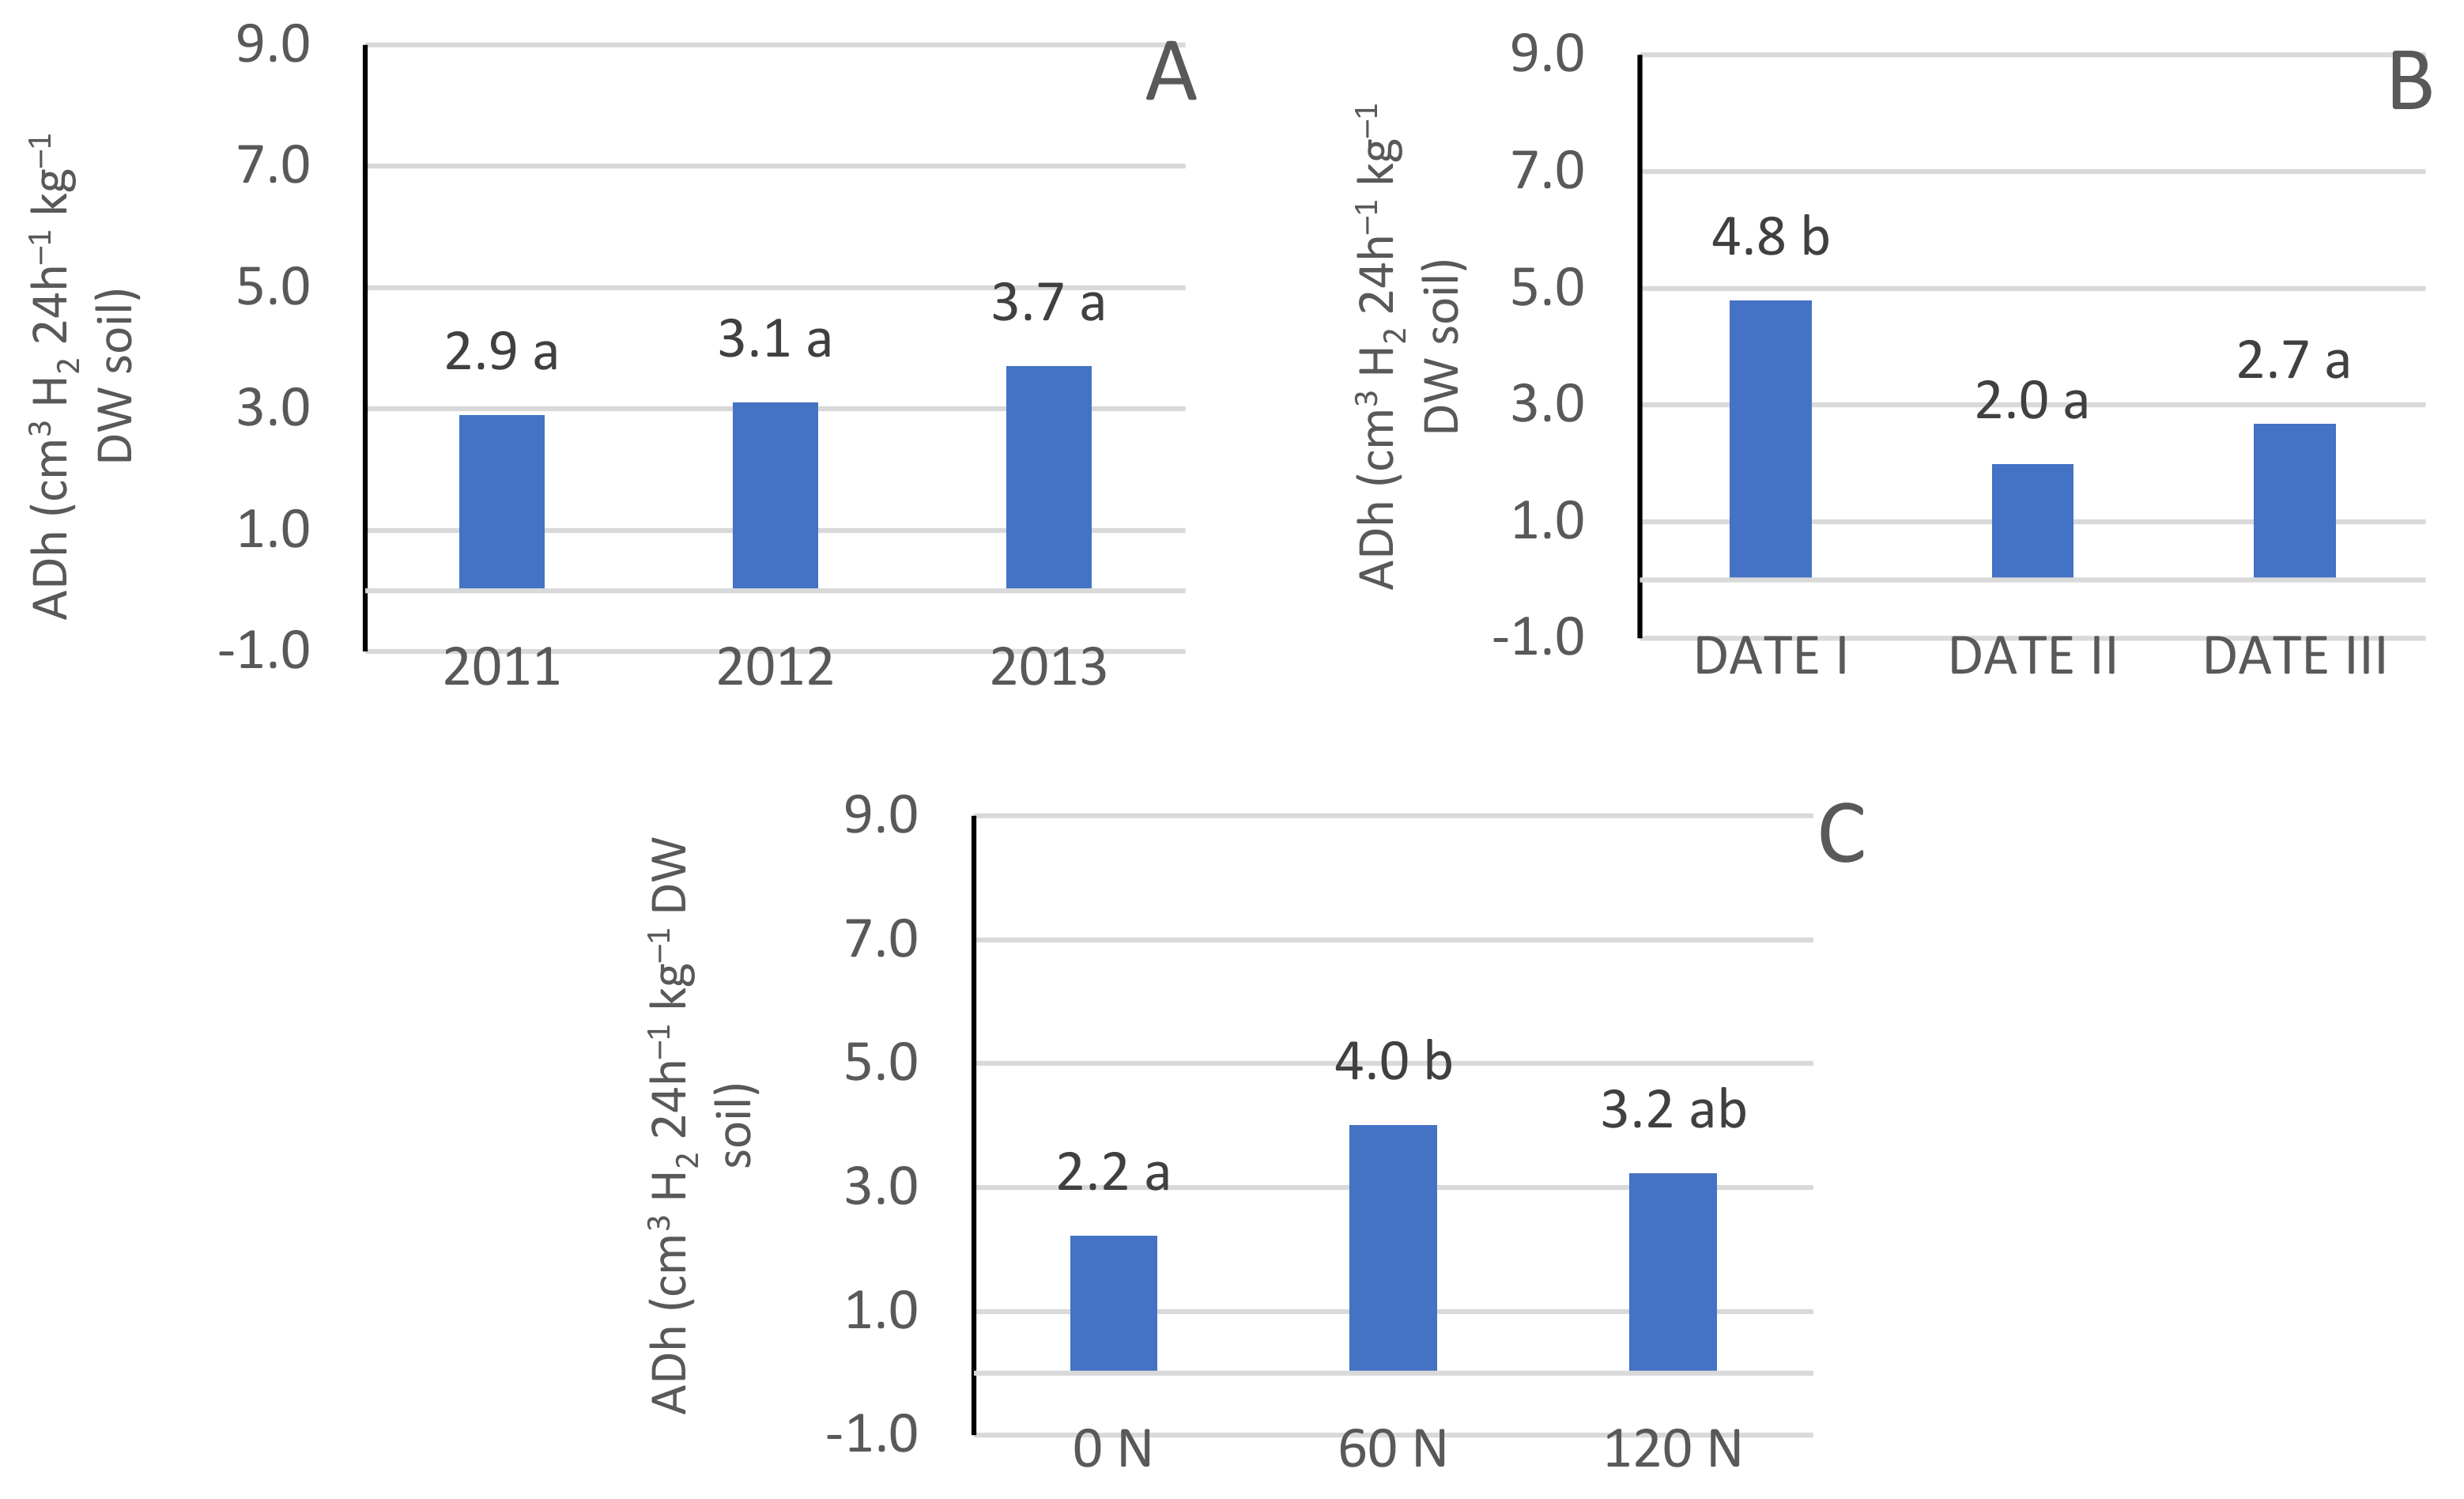
3.1. Dehydrogenase Enzyme Activity
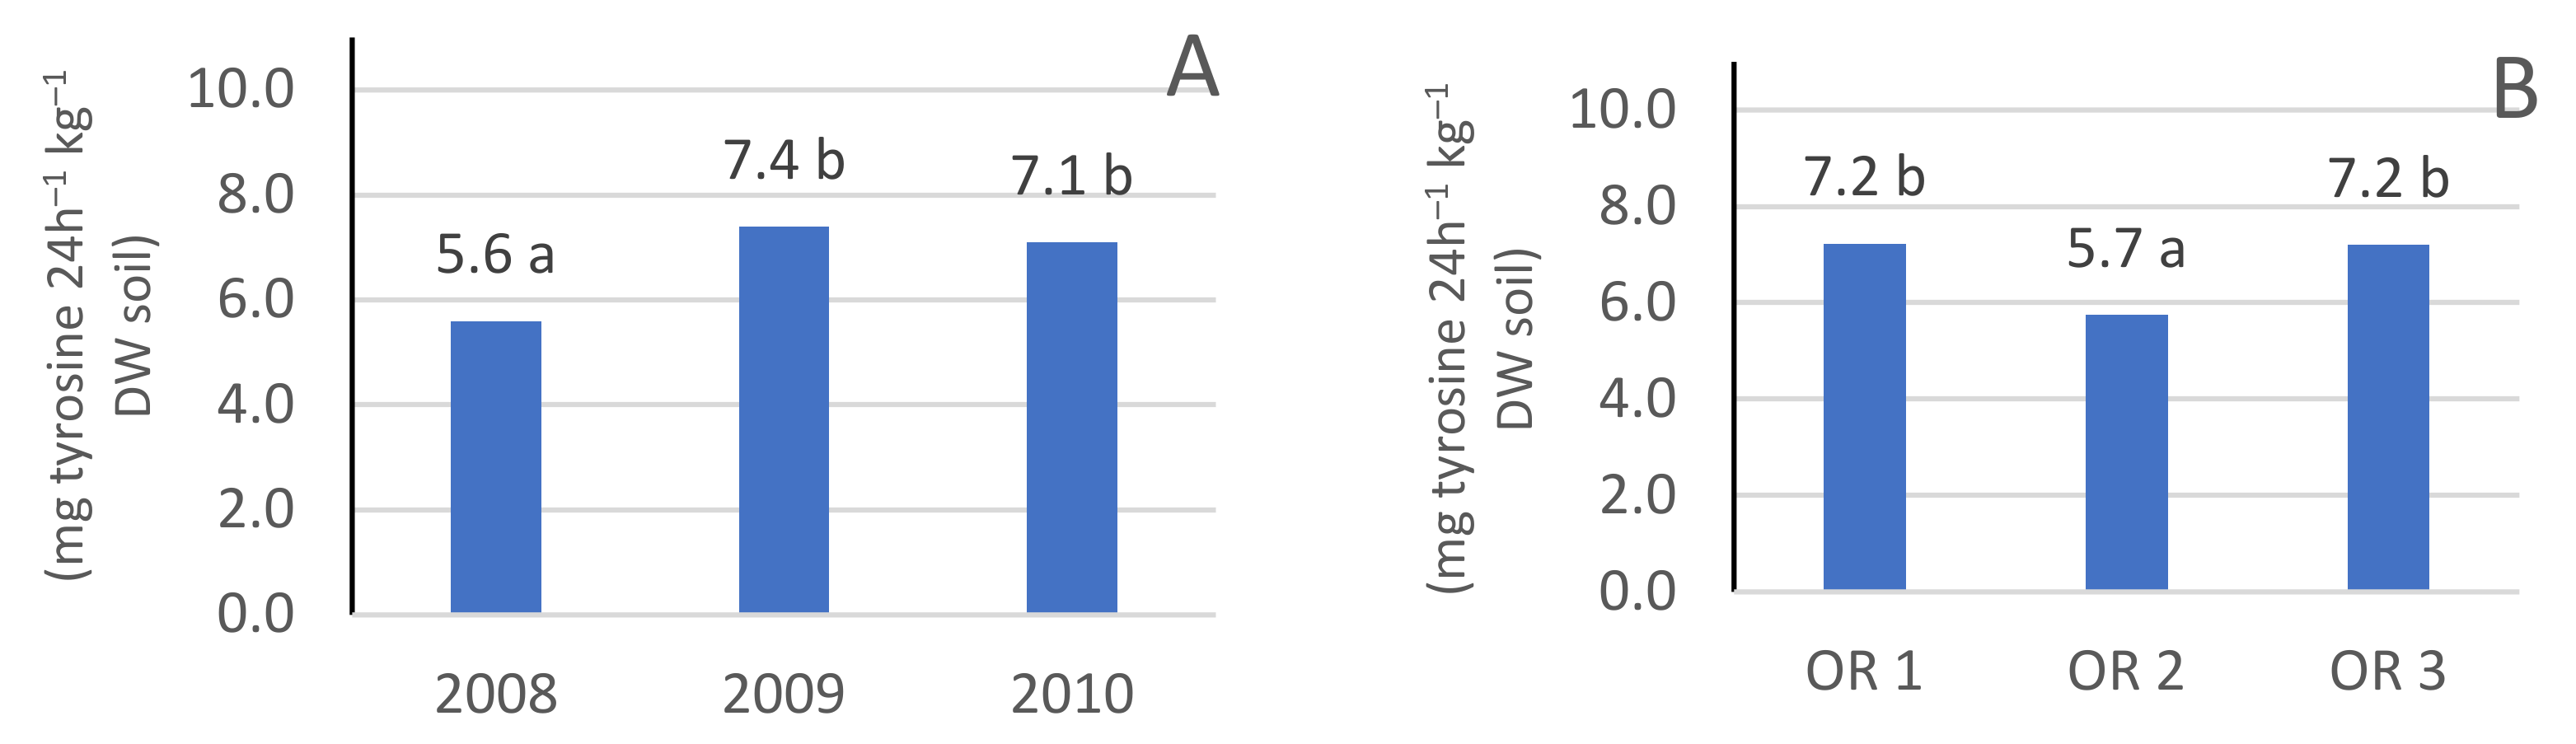
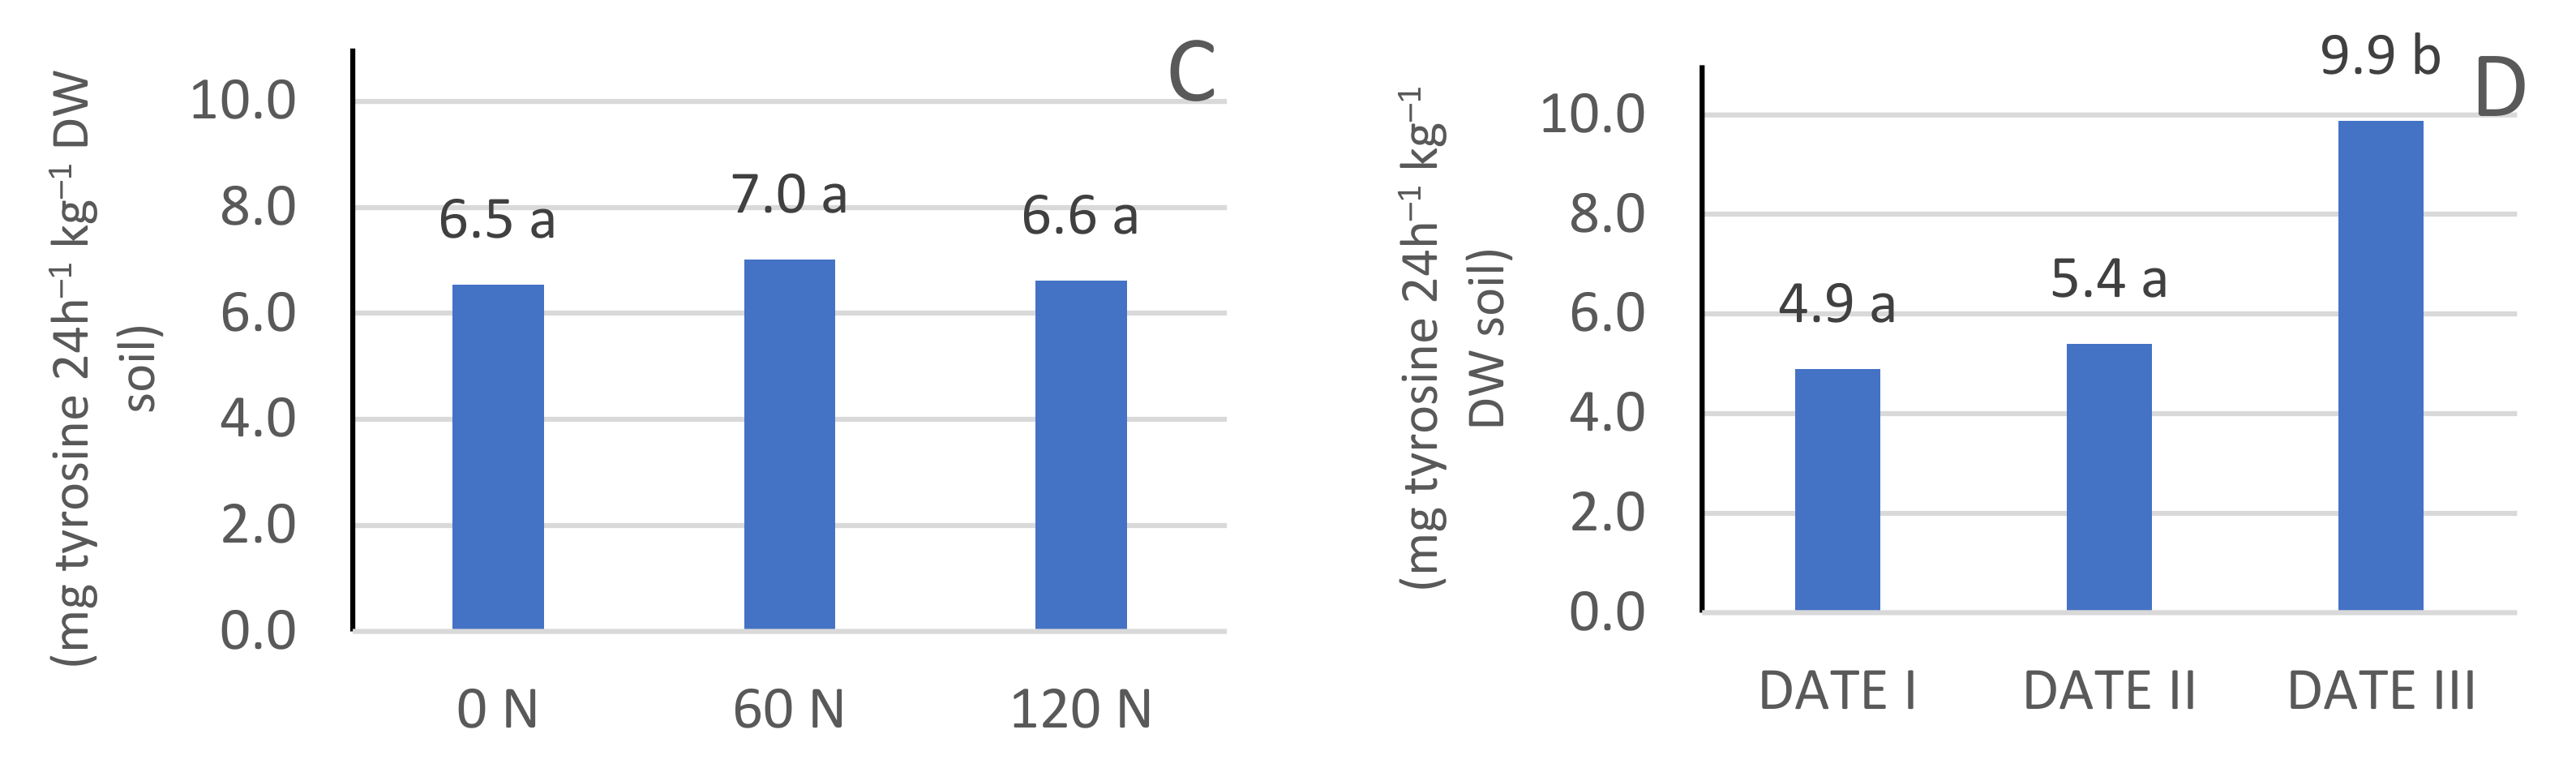
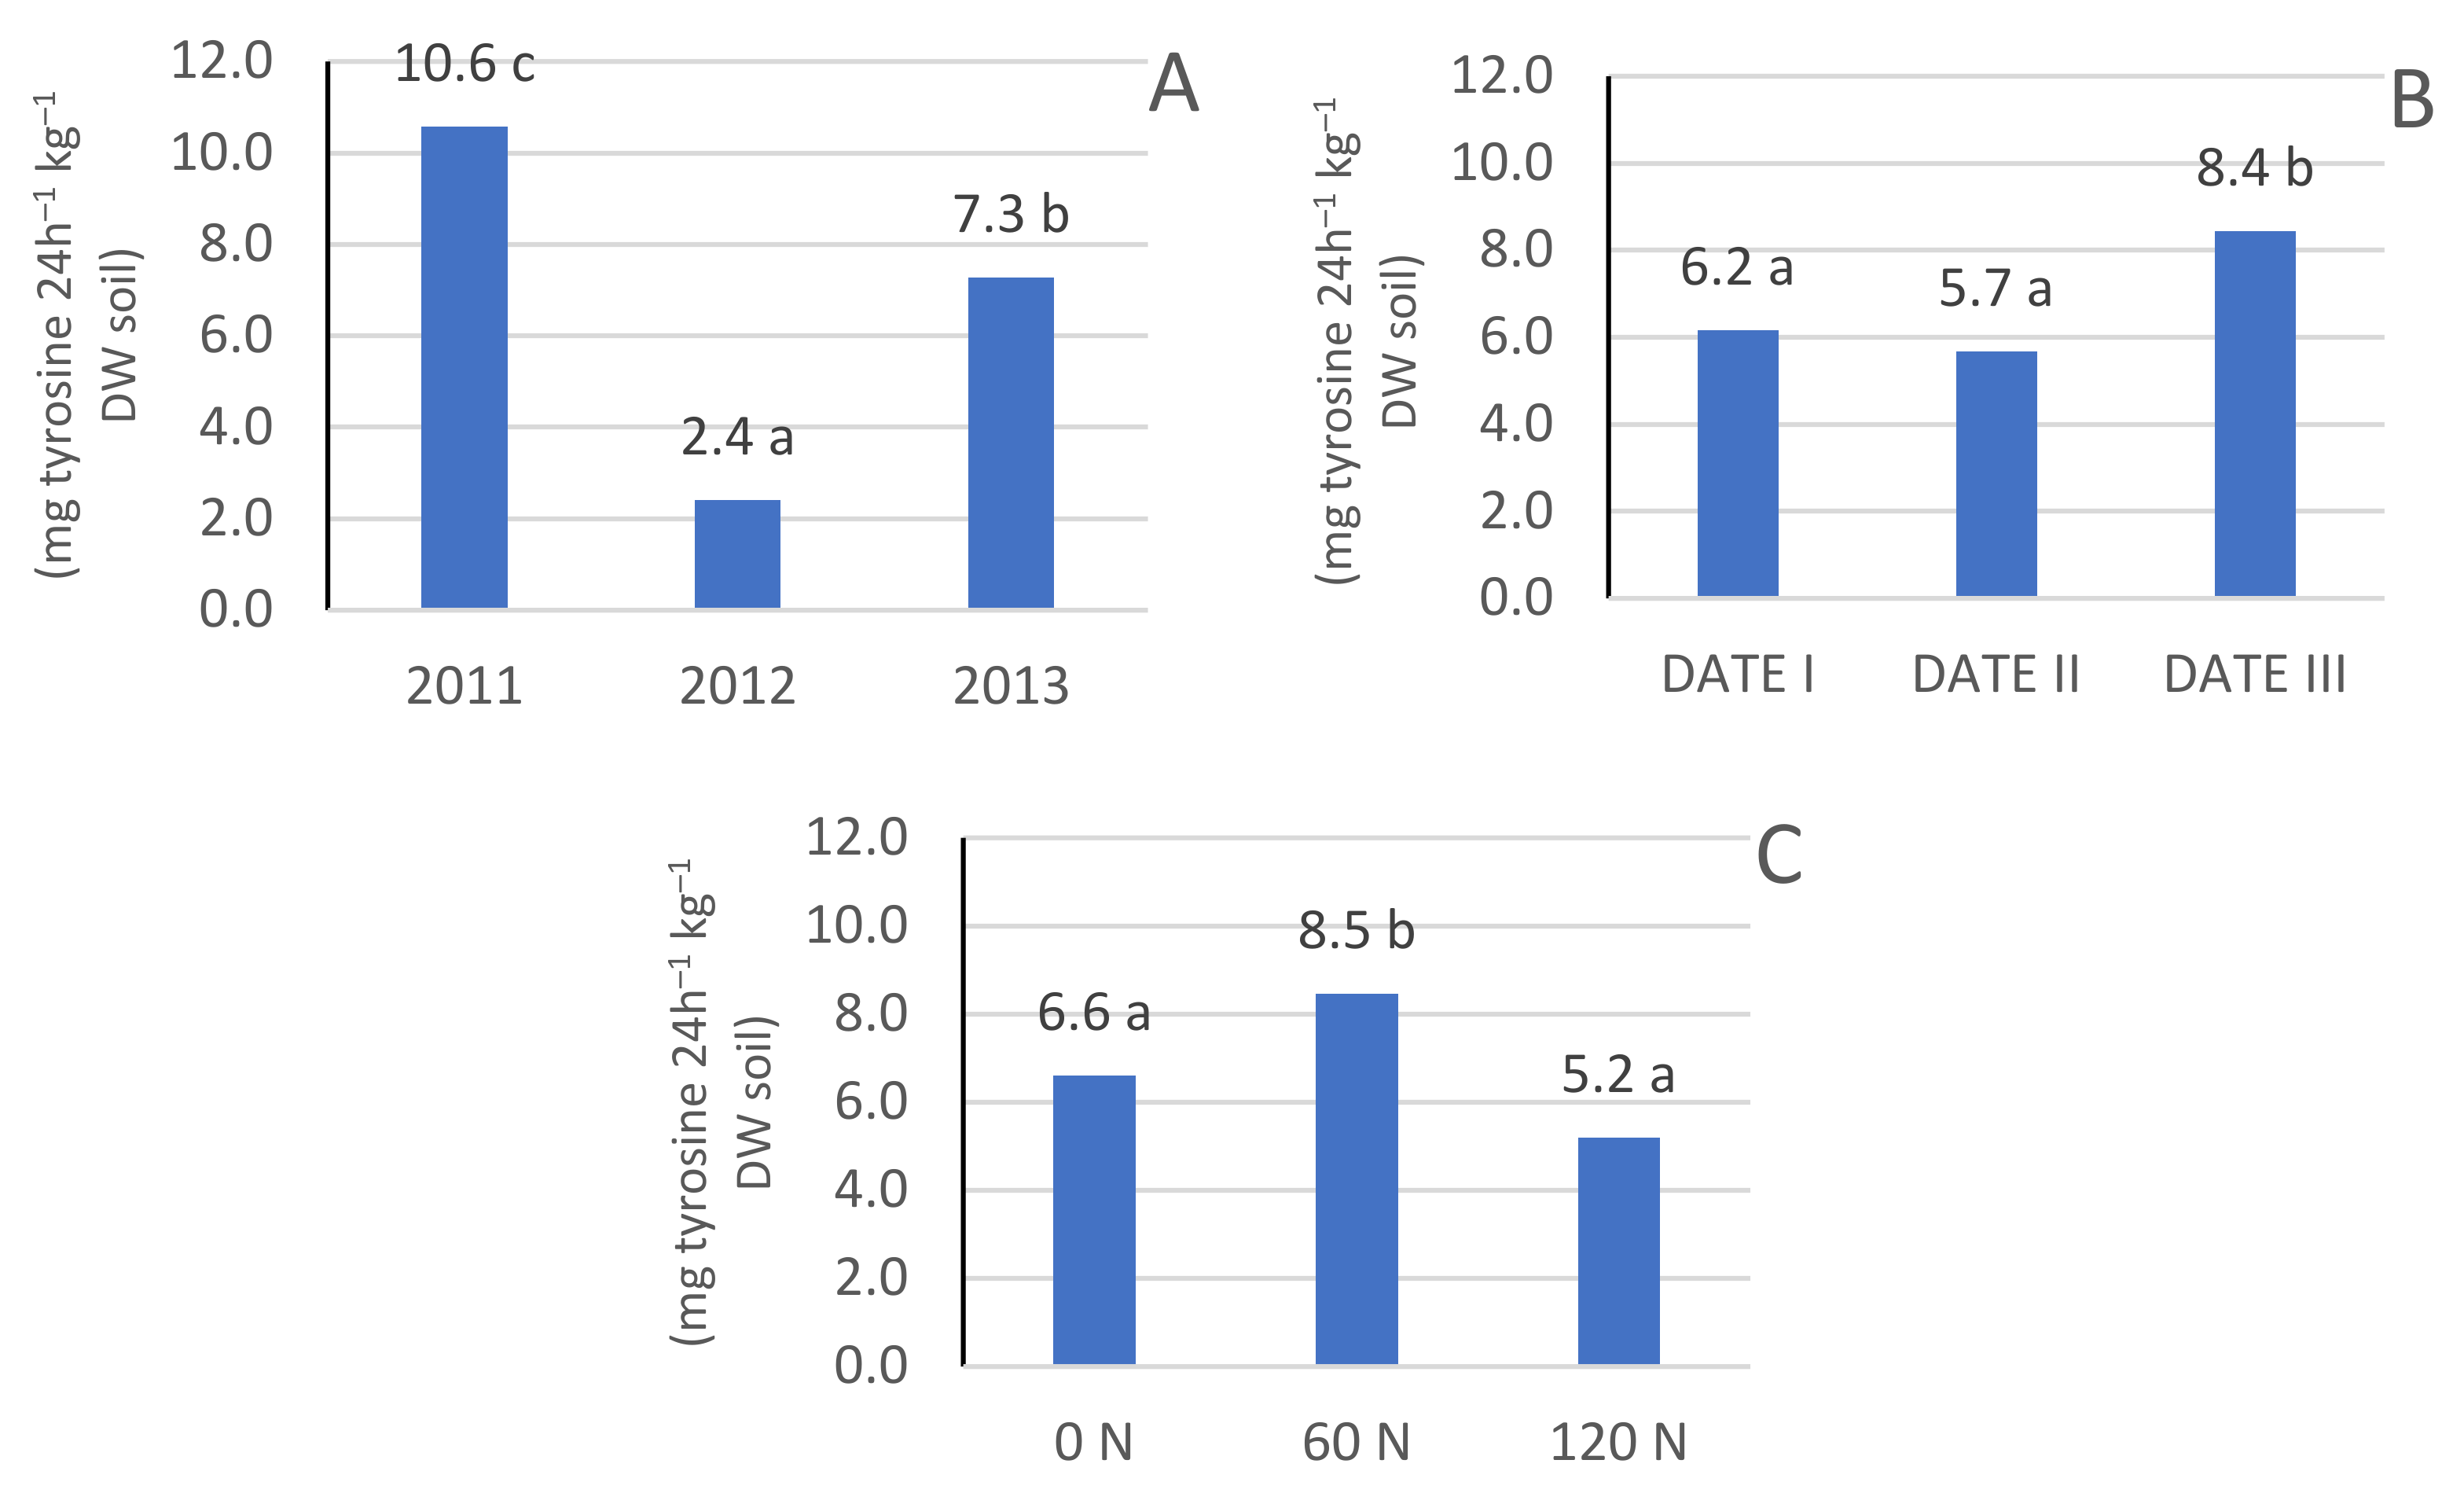
3.2. Protease Enzyme Activity
3.3. Microbiological Activity
3.3.1. Total Number of Bacteria
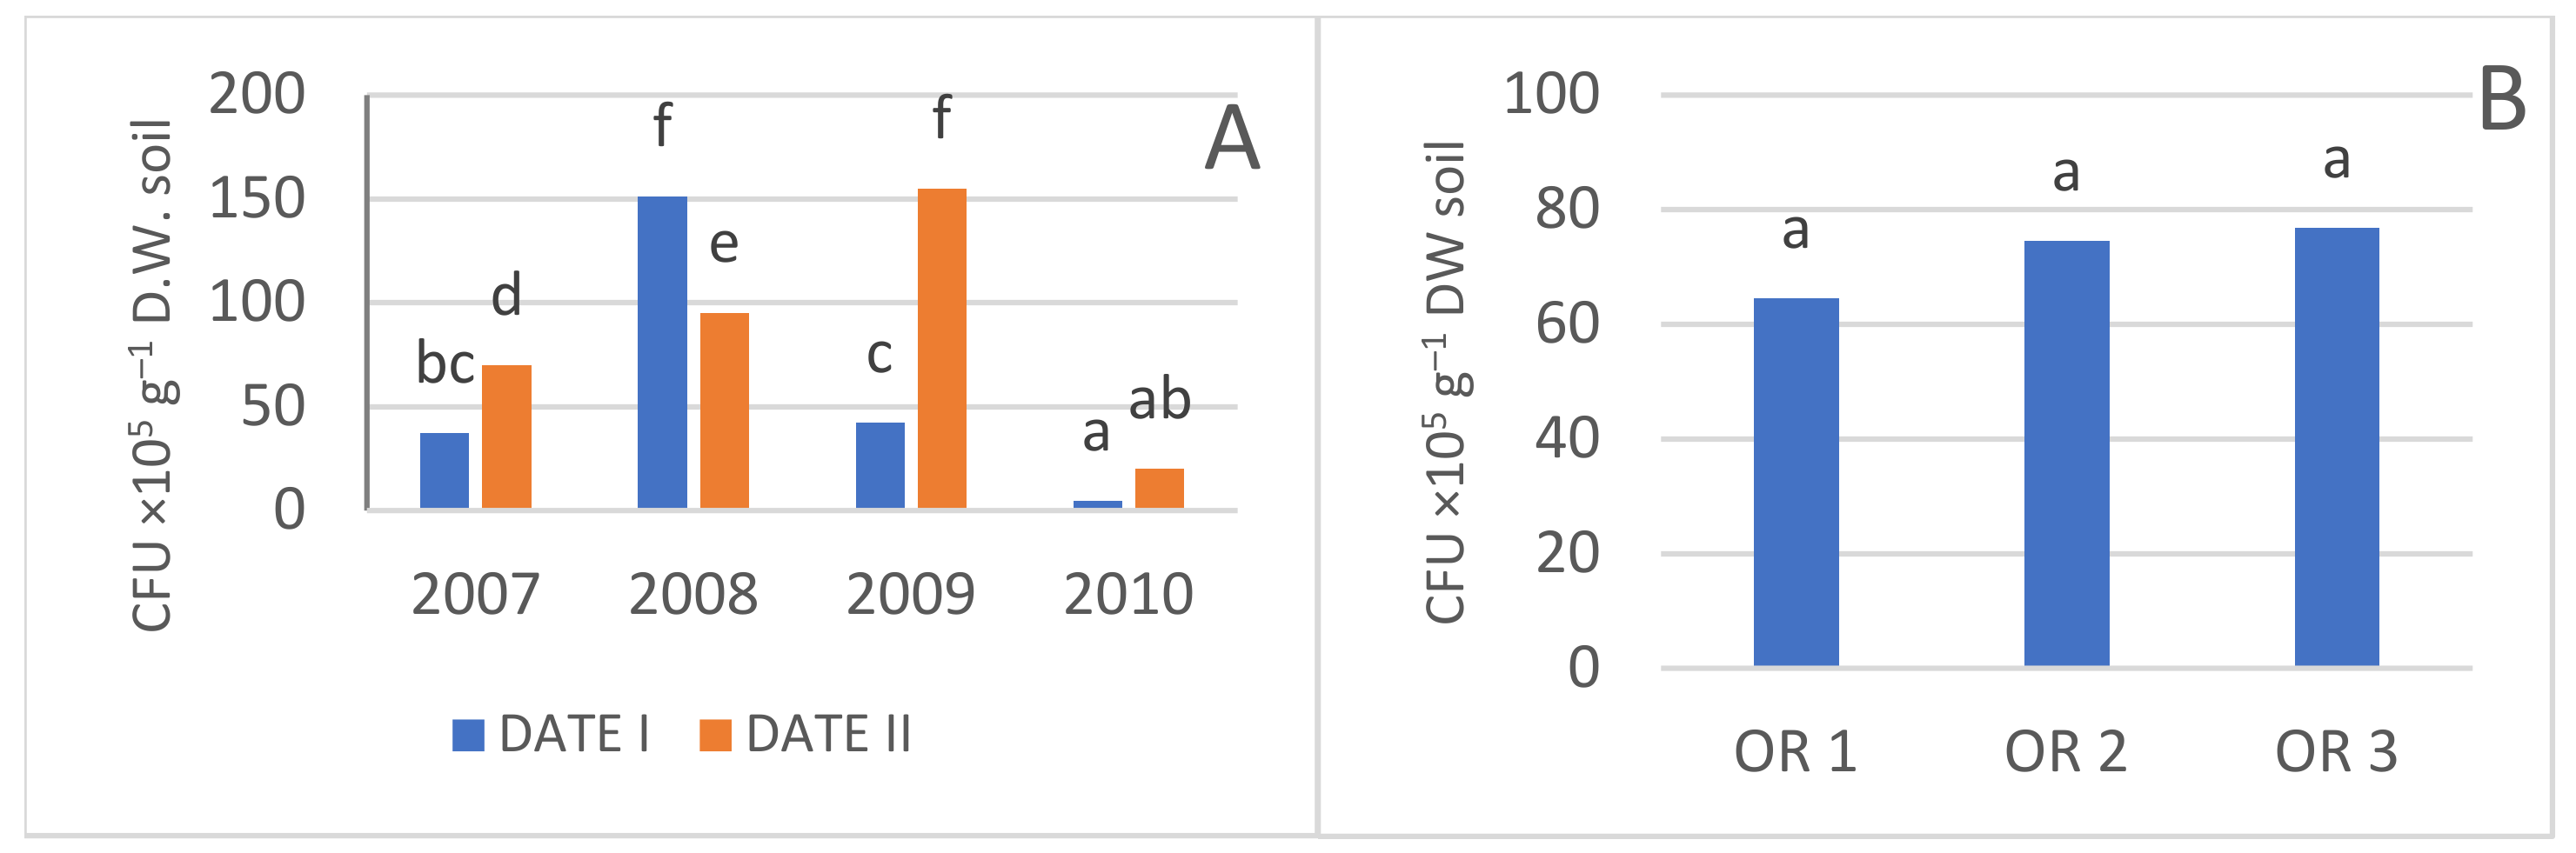
3.3.2. Actinobacteria
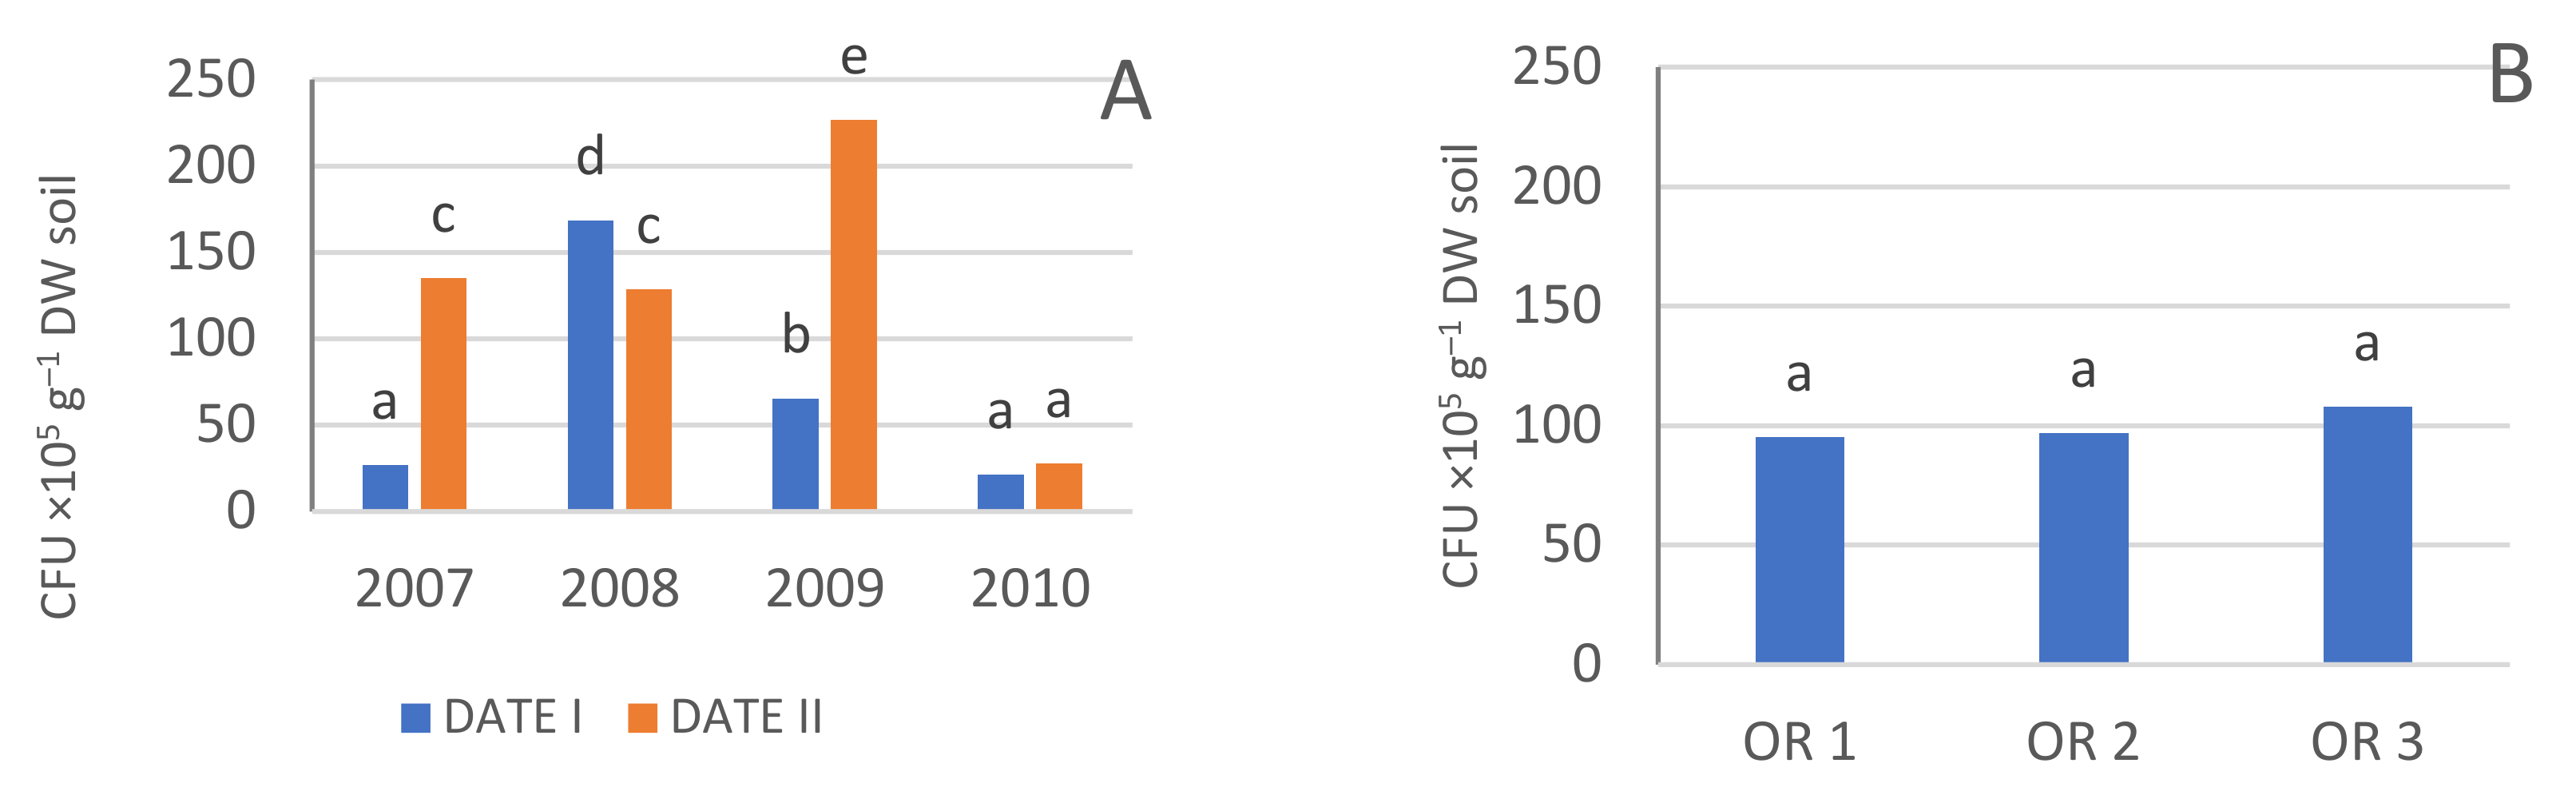
3.3.3. Fungi
3.3.4. Azotobacter
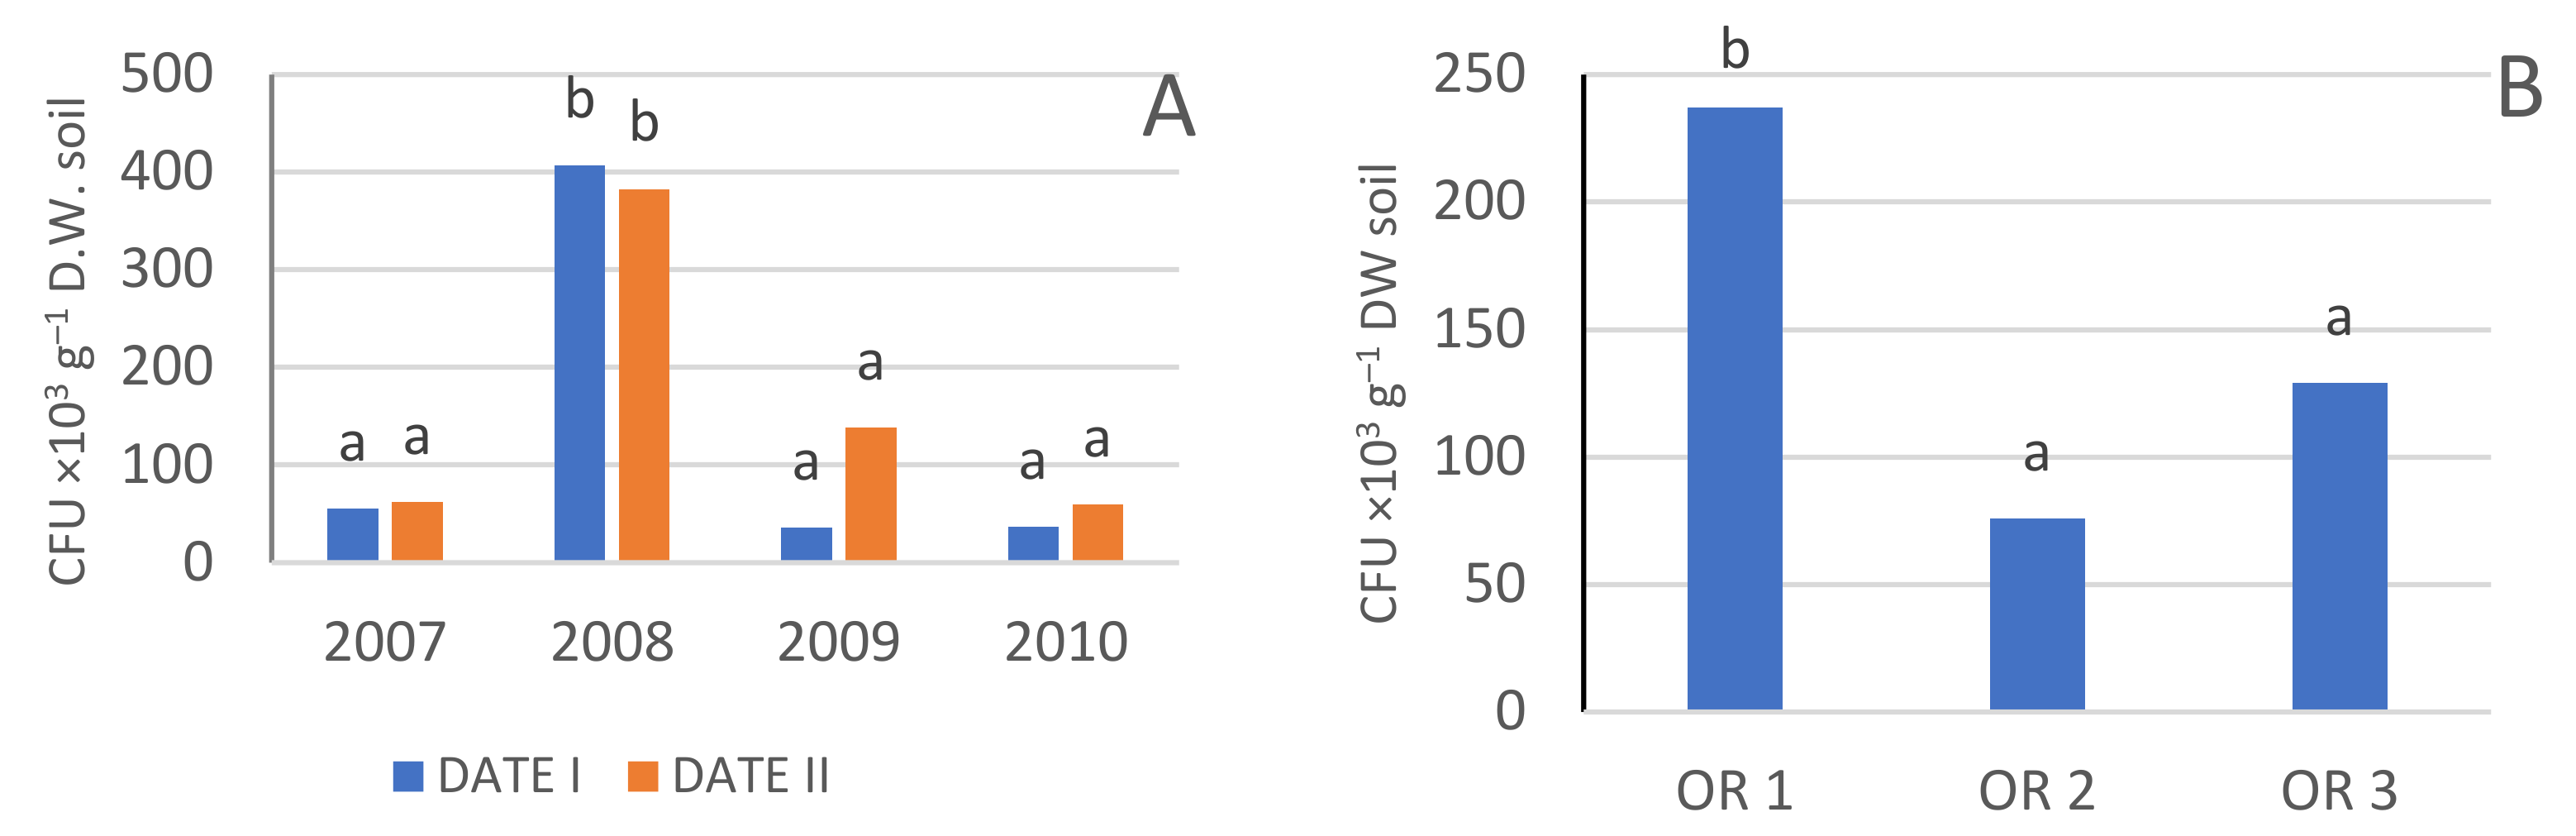
3.3.5. Azospirillum
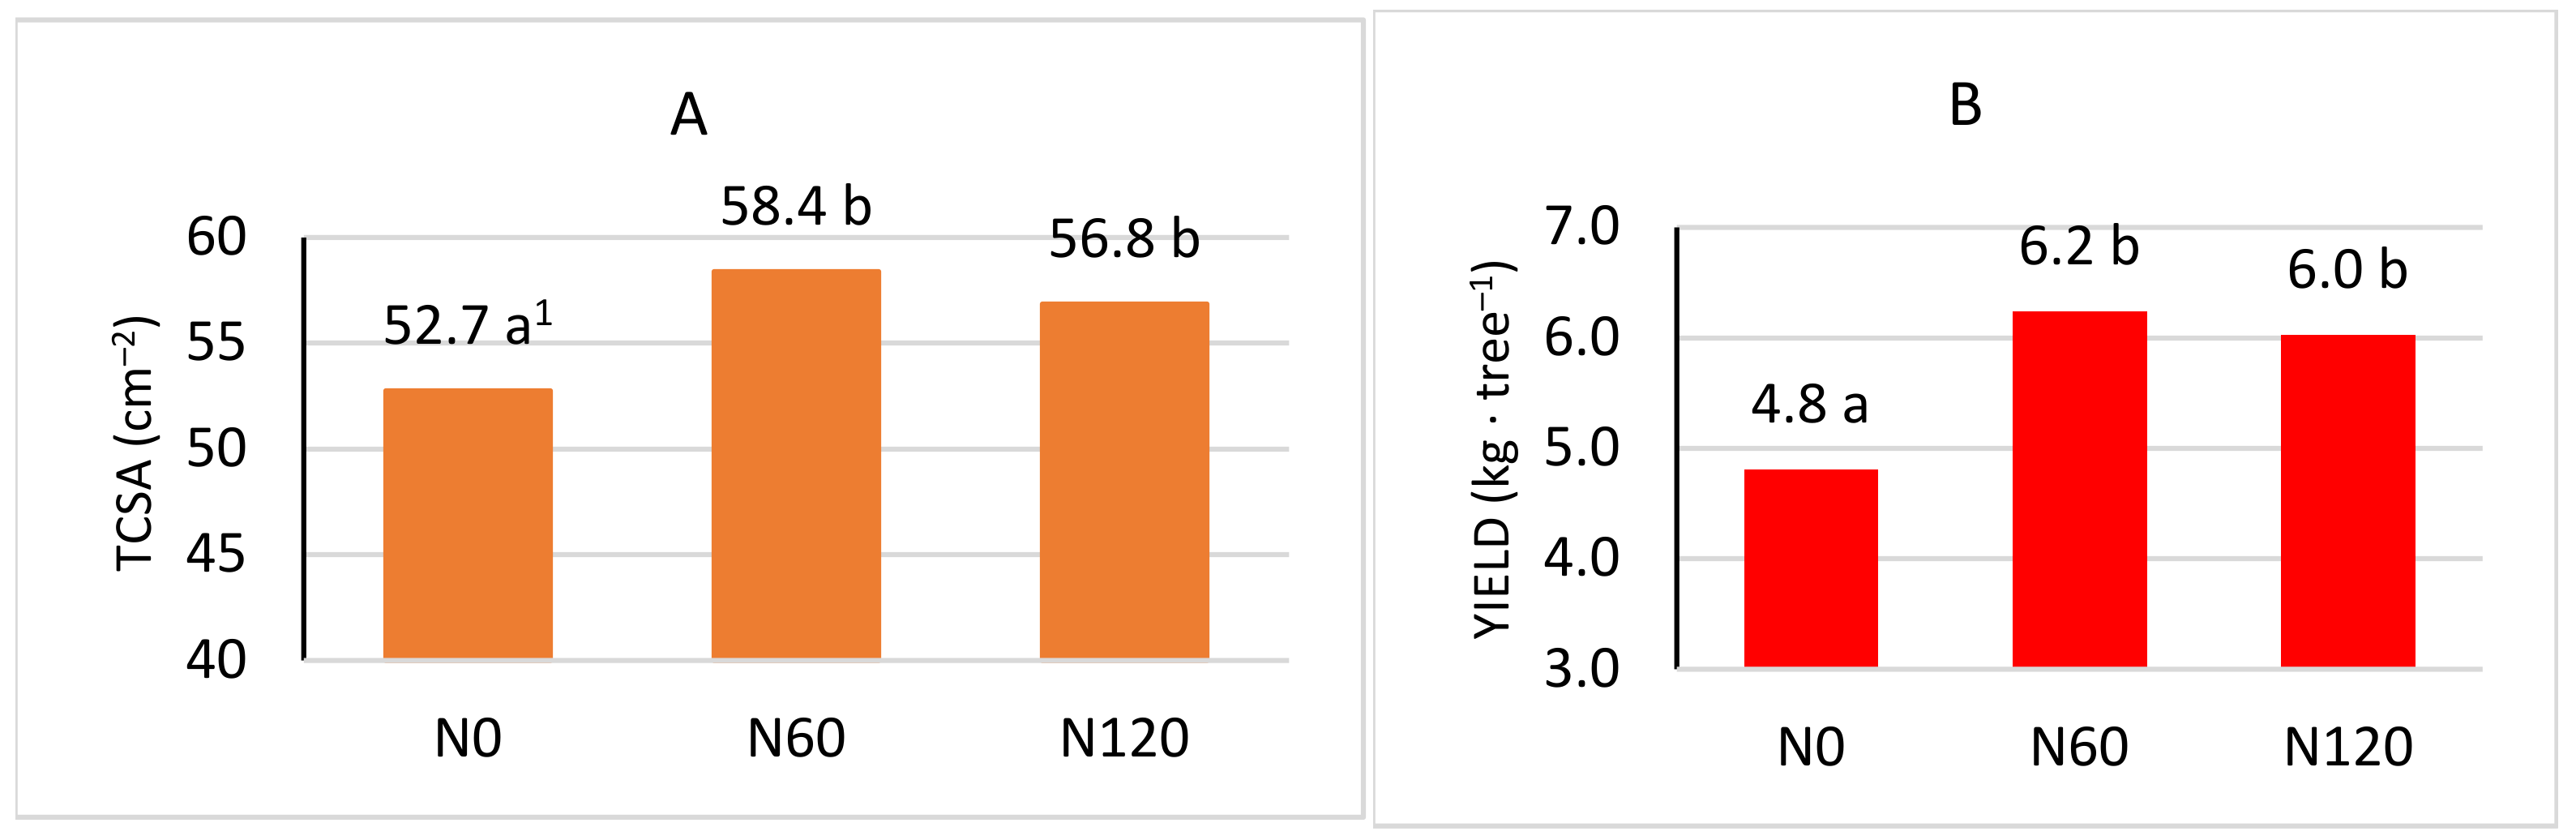
3.4. Yield, Growth, and Quality of Fruit
4. Conclusions
Author Contributions
Funding
Institutional Review Board Statement
Data Availability Statement
Conflicts of Interest
References
- FAO. Food and Agriculture Organization of the United Nations. Available online: https://www.fao.org/faostat/en/#data/QCL (accessed on 15 September 2022).
- Mika, A.; Wawrzyńczak, P.; Buler, Z.; Krawiec, A.; Białkowski, P.; Michalska, B.; Plaskota, M.; Gotowicki, B. Results of Experiments with Densely-Planted Sour Cherry Trees for Harvesting with a Continuously Moving Combine Harvester. J. Fruit Ornam. Plant Res. 2011, 19, 31–40. [Google Scholar]
- Rutkowski, K.; Zydlik, Z.; Pacholak, E. Effect of Tree Pruning Intensity on the Yield and Fruit Quality of the Sour Cherry. Zemdirb. Agric. 2015, 102, 417–422. [Google Scholar] [CrossRef]
- Kurlus, R.; Świerczyński, S.; Rutkowski, K.; Ratajkiewicz, H.; Malinowska, A.; Wyrwał, A. Exogenus ‘GA3’ and ‘GA4+7’ Effects on Phenological Indices, Frost Hardiness and Quality Properties of ‘English Morello’ Sour Cherry (Prunus cerasus L.). Acta Sci. Pol. Hortorum Cultus 2017, 16, 99–109. [Google Scholar] [CrossRef]
- Bieniasz, M.; Dziedzic, E.; Słowik, G. Biological Features of Flowers Influence the Fertility of Lonicera spp. Cultivars. Hortic. Environ. Biotechnol. 2019, 60, 155–166. [Google Scholar] [CrossRef]
- Bieniek, A. Yield, Morphology and Biological Value of Fruits of Actinidia arguta and Actinidia purpurea and Some of Their Hybrid Cultivars Grown in North-Eastern Poland. Acta Sci. Pol. Hortorum Cultus 2012, 11, 117–130. [Google Scholar]
- Łysiak, G. The Sum of Active Temperatures as a Method of Determining the Optimum Harvest Date of ‘Sampion’ and ‘Ligol’ Apple Cultivars. Acta Sci. Pol. Hortorum Cultus 2012, 11, 3–13. [Google Scholar]
- Głowacka, A.; Rozpara, E. Growth and Yield Characteristics of Some Juicing Sour Cherry Cultivars Selected in Poland. Acta Hortic. 2017, 1161, 299–302. [Google Scholar] [CrossRef]
- Grafe, C.; Schuster, M. Physicochemical Characterization of Fruit Quality Traits in a German Sour Cherry Collection. Sci. Hortic. 2014, 180, 24–31. [Google Scholar] [CrossRef]
- Pedišić, S.; Levaj, B.; Dragović-Uzelac, V.; Škevin, D.; Skendrović Babojelić, M. Color Parameters and Total Anthocyanins of Sour Cherries (Prunus cerasus L.) during Ripening. Agric. Conspec. Sci. 2009, 74, 259–262. [Google Scholar]
- Siddiq, M.; Iezzoni, A.; Khan, A.; Breen, P.; Sebolt, A.M.; Dolan, K.D.; Ravi, R. Characterization of New Tart Cherry (Prunus cerasus L.): Selections Based on Fruit Quality, Total Anthocyanins, and Antioxidant Capacity. Int. J. Food Prop. 2011, 14, 471–480. [Google Scholar] [CrossRef] [Green Version]
- Blando, F.; Gerardi, C.; Nicoletti, I. Sour Cherry (Prunus cerasus L.) Anthocyanins as Ingredients for Functional Foods. J. Biomed. Biotechnol. 2004, 2004, 253. [Google Scholar] [CrossRef] [PubMed] [Green Version]
- Łysiak, G.P. Ornamental Flowers Grown in Human Surroundings as a Source of Anthocyanins with High Anti-Inflammatory Properties. Foods 2022, 11, 948. [Google Scholar] [CrossRef] [PubMed]
- Simeone, A.M.; Nota, P.; Ceccarelli, D.; Del Toro, A.; Piazza, G.; De Salvador, F.R.; Caboni, E.; Krupa, T. Anthocyanins in Blueberry Cultivars: Effect of the Growing Area. Acta Hortic. 2012, 926, 713–716. [Google Scholar] [CrossRef]
- Forge, T.; Neilsen, G.; Neilsen, D. Organically Acceptable Practices to Improve Replant Success of Temperate Tree-Fruit Crops. Sci. Hortic. 2016, 200, 205–214. [Google Scholar] [CrossRef]
- Sharma, N.C.; Verma, P.; Singh, N.; Babita. Causes and Control Measures of Apple Replant Problem. Int. J. Bio-Resour. Stress Manag. 2020, 11, 246–257. [Google Scholar] [CrossRef]
- Gondek, K.; Mierzwa-Hersztek, M.; Kopec, M.; Zaleski, T.; Bogdal, S.; Bieniasz, M.; Blaszczyk, J.; Kaczmarczyk, E.; Kowalczyk, B.; Knaga, J. Mineral Composition of Fruits and Leaves of San Andreas® Everbearing Strawberry in Soilless Cultivation. J. Elem. 2020, 25, 1333–1347. [Google Scholar] [CrossRef]
- Mazzola, M.; Manici, L.M. Apple Replant Disease: Role of Microbial Ecology in Cause and Control. Annu. Rev. Phytopathol. 2012, 50, 45–65. [Google Scholar] [CrossRef] [PubMed]
- Cohen, M.F.; Mazzola, M. Resident Bacteria, Nitric Oxide Emission and Particle Size Modulate the Effect of Brassica napus Seed Meal on Disease Incited by Rhizoctonia solani and Pythium spp. Plant Soil 2006, 286, 75–86. [Google Scholar] [CrossRef]
- Harr, J.; Klingler, J. Single and combined effect of Pratylenchus penetrans and Thielaviopsis basicola on the growth of cherry tree cuttings. Z. Pflanzenkrankh. Pflanzenschutz 1976, 83, 615–619. [Google Scholar]
- Utkhede, R.S.; Smith, E.M. Promotion of Apple Tree Growth and Fruit Production by the EBW-4 Strain of Bacillus subtilis in Apple Replant Disease Soil. Can. J. Microbiol. 1992, 38, 1270–1273. [Google Scholar] [CrossRef]
- Gu, Y.-H.; Mazzola, M. Modification of Fluorescent Pseudomonad Community and Control of Apple Replant Disease Induced in a Wheat Cultivar-Specific Manner. Appl. Soil Ecol. 2003, 24, 57–72. [Google Scholar] [CrossRef]
- Benizri, E.; Piutti, S.; Verger, S.; Pagès, L.; Vercambre, G.; Poessel, J.L.; Michelot, P. Replant Diseases: Bacterial Community Structure and Diversity in Peach Rhizosphere as Determined by Metabolic and Genetic Fingerprinting. Soil Biol. Biochem. 2005, 37, 1738–1746. [Google Scholar] [CrossRef]
- Westcott, S.W.; Beer, S.V.; Israel, H.W. Interactions Between Actinomycete-Like Organisms and Young Apple Roots Grown in Soil Conducive to Apple Replant Disease. Phytopathology 1987, 77, 1071–1077. [Google Scholar] [CrossRef]
- Bielińska, E.J.; Mocek, A.; Paul-Lis, M. Impact of Tillage System Cultivation on Enzymatic Activity of Typologically Diverse Soils. J. Res. Appl. Agric. 2008, 53, 10–13. [Google Scholar]
- Wang, L.; Zhao, Y.; Al-Kaisi, M.; Yang, J.; Chen, Y.; Sui, P. Effects of Seven Diversified Crop Rotations on Selected Soil Health Indicators and Wheat Productivity. Agronomy 2020, 10, 235. [Google Scholar] [CrossRef] [Green Version]
- Styła, K.; Sawicka, A. Biochemical Activity of Soil in Apple Tree (Malus domestica Borkh.) Orchard after Replantation. Agron Res 2009, 7, 855–864. [Google Scholar]
- Doran, J.W.; Coleman, D.C.; Bezdicek, D.F.; Stewart, B.A.; Dick, R.P. Soil Enzyme Activities as Indicators of Soil Quality. In SSSA Special Publication; Soil Science Society of America and American Society of Agronomy: Madison, WI, USA, 1994; ISBN 978-0-89118-930-5. [Google Scholar]
- Bielińska, E.; Mocek-Płóciniak, A. Impact of the Tillage System on the Soil Enzymatic Activity. Arch. Environ. Prot. 2012, 38, 75–82. [Google Scholar] [CrossRef]
- Cartes, P.; Jara, A.A.; Demanet, R.; Mora, M. de la L. Urease Activity and Nitrogen Mineralization Kinetics as Affected by Temperature and Urea Input Rate in Southern Chilean Andisols. J. Soil Sci. Plant Nutr. 2009, 9, 69–82. [Google Scholar]
- Meyer, A.H.; Wooldridge, J.; Dames, J.F. Effect of Conventional and Organic Orchard Floor Management Practices on Enzyme Activities and Microbial Counts in a ‘Cripp’s Pink’/M7 Apple Orchard. South Afr. J. Plant Soil 2015, 32, 105–112. [Google Scholar] [CrossRef]
- Ochmian, I.; Kozos, K.; Jaroszewska, A.; Malinowski, R. Chemical and Enzymatic Changes of Different Soils during Their Acidification to Adapt Them to the Cultivation of Highbush Blueberry. Agronomy 2021, 11, 44. [Google Scholar] [CrossRef]
- Badiane, N.N.Y.; Chotte, J.L.; Pate, E.; Masse, D.; Rouland, C. Use of Soil Enzyme Activities to Monitor Soil Quality in Natural and Improved Fallows in Semi-Arid Tropical Regions. Appl. Soil Ecol. 2001, 18, 229–238. [Google Scholar] [CrossRef]
- Gil-Sotres, F.; Trasar-Cepeda, C.; Leirós, M.C.; Labandeira, S. Different Approaches to Evaluating Soil Quality Using Biochemical Properties. Soil Biol. Biochem. 2005, 37, 877–887. [Google Scholar] [CrossRef]
- Qian, X.; Gu, J.; Pan, H.; Zhang, K.; Sun, W.; Wang, X.; Gao, H. Effects of Living Mulches on the Soil Nutrient Contents, Enzyme Activities, and Bacterial Community Diversities of Apple Orchard Soils. Eur. J. Soil Biol. 2015, 70, 23–30. [Google Scholar] [CrossRef]
- Fekete, I.; Varga, C.; Kotroczó, Z.; Karkomperger, Z.; Tóth, J.A. The Effect of Temperature and Moisture on Enzyme Activity in Síkfőkút Site. Cereal Res. Commun. 2007, 35, 381–384. [Google Scholar] [CrossRef]
- Jacoby, R.; Peukert, M.; Succurro, A.; Koprivova, A.; Kopriva, S. The Role of Soil Microorganisms in Plant Mineral Nutrition—Current Knowledge and Future Directions. Front. Plant Sci. 2017, 8, 1617. [Google Scholar] [CrossRef] [PubMed] [Green Version]
- Rossel, D.; Tarradellas, J.; Bitton, G.; Morel, J.-L. Use of Enzymes. In Soil Ecotoxicology; CRC Press: Boca Raton, FL, USA, 1996; pp. 179–206. ISBN 978-1-56670-134-1. [Google Scholar]
- Priha, O.; Hallantie, T.; Smolander, A. Comparing Microbial Biomass, Denitrification Enzyme Activity, and Numbers of Nitrifiers in the Rhizospheres of Pinus sylvestris, Picea abies and Betula pendula Seedlings by Microscale Methods. Biol Fertil Soils 1999, 30, 14–19. [Google Scholar] [CrossRef]
- Si, P.; Shao, W.; Yu, H.; Yang, X.; Gao, D.; Qiao, X.; Wang, Z.; Wu, G. Rhizosphere Microenvironments of Eight Common Deciduous Fruit Trees Were Shaped by Microbes in Northern China. Front. Microbiol. 2018, 9, 3147. [Google Scholar] [CrossRef]
- Dahm, H. Generic Composition and Physiological and Cultural Properties of Heterotrophic Bacteria Isolated from Soil, Rhizosphere and Mycorrhizosphere of Pine (Pinus silvestris L.). Acta Microbiol. Pol. 1984, 33, 147–156. [Google Scholar]
- Poulton, J.E. Cyanogenesis in Plants. Plant Physiol. 1990, 94, 401–405. [Google Scholar] [CrossRef]
- Schönbeck, F.; Schlösser, E. Preformed Substances as Potential Protectants. In Physiological Plant Pathology; Heitefuss, R., Williams, P.H., Eds.; Encyclopedia of Plant Physiology; Springer: Berlin/Heidelberg, Germany, 1976; Volume 4, pp. 653–678. ISBN 978-3-642-66279-9. [Google Scholar]
- Januszek, K.; Długa, J.; Socha, J. Dehydrogenase Activity of Forest Soils Depends on the Assay Used. Int. Agrophysics 2015, 29, 47–59. [Google Scholar] [CrossRef]
- Fischer, W.R.; Pfanneberg, T. Die Dehydrogenase-Aktivität rezenter Unterwasserböden. Z. Pflanz. Bodenkd. 1979, 142, 492–499. [Google Scholar] [CrossRef]
- Wolinska, A.; Stepniewska, Z. Dehydrogenase Activity in the Soil Environment. In Dehydrogenases; Canuto, R.A., Ed.; IntechOpen: London, UK, 2012; pp. 183–210. ISBN 978-953-307-019-3. [Google Scholar]
- Singha, A.; Adak, T.; Kumar, K.; Shukla, S.K.; Singh, V.K. Effect of Integrated Nutrient Management on Dehydrogenase Activity, Soil Organic Carbon and Soil Moisture Variability in a Mango Orchard Ecosystem. J. Anim. Plant Sci. 2014, 24, 843–849. [Google Scholar]
- Godlewska, A. Assessment of the Effect of Npk Fertilisation and Elemental Sulphur on Soil Enzyme Activity. Fresenius Environ. Bull. 2018, 27, 180–186. [Google Scholar]
- Sawicka, B.; Krochmal-Marczak, B.; Pszczółkowski, P.; Bielińska, E.J.; Wójcikowska-Kapusta, A.; Barbaś, P.; Skiba, D. Effect of Differentiated Nitrogen Fertilization on the Enzymatic Activity of the Soil for Sweet Potato (Ipomoea batatas L. [Lam.]) Cultivation. Agronomy 2020, 10, 1970. [Google Scholar] [CrossRef]
- Guo, P.; Wang, C.; Jia, Y.; Wang, Q.; Han, G.; Tian, X. Responses of Soil Microbial Biomass and Enzymatic Activities to Fertilizations of Mixed Inorganic and Organic Nitrogen at a Subtropical Forest in East China. Plant Soil 2011, 338, 355–366. [Google Scholar] [CrossRef]
- Kowalczyk, W.; Wrona, D.; Przybyłko, S. Content of Minerals in Soil, Apple Tree Leaves and Fruits Depending on Nitrogen Fertilization. J. Elem. 2017, 22, 67–77. [Google Scholar] [CrossRef]
- Trivedi, P.; Delgado-Baquerizo, M.; Anderson, I.C.; Singh, B.K. Response of Soil Properties and Microbial Communities to Agriculture: Implications for Primary Productivity and Soil Health Indicators. Front. Plant Sci. 2016, 7, 990. [Google Scholar] [CrossRef] [Green Version]
- Castellano-Hinojosa, A.; Strauss, S.L. Impact of Cover Crops on the Soil Microbiome of Tree Crops. Microorganisms 2020, 8, 328. [Google Scholar] [CrossRef] [Green Version]
- Starzyk, J.; Niewiadomska, A.; Wolna-Maruwka, A.; Swedzynska, D. Zmiany liczebności Azospirillum i Azotobacter w glebie pod uprawą kukurydzy (Zea mays L.) z zastosowaniem różnych nawozów organicznych. Fragm. Agron. 2013, 30, 147–155. [Google Scholar]
- Casacchia, T.; Bati, C.B.; Sofo, A.; Dichio, B.; Motta, F.; Xiloyannis, C. Long-Term Consequences of Tillage, Organic Amendments, Residue Management and Localized Irrigation on Selected Soil Micro-Flora Groups in a Mediterranean Apricot Orchard. Acta Hortic. 2010, 862, 447–453. [Google Scholar] [CrossRef] [Green Version]
- Zheng, W.; Zhao, Z.; Gong, Q.; Zhai, B.; Li, Z. Effects of Cover Crop in an Apple Orchard on Microbial Community Composition, Networks, and Potential Genes Involved with Degradation of Crop Residues in Soil. Biol. Fertil. Soils 2018, 54, 743–759. [Google Scholar] [CrossRef]
- Catská, V. Biological Methods in Relation to Apple Replant Problem. Acta Hortic. 1988, 233, 45–48. [Google Scholar] [CrossRef]
- Rutkowski, K.; Pacholak, E.; Sawicka, A. Ocena Stanu Mikrobiologicznego Gleby Przy Zróżnicowanych Warunkach Nawożenia i Nawadniania w Sadzie Replantowanym. I. Liczebność Bakterii. Pr. Kom. Nauk Rol. Kom. Nauk Leśn. PTPN 2000, 89, 175–184. [Google Scholar]
- Döbereiner, J. Forage Grasses and Grain Crops. In Methods for Evaluating Biological Nitrogen Fixation; John Wiley & Sons Ltd: Chichester, UK, 1980; pp. 535–555. ISBN 978-0-471-27759-0. [Google Scholar]
- Kozieł, M.; Gałązka, A.; Martyniuk, S. Wolnożyjące Bakterie Wiążące Azot Atmosferyczny z Rodzaju Azotobacter–Występowanie, Liczebność i Znaczenie. Stud. Rap. IUNG-PIB 2018, 56, 57–70. [Google Scholar] [CrossRef]
- Pedraza, R.O.; Filippone, M.P.; Fontana, C.; Salazar, S.M.; Ramírez-Mata, A.; Sierra-Cacho, D.; Baca, B.E. Chapter 6—Azospirillum. In Beneficial Microbes in Agro-Ecology: Bacteria and Fungi; Amaresan, N., Senthil Kumar, M., Annapurna, K., Kumar, K., Sankaranarayanan, A., Eds.; Academic Press: London, UK, 2020; pp. 73–105. ISBN 978-0-12-823414-3. [Google Scholar]
- Singh, A.; Patel, R.K.; Singh, R.P. Correlation Studies of Chemical Fertilizers and Biofertilizers with Growth, Yield and Nutrient Status of Olive Trees (Olea europea). Indian J. Hill Farming 2003, 16, 99–100. [Google Scholar]
- Lindhard, P.H.; Hansen, P. Effect of Timing of Nitrogen Supply on Growth, Bud, Flower and Fruit Development of Young Sour Cherries (Prunus cerasus L.). Sci. Hortic. 1997, 69, 181–188. [Google Scholar] [CrossRef]
- Stolyarov, M.E.; Leonicheva, E.V.; Leontieva, L.I.; Stolyarov, M.E. The Impact of Soil Nutritional Conditions on Sour Cherry Yield and Seasonal Dynamics of Mineral Nitrogen in Root Zone. Sadovod. Vinograd. 2020, 37–43. [Google Scholar] [CrossRef]
- Roeva, T.; Leonicheva, E.; Leonteva, L. Changes of the Agrochemical Soil Characteristics in the Stone Fruit Orchard with the Permanent Application of Nitrogen and Potash Fertilizers; EDP Sciences: Les Ulis, France, 2022; Volume 47, p. 09003. [Google Scholar]
- Bonomelli, C.; Artacho, P. Nitrogen Application in a Two-Year-Old Cherry Orchard on Gisela® 6: Effects on Biomass Accumulation, Nitrogen Uptake and Partitioning. Acta Hortic. 2014, 1020, 315–322. [Google Scholar] [CrossRef]
- Artacho, P.; Bonomelli, C. Changes in Fine-Root Production, Phenology and Spatial Distribution in Response to N Application in Irrigated Sweet Cherry Trees. Tree Physiol. 2016, 36, 601–617. [Google Scholar] [CrossRef] [Green Version]
- Quero-García, J.; Iezzoni, A.; Puławska, J.; Lang, G. Cherries: Botany, Production and Uses; CABI: Wallingford, UK, 2017; ISBN 1-78064-837-5. [Google Scholar]
- Olszak, R. Methodology of Integrated Cherry Protection, 4th ed.; Main Inspector of Plant Health and Seed Inspection: Warsaw, Poland, 2020. (In Polish) [Google Scholar]
- Sobiczewski, P. Methodology of Integrated Protection of Apple Trees (Polish), 6th ed.; Main Inspector of Plant Health and Seed Inspection: Warsaw, Poland, 2020. [Google Scholar]
- Neilsen, G.; Kappel, F.; Neilsen, D. Fertigation and Crop Load Affect Yield, Nutrition, and Fruit Quality of ‘Lapins’ Sweet Cherry on Gisela 5 Rootstock. HortScience 2007, 42, 1456–1462. [Google Scholar] [CrossRef] [Green Version]
- Neilsen, G.; Kappel, F.; Neilsen, D. Fertigation Method Affects Performance of ‘Lapins’ Sweet Cherry on Gisela 5 Rootstock. HortScience 2004, 39, 1716–1721. [Google Scholar] [CrossRef] [Green Version]
- Dziedzic, E.; Błaszczyk, J.; Kaczmarczyk, E. Influence of Rootstocks and Storage Conditions on the Quality of Sweet Cherry Fruits ‘Regina’. Acta Sci. Pol. Hortorum Cultus 2016, 15, 119–131. [Google Scholar]
- Thalmann, A. Zur Methodik Der Bestimmung Der DehydrogenaseaktivitAt Im Boden Mittels Triphenytetrazoliumchlorid (TTC). Landwirtsch Forsch. 1968, 21, 249–258. [Google Scholar]
- Ladd, J.; Butler, J. Short-Term Assays of Soil Proteolytic Enzyme Activities Using Proteins and Dipeptide Derivatives as Substrates. Soil Biol. Biochem. 1972, 4, 19–30. [Google Scholar] [CrossRef]
- Grabińska-Łoniewska, A. Laboratory Classes in General Microbiology, 2nd ed.; OWPW: Warsaw, Poland, 1999; ISBN 83-7207-136-5. (In Polish) [Google Scholar]
- Martin, J.P. Use of acid, rose bengal, and streptomycin in the plate method for estimating soil fungi. Soil Sci. 1950, 69, 215–232. [Google Scholar] [CrossRef]
- Fenglerowa, W. Simple Method for Counting Azotobacter in Soil Samples. Acta Microbiol. Pol. 1965, 14. [Google Scholar]
- Niewiadomska, A.; Majchrzak, L.; Borowiak, K.; Wolna-Maruwka, A.; Waraczewska, Z.; Budka, A.; Gaj, R. The Influence of Tillage and Cover Cropping on Soil Microbial Parameters and Spring Wheat Physiology. Agronomy 2020, 10, 200. [Google Scholar] [CrossRef]
- Bielińska, E.J.; Węgorek, T. Assessment of mid-field shelterbelt influence on enzymatic activity of lessive soil. Acta Agroph. 2005, 5, 17–24. [Google Scholar]
- Gostkowska, K.; Furczak, J.; Domzal, H.; Bielinska, E.J. Suitability of Some Biochemical and Microbiological Tests for the Evaluation of the Degradation Degree of Podzolic Soil on the Background of It Differentiated Usage. Pol. J. Soil Sci. Pol. 1998, 31, 69–78. [Google Scholar]
- Aon, M.A.; Colaneri, A.C., II. Temporal and Spatial Evolution of Enzymatic Activities and Physico-Chemical Properties in an Agricultural Soil. Appl. Soil Ecol. 2001, 3, 255–270. [Google Scholar] [CrossRef]
- Mitchell, R.L.; Russell, W.J. Root Development and Rooting Patterns of Soybean (Glycine max (L.) Merrill) Evaluated Under Field Conditions1. Agron. J. 1971, 63, 313–316. [Google Scholar] [CrossRef]
- Natywa, M.; Sawicka, A.; Wolna-Maruwka, A. Microbial and enzymatic activity in the soil under maize crop in relation to differentiated nitrogen fertilisation. Water Environ. Rural Areas 2010, 10, 111–120. [Google Scholar]
- Xiong, H.; Ma, H.; Hu, B.; Zhao, H.; Wang, J.; Rennenberg, H.; Shi, X.; Zhang, Y. Nitrogen Fertilization Stimulates Nitrogen Assimilation and Modifies Nitrogen Partitioning in the Spring Shoot Leaves of Citrus (Citrus reticulata Blanco) Trees. J. Plant Physiol. 2021, 267, 153556. [Google Scholar] [CrossRef]
- Mazzon, M.; Cavani, L.; Margon, A.; Sorrenti, G.; Ciavatta, C.; Marzadori, C. Changes in Soil Phenol Oxidase Activities Due to Long-Term Application of Compost and Mineral N in a Walnut Orchard. Geoderma 2018, 316, 70–77. [Google Scholar] [CrossRef]
- Sardans, J.; Peñuelas, J. Drought Decreases Soil Enzyme Activity in a Mediterranean Quercus ilex L. Forest. Soil Biol. Biochem. 2005, 37, 455–461. [Google Scholar] [CrossRef]
- Vranova, V.; Rejsek, K.; Formanek, P. Proteolytic Activity in Soil: A Review. Appl. Soil Ecol. 2013, 70, 23–32. [Google Scholar] [CrossRef]
- Fauci, M.F.; Dick, R.P. Soil Microbial Dynamics: Short- and Long-Term Effects of Inorganic and Organic Nitrogen. Soil Sci. Soc. Am. J. 1994, 58, 801–806. [Google Scholar] [CrossRef]
- Lysiak, P.G.; Pacholak, E. Effects of 13 Years Soil Fertilisation on Storage Quality of ‘Cortland’ Apples. Acta Hortic. 1999, 485, 265–272. [Google Scholar] [CrossRef]
- Ouyang, Y.; Norton, J.M. Short-Term Nitrogen Fertilization Affects Microbial Community Composition and Nitrogen Mineralization Functions in an Agricultural Soil. Appl. Env. Microbiol. 2020, 86, e02278-19. [Google Scholar] [CrossRef]
- Styła, K.; Wolna-Maruwka, A. Wpływ Nawodnienia Na Liczebność Różnych Grup Drobnoustrojów w Glebie w Sadzie Jabłoniowym Po Replantacji. Zesz. Nauk. Uniw. Przyr. Wroc. 2006, 89, 329–338. [Google Scholar]
- Bielińska, E.J.; Domżal, H. Wpływ Zakwaszenia Gleby Użytkowanej Sadowniczo Na Jej Aktywność Biochemiczną. Zesz. Probl. Postępów Nauk Rol. 1998, 456, 497–502. [Google Scholar]
- Pacholak, E.; Zydlik, Z.; Sawicka, A. Wpływ Nawożenia i Nawadniania Na Stan Mikrobiologiczny Gleby w Replantowanym Sadzie Jabłoniowym. Część 2. Liczebność Bakterii. Pr. Kom. Nauk Rol. Kom. Nauk Leśn. PTPN 2004, 97, 307–316. [Google Scholar]
- García-Orenes, F.; Roldán, A.; Morugán-Coronado, A.; Linares, C.; Cerdà, A.; Caravaca, F. Organic Fertilization in Traditional Mediterranean Grapevine Orchards Mediates Changes in Soil Microbial Community Structure and Enhances Soil Fertility. Land Degrad. Dev. 2016, 27, 1622–1628. [Google Scholar] [CrossRef]
- Barnard, R.L.; Osborne, C.A.; Firestone, M.K. Responses of Soil Bacterial and Fungal Communities to Extreme Desiccation and Rewetting. ISME J 2013, 7, 2229–2241. [Google Scholar] [CrossRef] [PubMed]
- Qiang, W.; Yang, B.; Liu, Y.; Qi, K.; Yang, T.; Pang, X. Effects of Reclamation Age on Soil Microbial Communities and Enzymatic Activities in the Sloping Citrus Orchards of Southwestern China. Appl. Soil Ecol. 2020, 152, 103566. [Google Scholar] [CrossRef]
- Otto, G.; Winkler, H.; Szabó, K. Proof of Actinomycetes in Rootlets of Species of Rosaceae from a Sard Soil—A Contribution to the Specificity of Replant Diseases. Acta Hortic. 1994, 363, 43–48. [Google Scholar] [CrossRef]
- Zydlik, Z.; Rutkowski, K.; Pacholak, E. Effect of Soil Fatigue Prevention Methods on Microbiological Soil Status in Replanted Apple Tree Orchard. Part III. Number of Fungi and Actinomycetes. Electron. J. Pol. Agric. Univ. EJPAU 2006, 9, 58. [Google Scholar]
- Paśmionka, I.B.; Bulski, K.; Boligłowa, E. The Participation of Microbiota in the Transformation of Nitrogen Compounds in the Soil—A Review. Agronomy 2021, 11, 977. [Google Scholar] [CrossRef]
- Okon, Y. Azospirillum as a Potential Inoculant for Agriculture. Trends Biotechnol. 1985, 3, 223–228. [Google Scholar] [CrossRef]
- Gałązka, A.; Bigos, J.; Siebielec, S. Promowanie Wzrostu Roślin Przez Bakterie z Rodzaju Azospirillum Oraz Ich Zastosowanie w Rolnictwie (Plant Growth Promotion by Bacteria of the Genus Azospirillum and Their Application in Agriculture). Pol. J. Agron. 2015, 23, 48–62. [Google Scholar]


| Months | Year | |||||||
|---|---|---|---|---|---|---|---|---|
| 2007 | 2008 | 2009 | 2010 | 2011 | 2012 | 2013 | ||
| Precipitation (mm) | ||||||||
| April | 5.4 | 56.2 | 19.6 | 19.0 | 9.2 | 9.8 | 85.2 | |
| May | 98.8 | 9.0 | 85.4 | 110.1 | 32.8 | 57.0 | 99.4 | |
| Jun | 85.6 | 15.2 | 160.0 | 13.0 | 56.2 | 127.8 | 46.0 | |
| July | 95.8 | 62.0 | 79.4 | 111.4 | 182.4 | 121.8 | 37.6 | |
| August | 34.8 | 116.4 | 32.8 | 124.1 | 32.4 | 39.0 | 38.2 | |
| September | 29.4 | 27.0 | 52.4 | 72.4 | 27.8 | 24.6 | 81.0 | |
| October | 20.2 | 57.2 | 68.4 | 5.3 | 27.4 | 64.4 | 23.8 | |
| Precipitation | 370.0 | 343.0 | 498.0 | 455.3 | 368.2 | 444.4 | 411.2 | |
| Temperature (°C) | ||||||||
| April | 9.6 | 7.9 | 11.3 | 8.7 | 12.6 | 9.8 | 9.5 | |
| May | 14.2 | 13.6 | 12.5 | 11.6 | 16.5 | 15.4 | 14.4 | |
| Jun | 18.1 | 17.4 | 14.6 | 17.0 | 21.3 | 16.0 | 17.4 | |
| July | 17.7 | 19.0 | 18.5 | 22.0 | 18.6 | 19.1 | 19.7 | |
| August | 18.2 | 17.6 | 18.8 | 18.8 | 20.6 | 18.3 | 18.7 | |
| September | 12.8 | 12.7 | 14.8 | 12.7 | 16.2 | 14.2 | 12.6 | |
| October | 7.4 | 8.6 | 6.8 | 6.4 | 9.4 | 8.2 | 10.2 | |
| Mean | 14.0 | 13.8 | 13.9 | 13.9 | 16.5 | 14.4 | 14.6 | |
| Orchard | Fertilization | Date I | Date II | Date III |
|---|---|---|---|---|
| 0 N | 4.3 a 1 | 2.9 ab | 2.6 a | |
| Orchard 1 | 60 N | 11.3 e | 5.9 c | 6.7 c |
| 120 N | 8.4 c | 3.4 ab | 4.0 ab | |
| 0 N | 6.9 bc | 2.1 a | 2.5 a | |
| Orchard 2 | 60 N | 8.8 cd | 3.5 ab | 3.9 ab |
| 120 N | 8.2 c | 3.1 ab | 2.8 a | |
| 0 N | 5.7 ab | 3.0 ab | 3.8 ab | |
| Orchard 3 | 60 N | 10.7 de | 4.2 b | 5.6 bc |
| 120 N | 7.9 bc | 3.2 ab | 5.2 bc | |
| OR 1 | 8.0 a 2 | 4.1 b | 4.5 b | |
| Mean of orchard | OR 2 | 8.0 a | 2.9 a | 3.1 a |
| OR 3 | 8.1 a | 3.5 ab | 4.9 b | |
| 0 N | 5.6 a 3 | 2.7 a | 3.0 a | |
| Mean of fertilization | 60 N | 10.3 c | 4.5 b | 5.4 b |
| 120 N | 8.2 b | 3.2 a | 4.0 a | |
| Main effects 4 | ||||
| Orchard (A) | ns | * | ** | |
| Fertilization (B) | *** | *** | *** | |
| Interaction | ||||
| A × B | * | ** | ** |
| Fertilization | Date I | Date II | Date III |
|---|---|---|---|
| 0 N | 3.2 a 1 | 1.6 a | 1.8 a |
| 60 N | 6.1 b | 2.5 b | 3.4 b |
| 120 N | 5.0 ab | 1.9 a | 2.8 ab |
| Main effects 2 | |||
| Fertilization | * | ** | * |
| Orchard | Fertilization | Date I | Date II | Date III |
|---|---|---|---|---|
| 0 N | 7.6 b 1 | 3.1 a | 5.5 a | |
| OR 1 | 60 N | 7.6 b | 6.1 ab | 9.8 b–d |
| 120 N | 3.5 a | 9.5 b | 12.4 cd | |
| 0 N | 4.8 ab | 5.0 a | 9.5 b–d | |
| OR 2 | 60 N | 2.9 a | 5.0 a | 9.0 a–c |
| 120 N | 3.8 a | 3.6 a | 8.1 ab | |
| 0 N | 3.9 a | 6.5 ab | 12.9 d | |
| OR 3 | 60 N | 4.9 ab | 6.2 ab | 11.7 b–d |
| 120 N | 5.2 ab | 3.6 a | 9.9 b–d | |
| Mean of orchard | OR 1 | 6.2 B 2 | 6.2 a | 9.3 a |
| OR 2 | 3.8 a | 4.5 a | 8.9 a | |
| OR 3 | 4.7 ab | 5.5 a | 11.5 b | |
| Mean of fertilization | 0 N | 5.5 B 3 | 4.9 a | 9.3 a |
| 60 N | 5.1 b | 5.8 b | 10.2 ab | |
| 120 N | 4.1 a | 5.6 b | 12.5 b | |
| Main effects 4 | ||||
| Orchard (A) | * | ns | * | |
| Fertilization (B) | ** | * | * | |
| Interaction | ||||
| A × B | * | ** | ** |
| Fertilization | Date I | Date II | Date III |
|---|---|---|---|
| 0 N | 6.5 a 1 | 5.8 a | 7.7 a |
| 60 N | 9.3 b | 6.4 b | 9.8 b |
| 120 N | 2.8 ab | 4.9 a | 8.0 ab |
| Main effects 2 | |||
| * | ** | * |
| Term I | Term II | Term III | ||||
|---|---|---|---|---|---|---|
| Dehydrogenase Activity | Protease Activity | Dehydrogenase Activity | Protease Activity | Dehydrogenase Activity | Protease Activity | |
| 2008–2010 | ||||||
| pH | 0.23 | 0.18 | 0.45 *** | 0.44 *** | 0.81 ** | 0.20 |
| Air temperature | 0.34 | 0.11 | −0.13 | −0.39 ** | −0.61 | −0.36 |
| Evapotranspiration | −0.07 | −0.64 *** | −0.02 | −0.54 ** | −0.46 | −0.27 |
| Water balance | −0.05 | −0.49 | 0.09 | −0.59 * | −0.56 | −0.32 |
| Soil temperature | 0.13 | −0.07 | −0.07 | −0.55 ** | −0.49 | −0.30 |
| Yield | −0.19 | −0.03 | 0.42 *** | 0.20 | 0.47 | 0.58 |
| Total soluble solids | 0.04 | 0.27 | 0.03 | −0.61 * | −0.68 *** | −0.35 |
| L* | 0.53 | 0.68 *** | 0.04 | −0.07 | −0.43 | −0.31 |
| 2011–2013 | ||||||
| Air temperature | −0.51 | 0.24 | −0.84 | 0.93 * | 0.45 | 0.53 |
| Evapotranspiration | −0.62 | 0.39 | 0.06 | 0.91 * | 0.11 | 0.36 |
| Water balance | 0.88 ** | −0.80 | −0.78 * | 0.12 | −0.82 ** | −0.72 * |
| Soil temperature | −0.60 | 0.34 | 0.13 | 0.97 * | 0.50 | 0.55 |
| Yield | 0.35 | −0.75 *** | −0.56 | −0.02 | −0.57 | −0.73 ** |
| Total soluble solids | 0.10 | 0.40 | 0.32 | 0.43 | 0.04 | 0.34 |
| Firmness | 0.25 | −0.75 *** | −0.76 * | −0.06 | −0.48 | −0.88 ** |
| L* | 0.89 ** | −0.80 *** | −0.34 | 0.65 | −0.82 ** | −0.61 |
| C*ab | −0.83 ** | 0.30 | 0.50 | 0.77 * | 0.90 * | 0.49 |
| Hab | 0.74 * | −0.31 | −0.21 | 0.71 * | −0.56 | −0.30 |
| Year | Date | Bacteria CFU ×105 g−1 DW Soil) | Actinobacteria (CFU ×105 g−1 DW Soil) | Fungi (CFU ×104 g−1 DW Soil) | Azotobacter (CFU g−1 DW Soil) | Azospirillum (CFU ×103 g−1 DW Soil) |
|---|---|---|---|---|---|---|
| 2007 | Date I | 26.8 a 1 | 37.2 bc | 4.0 a | 17.4 a | 55.1 a |
| Date II | 135.2 c | 70.0 d | 9.7 b | 20.5 ab | 62.5 a | |
| 2008 | Date I | 168.5 d | 151.0 f | 9.1 b | 31.0 b–d | 407.0 b |
| Date II | 128.8 c | 95.3 e | 15.9 c | 34.7 c–e | 382.8 b | |
| 2009 | Date I | 65.5 b | 42.3 c | 7.9 b | 44.2 e | 36.2 a |
| Date II | 226.5 e | 155.1 f | 17.6 c | 38.4 de | 138.7 a | |
| 2010 | Date I | 21.3 a | 4.7 a | 2.6 a | 24.5 a–c | 37.2 a |
| Date II | 27.8 a | 20.3 ab | 3.9 a | 20.6 ab | 59.4 a | |
| OR 1 | 95.3 a | 64.6 a | 7.9 a | 25.4 a | 237.2 b | |
| OR 2 | 97.0 a | 74.6 a | 7.9 a | 34.6 b | 75.8 a | |
| OR 3 | 107.9 a | 76.8 a | 10.7 b | 26.8 a | 129.0 a |
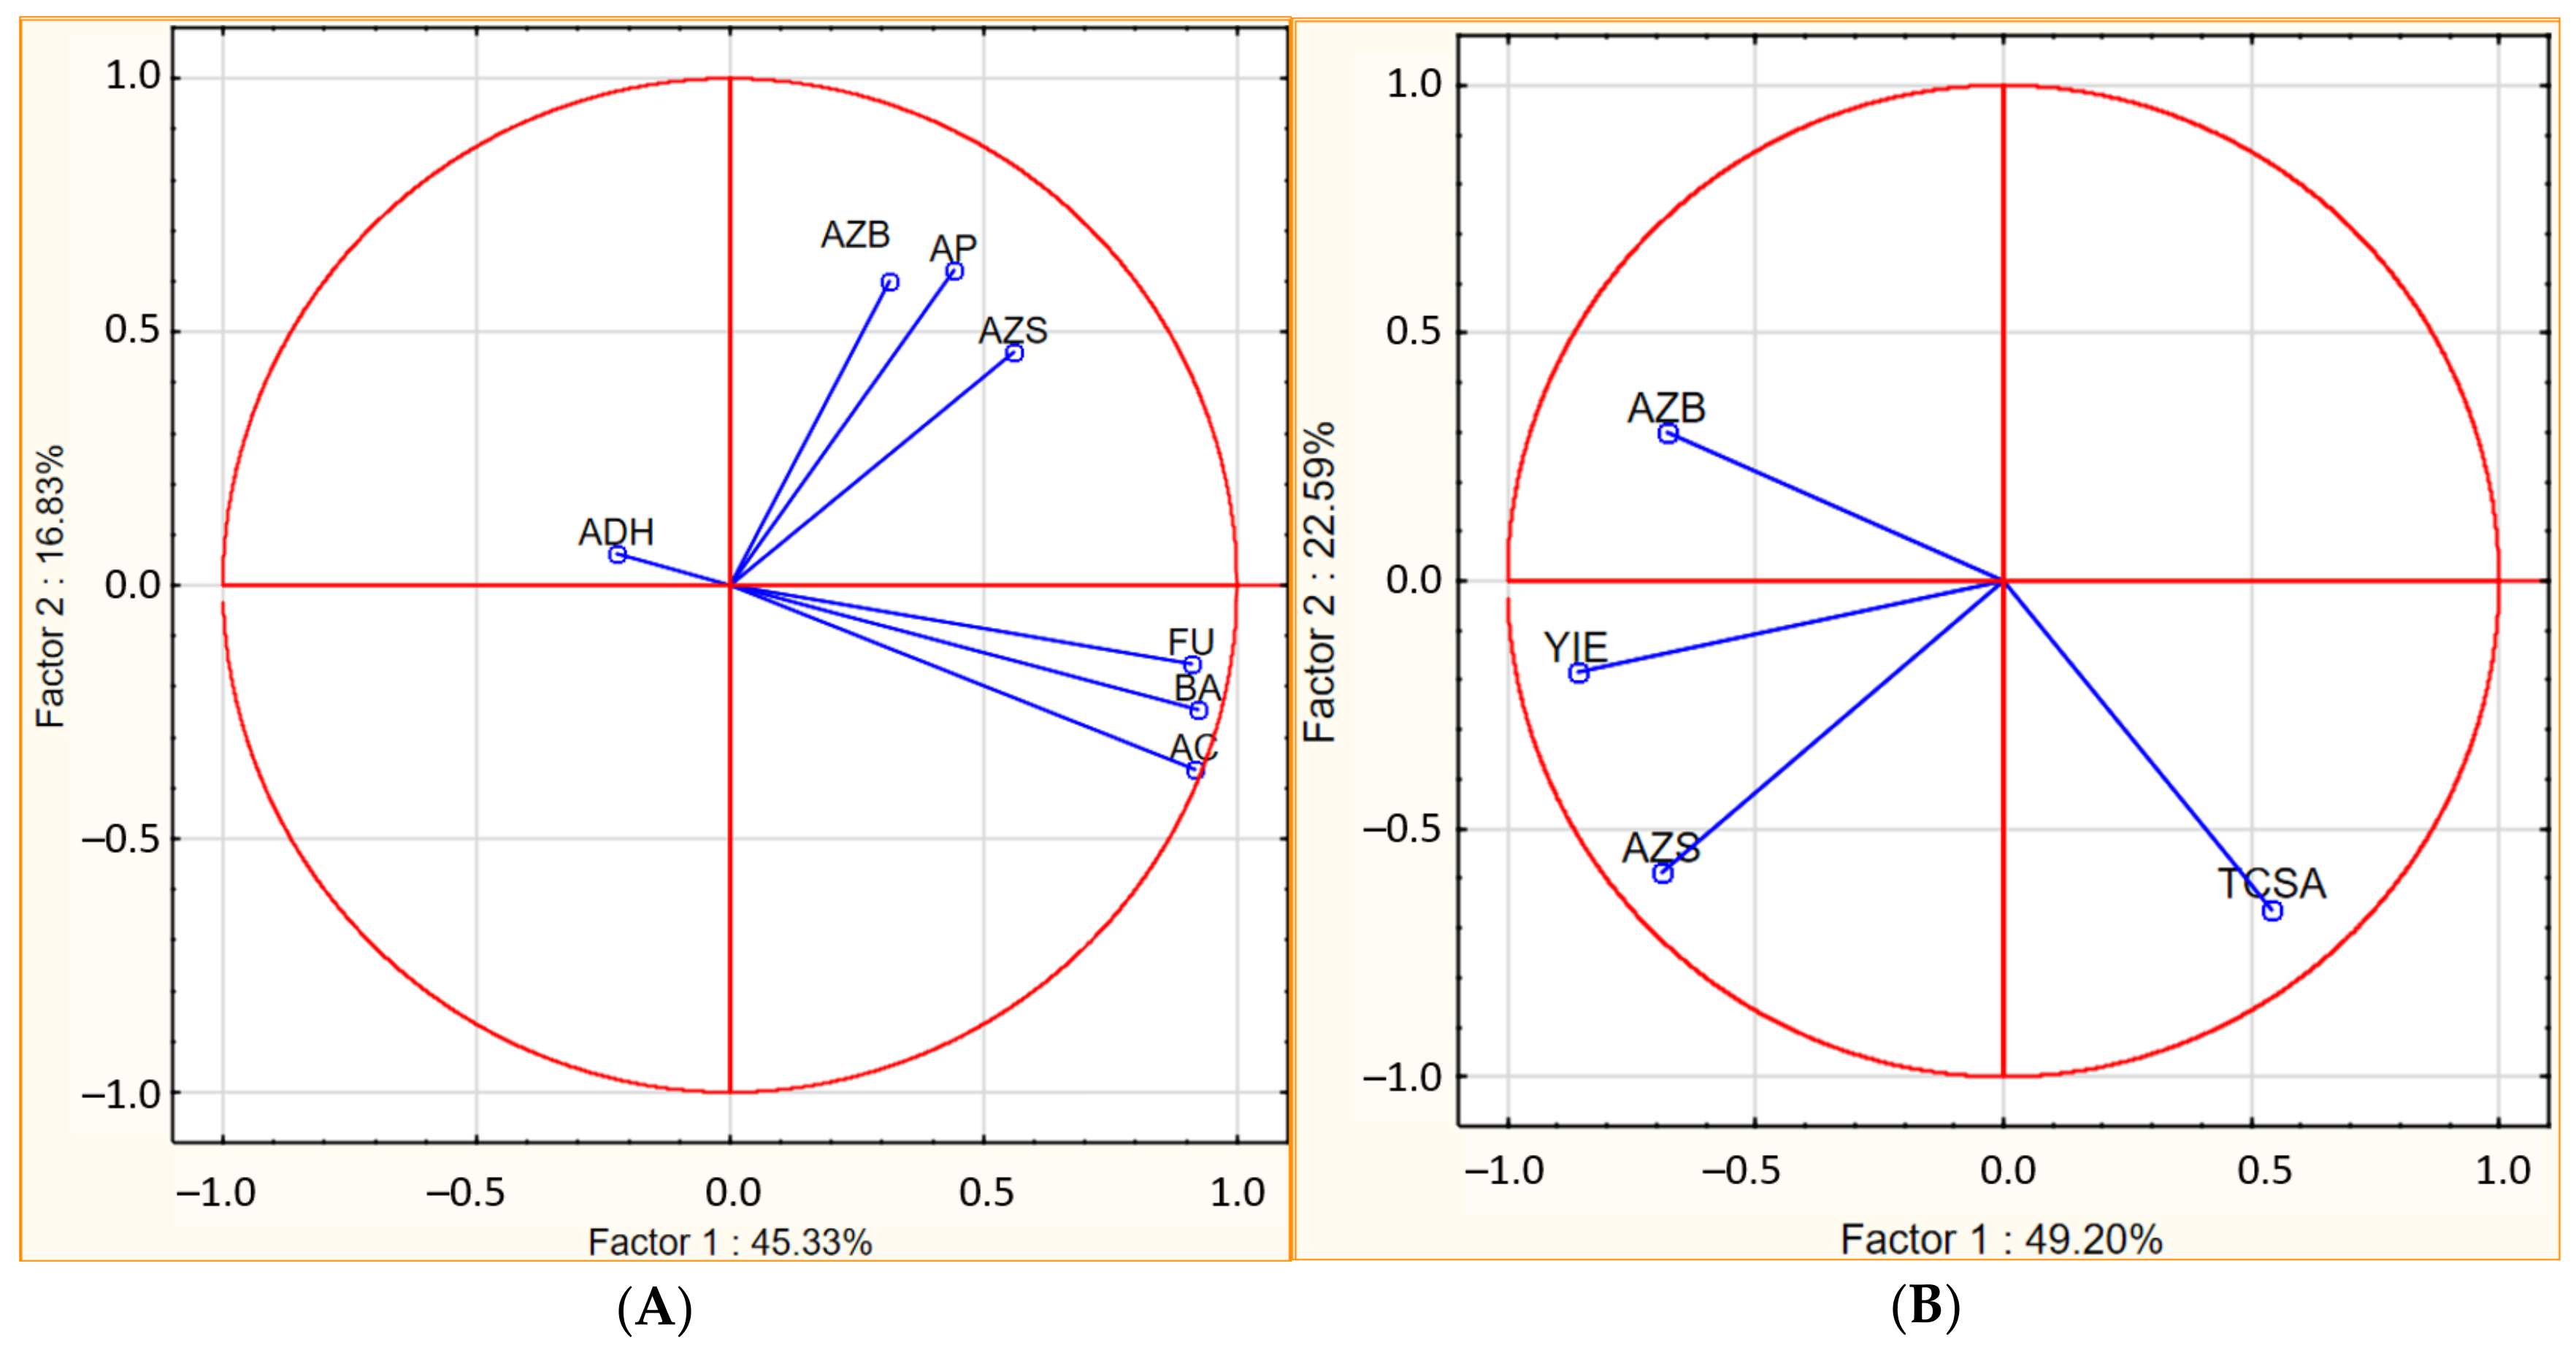
| Bacteria | Actinobacteria | Fungi | Azotobacter | Azospirillum | ||||||
|---|---|---|---|---|---|---|---|---|---|---|
| S | A | S | A | S | A | S | A | S | A | |
| Dehydrogenase activity | 0.21 | 0.51 | −0.34 | 0.42 | −0.19 | 0.54 | −0.19 | 0.43 | 0.02 | −0.15 |
| Protease activity | 0.11 | 0.23 | 0.05 | 0.13 | −0.04 | 0.31 | −0.25 | 0.82 ** | 0.72 * | 0.23 |
| Air temperature | −0.87 ** | −0.30 | −0.78 * | −0.23 | −0.81 ** | 0.04 | −0.48 | −0.07 | −0.45 | 0.57 * |
| Evapotranspiration | −0.48 | −0.11 | −0.42 | −0.05 | −0.45 | 0.27 | 0.27 | 0.12 | −0.59 | 0.64 * |
| Water balance | −0.51 | −0.25 | −0.45 | −0.18 | −0.48 | 0.12 | 0.29 | 0.02 | −0.61 | 0.59 |
| Soil temperature | −0.83 ** | −0.14 | −0.70 * | −0.08 | −0.79 * | 0.39 | −0.55 | 0.05 | −0.71 * | 0.67 * |
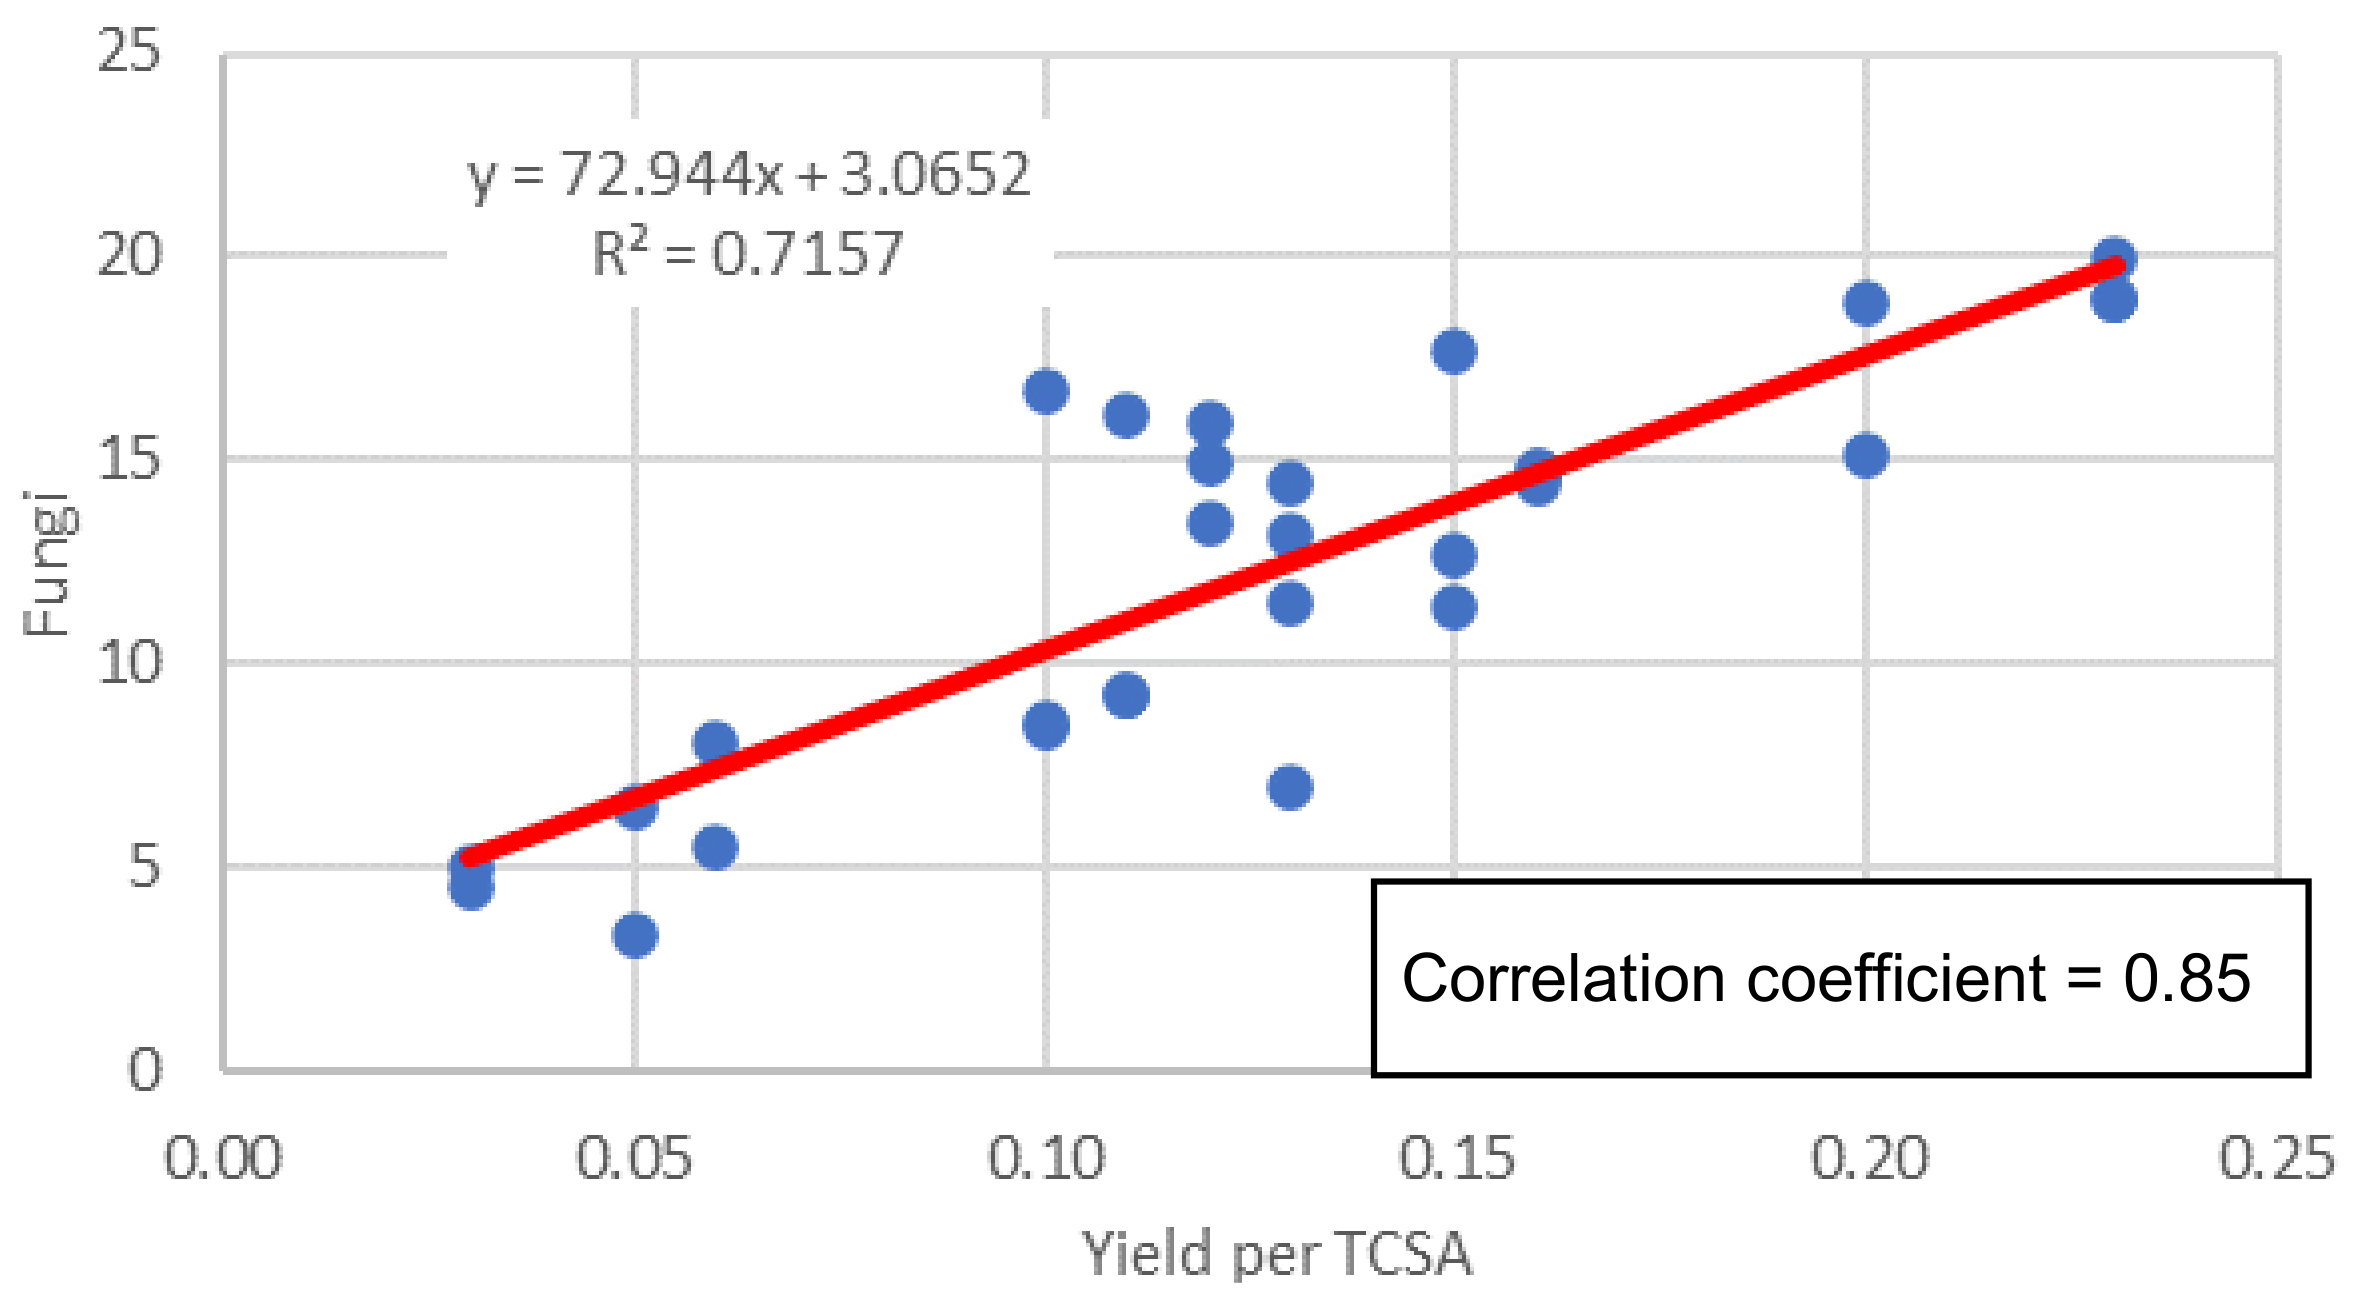
| Yield | 0.61 * | 0.48 | 0.52 * | 0.34 | 0.50 * | 0.70 * | 0.13 | 0.91 *** | 0.48 * | 0.59 * |
| Firmness | 0.65 * | −0.32 | 0.55 | −0.29 | 0.67 * | 0.07 | −0.33 | 0.04 | 0.44 | 0.33 |
| Mass fruit | −0.78 * | −0.29 | −0.82 * | −0.28 | −0.82 ** | −0.41 | −0.31 | −0.41 | −0.56 | −0.54 |
| Total soluble solids | 0.67 * | −0.26 | 0.68 * | −0.15 | 0.70 ** | 0.08 | −0.12 | −0.04 | 0.61 * | 0.47 |
| Titratable acidity | −0.09 | 0.63 | −0.05 | 0.50 | −0.08 | 0.36 | 0.51 * | 0.46 | −0.36 | −0.24 |
| Tree cross sectional area | −0.62 * | −0.22 | −0.73 * | −0.25 | −0.69 * | −0.47 | −0.16 | −0.39 | −0.17 | −0.12 |
| L* | −0.62 * | −0.73 * | −0.62 * | −0.69 * | −0.62 | −0.88 ** | −0.34 | −0.58 * | 0.06 | −0.02 |
| a* | 0.87 ** | −0.01 | 0.87 ** | 0.05 | 0.85 ** | 0.43 | −0.12 | 0.30 | 0.84 ** | 0.80 ** |
| b* | −0.14 | −0.52 | −0.04 | −0.46 | −0.15 | −0.21 | −0.69 * | −0.15 | 0.31 | 0.32 |
| C*ab | 0.87 ** | −0.02 | 0.87 ** | 0.05 | 0.84 *** | 0.43 | −0.13 | 0.29 | 0.84 ** | 0.81 ** |
| Hab | −0.57 * | 0.42 | −0.61 * | 0.39 | −0.63 * | 0.01 | −0.36 | −0.22 | −0.56 | −0.46 |
Publisher’s Note: MDPI stays neutral with regard to jurisdictional claims in published maps and institutional affiliations. |
© 2022 by the authors. Licensee MDPI, Basel, Switzerland. This article is an open access article distributed under the terms and conditions of the Creative Commons Attribution (CC BY) license (https://creativecommons.org/licenses/by/4.0/).
Share and Cite
Rutkowski, K.; Łysiak, G.P.; Zydlik, Z. Effect of Nitrogen Fertilization in the Sour Cherry Orchard on Soil Enzymatic Activities, Microbial Population, and Fruit Quality. Agriculture 2022, 12, 2069. https://doi.org/10.3390/agriculture12122069
Rutkowski K, Łysiak GP, Zydlik Z. Effect of Nitrogen Fertilization in the Sour Cherry Orchard on Soil Enzymatic Activities, Microbial Population, and Fruit Quality. Agriculture. 2022; 12(12):2069. https://doi.org/10.3390/agriculture12122069
Chicago/Turabian StyleRutkowski, Krzysztof, Grzegorz P. Łysiak, and Zofia Zydlik. 2022. "Effect of Nitrogen Fertilization in the Sour Cherry Orchard on Soil Enzymatic Activities, Microbial Population, and Fruit Quality" Agriculture 12, no. 12: 2069. https://doi.org/10.3390/agriculture12122069