Article

In Transition towards Organic Farming: Effects of Rock Phosphate, Coral Lime, and Green Manure on Soil Fertility of an Acid Oxisol and the Growth of Soybean (Glycine max L. Merr.) Seedlings

1
Agricultural Diagnostic Services Center, Honolulu, HI 96822, USA
2
Department of Tropical Plant & Soil Sciences, College of Tropical Agriculture and Human Resources, University of Hawaii at Manoa, Honolulu, HI 96822, USA
*
Author to whom correspondence should be addressed.
Agriculture 2022, 12(12), 2045; https://doi.org/10.3390/agriculture12122045
Submission received: 8 October 2022 / Revised: 25 November 2022 / Accepted: 28 November 2022 / Published: 29 November 2022
(This article belongs to the Topic Innovation and Solution for Sustainable Agriculture)

Abstract

:
Maintaining soil fertility and obtaining good crop yields in highly weathered tropical soils through organic practices–without chemical/synthetic inputs—requires a scientific approach and skillful managements, especially for phosphorus (P) nutrient. Our objective was to find a combination of lime and rock phosphate additions that made soil pH low enough so that rock phosphate would be adequately soluble, yet high enough so soil acidity is not harmful to most crops. Thus, a controlled (greenhouse) experiment was conducted to quantify soil properties, and soybean (Glycine max cv. Kahala) growth when rock phosphate, coral lime, and cowpea (Vigna unguiculata) green manure were applied as organic amendments to an acid, nutrient poor Oxisol of Hawaii. The treatments were a factorial combination of 3 application rates (0, 1, 2 g/kg) of coral lime (86% CaCO3 equivalent) from Western Samoa, 3 rates (0, 75, 150 mg/kg total P) of rock phosphate (10.6% total P, and 3.7% citrate extractable P) from central Florida, and 3 rates (0, 5, 10 g/kg) of a local cowpea green manure (2.7% N, 2.8% K). Each treatment was replicated 3 times, yielding a total of 81 pots of 2 kg soil each. Soybean seedlings were grown as a test crop. Our results showed that a combination of 1 g/kg (2 tons/ha) of lime and 75 mg/kg (150 kg P/ha) of rock phosphate provided enough P for soybean growth and simultaneously alleviated soil acidity problems (the green manure was to supply adequate N and K to the crop). Corresponding soil parameters were: soil pH = 5.2, exchangeable (KCl-extractable) Al = 3.6 mg/kg, Olsen (NaHCO3- extractable) P = 11 mg/kg, and soil-solution P of 0.05 mg/L. Our results lent support to the sustainable potential of organic farming.

1. Introduction

Organic farming, with an emphasis on a holistic approach to agriculture, avoids the use of synthetic fertilizers and pesticides [1]. More specifically, the United State Department of Agriculture (USDA) also made the following recommendations: “The producer may manage crop nutrients and soil fertility by applying (1) A mined substance of low solubility; (2) Ash obtained from the burning of a plant or animal material, except burning as a means of disposal for crop residues produced on the operation; (3) Sewage sludge (biosolids) must not be used.” [1]. With no chemical inputs, organic farming must be skillfully managed. In fact, soil nutrient management poses a serious challenge to organic practices, especially if the farmed soil is acidic and phosphorus (P) deficient as is often the case of Oxisols [2,3].
Along with nitrogen (N) and potassium (K), P is a major (needed in large amounts) and essential nutrient to all crops [4]. More specifically, P is a component of genetic molecules (DNA, RNA) as well as adenosine triphosphate (ATP), which transfers energy during photosynthesis and respiration [2,3,5]. Phosphorus-deficient plants grow slowly, appear dark green or blue-green as a result of stunted growth with concentrated green pigment in leaves. In advanced stage of P deficiency, leaves often turn purple [2,6,7].
Although well-matured compost, green and animal manures are allowed in organic farming, their uses are often intended for supplying N rather than P for crops. That is because P concentrations in these materials are relatively low. For example, total P ranges: 0.04–2.3% in compost [8], 0.2–0.4% in green manure [9], and 0.4–2.1% in animal manure [9]. With relatively high total P concentration (10–18% [3]), rock phosphate could provide significant P to crops if its P releasing potential can be properly managed.
Chemical formula of rock phosphate is Ca10(OH)2(PO4)6 with some minor substitutions of OH by fluoride (F) or carbonate (CO32−). In the US, rock phosphate is often mined from sedimentary rocks in Florida and North Carolina [3,10]. Unlike chemical P fertilizers, such as ammonium phosphate (NH4H2PO4) or triple superphosphate (Ca(H2PO4)2·H2O), rock phosphate is sparingly soluble in water [3,11]. Thus its availability to crops is very low, unless the conditions are strongly acidic (pH < 5.0) as predicted by the following reaction.
Ca10(OH)2(PO4)6 + 14 H+ → 10 Ca2+ + 6 H2PO4 + 2H2O
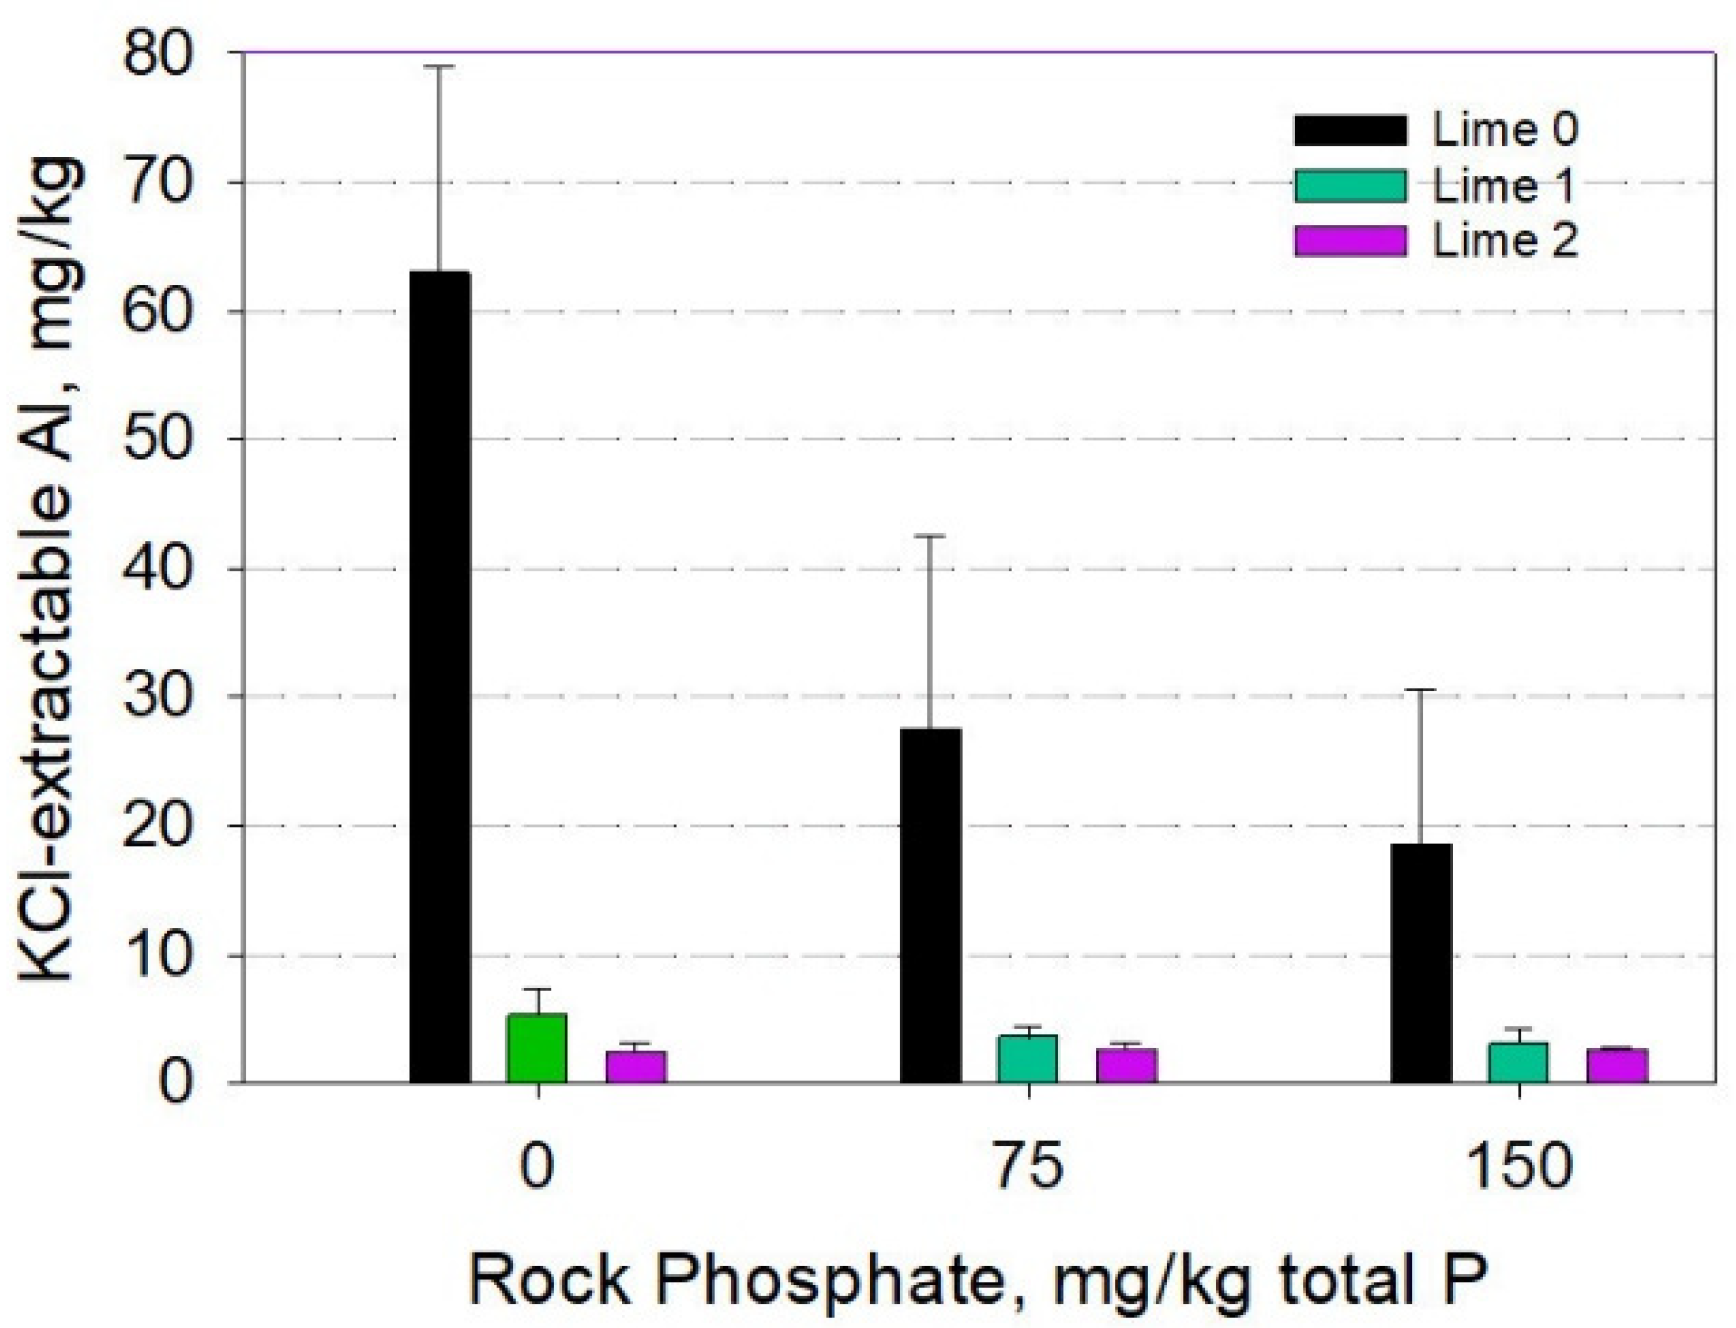
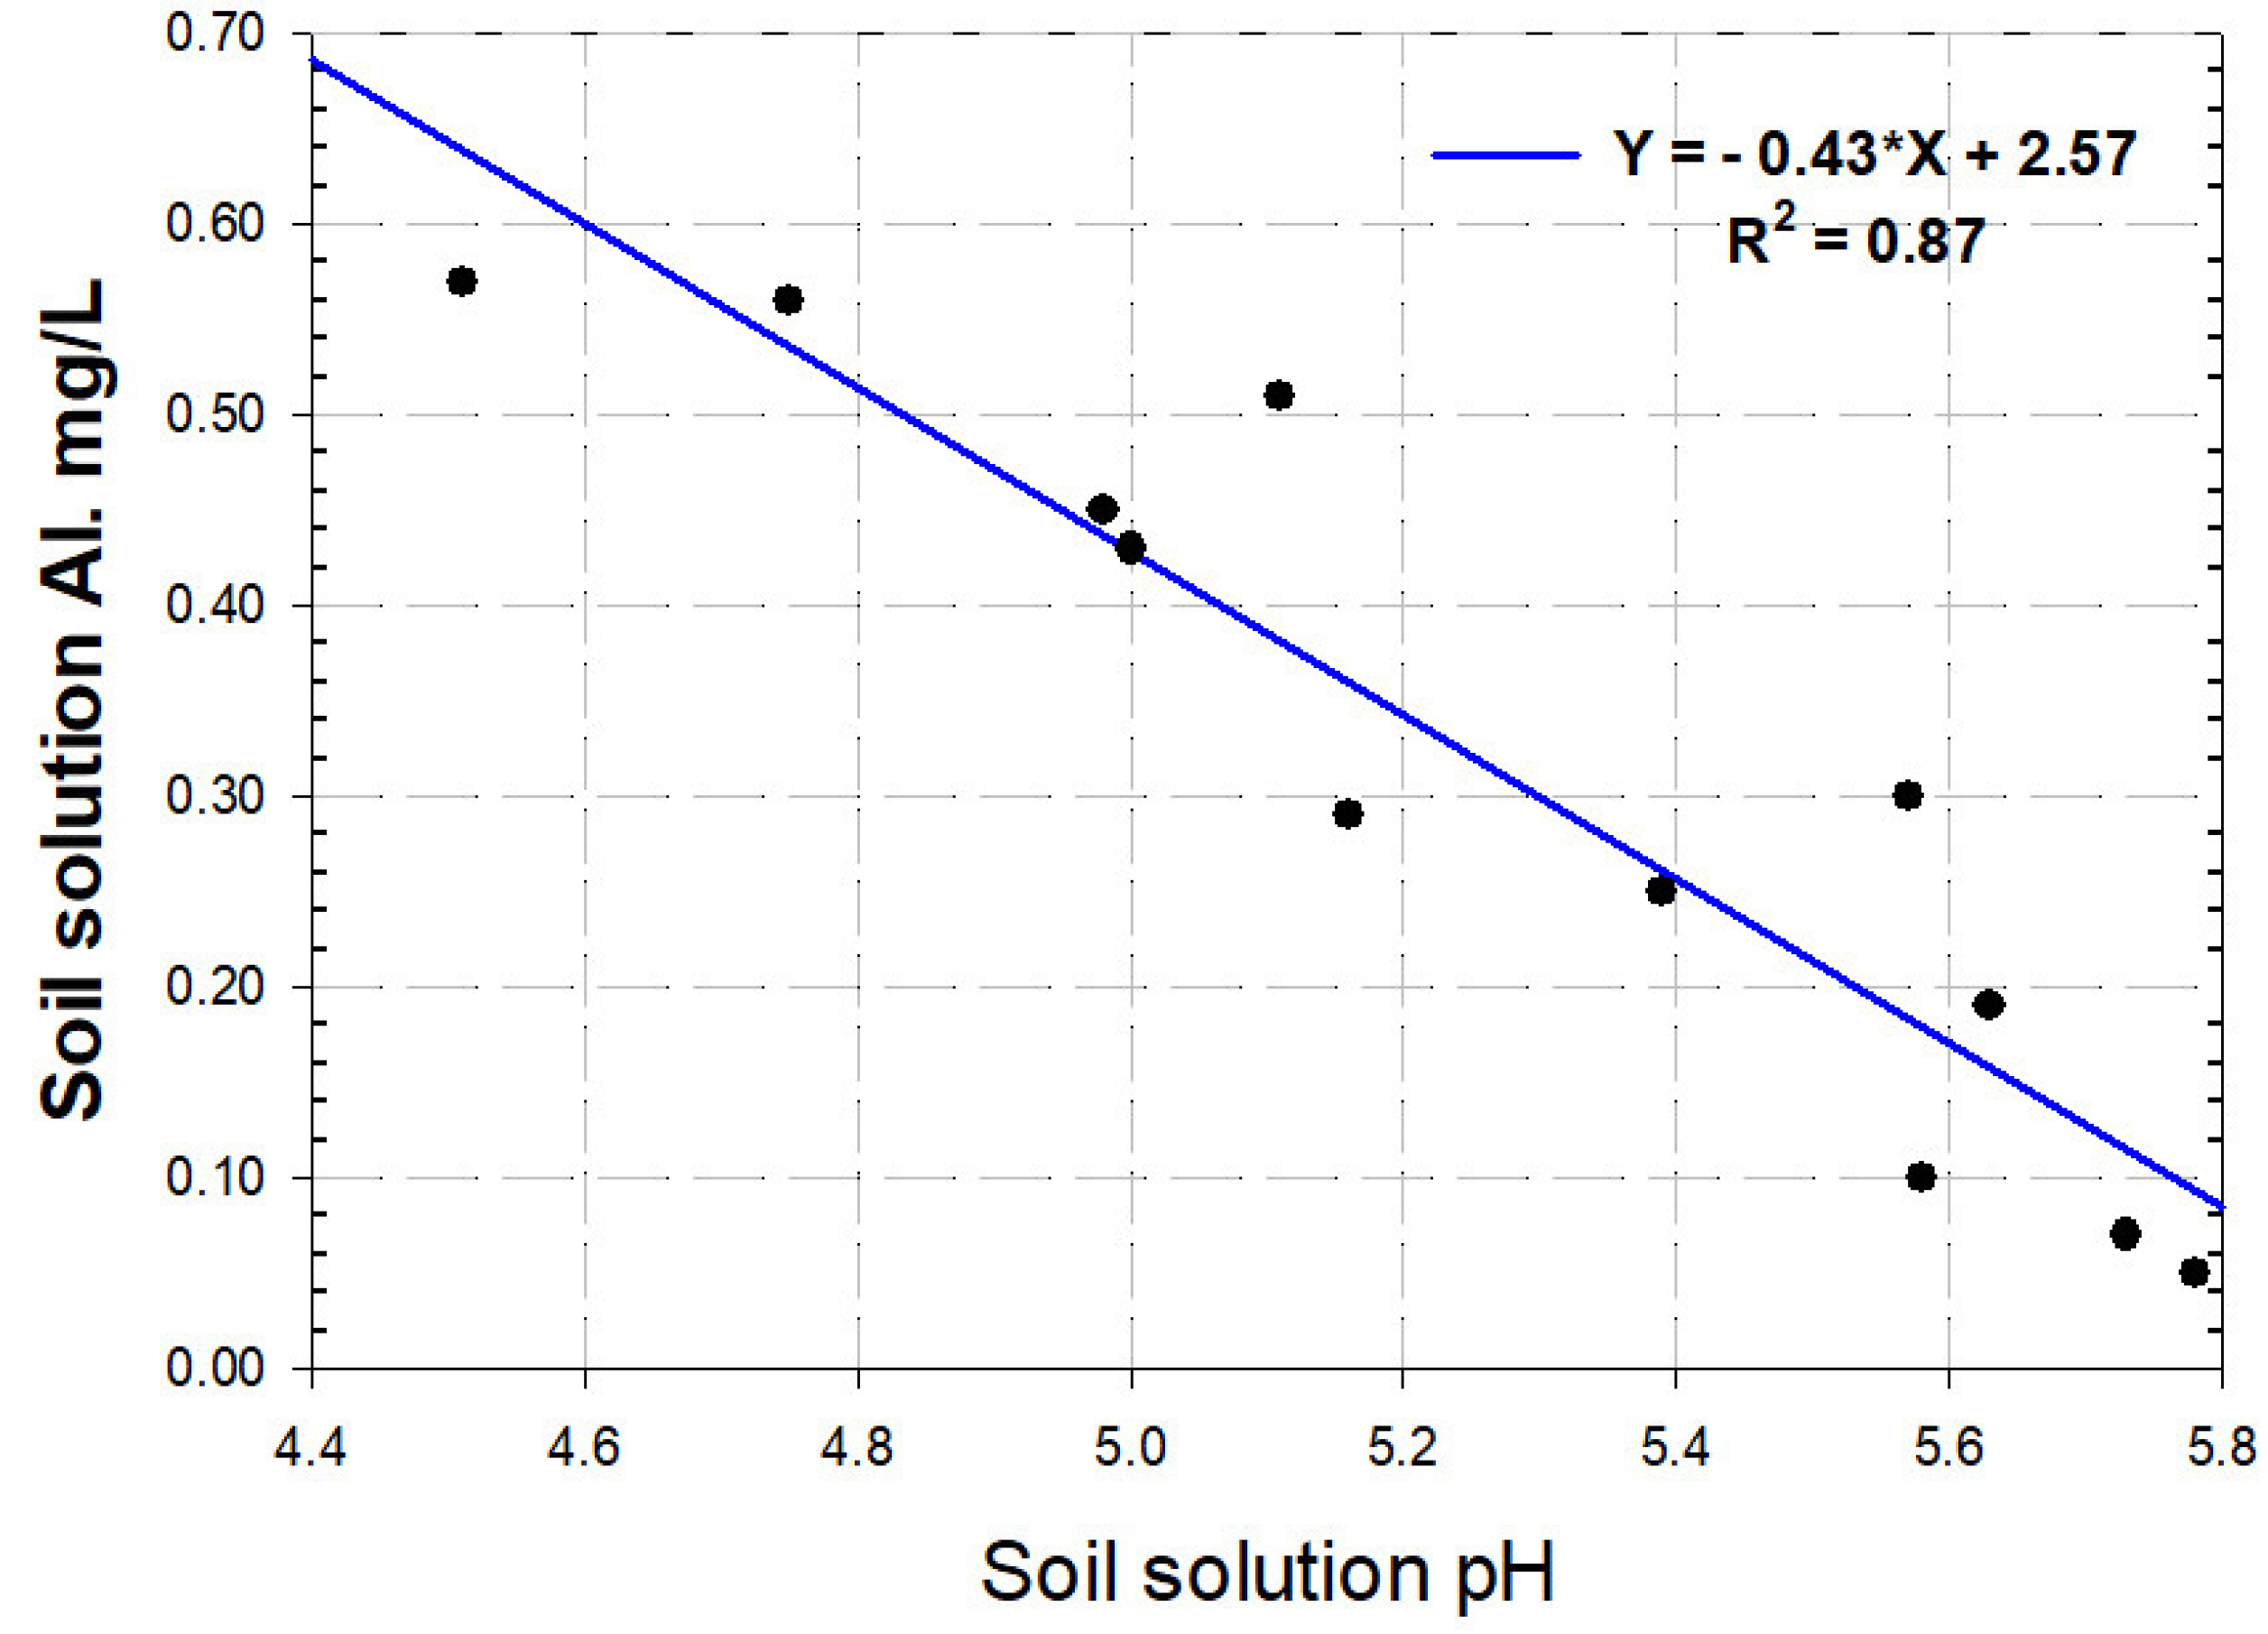
However, in acid soils the concentrations of aluminum (Al) and/or manganese (Mn) are so high that any P that is dissolved from the rock is precipitated (as shown below) before it can move far enough in the soil for plant roots to absorb it. Adsorption of P on solid Al and iron (Fe) oxides, which are abundant in Oxisols further reduces P availability.
Al3+ + H2PO4 + 2H2O → Al(OH)2H2PO4 (solid) + 2H+
Moreover, Al3+ and H+ in acid soils can damage the root systems such that no uptake of water and nutrients, including P, would be feasible [12]. For this reason, mined lime stone (CaCO3), crushed coral lime, wood ash, or biochar is often applied to alleviate soil acidity, and improve crop growth [12].
Both P nutrient and soil acidity also markedly affect the growth of young legumes, especially their nodulation and N2 fixing capability [13]. For example, soybean plants need between 12 and 15 mg/kg P in soil as extracted by the Olsen method for adequate yield [14], and most legumes perform best at neutral pH [3].
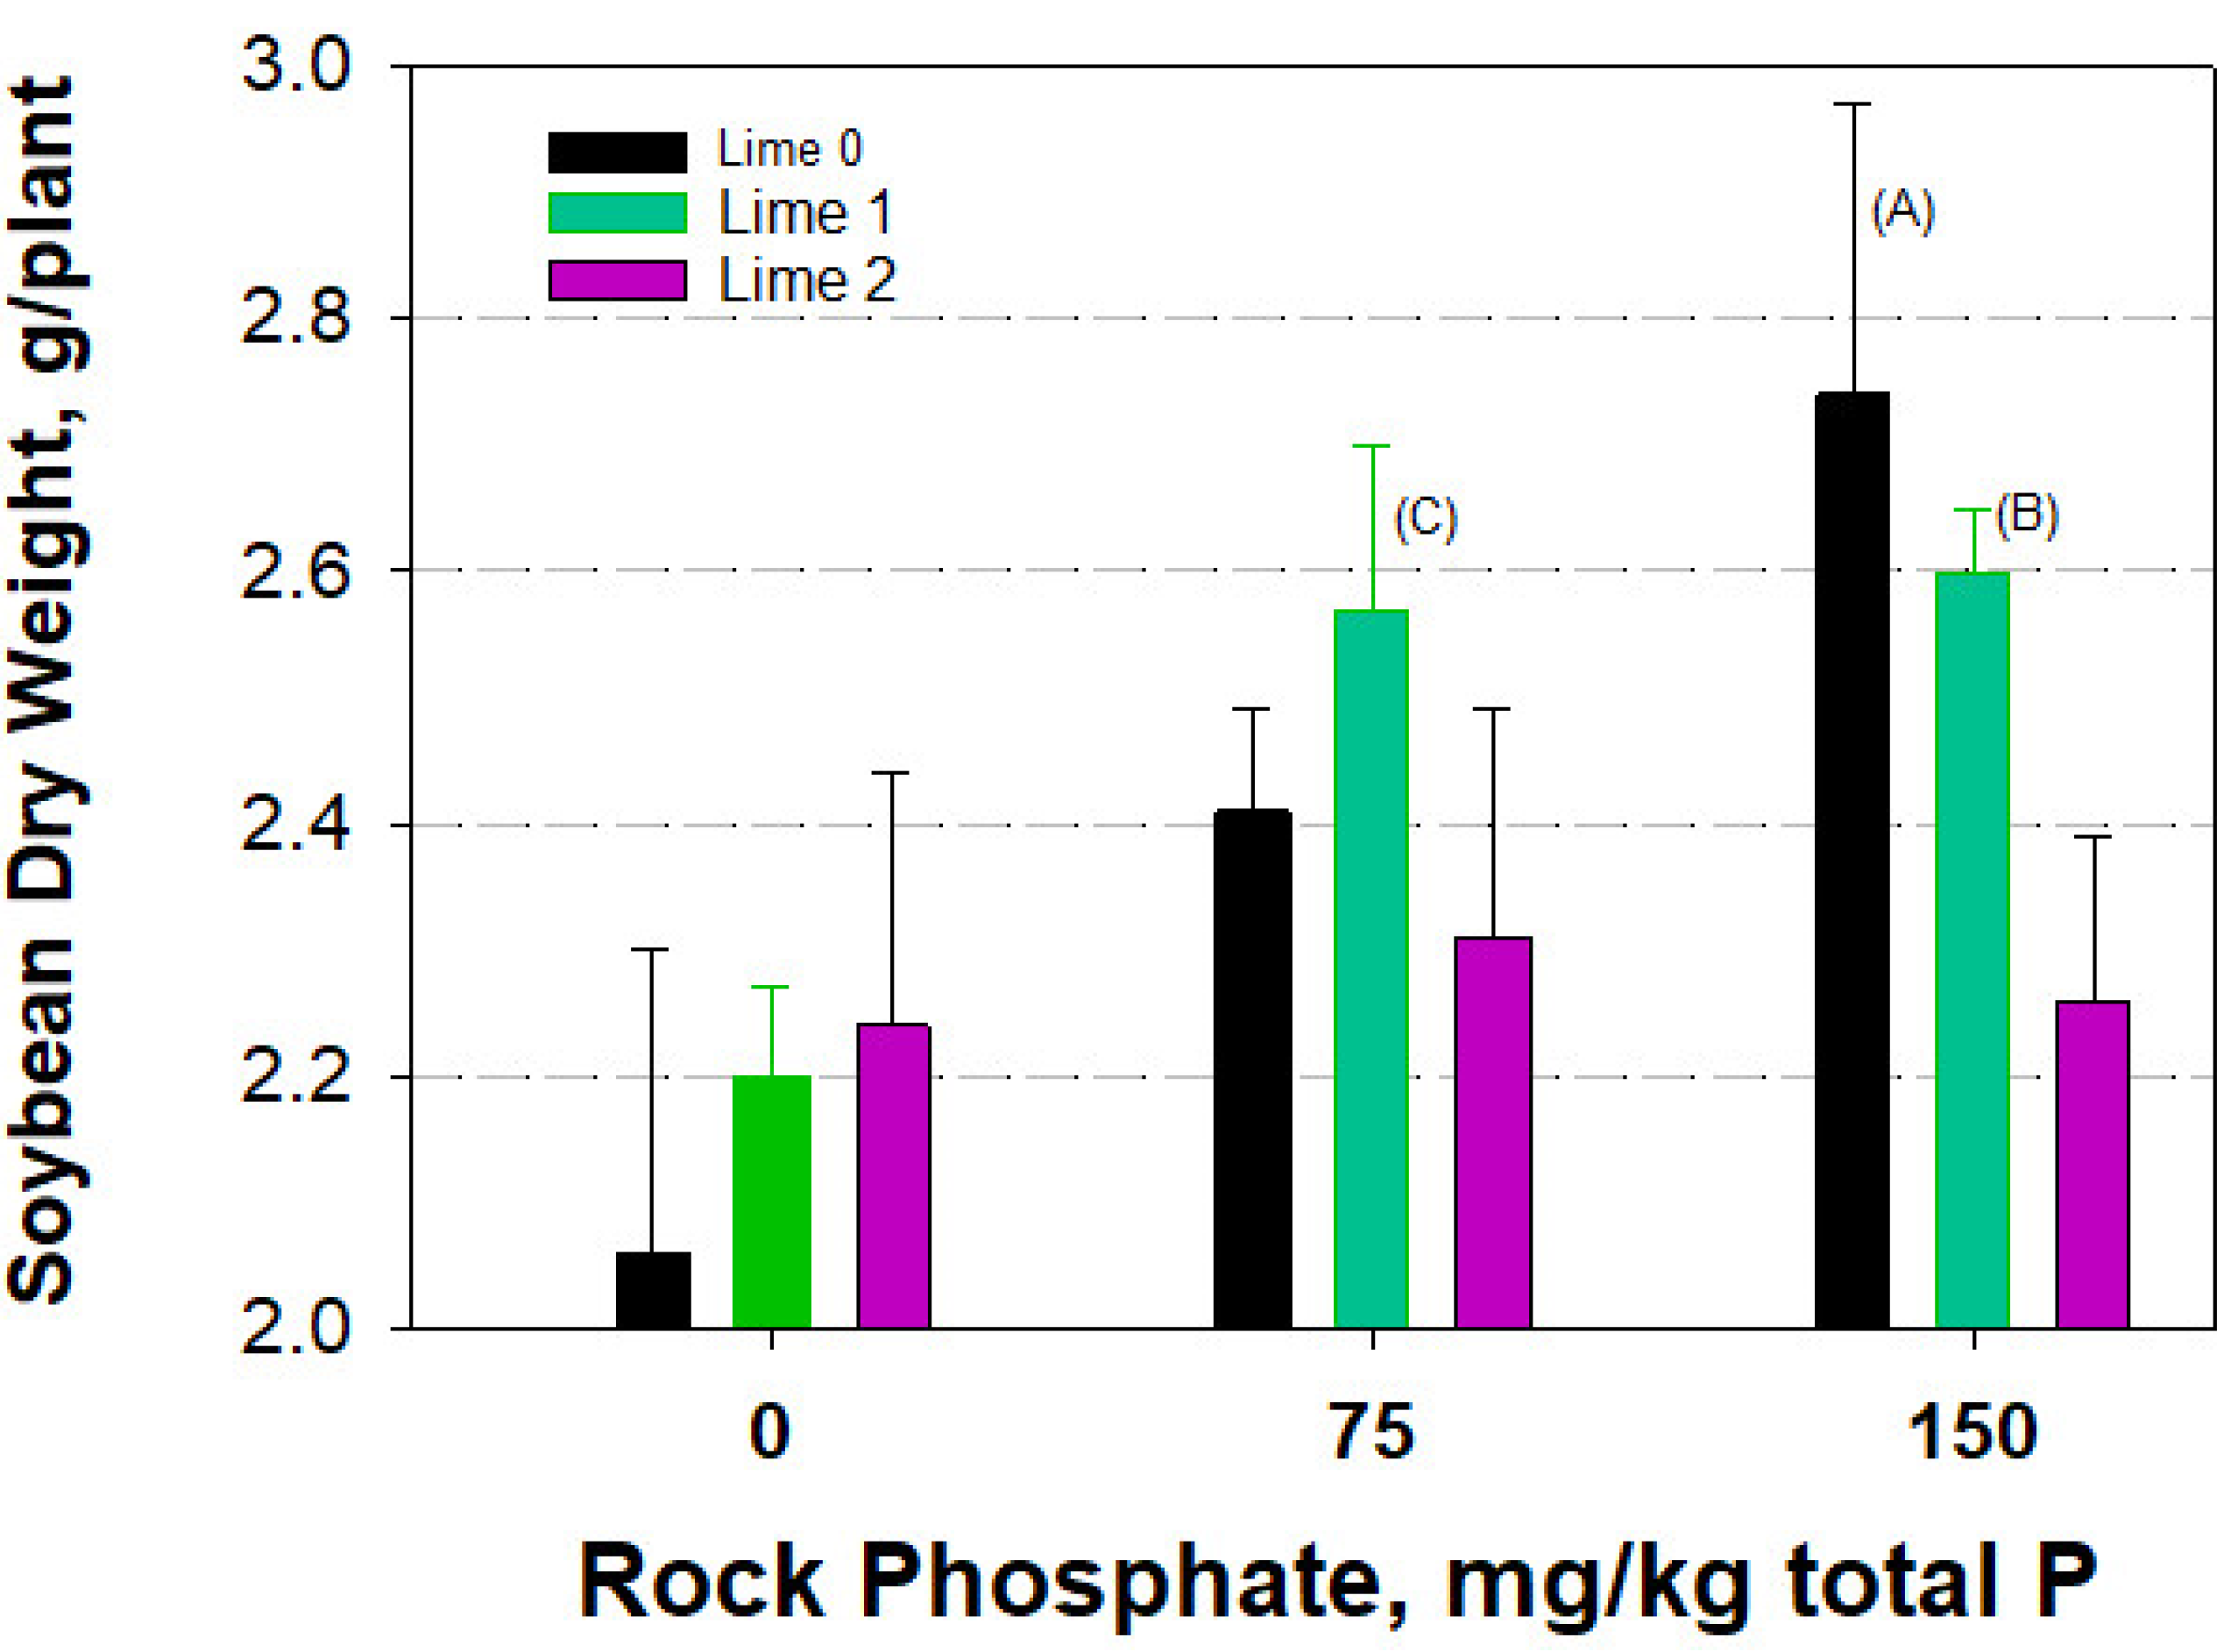
Given such an apparent conundrum, our objective was to identify an optimal condition in which the soil pH is low enough so that rock phosphate would be adequately soluble, yet is high enough so that soil Al (and perhaps Mn or H) does not adversely affect soybean seedlings, which served as a test crop.

2. Materials and Methods

2.1. The Soil and Organic Amendments

A strongly acidic, Al toxic Oxisol (Humic Rhodic Kandiudox, Paaloa Series) from a former sugarcane plantation in Oahu, Hawaii, was used in this experiment. In the non-amended state, soil pH (1:1 in water) was 4.5, KCl-extractable Al = 0.85 cmolc/kg, NaHCO3-extractable (Olsen) P = 5.8 mg/kg, and total organic carbon = 3.02%. The soil had a silty clay texture with 14% sand, 42% silt, and 44% clay. The organic inputs consisted of rock phosphate from central Florida, coral lime from Western Samoa, and ground cowpea leaf to provide N and K and other micronutrients. Their nutrient composition is listed in Table 1. The organic amendments were mixed thoroughly with the finely ground (<5 mm diameter) soil, which was stored in plastic pots containing 2 kg of air-dried soil each.

2.2. The Experimental Design and Chemical Analysis of Plant Tissue

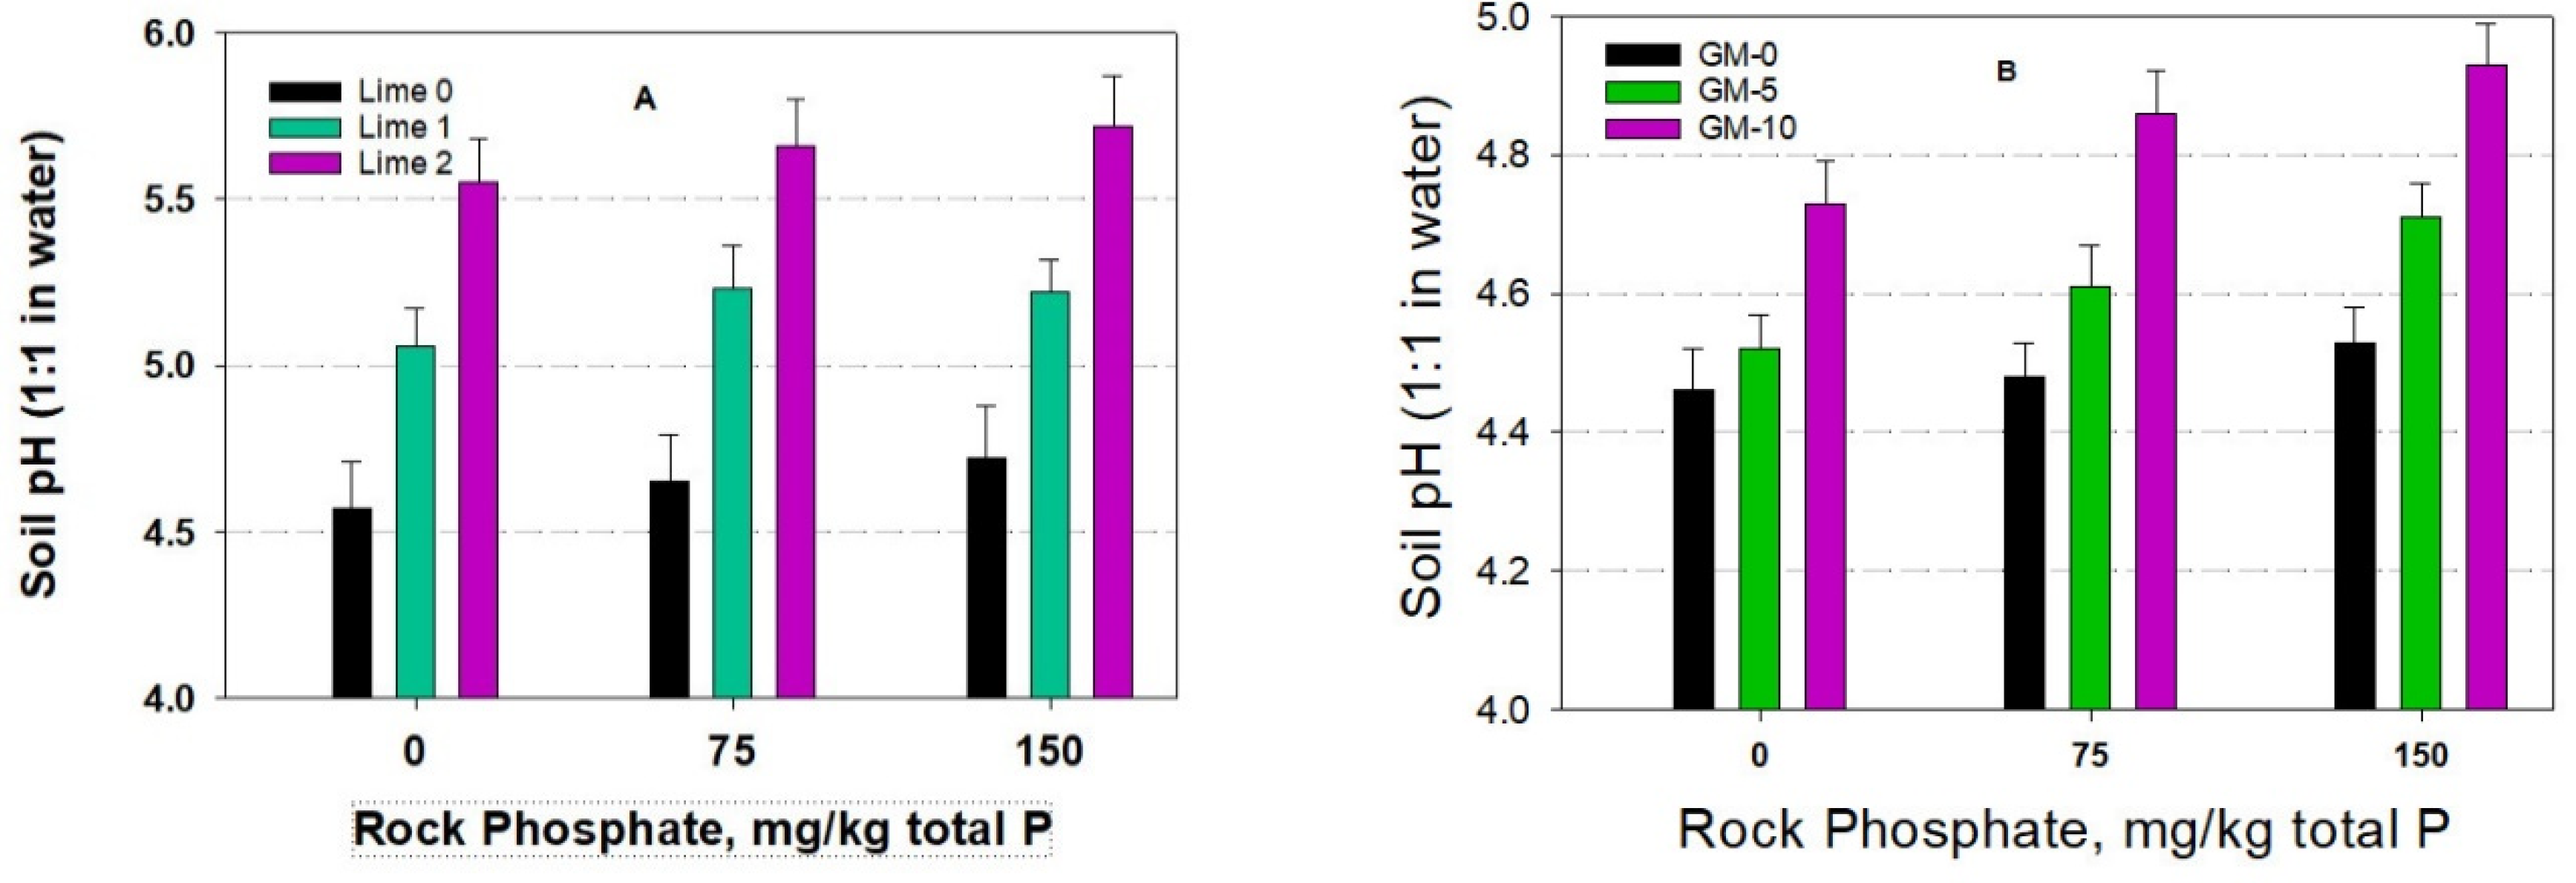
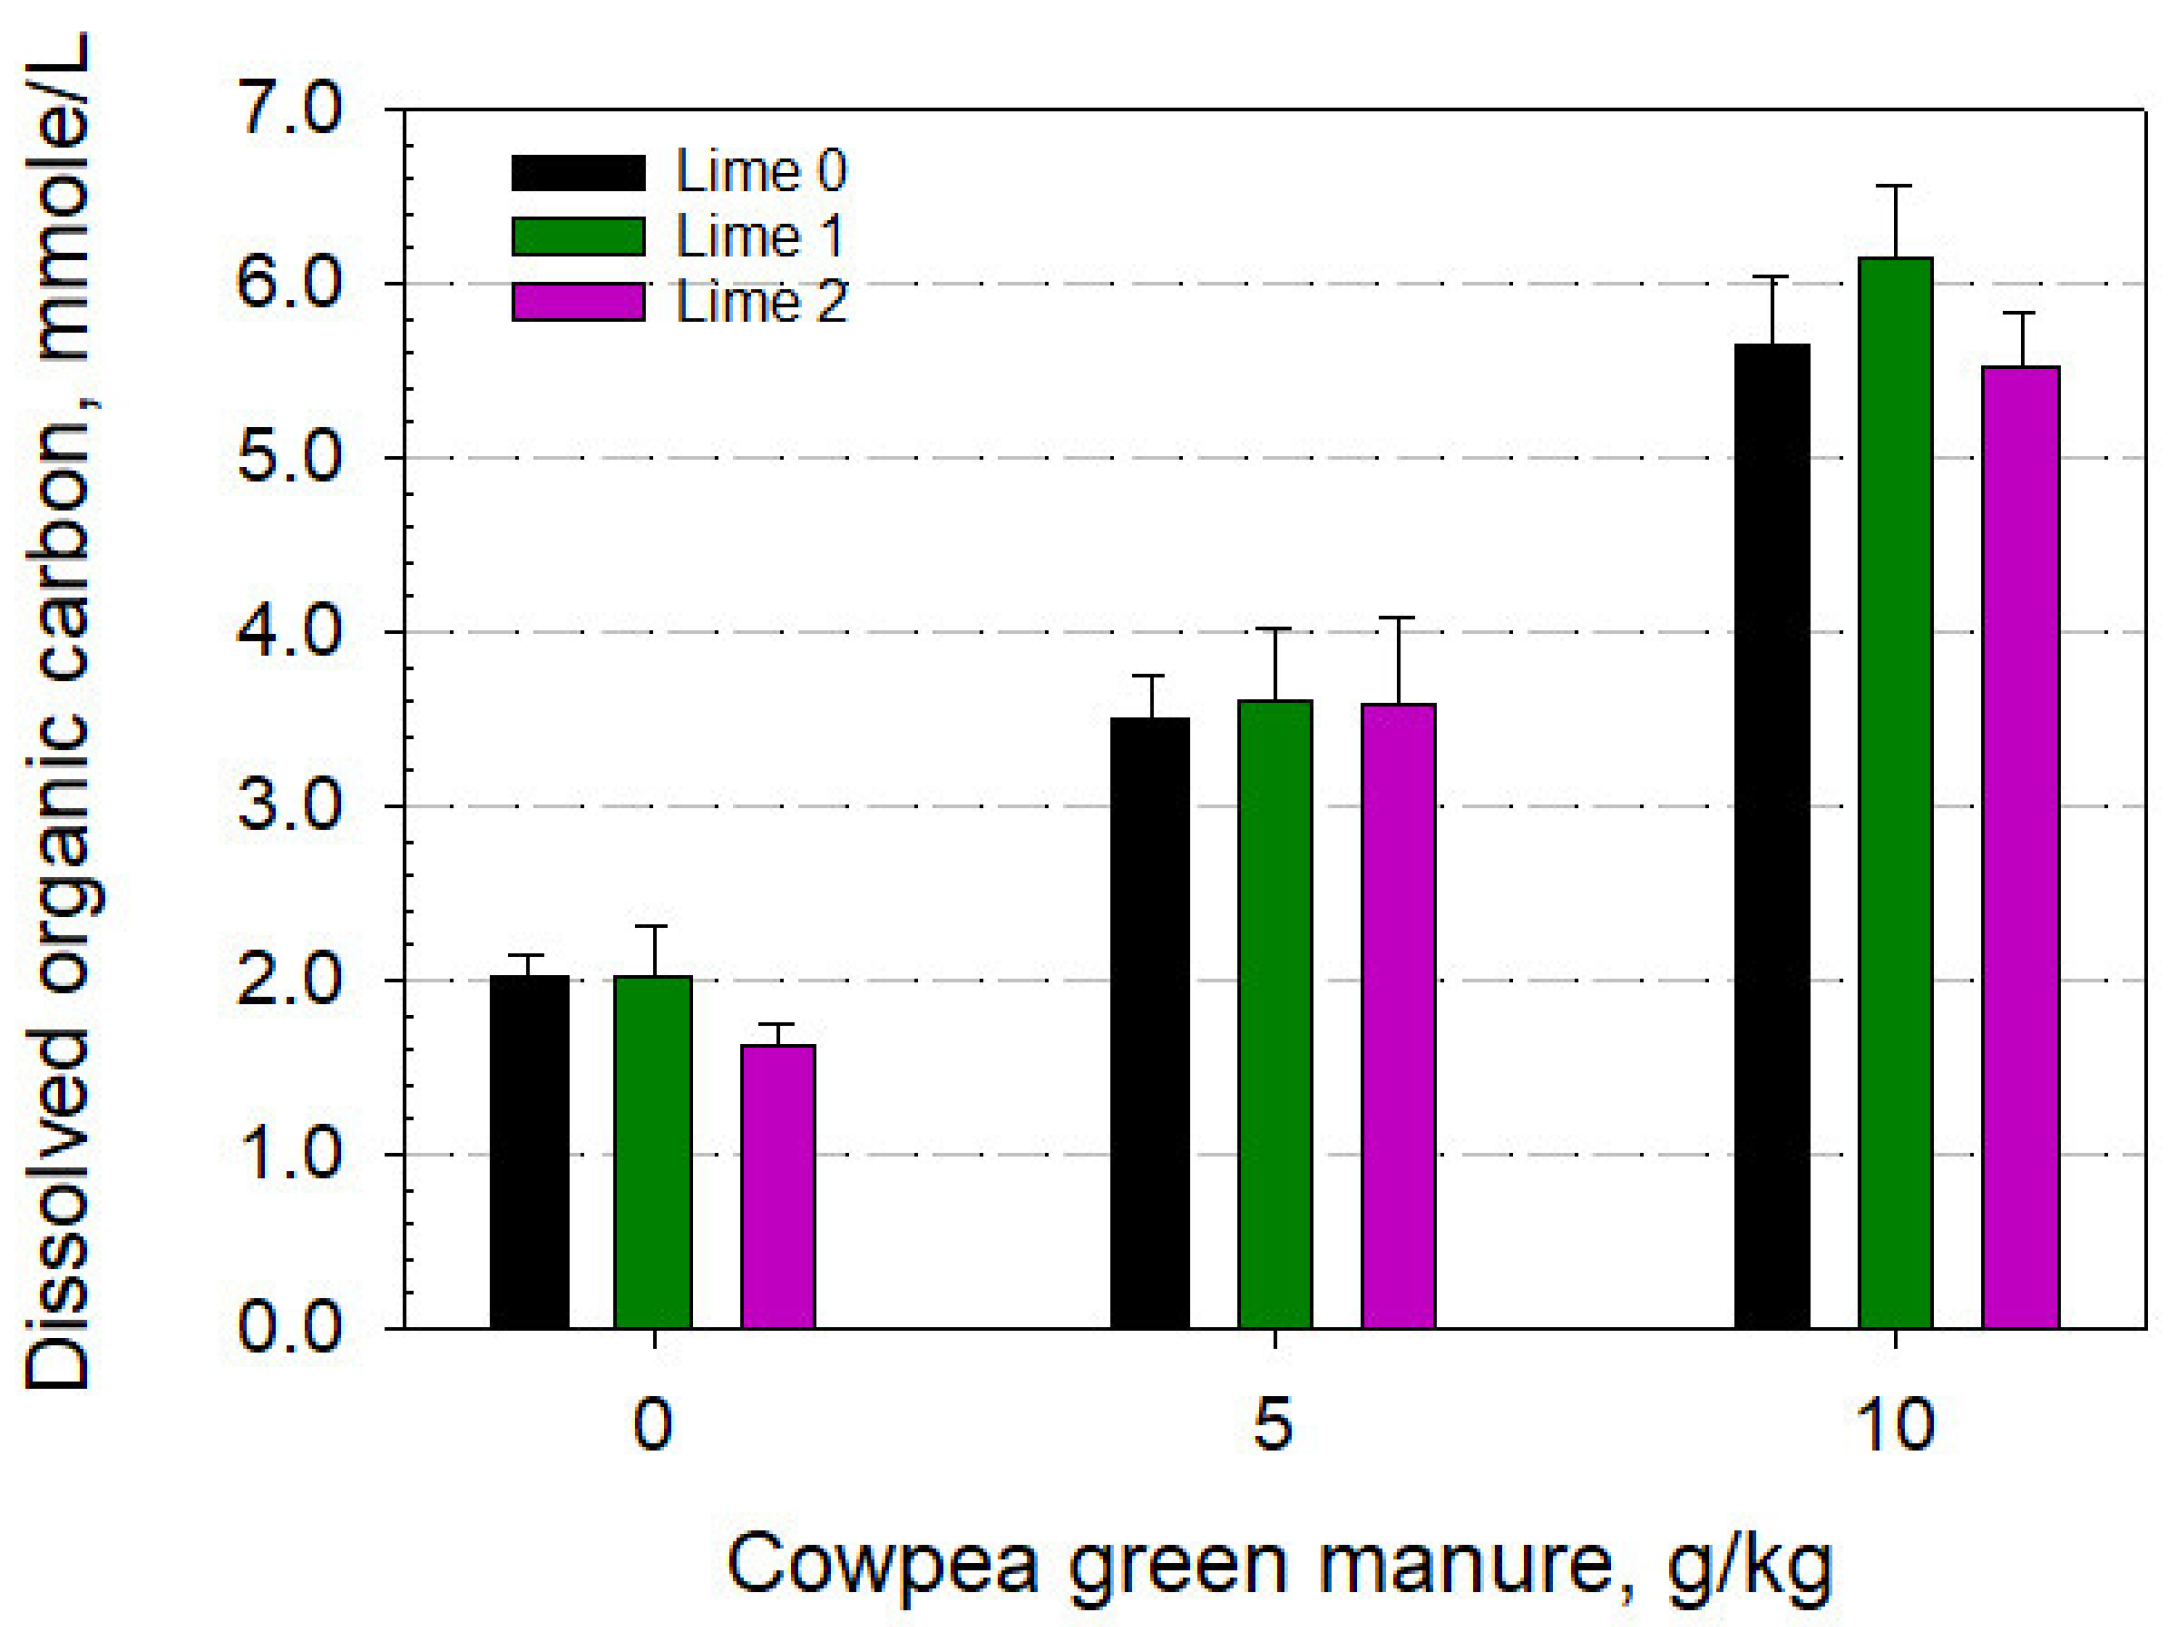
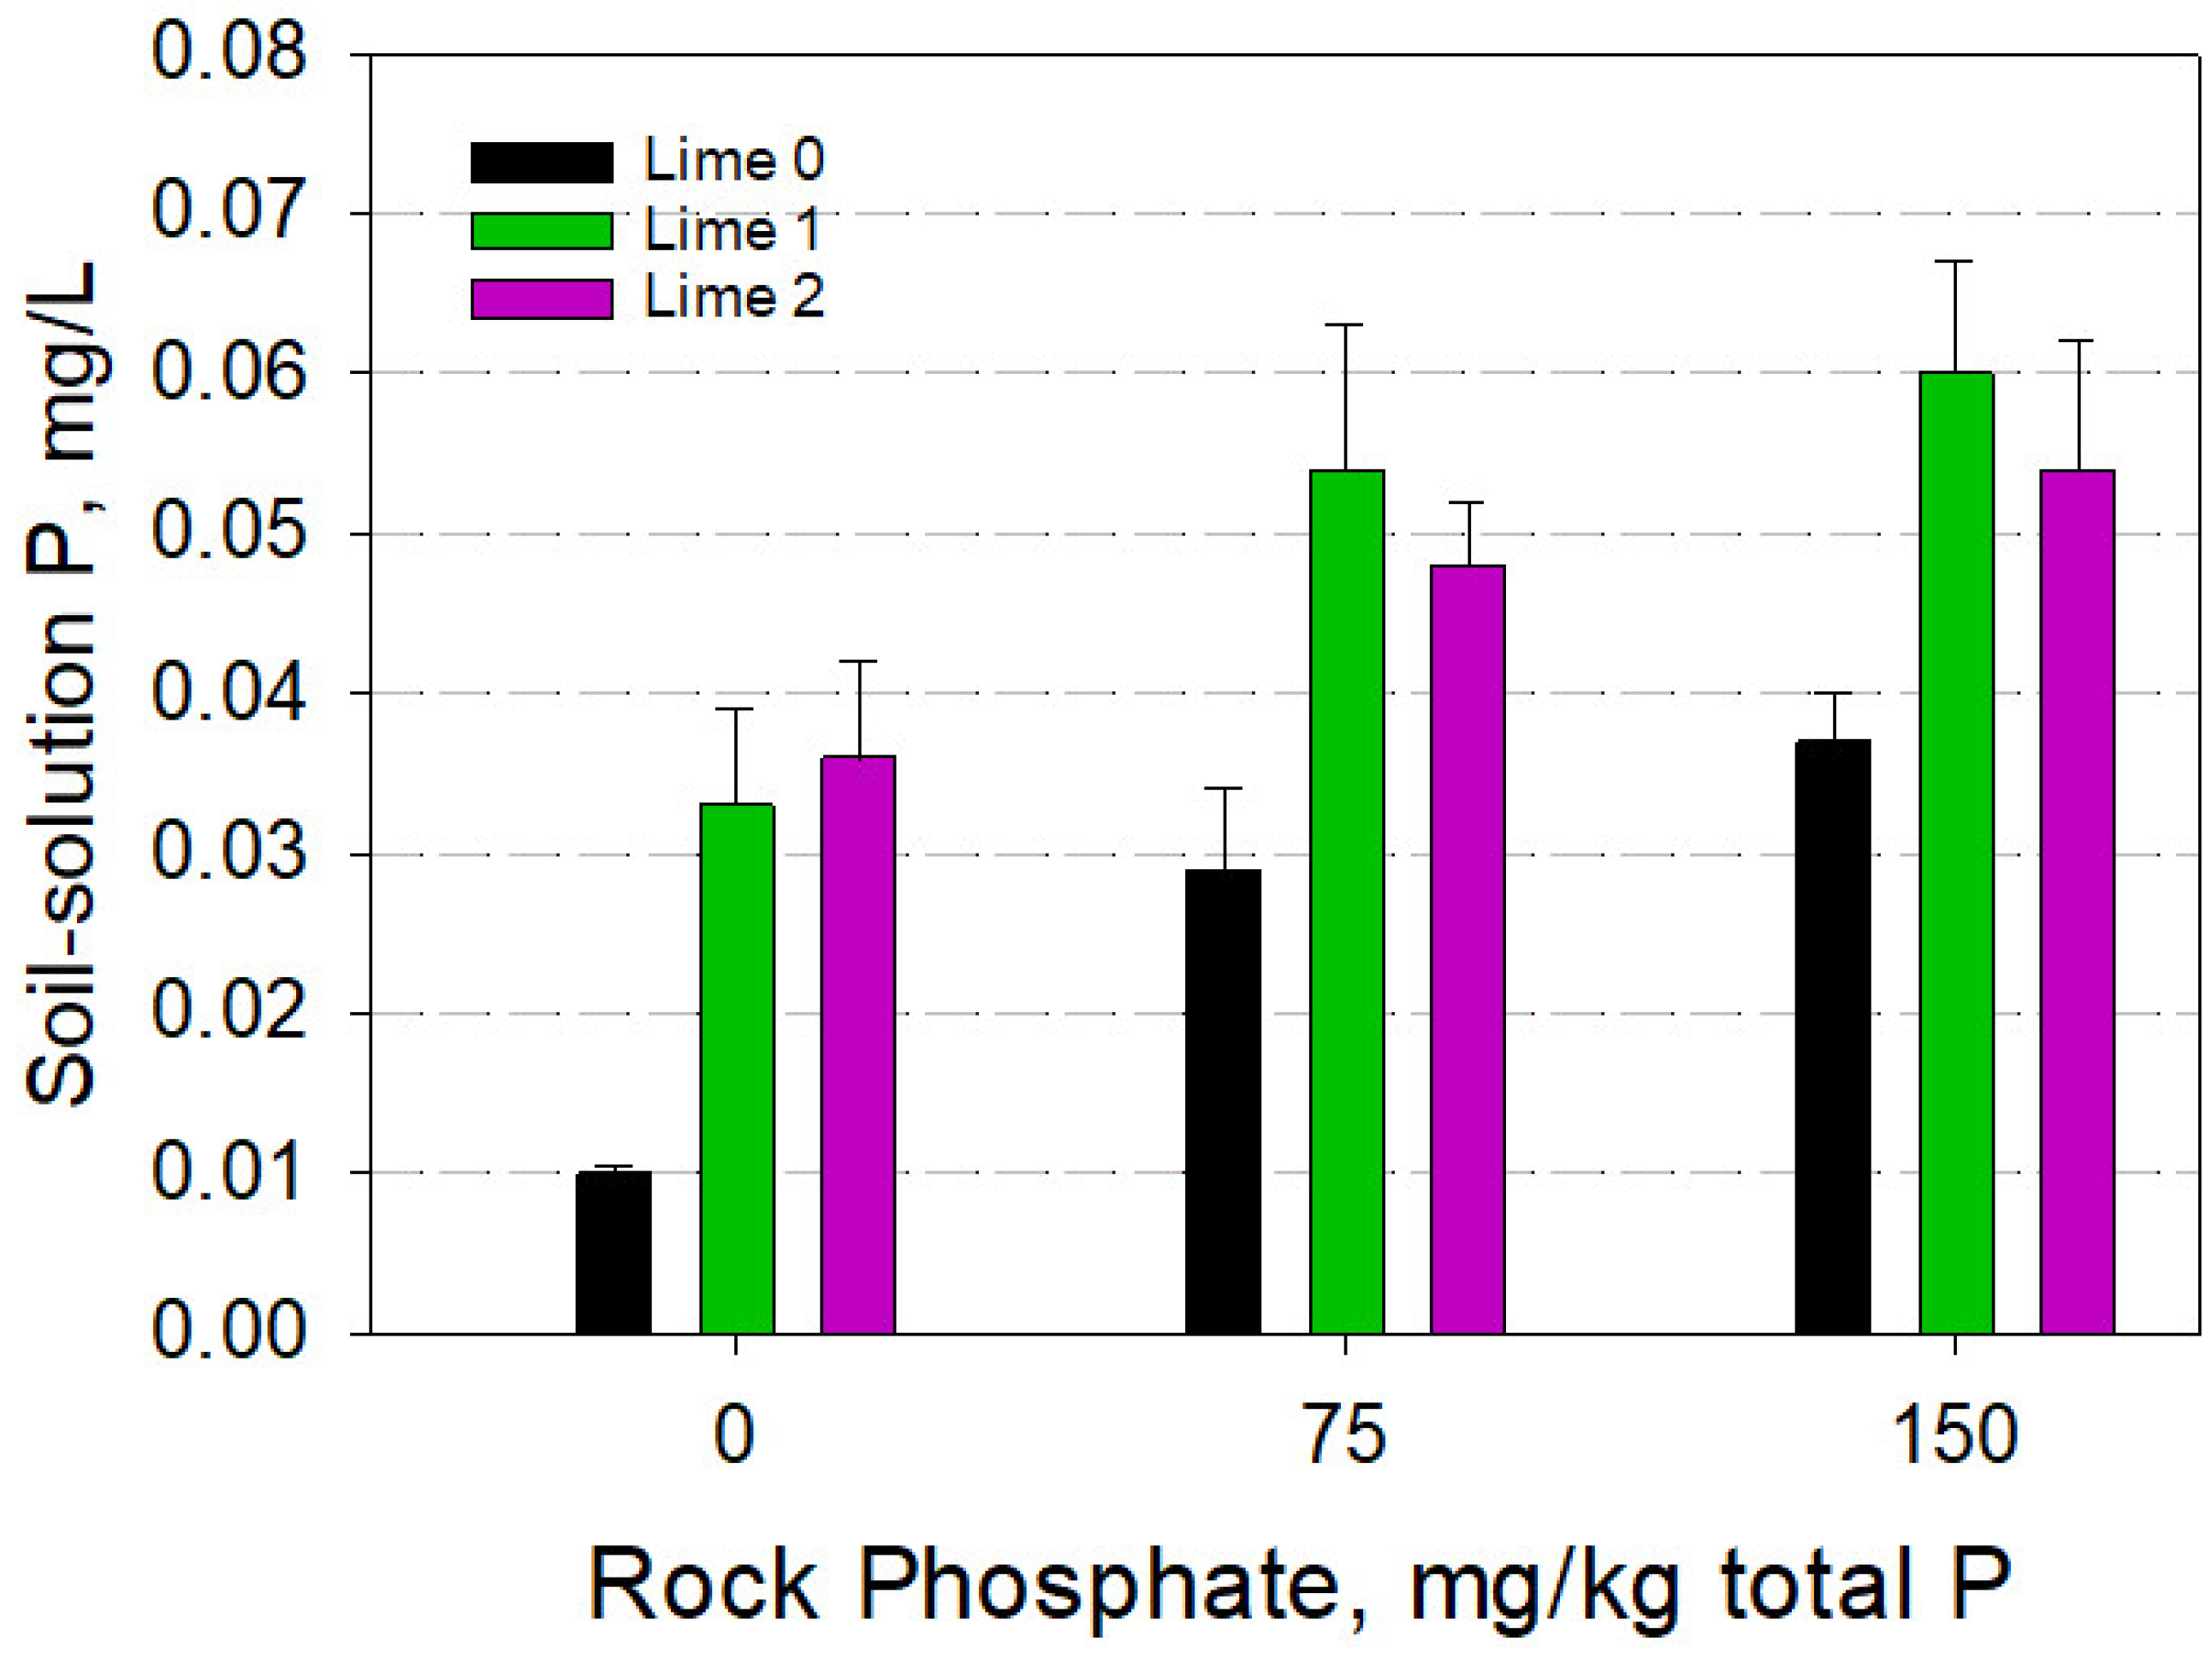
A factorial setup consisted of 3 levels of coral lime (0, 1, and 2 g/kg equivalent to 0, 2, and 4 tons/ha if 1 ha is assumed to weigh 2 × 10⁶ kg), 3 levels of rock phosphate (0, 75, and 150 mg P/kg) and 3 levels of cowpea green manure (0, 5, and 10 g/kg). The pots were arranged in a randomized complete block (RCB) design with 3 replications.
The treated soil was moistened with deionized water to field water holding capacity (28%) and incubated in a greenhouse (at the Magoon facility, University of Hawaii) for two weeks. Thereafter, one 10-day old seedling of soybean cultivar Kahala was transferred to each pot and grew for one month. Dry matter weight and nutrient content of the above-ground plant tissue were measured as follows. Plant tissue was thoroughly washed first with tap water then with de-ionized water, and oven-dried at 70 °C for 3 days. Subsequently the dried materials were weighed and ground to pass a 0.5 mm sieve. The finely ground material (0.50 g) was ashed at 400 °C in a muffle furnace for 4 h. The ash was dissolved in 20 mL of 1 M HCl, filtered through a Whatman No. 42 paper, and stored for elemental analysis with an inductively coupled plasma spectrometer.

2.3. Soil-Solution Extraction

Soil samples were collected at transplanting and a centrifugation method was used to extract the soil solution [15,16]. Briefly, approximately 200 g of moist soil were placed into a modified Buchner funnel and centrifuged at 500× g for 30 min. The solution collected (approximately 10 mL) was stored at 4 °C for subsequent chemical analyses (Al, pH, P, etc.)

2.4. Chemical and Statistical Analyses

Soil pH was measured in water as follows. Twenty grams of soil were mixed with 20 mL of deionized water, stirred for 2 min, equilibrated for 30 min. Thereafter, pH of the slurry (and of the soil solution) was measured with a combination pH electrode and a digital pH meter.
KCl-extractable Al was obtained as follows. Five grams of soil were shaken in 25 mL of 1 M KCl for 30 min, then centrifuged at 12,000× g for 10 min. The extraction procedure was repeated once and the combined extract was brought to 50 mL with 1 M KCl. Soluble Al was determined by the eriochrome cyanine R colorimetric method [17].
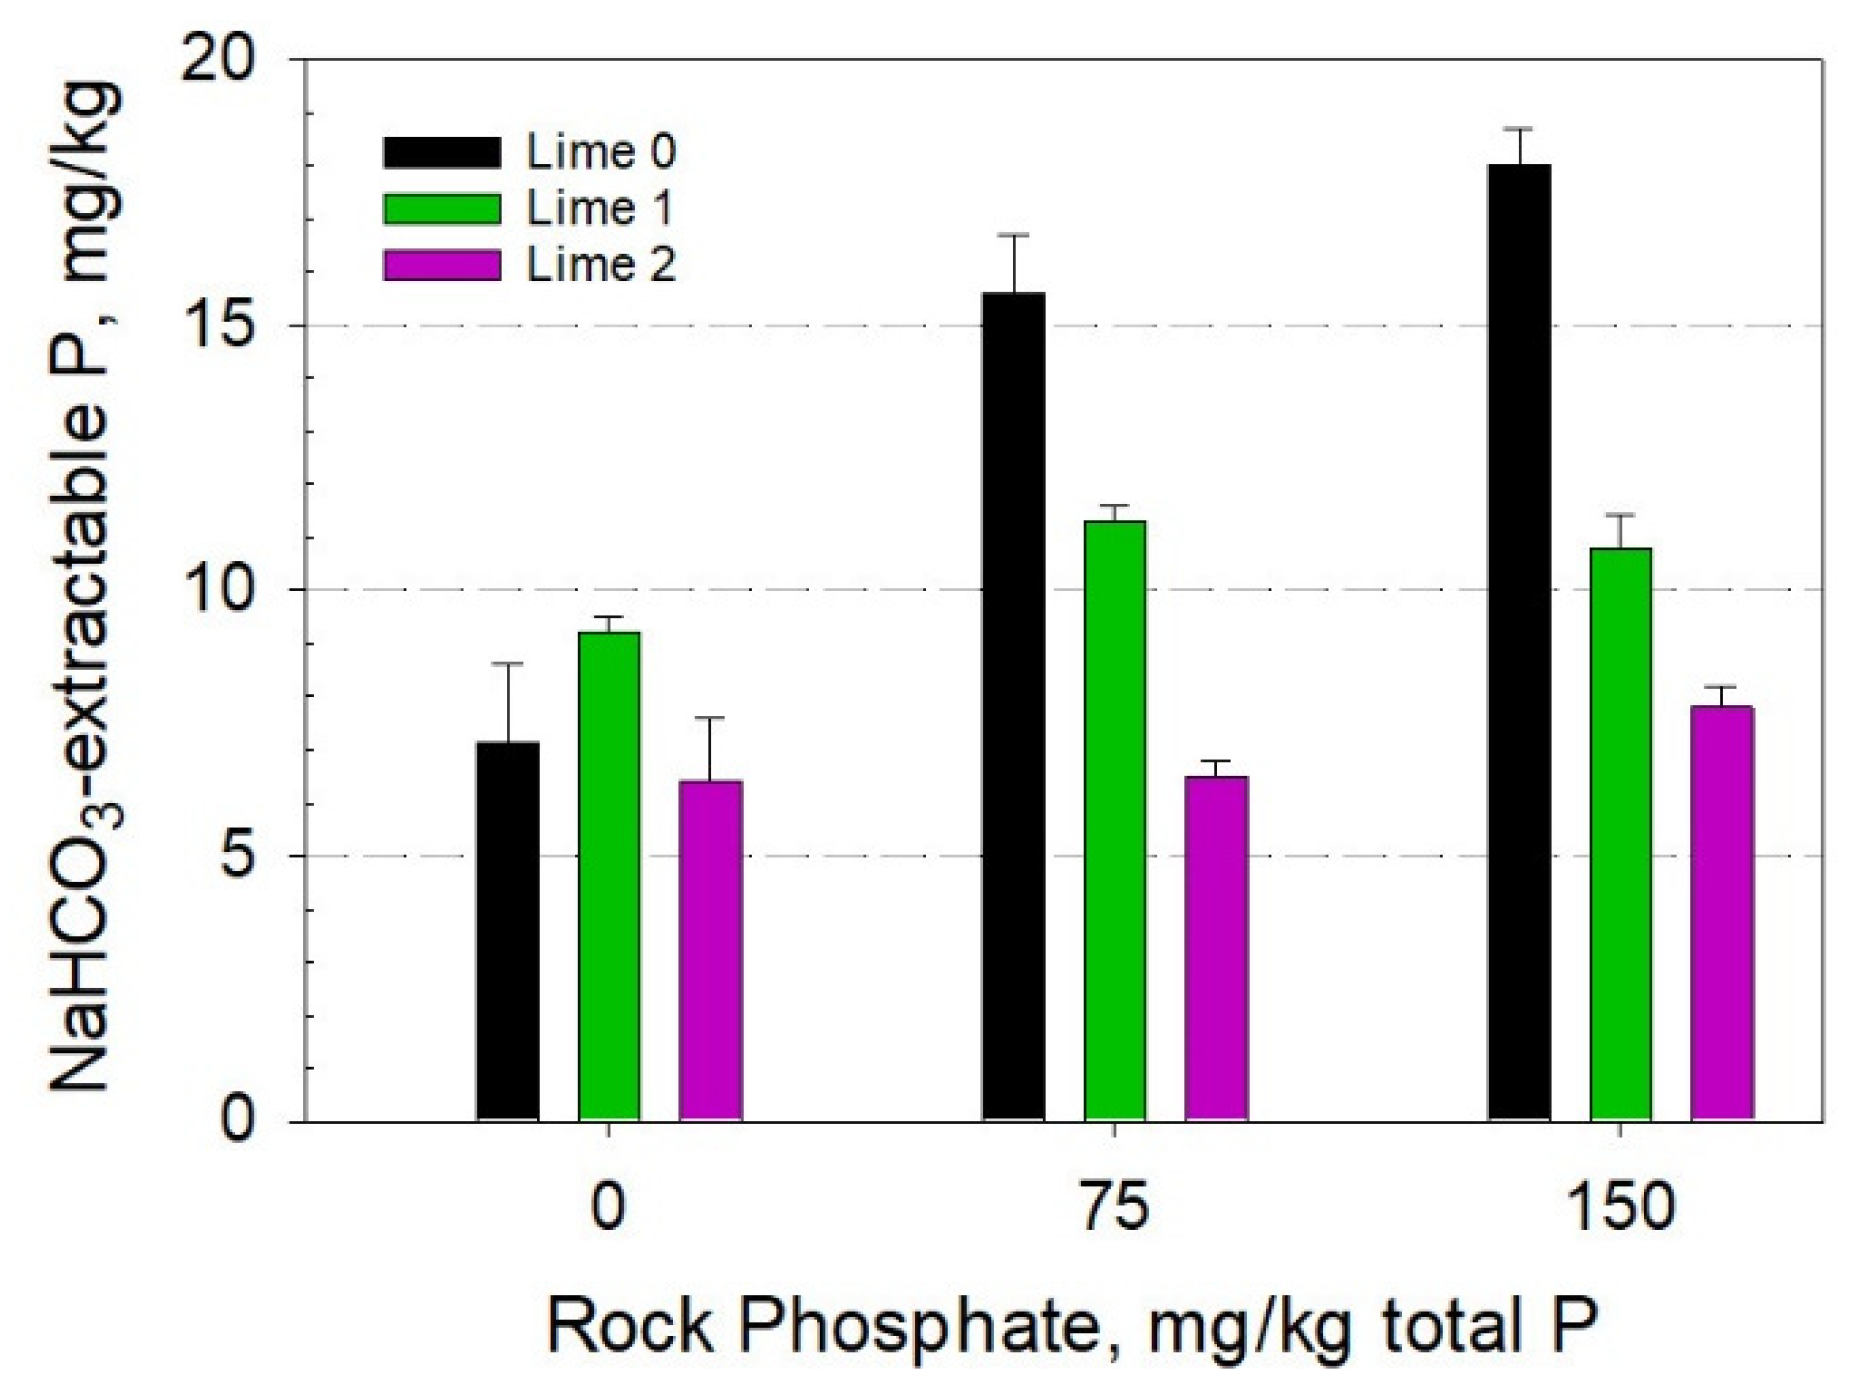
Soil P was extracted with 0.5 M NaHCO3 solution as follows. One gram of soil was placed in a centrifuge tube with 20 mL of 0.5 M NaHCO3 solution. The tube was shaken for 30 min and centrifuged at 12,000× g for 10 min. Soluble P was measured by the molybdate-ascorbic acid method [18]. Soil-solution organic carbon was determined by the Mn(III)-pyrophosphate method [19].
For statistical analysis, Minitab v. 21 (Minitab LLC, State College, PA, USA) was used to detect treatment effects on soil properties and plant growth parameters via a 3-way factorial ANOVA. Fisher Least Significant Difference (LSD) test with the significant level set at 95% was performed on all 27 treatments (when there were significant interactions among the lime, rock phosphate, and green manure amendments). Pearson correlation was also performed on some parameters, such as Ca and P in plant tissue vs. those in soil solution. Sigmaplot v. 14.5 (Systat Software Inc., Chicago, IL, USA) was used to construct graphs and build regression equations.

3. Results and Discussion

3.1. Soil Properties as Affected by Organic Amendments

The changes in soil pH, KCl-extractable (thereafter referred to as exchangeable) Al, and NaHCO3-extractable (thereafter referred to as Olsen) P as affected by lime, rock phosphate and cowpea green manure is listed in Table 2. A 3-way factorial analysis of variance for many soil and plant measured parameters (dependent variables) against lime, rock phosphate, and green manure (independent variables) was presented in Table 3 to examine the effects of the three soil amendments and their interactions. Indeed, the interactions had highly significant effect, not only on pH, but also on exchangeable Al and extractable P as well.
Predictably, applications of coral lime raised soil pH from 4.46 (treatment 0-0-0) to 4.96 at 1 ton/ha (treatment 1-0-0) and to 5.41 at 2 tons/ha (treatment 2-0-0). Such soil pH increases can readily be explained by the following reactions.
CaCO3 + H2O → Ca2+ + CO2 + 2 OH
Al3+ + 3 OH → Al(OH)3 (solid)
and H+ + OH → H2O (neutral)
The excess OH produced by lime dissolution caused soil pH to rise. More interestingly is the moderate rise in soil pH (by approximately 0.2–0.3 unit) by the additions of rock phosphate (Figure 1A) and cowpea green manure (Figure 1B). Such pH increases can be explained as follows.
Figure 1. Soil pH as affected by lime and rock phosphate (A) with all green manure treatments combined, and by green manure and rock phosphate (B) in the no lime treatment. Error bars on top of larger bars are the standard deviation of the measured samples.
Agriculture 12 02045 g001
Ca10(OH)2(PO4)6 + 12 H2O → 10 Ca2+ + 6 H2PO4 + 12 OH
(R6 is another form of R1)
Thus, the dissolution of rock phosphate, although very limited, would consume H+ (see R1) or release OH (see R6). Similarly, the addition and subsequent mineralization of cowpea green manure would yield first NH3 then NH4+ and OH as illustrated for a simple amino acid (alanine) below.
Agriculture 12 02045 i001
NH3 + H2O → NH4+ + OH
Table 2. Soil pH, KCl-extractable Al, and NaHCO3-extractable P in an acid Oxisol as affected by lime, rock phosphate and green manure amendments.
TreatmentSoil pHKCl-ExtractableNaHCO3-Extractable
Lime-Rock P-Green Manure(1:1 in water)AlP
←---------------mg/kg---------------------→
0-0-04.4676.75.84
0-0-54.5272.76.47
0-0-104.6339.68.84
0-75-04.4850.314.86
0-75-54.6121.815.28
0-75-104.8610.516.94
0-150-04.5331.818.75
0-150-54.7114.917.18
0-150-104.939.118.07
1-0-04.967.79.47
1-0-55.044.79.32
1-0-105.193.68.90
1-75-05.084.311.30
1-75-55.163.611.05
1-75-105.442.811.62
1-150-05.134.614.11
1-150-55.314.09.08
1-150-105.273.69.16
2-0-05.413.14.92
2-0-55.542.56.98
2-0-105.711.67.21
2-75-05.533.16.51
2-75-55.633.46.79
2-75-105.812.26.28
2-150-05.522.27.48
2-150-55.752.58.24
2-150-105.902.87.77
LSD(0.05) Ϯ0.042.12.14
Ϯ Least Significant Difference at 95% level, when all 27 treatments were considered as independent variables (due to strong interactions among lime, rock phosphate and green manure).
As R8 shows green manure mineralization would temporarily (a few weeks) raise soil pH until NH4+ is oxidized to nitrate (NO3) with the help of nitrifying bacteria, then pH may drop.
The precipitation of Al(OH)3 as a results of Al3+ reacting with OH (R4) caused a decrease in exchangeable Al (Table 2 and Figure 2). For example, Figure 2 shows that the coral lime lowered exchangeable Al from 56 mg/kg in the control (0 lime-0 Rock P-all 3 GM combined) to 5.3 and 2.4 mg/kg in the 1 g/kg and 2 g/kg lime treatments, respectively. The alleviating effects of rock phosphate on exchangeable Al was also significant: rock phosphate decreased exchangeable Al from 56 mg/kg (zero rock P) to 27.5 and 18.6 mg/kg at 75 and 150 mg/kg P additions, respectively (Figure 2).
Table 3. 3-way factorial ANOVA and associated P-values (probability of significance) for selected measured parameters (dependent variables) of soil and plant as impacted by lime, rock phosphate (RP) and green manure (GM) amendments on an Oxisol of Hawaii.
SourceDFp-Value Ϯ
Extractable parametersSoil solution parametersPlant parameters
pHAlPpHPOrg. CDW AlMn
Lime2<0.001<0.001<0.001<0.001<0.0010.0610.208<0.001<0.001
RP 2<0.001<0.001<0.0010.052<0.0010.072<0.001<0.001<0.001
GM 2<0.001<0.001<0.001<0.001<0.001<0.0010.277<0.001<0.001
Lime*RP4<0.001<0.001<0.0010.034<0.0010.0340.008<0.001<0.001
Lime*GM4<0.001<0.001<0.001<0.0030.076<0.0010.332<0.001<0.001
RP*GM4<0.001<0.001<0.0010.575<0.0010.0060.147<0.001<0.001
Lime*RP*GM8<0.001<0.001<0.0010.487<0.0010.0090.236<0.001<0.001
Error54Ϯ If p-value < 0.05 then the effect is significant at 95% level.
Total80 RP = rock phosphate, GM = green manure, DW = dry weight.
Changes in Olsen-P as affected by lime and rock phosphate were more complex. The low rate of lime (1 g/kg) slightly increased soil Olsen-P, but the high rate (2 g/kg) did not in the zero rock phosphate treatments (Figure 3). When rock phosphate was added, lime reduced Olsen P (Figure 3). Perhaps, high Ca in the lime would react with HCO3 of the NaHCO3 solution, thereby diminishing its P extracting power. A suggested reaction is:
Ca2+ + 2 HCO3 → CaCO3 (solid) + H2O + CO2
Predictably, rock phosphate increased Olsen P significantly in the treatments with no lime: Olsen P concentrations were 7.13 mg/kg (in the control: no lime, no rock phosphate, all 3 GM treatments), 15.69 and 18.0 mg/kg in the 75 and 150 mg P/kg, respectively (Figure 3). However, the higher rock phosphate rate (150 mg P/kg) only increased Olsen P moderately over the lower rock phosphate rate. That suggests that the P releasing capacity of rock phosphate might have approached a plateau not far beyond the 150 mg P/kg rate.

3.2. Effects of Organic Amendments on Soil-Solution Composition

Soil-solution composition as affected by green manure (GM), lime, and rock phosphate additions is listed in Table 4. Increases in dissolved organic carbon (DOC) in response to the cowpea GM were most noticeable. When all rock phosphate and lime treatments were analyzed in combination, DOC increased from 2.0 mmole/L in the zero GM to 3.5 and 5.6 mmole/L in the 5 and 10 g/kg GM, respectively (Figure 4).
Complex formation between soluble Al and DOC would likely be responsible for the gentile decline of soluble Al as a function of pH increase as shown in Figure 5. Although concentration of soluble Al (Y axis) in the soil solution did indeed decrease from 0.57 mg/L to <0.05 mg/L as soil solution pH (X axis) went up from approximately 4.5 to 5.8, respectively, due to lime and rock phosphate additions, the decline was only 0.43 fold (Y = −0.43 X + 2.57; R2 = 0.87) for each pH unit increase. The drop in Al concentration was not as steep as would have predicted from the solubility of such Al minerals as gibbsite [crystalline Al(OH)3] or even amorphous Al(OH)3 solid [9,10]. The results suggest that most soil-solution Al was in the organically complexed forms, which are often less dependent on pH and less toxic to living organisms than inorganic Al species [20,21].
Changes in soil-solution manganese (Mn) are also worth noting: soluble Mn concentration was lowered with pH but was elevated by DOC (Table 4). For example, in response to lime, Mn declined from 3.2 mg/L in the (0-0-10) treatment to 0.43 mg/L in the (2-0-10) treatment. On the other hand, Mn went up from 0.50 mg/L in the no-amendment control (0-0-0) to 1.78 and 3.20 mg/L in the (0-0-5) and (0-0-10) treatments with increasing GM additions. Linear regression of soluble Mn (Y) with respect to DOC and pH yields: (Y (mg/L) = 0.42 × DOC (mmole/L) – 0.64 × pH + 3.16; R2 = 0.65). The role of both DOC (source of electrons (e)) and pH (source of H+) in the solid Mn dissolution can be expressed in the following reaction:
MnO2 (solid) + 4 H+ + 2 e → Mn2+ + 2H2O
Soil-solution P was also significantly changed with rock phosphate and lime additions (Table 4 and Figure 6). However, the change was not linear. Not unexpectedly, soluble P increased with rock phosphate rates: it was 0.010 mg/L in the no-amendment control (0-0-0), 0.022 mg/L in (0-75-0) and 0.035 mg/L in (0-150-0) treatments with 75 and 150 mg/kg rock phosphate additions. The first lime rate (1 g/kg) increased soluble P from 0.035 to 0.054 and 0.060 mg/L, but the higher lime rate (2 g/kg) did not increase P any further (Figure 6). These variable changes in soil-solution P were probably a result of complex interactions among many factors, including GM (organic P mineralization), rock phosphate dissolution, H+ neutralizing power of lime, as well as native soil P and its indigenous organic matter.

3.3. Soybean Responses to Organic Amendments

Dry matter of soybean shoot and its chemical composition are listed in Table 5. Statistical analysis indicated that rock phosphate and the interaction between rock phosphate and lime had significant effect on plant growth (Table 3). In general, plant tissue N and K seemed to be unaffected by the treatments, having a mean ± standard deviation of 2.11 % ± 0.20 for N and 2.39 % ± 0.20 for K. On the other hand, tissue P and Ca strongly reflected both rock phosphate and lime additions, and their variations were positively correlated with changes in soil-solution P and Ca (Table 6). Since the cowpea GM was used to provide N and K to soybean, and was not a focus of this experiment, all three GM rates were combined in examining the effects of lime and rock phosphate on soybean growth. When such combined data were statistically analyzed, it reveals that the best growths were obtained from treatments (A) (bar with letter A adjacent in Figure 7) no lime + 150 RP, (B) lime 1 + 150 RP, and (C) lime 1 + 75 RP (Figure 7). Over time, treatment (A) may have some potential problems with marginal Al and relatively high Mn in leaves (average: 31.7 mg Al/kg and 250 mg Mn/kg) compared to those in treatment (B) and particularly treatment (C), which averaged 21.6 mg Al/kg and 135 mg Mn/kg (Table 5). Furthermore, treatment (C) used only ½ rock phosphate as much as treatment (B). Based on such material and economic considerations, treatment (C), containing lime 1+ 75 mg P/kg rock phosphate, seems to be the most appropriate input. Soil parameters corresponding to treatment (C) were: soil pH (1:1 in water) = 5.2 (Figure 1A), exchangeable Al = 3.6 mg/kg (Figure 2), Olsen P = 11 mg/kg (Figure 3), and its corresponding soil-solution P of 0.054 mg/L (Figure 6). These critical P levels fall within the suggested ranges of 10–15 mg/kg (Olsen P) as reported by Deng et al. [22] for corn, 12–15 mg/kg (Olsen P) for soybean as recommended by the Minnesota University Extension [14], and 0.01–0.10 mg/L (soil-solution P) for many crops [2,23,24].

4. Conclusions

With the goal towards organic cropping, our experiment on an acid and nutrient-poor Oxisol of Hawaii was conducted with only soil organic amendments, and soybean seedlings served as a test crop. Our results showed that rock phosphate (10.6% total P and 3.7% citrate extractable P) applied at 75 mg/kg total P (equivalent to approximately 150 kg/ha) in combination with 1 g/kg (2 tons/ha) of a coral lime (with a local cowpea green manure supplying N and K nutrients) could alleviate acidity problems and provide adequate P to the plant growth, lending support to the sustainable potential of organic farming.

Author Contributions

Conceptualization: R.H., N.H.; Methodology: R.H.; Writing: first draft—R.H., final draft—N.H. All authors have read and agreed to the published version of the manuscript.

Funding

USDA-Hatch projects (8054-H and 8048-R) awarded to Nguyen Hue.

Institutional Review Board Statement

Not applicable.

Informed Consent Statement

Not applicable.

Data Availability Statement

Not applicable.

Acknowledgments

The authors would like to thank the faculty of College of Tropical Agriculture and Human Resources, University of Hawaii, for their support of this research work.

Conflicts of Interest

The authors declare no conflict of interest.

References

  1. USDA national organic program. In Standard Manual; CCOF Certification Services LLC: Santa Cruz, CA, USA, 2022.
  2. Fageria, N.K. The Use of Nutrients in Crop Plants; Chapter 3: Phosphorus; CRC Press: Boca Raton, FL, USA, 2009; pp. 91–130. [Google Scholar]
  3. Sanchez, P. Properties and Management of Soils in the Tropics, 2nd ed.; Chapter 14: Phosphorus; Cambridge University Press: Cambridge, UK, 2009; pp. 370–414. [Google Scholar]
  4. Havlin, J.; Tisdale, S.; Nelson, W.; Beaton, J. Soil Fertility and Fertilizers; Chapter 5: Phosphorus; Pearson India Education Services: Ultar Pradesh, India, 2017; pp. 190–225. [Google Scholar]
  5. Barker, A. Science and Technology of Organic Farming; Chapter 3: Requirements of plants for soil-derived nutrients; CRC Press: Boca Raton, FL, USA, 2010; pp. 17–80. [Google Scholar]
  6. Fageria, N.K.; He, Z.L.; Baligar, V.C. Functions of phosphorus in crop plants. In Phosphorus Management in Crop Production; CRC Press: Boca Raton, FL, USA, 2017; pp. 47–90. 368p. [Google Scholar]
  7. Hue, N.; Silva, J. Organic soil amendments for sustainable agriculture. In Plant Nutrient Management in Hawaii’s Soils; Silva, J.A., Uchida, R., Eds.; College of Tropical Agriculture & Human Resources, University Hawaii at Manoa: Honolulu, HI, USA, 2000. [Google Scholar]
  8. Lazcano, C.; Decock, C.; Wong, C.; Garcia-Brucher, K. Assessing the effects of compost on soil health. In Improving Soil Health; Horwath, W., Ed.; Burleigh Dodds Science Publishing: Cambridge, UK, 2023. [Google Scholar]
  9. Tubeileh, A.; Goss, M. Assessing the effects of using animal manure on soil health. In Improving Soil Health; Horwath, W., Ed.; Burleigh Dodds Science Publishing: Cambridge, UK, 2023. [Google Scholar]
  10. Mikkelsen, R. Sources of phosphorus for plants: Past, present, and future. Better Crops 2019, 103, 17–21. [Google Scholar] [CrossRef] [Green Version]
  11. Lindsay, L. Chemical Equilibria in Soils; Chapter 12: Phosphates; John Wiley & Sons: New York, NY, USA, 1979; pp. 162–209. [Google Scholar]
  12. Hue, N. Soil acidity: Development, impacts, and management. In Structure and Functions of Pedosphere; Giri, B., Kapoor, R., Wu, Q., Varma, A., Eds.; Springer Nature: Singapore, 2022; pp. 103–131. [Google Scholar]
  13. Afzal, F.; Khan, T.; Khan, A.; Khan, S.; Raza, H.; Ihsan, A.; Ahanger, M.; Kazi, A. Nutrient deficiencies under stress in legumes: An overview. In Legumes under Environmental Stress: Yield, Improvement and Adaptations; Azooz, M., Ahmad, P., Eds.; Wiley Blackwell: West Sussex, OK, USA, 2015. [Google Scholar]
  14. Kaiser, D.; Fernandez, F.; Wilson, M.; Piotrowski, K. Fertilizing Soybeans in Minnesota; University of Minnesota Extension: St Paul, MN, USA, 2022. [Google Scholar]
  15. Adams, F.; Burmester, C.; Hue, N.; Long, L. A comparison of column-displacement and centrifuge methods for obtaining soil solutions. Soil Sci. Soc. Am. J. 1980, 44, 733–735. [Google Scholar] [CrossRef]
  16. Wolt, J. Soil Solution Chemistry; Chapter 5: Obtaining soil solution; John Wiley & Sons: New York, NY, USA, 1994; pp. 95–120. [Google Scholar]
  17. Barhisel, R.; Berg, P. Aluminum. In Methods of Soil Analysis Part 2; Page, A.L., Miller, R.H., Keeney, D.R., Eds.; Soil Science Society of America: Madison WI, USA, 1982; pp. 275–300. [Google Scholar]
  18. Hue, N.; Evans, C. Procedures Used for Soil and Plant Analysis by the Auburn University Soil Testing Laboratory; Auburn University: Auburn, AL, USA, 1986. [Google Scholar]
  19. Bartlett, R.J.; Ross, D.S. Colorimetric determination of oxidizable carbon in acid soil solution. Soil Sci. Soc. Am. J. 1988, 52, 1191–1192. [Google Scholar] [CrossRef]
  20. Hue, N.; Craddock, R.; Adams, F. Effect of organic acids on aluminum toxicity in subsoils. Soil Sci. Soc. Am. J. 1986, 50, 28–34. [Google Scholar] [CrossRef]
  21. Strawn, D.; Bohn, H.; O’Connor, G. Soil Chemistry, 5th ed.; John Wiley & Sons: New York, NJ, USA, 2020; 379p. [Google Scholar]
  22. Deng, Y.; Chen, K.; Teng, W.; Zhan, A.; Tong, Y.; Feng, G.; Cui, Z.; Zhang, F.; Chen, X. Is the inherent potential of maize roots efficient for soil phosphorus acquisition? PLoS ONE 2014, 9, e90287. [Google Scholar] [CrossRef] [PubMed]
  23. Fox, R. External phosphorus requirements of crops. In Chemistry in the Soil Environment; Dowdy, R.H., Ryan, J.A., Volk, V.V., Baker, D.E., Eds.; Soil Science Society of America: Madison WI, USA, 1981; pp. 223–233. [Google Scholar]
  24. Hue, N.; Fox, R. Predicting plant phosphorus requirements for Hawaii soils using a combination of phosphorus sorption isotherms and chemical extraction methods. Commun. Soil Sci. Plant Anal. 2010, 41, 133–143. [Google Scholar] [CrossRef]
Figure 2. Soil Al as affected by lime and rock phosphate. Error bars on top of larger bars are the standard deviation of the measured samples.
Agriculture 12 02045 g002
Figure 3. Soil P as affected by lime and rock phosphate. Error bars on top of larger bars are the standard deviation of the measured samples.
Agriculture 12 02045 g003
Figure 4. Dissolved organic carbon (DOC) as affected by the cowpea GM amendments to an acid Oxisol of Hawaii. Error bars on top of larger bars are standard deviation of the measured samples.
Agriculture 12 02045 g004
Figure 5. Soil-solution Al as a function of soil-solution pH in an acid Oxisol amended with cowpea green manure, lime, and rock phosphate.
Agriculture 12 02045 g005
Figure 6. Soil-solution P as affected by rock P and lime amendments to an acid Oxisol. Error bars on top of larger bars are standard deviation of the measured samples.
Agriculture 12 02045 g006
Figure 7. Shoot dry weight of soybean seedlings as affected by lime and rock P amendments. Error bars on top of larger bars are standard deviation of the measured samples.
Agriculture 12 02045 g007
Table 1. Total nutrient contents of cowpea green manure, rock phosphate, and coral lime used in the experiment.
Input SourceNPKCaMgNa
←----------- % --------------→
Cowpea GM2.700.142.761.60.450.03
Florida rock phosphate Ϯ---10.640.0931.70.190.43
Samoa coral lime ---0.020.0234.51.470.31
Ϯ Labile P, as extracted with neutral 2% ammonium citrate, was 3.7%. Calcium carbonate (CaCO3) equivalent was 86%.
Table 4. Soil-solution composition of an acid Oxisol as affected by lime, rock phosphate, and cowpea green manure.
TreatmentpHAlPKCaMgMnOrganic CarbonEC
L-RP-GM ←---------------mg/L----------------------→mmole/LdS/m
0-0-04.510.570.01075.914.920.90.502.151.14
0-0-55.110.510.010128.830.324.21.783.631.20
0-0-105.390.300.011212.965.939.03.205.551.77
0-75-04.750.560.02285.132.018.90.251.881.17
0-75-54.980.450.032135.551.424.91.353.221.31
0-75-105.570.250.033212.575.739.72.225.271.79
0-150-05.000.430.03569.549.616.70.302.031.07
0-150-55.160.290.035126.863.224.71.853.661.35
0-150-105.630.190.041184.776.736.33.226.091.64
1-0-05.580.100.02255.361.115.80.501.721.08
1-0-55.730.070.032122.588.327.40.953.641.50
1-0-105.780.050.045190.3142.246.01.726.602.05
1-75-05.64BD 0.06362.369.017.70.222.351.18
1-75-55.70BD0.054120.4105.330.01.104.021.60
1-75-106.04BD0.045188.6152.745.81.526.092.04
1-150-05.91BD0.05264.295.021.70.251.991.39
1-150-56.02BD0.064116.9104.329.20.953.151.58
1-150-106.01BD0.066187.5162.748.31.575.772.07
2-0-06.23BD0.03249.1102.819.20.121.531.25
2-0-56.29BD0.034127.0146.233.10.353.341.83
2-0-106.40BD0.043183.4171.047.00.435.552.15
2-75-06.10BD0.05258.1102.418.90.231.461.29
2-75-56.27BD0.044120.3139.932.10.703.161.76
2-75-106.59BD0.048182.9185.348.61.125.222.26
2-150-05.99BD0.04659.0109.519.60.401.721.57
2-150-56.08BD0.055121.7139.035.10.884.241.85
2-150-106.32BD0.062174.2174.547.00.935.812.19
LSD(0.05) Ϯ0.220.030.00516.919.44.60.330.430.12
Below the Detection limit of 0.05 mg/L. Ϯ Least Significant Difference at 95% level, when all 27 treatments were considered as independent variables (due to strong interactions among lime, rock phosphate and green manure).
Table 5. Soybean dry matter and its chemical composition as affected by lime, rock phosphate, and cowpea green manure applications to an acid Oxisol of Hawaii.
TreatmentShootChemical Composition of Shoot
L-RP-GMDry matterNPKCaAlMn
g/plant←--------------% -----------------------------→←- mg/kg ------→
0-0-01.552.260.062.810.2886.6363.3
0-0-52.082.470.062.430.4766.5547.7
0-0-102.062.400.082.740.7653.2458.4
0-75-02.361.990.122.350.6547.3341.6
0-75-52.362.090.142.320.9645.3281.2
0-75-102.501.920.172.671.0746.3302.9
0-150-03.082.440.162.410.9635.1222.5
0-150-52.741.950.172.451.1131.4253.8
0-150-102.412.130.242.511.2428.6275.3
1-0-02.221.880.062.411.0327.7149.9
1-0-52.082.060.082.351.0726.3148.6
1-0-102.172.060.082.551.2726.7212.6
1-75-02.491.950.162.221.1525.1119.6
1-75-52.512.200.222.491.2620.8128.4
1-75-102.721.950.242.391.3418.9157.7
1-150-02.591.990.162.091.2720.0116.5
1-150-52.652.000.262.251.2821.6128.0
1-150-102.562.000.252.391.3418.9157.7
2-0-02.521.820.062.001.1318.375.7
2-0-52.462.370.082.241.3517.288.8
2-0-101.732.440.122.411.5416.8121.2
2-75-02.082.060.162.081.4015.382.0
2-75-52.122.060.162.411.3715.1117.7
2-75-102.721.810.182.451.3513.8106.7
2-150-02.332.200.161.981.3911.280.7
2-150-52.412.400.172.191.5010.1110.2
2-150-102.162.400.162.321.529.09115.7
LSD(0.05) Ϯ0.250.120.030.210.145.742.0
Ϯ Least Significant Difference at 95% level, when all 27 treatments were treated as independent variables (due to strong interactions among lime, rock phosphate and green manure).
Table 6. Pearson correlation coefficients of plant tissue Ca and P vs. soil-solution Ca and P.
Soil-Solution PSoil-Solution Ca
Plant P0.72 **0.35 (NS)
Plant Ca0.81 **0.85 **
** significant at 99% level, NS: non significant.
Publisher’s Note: MDPI stays neutral with regard to jurisdictional claims in published maps and institutional affiliations.

