EEG is A Predictor of Neuroimaging Abnormalities in Pediatric Extracorporeal Membrane Oxygenation

Abstract
:1. Introduction
2. Materials and Methods
2.1. Patients
2.2. Data Collection
2.3. EEG Measurements
2.4. Neuroimaging Assessments, Scoring and Classification
2.5. Statistical Methods
3. Results
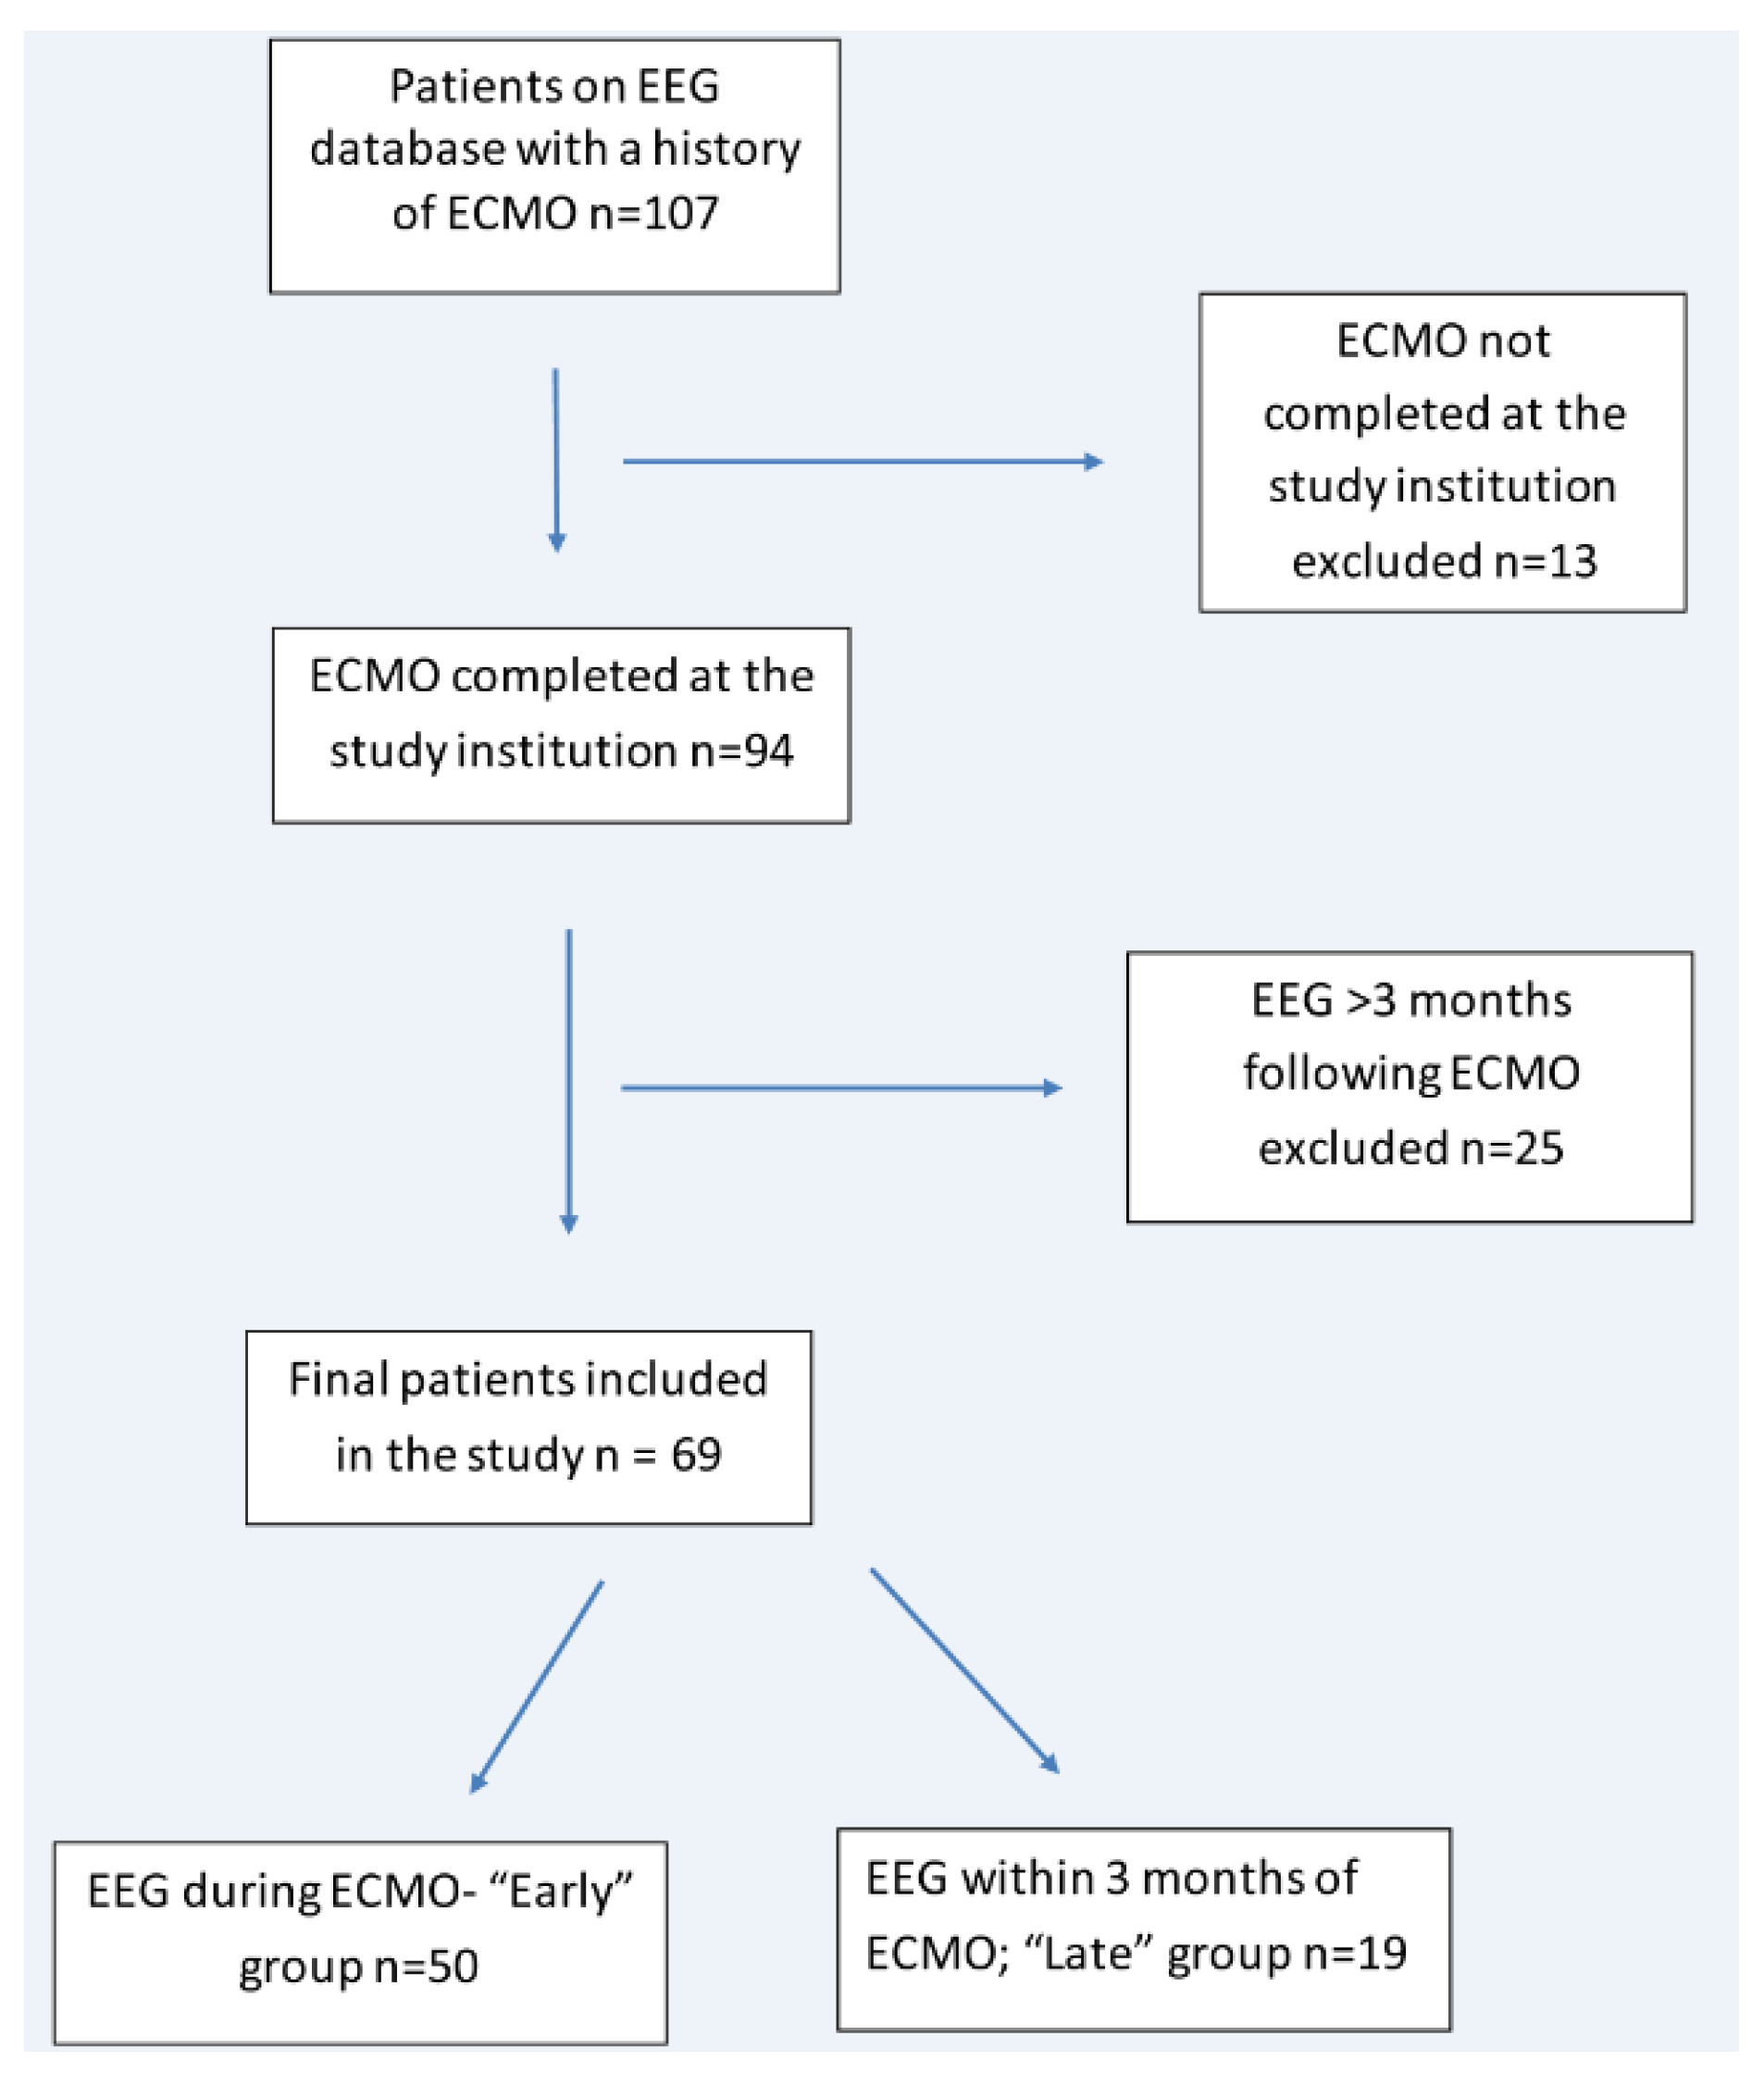
3.1. Patients
3.2. Early Group
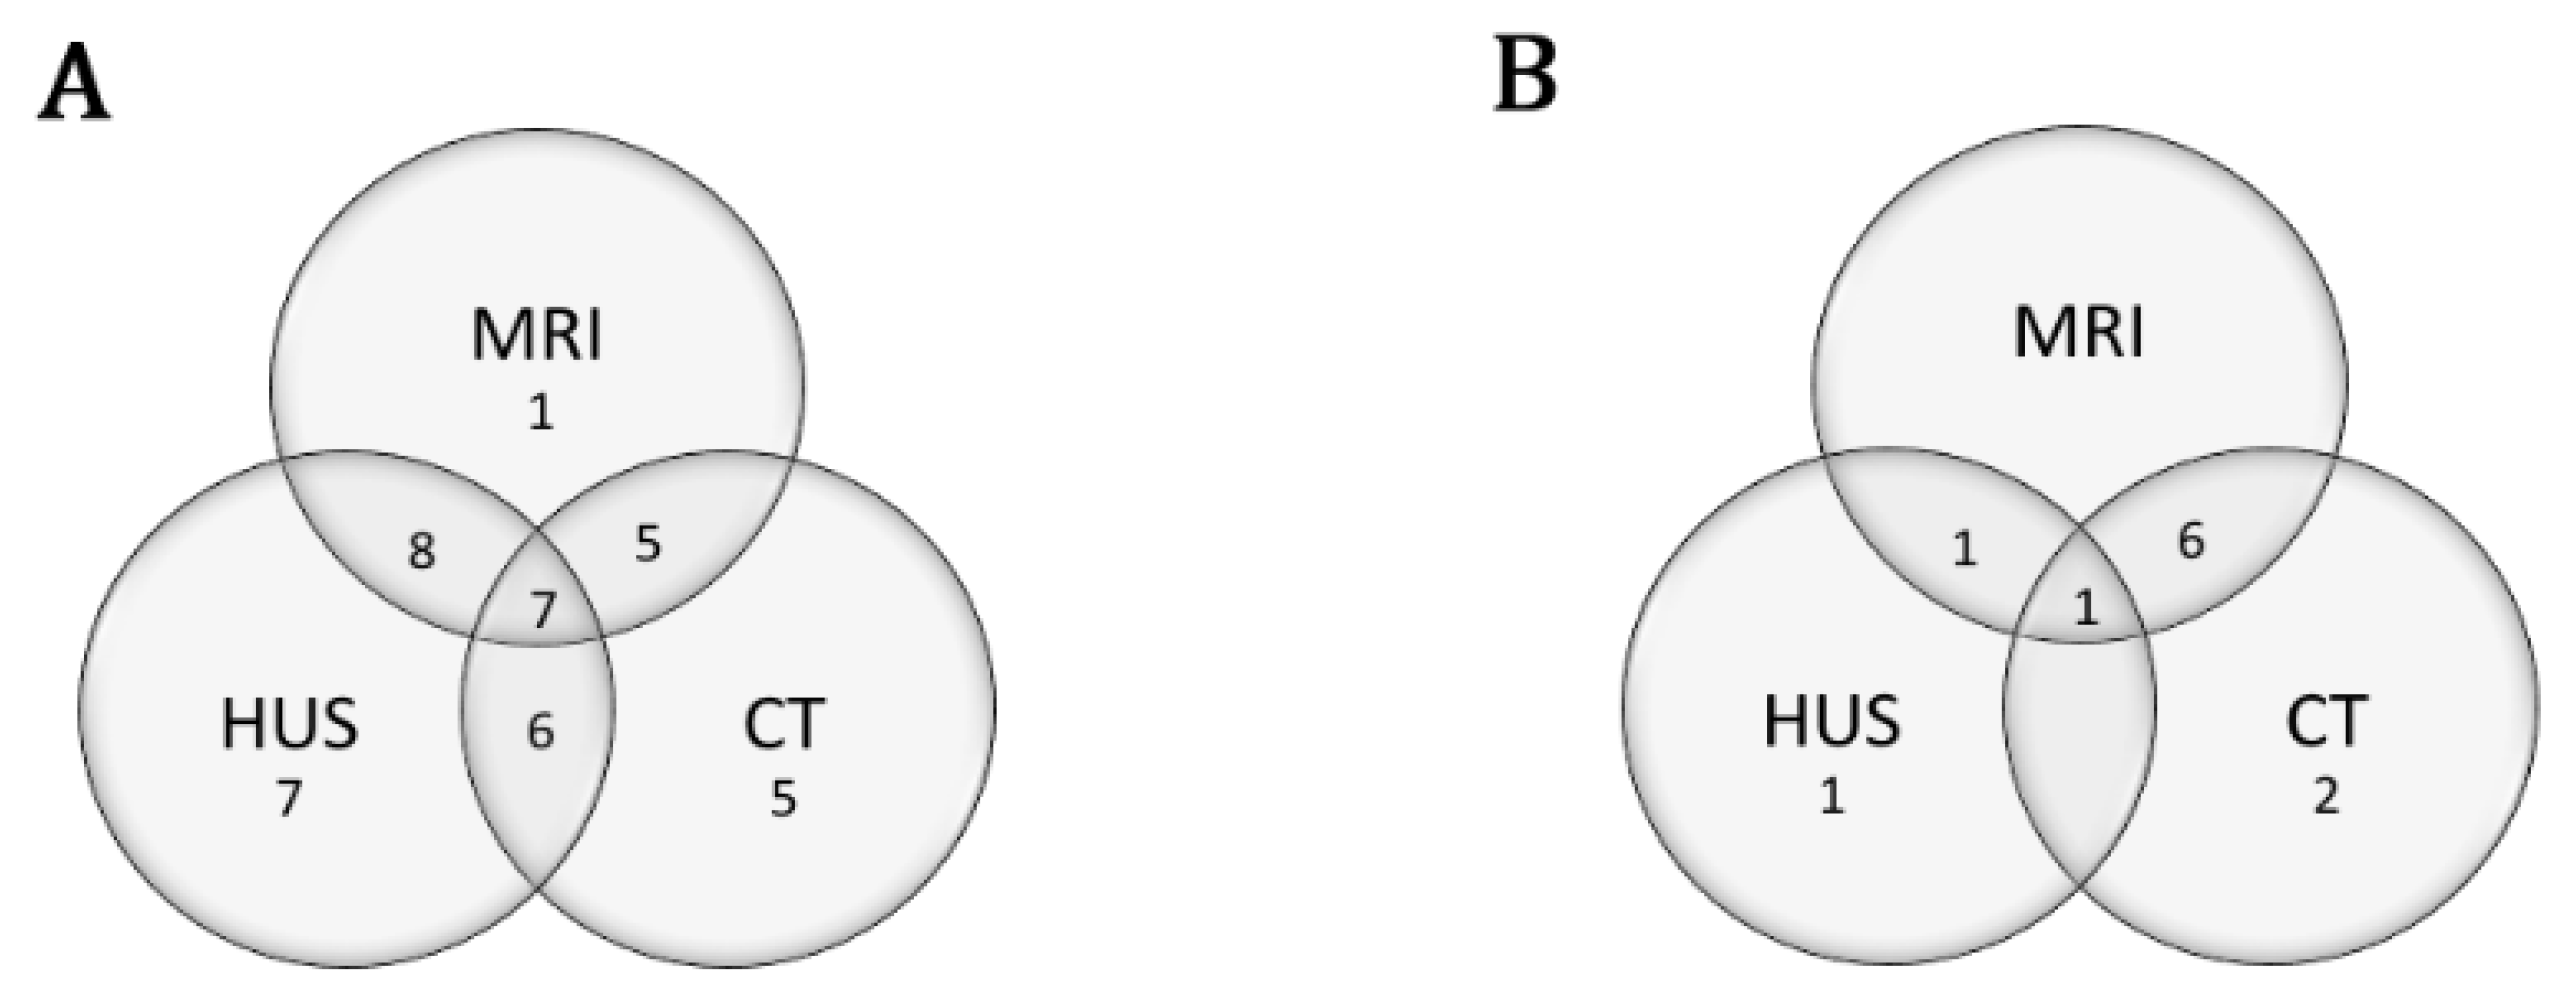
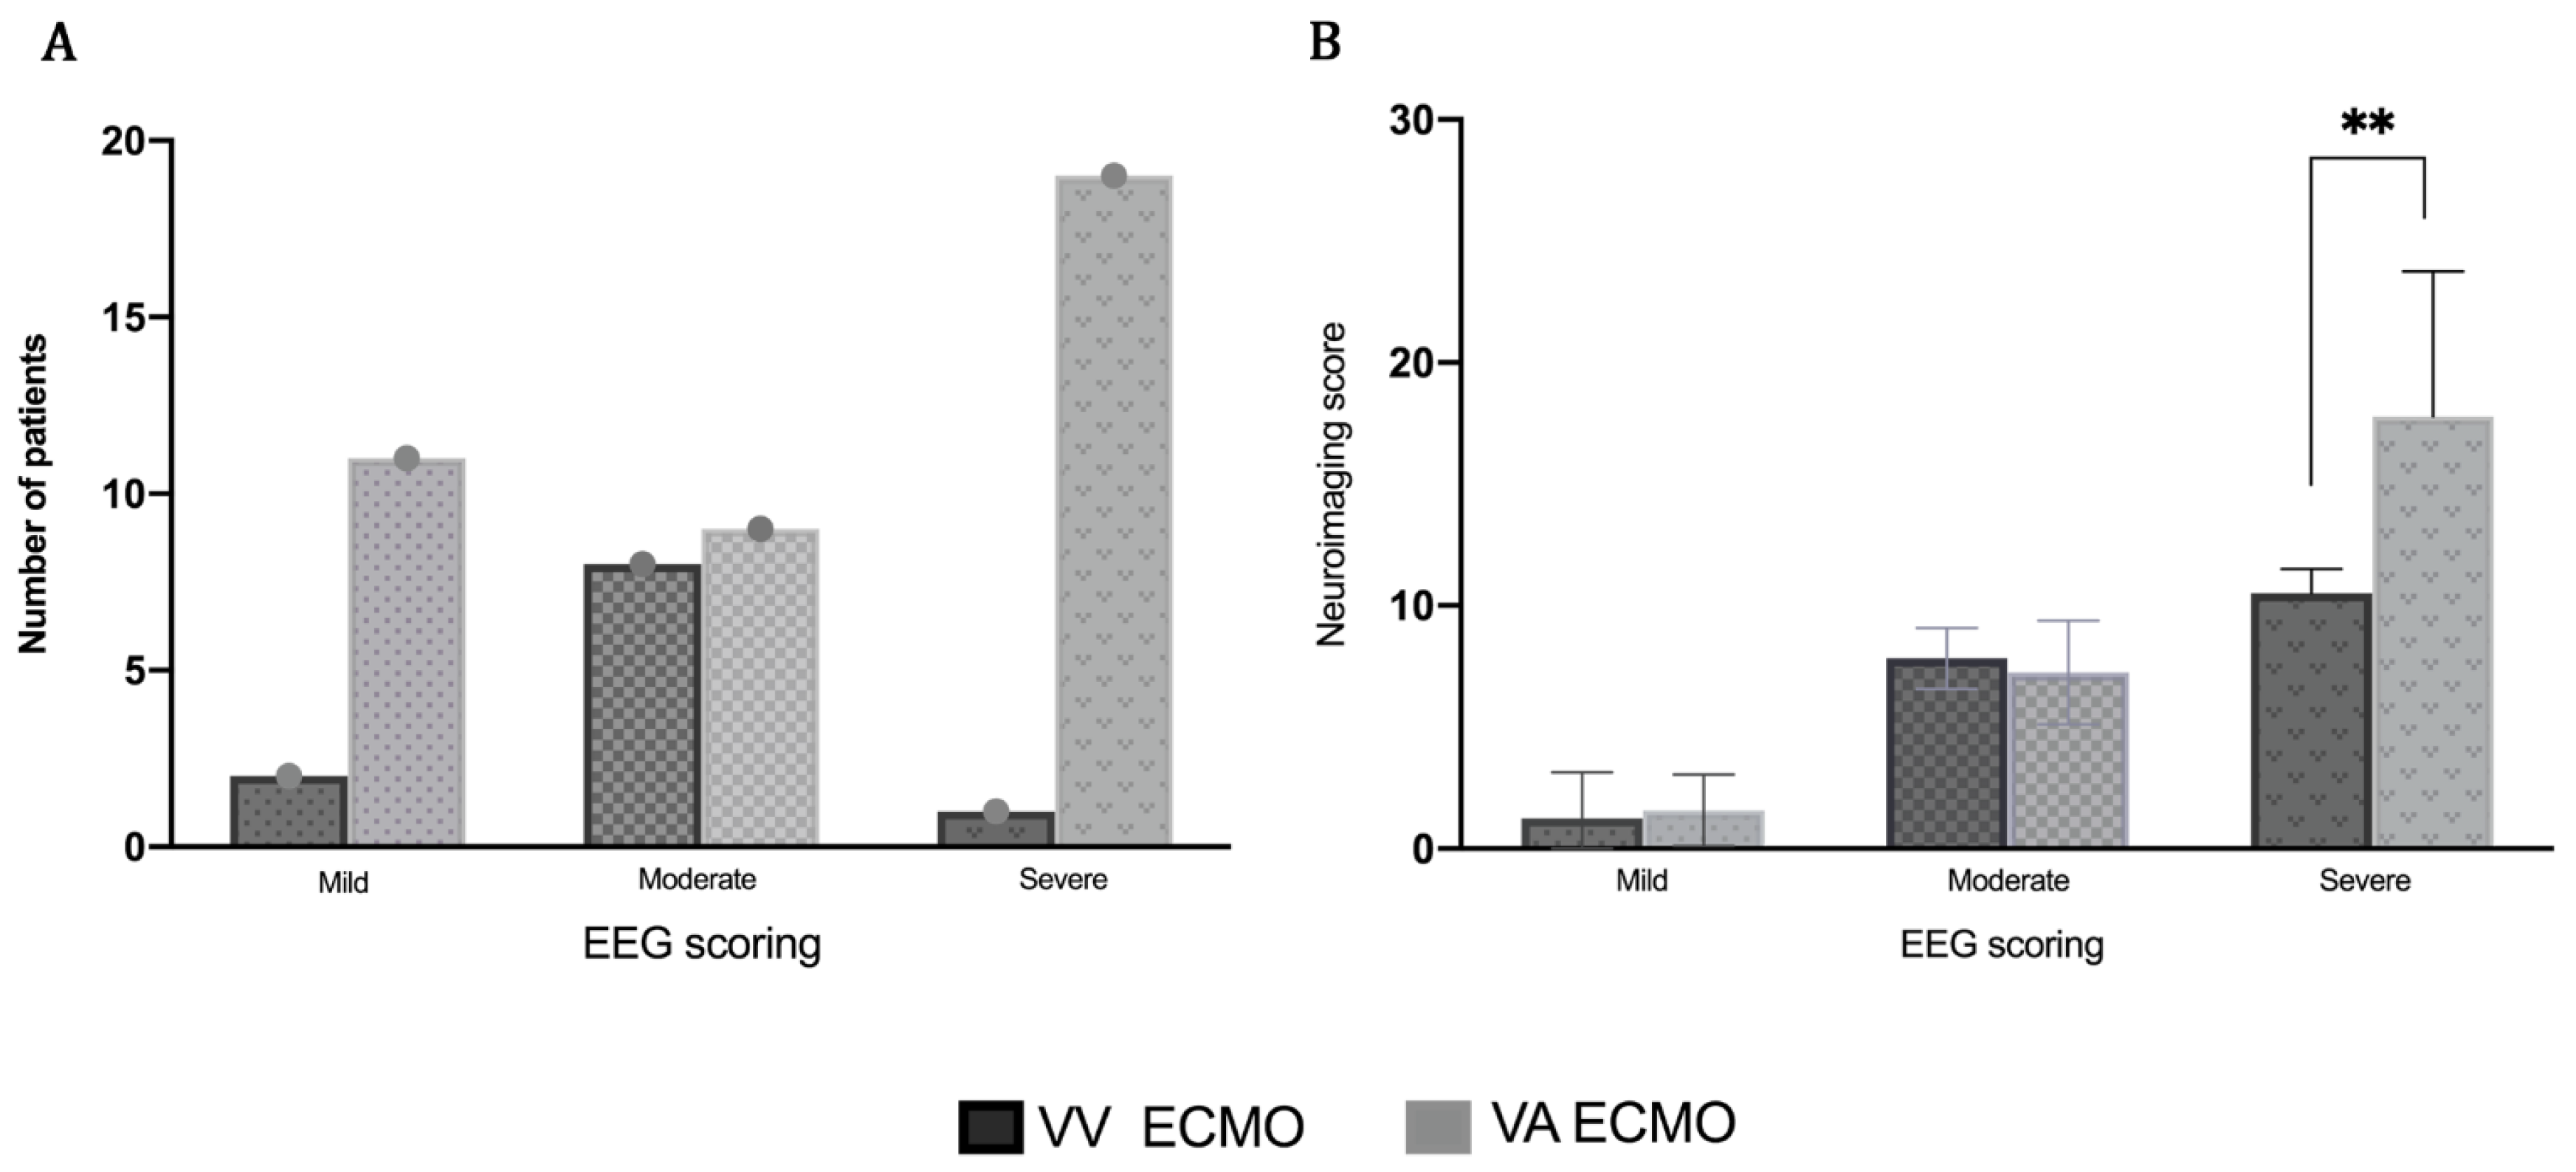
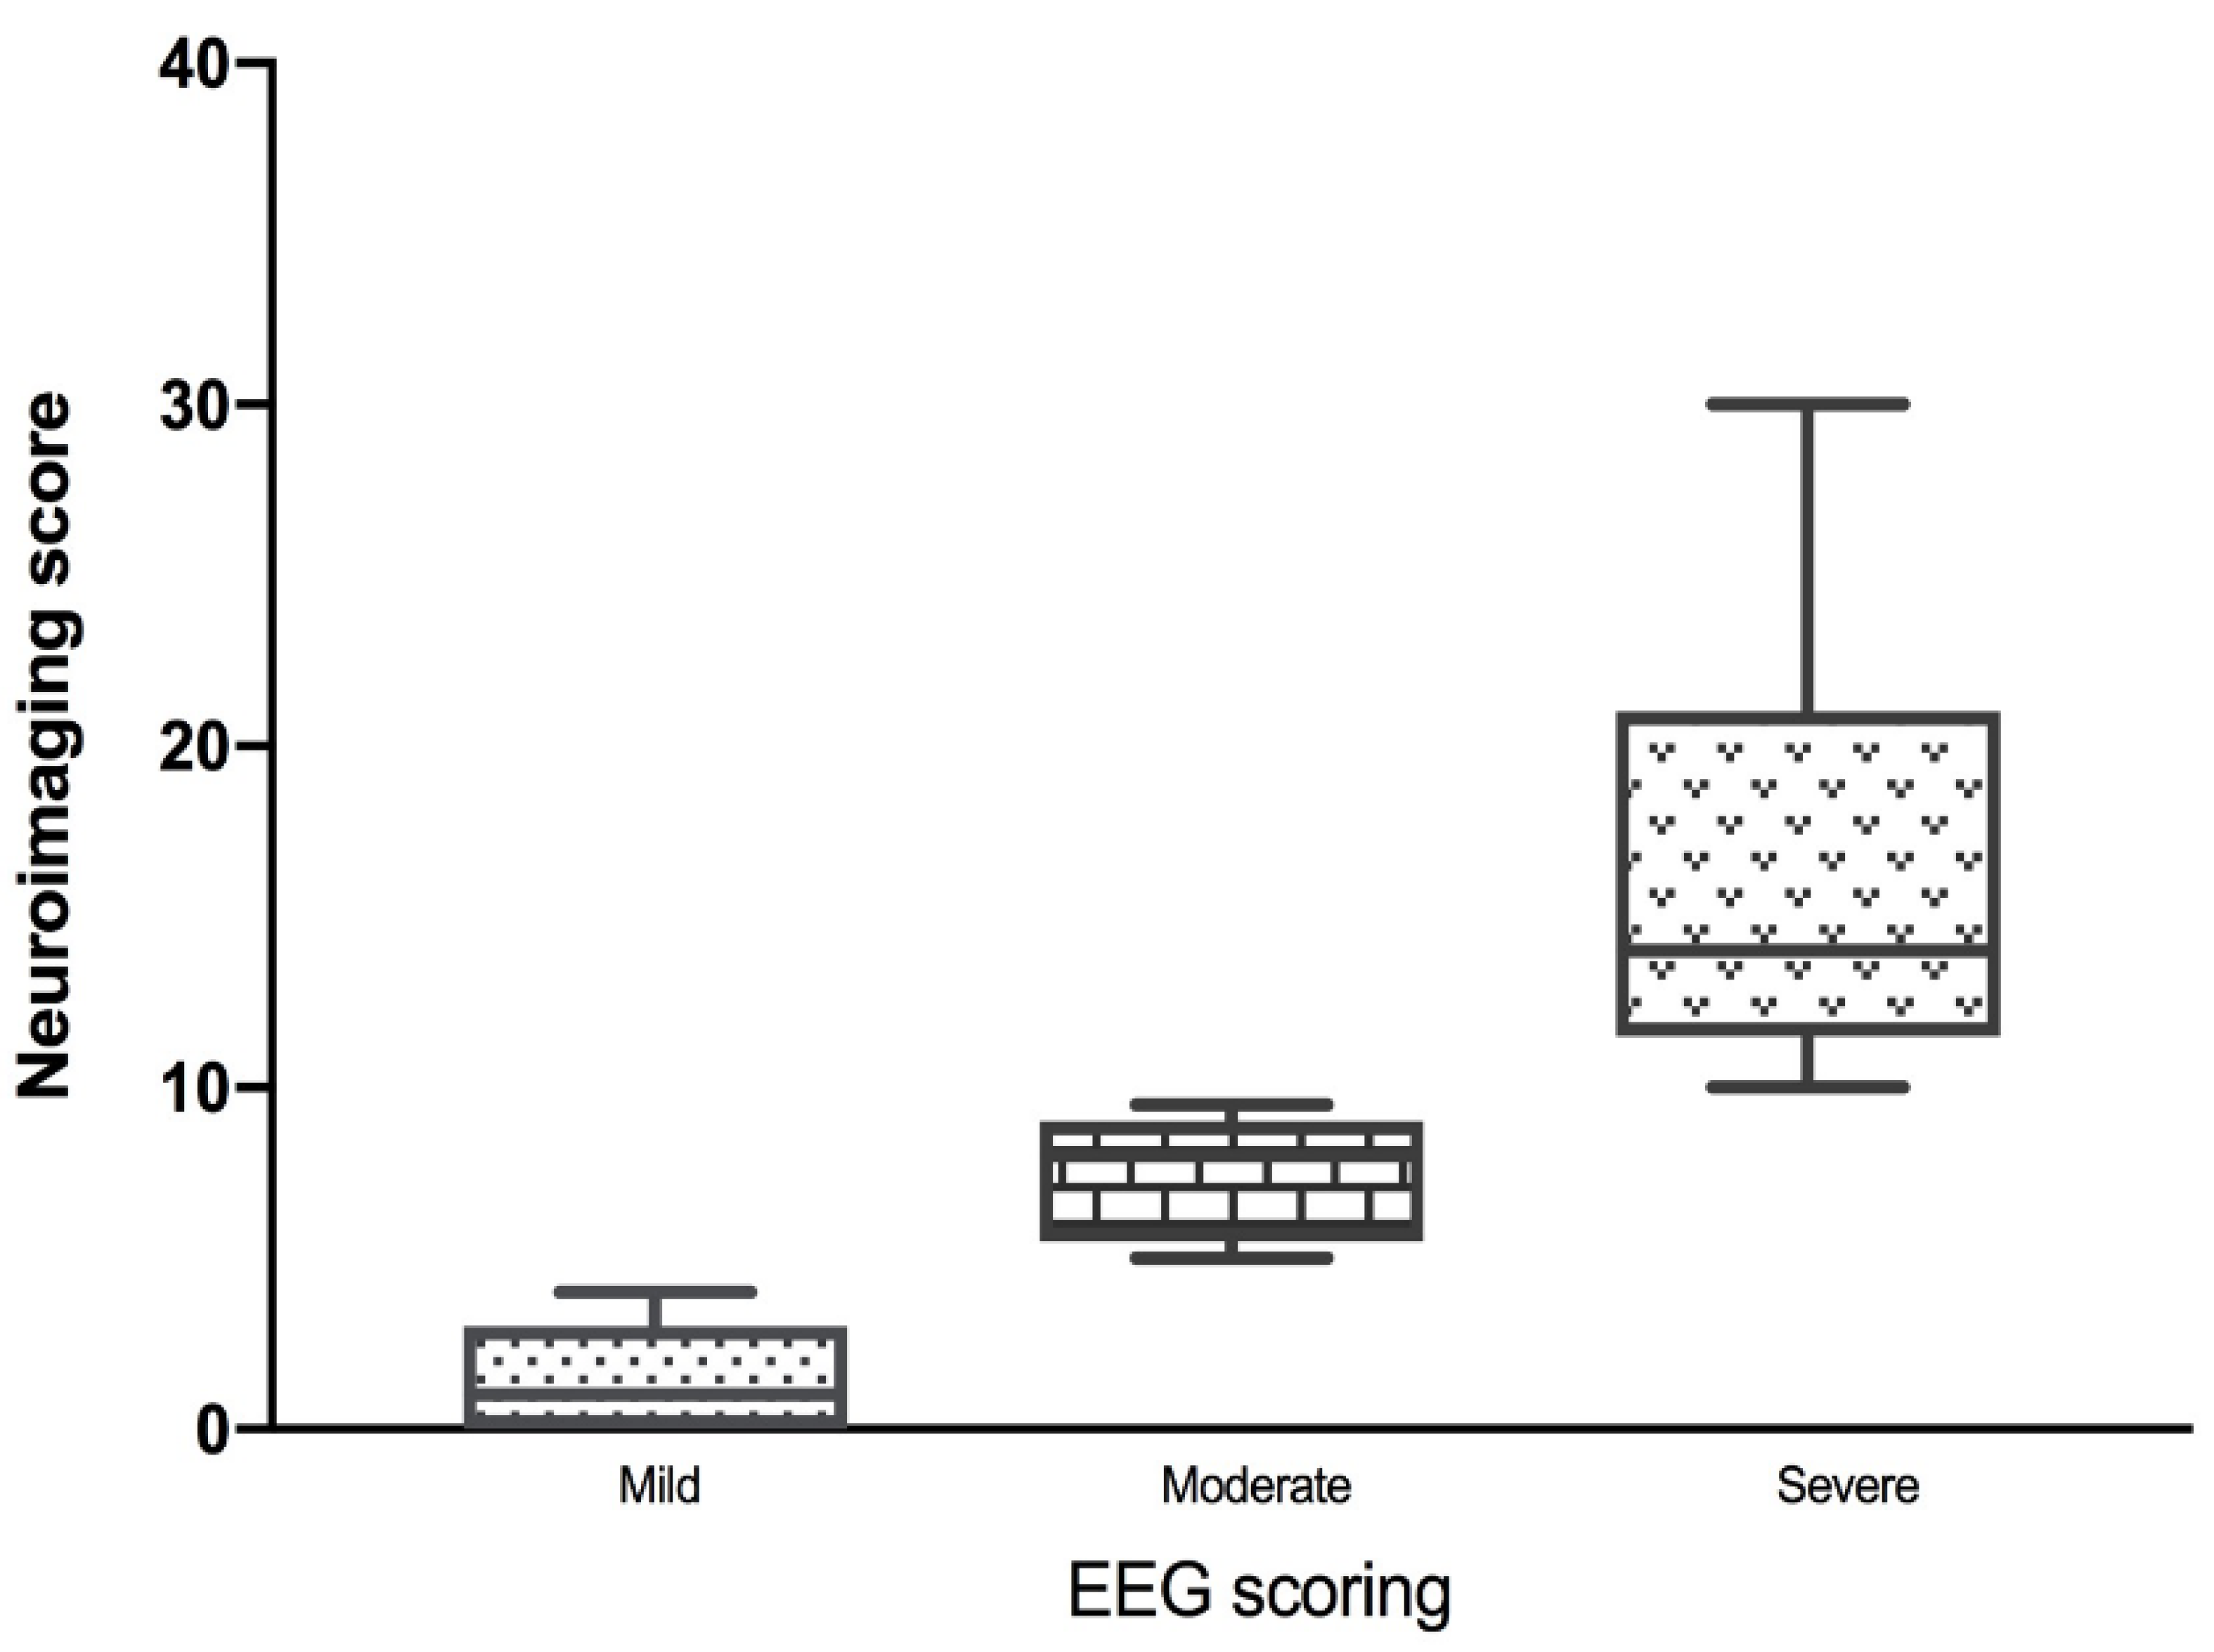
3.3. EEG and Neuroimaging Findings
3.4. Medications
3.5. Late Group
4. Discussion
Limitations
5. Conclusions
Author Contributions
Funding
Acknowledgments
Conflicts of Interest
References
- Jenks, C.L.; Raman, L.; Dalton, H.J. Pediatric Extracorporeal Membrane Oxygenation. Crit. Care Clin. 2017, 33, 825–841. [Google Scholar] [CrossRef] [PubMed]
- Abend, N.S.; Dlugos, D.J.; Clancy, R.R. A Review of Long-term EEG Monitoring in Critically Ill Children With Hypoxic–Ischemic Encephalopathy, Congenital Heart Disease, ECMO, and Stroke. J. Clin. Neurophysiol. 2013, 30, 134–142. [Google Scholar] [CrossRef] [PubMed] [Green Version]
- Jenks, C.L.; Hernandez, A.; Stavinoha, P.L.; Morris, M.C.; Tian, F.; Liu, H.; Garg, P.; Forbess, J.M.; Koch, J. Elevated cranial ultrasound resistive indices are associated with improved neurodevelopmental outcomes one year after pediatric cardiac surgery: A single center pilot study. Heart Lung 2017, 46, 251–257. [Google Scholar] [CrossRef] [PubMed]
- Polito, A.; Barrett, C.S.; Wypij, D.; Rycus, P.T.; Netto, R.; Cogo, P.; Thiagarajan, R.R. Neurologic complications in neonates supported with extracorporeal membrane oxygenation. An analysis of ELSO registry data. Intensive Care Med. 2013, 39, 1594–1601. [Google Scholar] [CrossRef]
- Van Heijst, A.; De Mol, A.C.; Ijsselstijn, H. ECMO in neonates: Neuroimaging findings and outcome. Semin. Perinatol. 2014, 38, 104–113. [Google Scholar] [CrossRef]
- Taylor, G.A.; Glass, P.; Fitz, C.R.; Miller, M.K. Neurologic status in infants treated with extracorporeal membrane oxygenation: Correlation of imaging findings with developmental outcome. Radiology 1987, 165, 679–682. [Google Scholar] [CrossRef]
- Bulas, D.I.; Glass, P. Neonatal ECMO: Neuroimaging and neurodevelopmental outcome. Semin. Perinatol. 2005, 29, 58–65. [Google Scholar] [CrossRef]
- Lin, N.; Flibotte, J.; Licht, D.J. Neuromonitoring in the neonatal ECMO patient. Semin. Perinatol. 2018, 42, 111–121. [Google Scholar] [CrossRef]
- Elkhunovich, M.; Sirody, J.; McCormick, T.; Goodarzian, F.; Claudius, I. The Utility of Cranial Ultrasound for Detection of Intracranial Hemorrhage in Infants. Pediatric Emerg. Care 2018, 34, 96–101. [Google Scholar] [CrossRef]
- Lin, J.-J.; Banwell, B.L.; Berg, R.A.; Dlugos, D.J.; Ichord, R.N.; Kilbaugh, T.J.; Kirsch, R.E.; Kirschen, M.P.; Licht, D.J.; Massey, S.L.; et al. Electrographic Seizures in Children and Neonates Undergoing Extracorporeal Membrane Oxygenation. Pediatric Crit. Care Med. 2017, 18, 249–257. [Google Scholar] [CrossRef] [Green Version]
- Campbell, L.R.; Bunyapen, C.; Gangarosa, M.E.; Cohen, M.; Kanto, W.P. Significance of seizures associated with extracorporeal membrane oxygenation. J. Pediatric 1991, 119, 789–792. [Google Scholar] [CrossRef]
- Boyle, K.; Felling, R.; Yiu, A.; Battarjee, W.; Schwartz, J.M.; Salorio, C.; Bembea, M.M. Neurologic Outcomes After Extracorporeal Membrane Oxygenation. Pediatric Crit. Care Med. 2018, 19, 760–766. [Google Scholar] [CrossRef] [PubMed]
- Hahn, J.S.; Vaucher, Y.; Bejar, R.; Coen, R.W. Electroencephalographic and Neuroimaging Findings in Neonates Undergoing Extracorporeal Membrane Oxygenation. Neuropediatrics 1993, 24, 19–24. [Google Scholar] [CrossRef] [PubMed]
- Hirsch, L.J.; Laroche, S.M.; Gaspard, N.; Gérard, E.; Svoronos, A.; Herman, S.; Mani, R.; Arif, H.; Jetté, N.; Minazad, Y.; et al. American Clinical Neurophysiology Society’s Standardized Critical Care EEG Terminology. J. Clin. Neurophysiol. 2013, 30, 1–27. [Google Scholar] [CrossRef] [PubMed] [Green Version]
- Tharp, B.R.; Laboyrie, P.M. The incidence of EEG abnormalities and outcome of infants paralyzed with neuromuscular blocking agents. Crit. Care Med. 1983, 11, 926–929. [Google Scholar] [CrossRef] [PubMed]
- Okochi, S.; Shakoor, A.; Barton, S.; Zenilman, A.R.; Street, C.; Streltsova, S.; Cheung, E.W.; Middlesworth, W.; Bain, J.M. Prevalence of Seizures in Pediatric Extracorporeal Membrane Oxygenation Patients as Measured by Continuous Electroencephalography. Pediatric Crit. Care Med. 2018, 19, 1162–1167. [Google Scholar] [CrossRef]
- Cook, R.J.; Rau, S.M.; Lester-Pelham, S.G.; Vesper, T.; Peterson, Y.; Adamowski, T.; Sturza, J.; Silverstein, F.S.; Shellhaas, R.A. Electrographic Seizures and Brain Injury in Children Requiring Extracorporeal Membrane Oxygenation. Pediatric Neurol. 2020, 108, 77–85. [Google Scholar] [CrossRef]
- Gannon, C.M.; Kornhauser, M.S.; Gross, G.W.; Wiswell, T.E.; Baumgart, S.; Streletz, L.J.; Graziani, L.J.; Spitzer, A.R. When combined, early bedside head ultrasound and electroencephalography predict abnormal computerized tomography or magnetic resonance brain images obtained after extracorporeal membrane oxygenation treatment. J. Perinatol. 2001, 21, 451–455. [Google Scholar] [CrossRef] [Green Version]
- Bembea, M.M.; Felling, R.J.; Anton, B.; Salorio, C.F.; Johnston, M.V. Neuromonitoring During Extracorporeal Membrane Oxygenation. Pediatric Crit. Care Med. 2015, 16, 558–564. [Google Scholar] [CrossRef]
- Lorusso, R.; Barili, F.; Di Mauro, M.; Gelsomino, S.; Parise, O.; Rycus, P.T.; Maessen, J.; Mueller, T.; Muellenbach, R.; Bělohlávek, J.; et al. In-Hospital Neurologic Complications in Adult Patients Undergoing Venoarterial Extracorporeal Membrane Oxygenation. Results from the Extracorporeal Life Support Organization Registry. Crit. Care Med. 2016, 44, e964–e972. [Google Scholar] [CrossRef]
- Lorusso, R.; Gelsomino, S.; Parise, O.; Di Mauro, M.; Barili, F.; Geskes, G.; Vizzardi, E.; Rycus, P.T.; Muellenbach, R.; Mueller, T.; et al. Neurologic Injury in Adults Supported With Veno-Venous Extracorporeal Membrane Oxygenation for Respiratory Failure. Findings From the Extracorporeal Life Support Organization Database. Crit. Care Med. 2017, 45, 1389–1397. [Google Scholar] [CrossRef] [PubMed]
- Rollins, M.D.; Hubbard, A.; Zabrocki, L.; Barnhart, U.C.; Bratton, S.L. Extracorporeal membrane oxygenation cannulation trends for pediatric respiratory failure and central nervous system injury. J. Pediatric Surg. 2012, 47, 68–75. [Google Scholar] [CrossRef] [PubMed]
- Fukuda, S.; Aoyama, M.; Yamada, Y.; Saitoh, N.; Honjoh, T.; Hasegawa, T.; Futamura, M.; Katoh, J.; Niimi, N.; Tanaka, S.; et al. Comparison of venoarterial versus venovenous access in the cerebral circulation of newborns undergoing extracorporeal membrane oxygenation. Pediatric Surg. Int. 1999, 15, 78–84. [Google Scholar] [CrossRef] [PubMed]
- Piantino, J.A.; Wainwright, M.S.; Grimason, M.; Smith, C.M.; Hussain, E.; Byron, D.; Chin, A.; Backer, C.; Reynolds, M.; Goldstein, J. Nonconvulsive Seizures Are Common in Children Treated With Extracorporeal Cardiac Life Support. Pediatric Crit. Care Med. 2013, 14, 601–609. [Google Scholar] [CrossRef] [PubMed]
- Fuentes, A.; Deotto, A.; Desrocher, M.; DeVeber, G.; Westmacott, R. Determinants of cognitive outcomes of perinatal and childhood stroke: A review. Child Neuropsychol. 2014, 22, 1–38. [Google Scholar] [CrossRef]
- Kirton, A. Predicting developmental plasticity after perinatal stroke. Dev. Med. Child Neurol. 2013, 55, 681–682. [Google Scholar] [CrossRef] [Green Version]
- Van Ness, P.C. Pentobarbital and EEG Burst Suppression in Treatment of Status Epilepticus Refractory to Benzodiazepines and Phenytoin. Epilepsia 1990, 31, 61–67. [Google Scholar] [CrossRef]
- Bassin, S.L.; Bleck, T.P. Barbiturates for the treatment of intracranial hypertension after traumatic brain injury. Crit. Care 2008, 12, 185. [Google Scholar] [CrossRef] [Green Version]


| Normal | Mild EEG | Moderate EEG | Severe EEG |
|---|---|---|---|
| Inconsistent Interhemispheric Asymmetry Mild Focal Abnormalities Mild Disturbance in Background (Paucity of Theta, Excessive Sharp Transients) Mild Excessive Inter Hemispheric Asynchrony Mild Excessive Discontinuity Increase in Number of Frontal Sharp Waves | Excessive Discontinuity of Asynchrony Moderate Persistent Asymmetry of The Background Focal Sharp Waves, Spikes or Delta Activity in Addition to Other Abnormalities Dysmaturity Occasional Positive Rolandic Sharp Waves with Abnormal Background Excessive Diffuse Background Delta Activity with Excessive Discontinuity | Isoelectric Marked Increased Inter Burst Intervals Paroxysmal Background with Or Without Excessive Inter Hemispheric Asynchrony Low Voltage (<20 uV), Diffusely Slow Background Electrographic or Electroclinical Seizures Abundant Positive Rolandic Sharp Waves |
| Normal | Mild EEG | Moderate EEG | Severe EEG |
|---|---|---|---|
| Intermittent Generalized Slowing Continuous Reactive Generalized Slowing Mild/Intermittent Focal Slowing Mild/Intermittent Focal Asymmetry | Continuous Non-Reactive Generalized Slowing Interictal Epileptiform Discharges Lateralized Periodic Discharges Continuous Focal Asymmetry | Electrocerebral Inactivity Burst-Suppression Very Low Voltage Activity (<20 uV) Electrographic or Electroclinical Seizures (Including Status Epilepticus) |
| Patient Group, n (%) | Mild EEG, 13 (26%) | Moderate EEG, 17 (34%) | Severe EEG, 20 (40%) |
|---|---|---|---|
| Age Group, n (%) | |||
| Neonates (<44 weeks CGA) | 6 (46%) | 4 (24%) | 8 (40%) |
| Children | 7 (54%) | 13 (76%) | 12 (60%) |
| Gender, n (%) | |||
| Male | 9 (69%) | 12 (71%) | 8 (40%) |
| Female | 4 (31%) | 5 (29%) | 12 (60%) |
| Primary Diagnosis, n (%) | |||
| PPHN | 0 (0%) | 0 (0%) | 1 (5%) |
| Sepsis | 0 (0%) | 3 (17.6%) | 1 (5%) |
| ARDS | 3 (23%) | 5 (29.4%) | 1 (5%) |
| Cardiac | 2 (15.4%) | 1 (5.9%) | 6 (30%) |
| ECMO Type, n (%) | |||
| Veno-Arterial | 11 (85%) | 9 (53%) | 19 (95%) |
| Veno-Venous | 2 (15%) | 8 (47%) | 1 (5%) |
| Site of ECMO Cannulation n (%) | |||
| Neck | 11 (85%) | 12 (71%) | 16 (80%) |
| Femoral | 0 (0%) | 1 (6%) | 0 (0%) |
| Central | 2 (15%) | 4 (23%) | 4 (20%) |
| Duration of ECMO, h, mean +/− SD | 807.4 +/− 667.5 | 669.3 +/− 398.5 | 230 +/− 180.7 |
| Pediatric Risk of Mortality Score (PRISM), Mean +/− SD | 27.6 +/− 5.6 | 30.9 +/− 4.4 | 31.3 +/− 3.7 |
| Pediatric Logistic Organ Dysfunction Score (PELOD), mean +/− SD | 15.1 +/− 10.8 | 14.9 +/− 9.3 | 22.6 +/− 16.3 |
| Presence of ECMO CPR (eCPR), n (%) | 3 (21.4%) | 4 (28.6%) | 7 (50%) |
| Neuroimaging Severity Score, n (%) | |||
| Mild | 10 (77%) | 5 (29.5%) | 4 (20%) |
| Moderate | 3 (23%) | 5 (29.5%) | 1 (5%) |
| Severe | 0 (0%) | 7 (41%) | 15 (75%) |
| Survival, n (%) | 9 (69.2%) | 11 (64.7%) | 13 (65%) |
© 2020 by the authors. Licensee MDPI, Basel, Switzerland. This article is an open access article distributed under the terms and conditions of the Creative Commons Attribution (CC BY) license (http://creativecommons.org/licenses/by/4.0/).
Share and Cite
Fox, J.; Jenks, C.L.; Farhat, A.; Li, X.; Liu, Y.; James, E.; Karasick, S.; Morriss, M.C.; Sirsi, D.; Raman, L. EEG is A Predictor of Neuroimaging Abnormalities in Pediatric Extracorporeal Membrane Oxygenation. J. Clin. Med. 2020, 9, 2512. https://doi.org/10.3390/jcm9082512
Fox J, Jenks CL, Farhat A, Li X, Liu Y, James E, Karasick S, Morriss MC, Sirsi D, Raman L. EEG is A Predictor of Neuroimaging Abnormalities in Pediatric Extracorporeal Membrane Oxygenation. Journal of Clinical Medicine. 2020; 9(8):2512. https://doi.org/10.3390/jcm9082512
Chicago/Turabian StyleFox, Jordana, Christopher L. Jenks, Abdelaziz Farhat, Xilong Li, Yulun Liu, Ellen James, Stephanie Karasick, Michael C. Morriss, Deepa Sirsi, and Lakshmi Raman. 2020. "EEG is A Predictor of Neuroimaging Abnormalities in Pediatric Extracorporeal Membrane Oxygenation" Journal of Clinical Medicine 9, no. 8: 2512. https://doi.org/10.3390/jcm9082512