Incubation Period and Other Epidemiological Characteristics of 2019 Novel Coronavirus Infections with Right Truncation: A Statistical Analysis of Publicly Available Case Data

 ,
,  , , and
Abstract
:1. Introduction
2. Methods
2.1. Epidemiological Data
2.2. Statistical Model
3. Results
4. Discussion
Supplementary Materials
Author Contributions
Funding
Conflicts of Interest
References
- National Health Commission of the People’s Republic of China. Update on Pneumonia of New Coronavirus Infection as of 21:00 on January 31. Available online: http://www.nhc.gov.cn/xcs/yqtb/202002/84faf71e096446fdb1ae44939ba5c528.shtml (accessed on 1 February 2020).
- Li, Q.; Guan, X.; Wu, P.; Wang, X.; Zhou, L.; Tong, Y.; Ren, R.; Leung, K.S.M.; Lau, E.H.Y.; Wong, J.Y.; et al. Early transmission dynamics in Wuhan, China, of novel coronavirus-infected pneumonia. N. Engl. J. Med. 2020. [Google Scholar] [CrossRef] [PubMed]
- European Centre for Disease Prevention and Control data. Geographical Distribution of 2019-nCov Cases. Available online: https://www.ecdc.europa.eu/en/geographical-distribution-2019-ncov-cases (accessed on 24 January 2020).
- Nishiura, H.; Lee, H.W.; Cho, S.H.; Lee, W.G.; In, T.S.; Moon, S.U.; Chung, G.T.; Kim, T.S. Estimates of short- and long-term incubation periods of Plasmodium vivax malaria in the Republic of Korea. Trans. R. Soc. Trop. Med. Hyg. 2007, 101, 338–343. [Google Scholar] [CrossRef] [PubMed]
- Lessler, J.; Reich, N.G.; Cummings, D.A.; New York City Department of Health and Mental Hygiene Swine Influenza Investigation Team. Outbreak of 2009 pandemic influenza A (H1N1) at a New York City school. N. Engl. J. Med. 2009, 361, 2628–2636. [Google Scholar] [CrossRef] [PubMed] [Green Version]
- Nishiura, H. Determination of the appropriate quarantine period following smallpox exposure: An objective approach using the incubation period distribution. Int. J. Hyg. Environ. Health. 2009, 212, 97–104. [Google Scholar] [CrossRef] [PubMed]
- Nishiura, H.; Jung, S.; Linton, N.M.; Kinoshita, R.; Yang, Y.; Hayashi, K.; Kobayashi, T.; Yuan, B.; Akhmetzhanov, A.R. The extent of transmission of novel coronavirus in Wuhan, China, 2020. J. Clin. Med. 2020, 24, 9. [Google Scholar] [CrossRef] [PubMed] [Green Version]
- Huang, C.; Wang, Y.; Li, X.; Ren, L.; Zhao, J.; Hu, Y.; Zhang, L.; Fan, G.; Xu, J.; Gu, X. Clinical features of patients infected with 2019 novel coronavirus in Wuhan, China. Lancet 2020. [Google Scholar] [CrossRef] [Green Version]
- Donnelly, C.A.; Ghani, A.C.; Leung, G.M.; Hedley, A.J.; Fraser, C.; Riley, S.; Abu-Raddad, L.J.; Ho, L.M.; Thach, T.Q.; Chau, P. Epidemiological determinants of spread of causal agent of severe acute respiratory syndrome in Hong Kong. Lancet 2003, 361, 1761–1766. [Google Scholar] [CrossRef] [Green Version]
- Reich, N.G.; Lessler, J.; Cummings, D.A.T.; Brookmeyer, R. Estimating incubation period distributions with coarse data. Stat. Med. 2009, 28, 2769–2784. [Google Scholar] [CrossRef] [PubMed]
- Jung, S.; Akhmetzhanov, A.R.; Hayashi, K.; Linton, N.M.; Yang, Y.; Yuan, B.; Kobayashi, T.; Kinoshita, R.; Nishiura, H. Real time estimation of the risk of death from novel coronavirus (2019-nCoV) infection: Inference using exported cases. medrxiv 2020. [Google Scholar] [CrossRef]
- R Core Team. R: A Language and Environment for Statistical Computing. Available online: https://www.r-project.org (accessed on 24 January 2020).
- Bezanson, J.; Edelman, A.; Karpinski, S.; Shah, V.B. Julia: A fresh approach to numerical computing. SIAM Rev. 2017, 59, 65–98. [Google Scholar] [CrossRef] [Green Version]
- Stan Development Team. Stan Modeling Language Users Guide and Reference Manual, Version 2.22.0. Available online: http://mc-stan.org (accessed on 24 January 2020).
- Lessler, J.; Reich, N.G.; Brookmeyer, R.; Perl, T.M.; Nelson, K.E.; Cummings, D.A. Incubation periods of acute respiratory viral infections: A systematic review. Lancet Infect. Dis. 2009, 9, 291–300. [Google Scholar] [CrossRef]
- Virlogeux, V.; Park, M.; Wu, J.T.; Cowling, B. Association between severity of MERS-CoV infection and incubation period. Emerg. Infect. Dis. 2016, 22, 526–528. [Google Scholar] [CrossRef] [PubMed]
- Backer, J.A.; Klinkenberg, D.; Wallinga, J. The incubation period of 2019-nCoV infections among travellers from Wuhan, China. medRxiv 2020. [Google Scholar] [CrossRef]
- Fraser, C.; Donnelly, C.A.; Cauchemez, S.; Hanage, W.P.; Van Kerkhove, M.D.; Hollingsworth, T.D.; Griffin, J.; Baggaley, R.F.; Jenkins, H.E.; Lyons, E.J.; et al. WHO rapid pandemic assessment collaboration. Pandemic potential of a strain of influenza A (H1N1): Early findings. Science 2009, 324, 1557–1561. [Google Scholar] [CrossRef] [PubMed] [Green Version]
- Ghani, A.C.; Donnelly, C.A.; Cox, D.R.; Griffin, J.T.; Fraser, C.; Lam, T.H.; Ho, L.M.; Chan, W.S.; Anderson, R.M.; Hedley, A.J.; et al. Methods for estimating the case fatality ratio for a novel, emerging infectious disease. Am. J. Epidemiol. 2005, 162, 479–486. [Google Scholar] [CrossRef] [PubMed]


| Incubation Period Excluding WR (Days) | Incubation Period Including WR (Days) | Onset to Hospital Admission, Living (Days) | Onset to Hospital Admission, Deceased (Days) | Onset to Death (Days) | Hospital Admission to Death (Days) | |
|---|---|---|---|---|---|---|
| Number of cases | 52 cases | 158 cases | 155 cases | 34 cases | 34 cases | 39 cases |
| Lognormal | ||||||
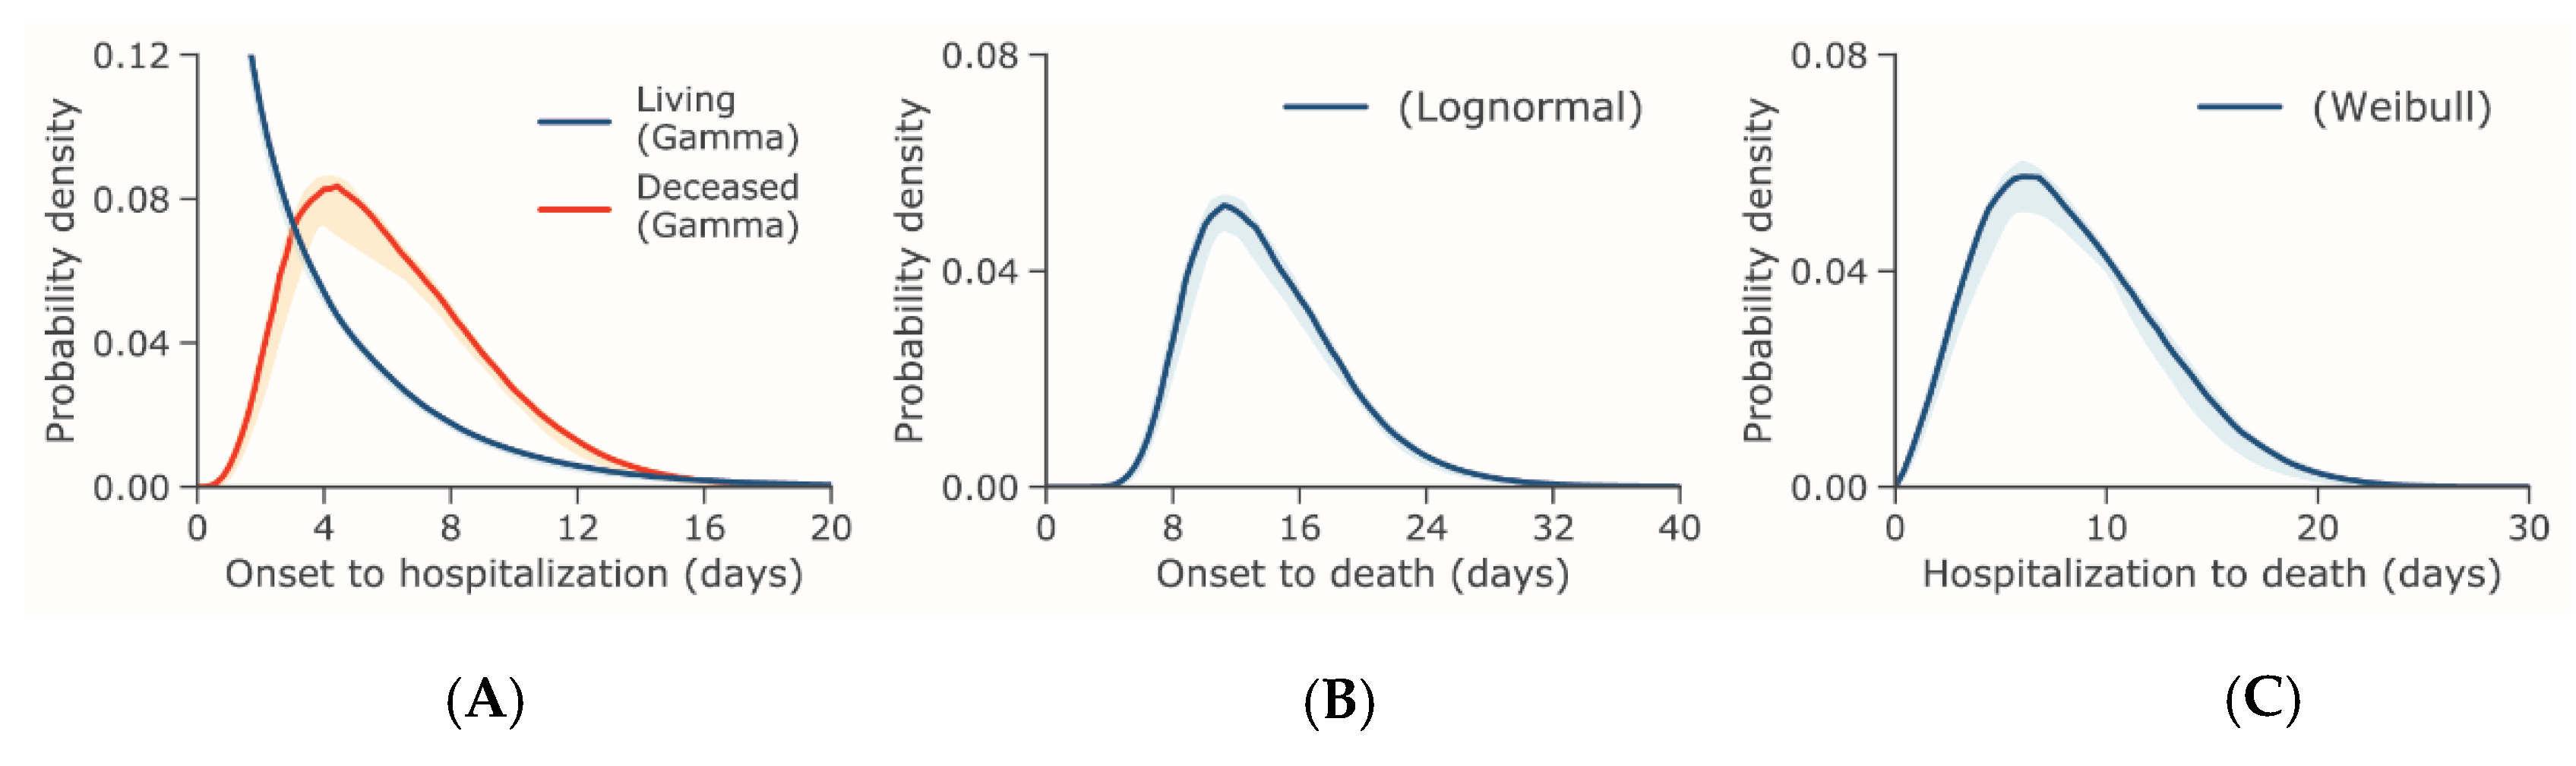
| Mean | 5.0 (4.2, 6.0) | 5.6 (5.0, 6.3) | 3.9 (2.9, 5.3) | 6.2 (5.0, 7.8) | 14.5 (12.5, 17.0) | 8.6 (6.8, 10.8) |
| SD | 3.0 (2.1, 4.5) | 2.8 (2.2, 3.6) | 9.1 (5.2, 16.3) | 4.3 (2.9, 6.6) | 6.7 (4.9, 9.4) | 6.7 (4.5, 10.3) |
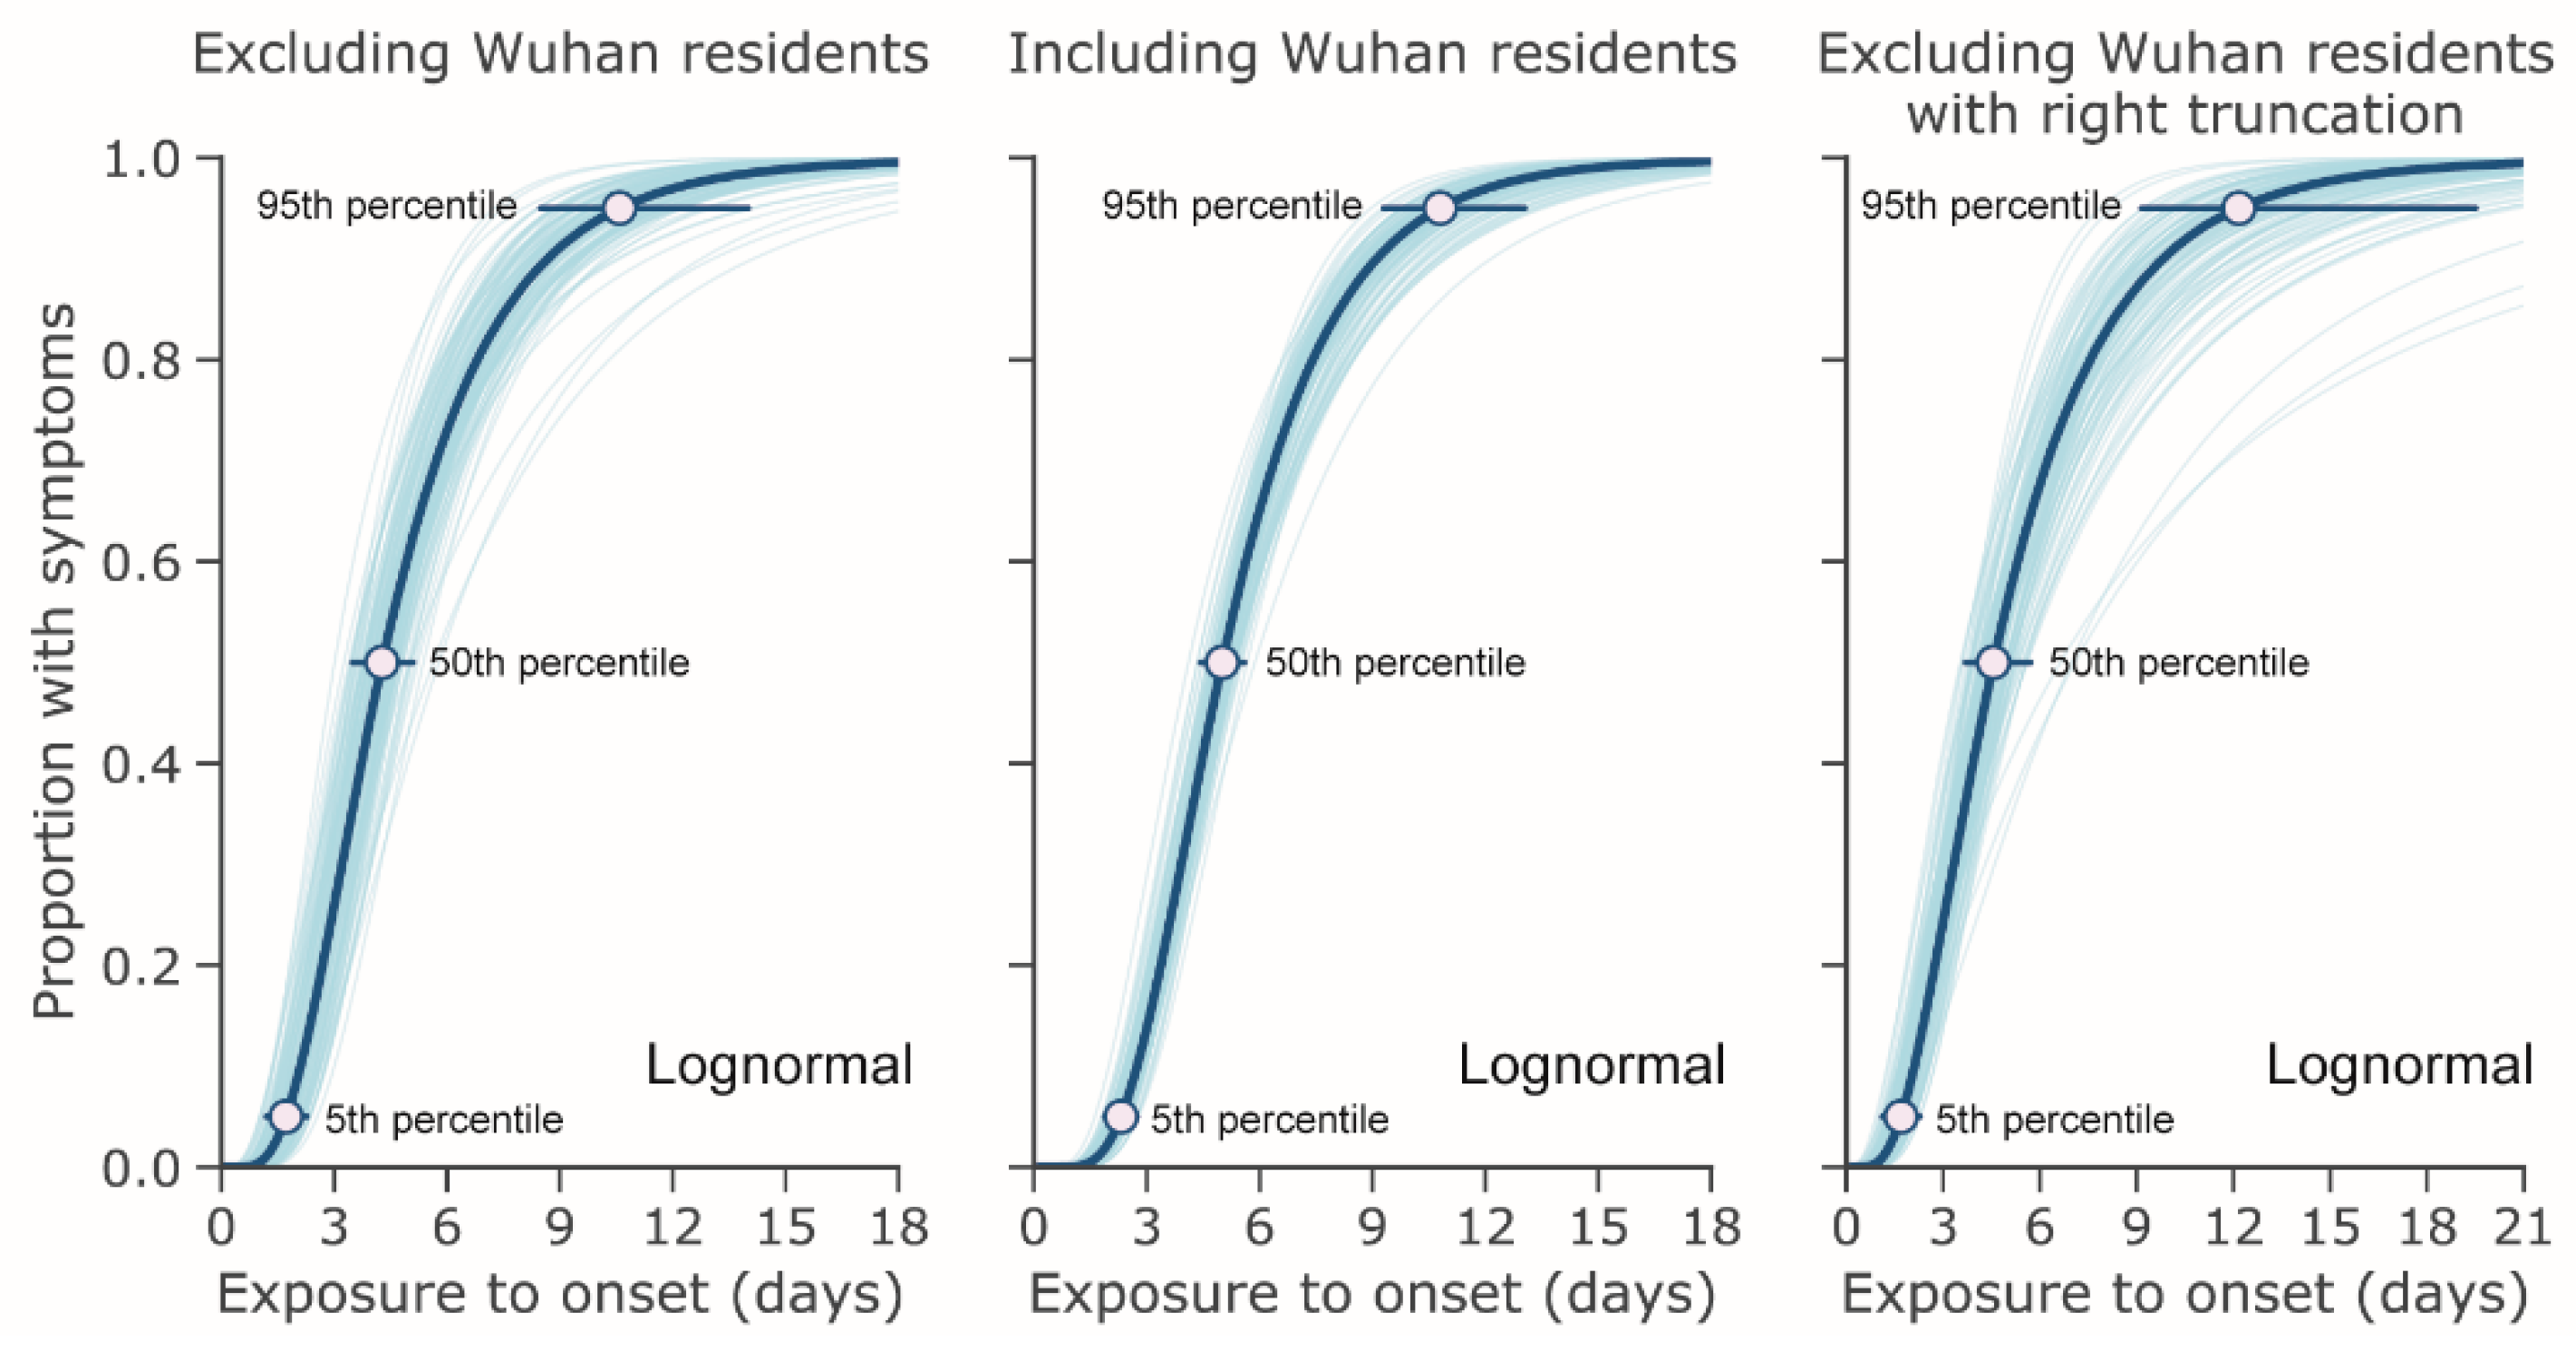
| 5% | 1.7 (1.2, 2.3) | 2.3 (1.9, 2.7) | 0.2 (0.1, 0.3) | 1.9 (1.2, 2.5) | 6.5 (4.9, 7.9) | 2.2 (1.5, 3.0) |
| Median | 4.3 (3.5, 5.1) | 5.0 (4.4, 5.6) | 1.5 (1.2, 1.9) | 5.1 (4.1, 6.3) | 13.2 (11.3, 15.3) | 6.7 (5.3, 8.3) |
| 95% | 10.6 (8.5, 14.1) | 10.8 (9.3, 12.9) | 14.0 (10.3, 20.1) | 13.9 (10.8, 19.6) | 26.8 (22.3, 34.5) | 20.5 (15.7, 28.7) |
| 99% | 15.4 (11.7, 22.5) | 14.9 (12.3, 18.7) | 35.0 (23.2, 56.9) | 21.1 (15.3, 32.8) | 36.0 (28.6, 49.8) | 32.6 (23.3, 50.1) |
| WAIC | 257.2 | 859.6 | 693.5 | 183.9 | 221.9 | 240.1 |
| Weight | 1.00 | 1.00 | 0.00 | 0.33 | 1.00 | 0.02 |
| Weibull | ||||||
| Mean | 5.4 (4.3, 6.6) | 5.8 (5.2, 6.5) | 3.4 (2.7, 4.2) | 6.5 (5.2, 8.0) | 15.1 (12.7, 17.8) | 8.9 (7.3, 10.4) |
| SD | 3.6 (2.8, 4.7) | 2.8 (2.3, 3.5) | 4.4 (3.3, 6.0) | 4.0 (3.1, 5.4) | 7.6 (6.1, 9.7) | 5.4 (4.2, 7.3) |
| 5% | 0.9 (0.5, 1.4) | 2.1 (1.5, 2.6) | 0.1 (0.0, 0.1) | 1.9 (1.2, 2.5) | 4.2 (2.5, 6.0) | 1.7 (0.9, 2.7) |
| Median | 4.7 (3.6, 5.8) | 5.3 (4.7, 6.0) | 1.8 (1.4, 2.3) | 5.1 (4.1, 6.3) | 14.3 (11.8, 17.1) | 8.0 (6.2, 9.8) |
| 95% | 12.0 (9.8, 15.6) | 11.0 (9.6, 12.9) | 11.7 (9.3, 15.6) | 13.9 (10.8, 19.6) | 28.6 (24.5, 34.9) | 18.8 (15.5, 24.4) |
| 99% | 15.9 (12.8, 21.5) | 14.2 (12.1, 17.0) | 20.3 (15.3, 29.2) | 21.1 (15.3, 32.8) | 35.0 (29.5, 44.4) | 24.2 (19.5, 33.0) |
| WAIC | 273.8 | 871.8 | 662.4 | 185.5 | 231.3 | 236.1 |
| Weight | 0.00 | 0.00 | 0.00 | 0.29 | 0.00 | 0.96 |
| Gamma | ||||||
| Mean | 5.3 (4.3, 6.6) | 6.0 (5.3, 6.7) | 3.3 (2.7, 4.0) | 6.5 (5.2, 8.0) | 15.0 (12.8, 17.5) | 8.8 (7.2, 10.8) |
| SD | 3.2 (2.4, 4.3) | 3.1 (2.7, 3.7) | 4.2 (3.3, 5.4) | 4.0 (2.9, 5.6) | 6.9 (5.2, 9.1) | 5.7 (4.3, 7.8) |
| 5% | 1.4 (0.7, 2.0) | 1.5 (1.1, 2.0) | 0.0 (0.0, 0.1) | 1.6 (0.8, 2.4) | 5.8 (3.9, 7.6) | 1.9 (1.0, 2.9) |
| Median | 4.7 (3.8, 5.7) | 5.6 (4.9, 6.4) | 1.7 (1.2, 2.2) | 5.6 (4.5, 6.9) | 13.9 (11.8, 17.1) | 7.6 (6.0, 9.3) |
| 95% | 11.3 (9.2, 14.5) | 11.7 (10.3, 13.4) | 11.6 (9.4, 14.7) | 13.8 (11.1, 18.6) | 27.4 (23.2, 34.1) | 19.9 (15.7, 25.7) |
| 99% | 15.2 (12.0, 20.2) | 14.5 (12.6, 16.9) | 19.4 (15.4, 25.1) | 18.6 (14.6, 26.2) | 34.9 (28.8, 44.8) | 26.8 (21.1, 36.5) |
| WAIC | 265.8 | 895.9 | 656.6 | 183.4 | 225.1 | 236.3 |
| Weight | 0.00 | 0.00 | 1.00 | 0.38 | 0.00 | 0.02 |
| Lognormal | Incubation Period Excluding WR (Days) | Onset to Hospital Admission, Living (Days) | Onset to Hospital Admission, Deceased (Days) | Onset to Death (Days) | Hospital Admission to Death (Days) |
|---|---|---|---|---|---|
| Mean | 5.6 (4.4, 7.4) | 9.7 (5.4, 17.0) | 6.6 (5.2, 8.8) | 20.2 (15.1, 29.5) | 13.0 (8.7, 20.9) |
| SD | 3.9 (2.4, 6.9) | 35.2 (12.9, 84.5) | 4.9 (3.0, 8.6) | 11.6 (6.6, 21.8) | 12.7 (6.4, 26.0) |
| 5% | 1.7 (1.1, 2.3) | 0.2 (0.1, 0.3) | 1.9 (1.2, 2.5) | 7.4 (5.6, 9.5) | 2.5 (1.6, 3.6) |
| Median | 4.6 (3.7, 5.7) | 2.6 (1.9, 3.8) | 5.3 (4.2, 6.8) | 17.1 (13.5, 24.1) | 9.1 (6.7, 13.7) |
| 95% | 12.3 (9.1, 19.8) | 35.1 (20.5, 65.0) | 15.0 (11.2, 23.8) | 39.9 (27.9, 69.6) | 33.1 (20.9, 56.7) |
| 99% | 18.6 (12.7, 34.2) | 102.8 (52.8, 218.4) | 23.2 (16.0, 41.6) | 56.7 (37.0, 109.2) | 56.7 (32.5, 125.2) |
© 2020 by the authors. Licensee MDPI, Basel, Switzerland. This article is an open access article distributed under the terms and conditions of the Creative Commons Attribution (CC BY) license (http://creativecommons.org/licenses/by/4.0/).
Share and Cite
Linton, N.M.; Kobayashi, T.; Yang, Y.; Hayashi, K.; Akhmetzhanov, A.R.; Jung, S.-m.; Yuan, B.; Kinoshita, R.; Nishiura, H. Incubation Period and Other Epidemiological Characteristics of 2019 Novel Coronavirus Infections with Right Truncation: A Statistical Analysis of Publicly Available Case Data. J. Clin. Med. 2020, 9, 538. https://doi.org/10.3390/jcm9020538
Linton NM, Kobayashi T, Yang Y, Hayashi K, Akhmetzhanov AR, Jung S-m, Yuan B, Kinoshita R, Nishiura H. Incubation Period and Other Epidemiological Characteristics of 2019 Novel Coronavirus Infections with Right Truncation: A Statistical Analysis of Publicly Available Case Data. Journal of Clinical Medicine. 2020; 9(2):538. https://doi.org/10.3390/jcm9020538
Chicago/Turabian StyleLinton, Natalie M., Tetsuro Kobayashi, Yichi Yang, Katsuma Hayashi, Andrei R. Akhmetzhanov, Sung-mok Jung, Baoyin Yuan, Ryo Kinoshita, and Hiroshi Nishiura. 2020. "Incubation Period and Other Epidemiological Characteristics of 2019 Novel Coronavirus Infections with Right Truncation: A Statistical Analysis of Publicly Available Case Data" Journal of Clinical Medicine 9, no. 2: 538. https://doi.org/10.3390/jcm9020538