
Measurement Properties of the Dutch Multifactor Fatigue Scale in Early and Late Rehabilitation of Acquired Brain Injury in Denmark

 ,
,
Abstract
:1. Introduction
2. Materials and Methods
2.1. Recruitment Procedures
2.2. Outcome Measures
2.3. Data Collection
2.4. Data Analysis
3. Results
3.1. Unidimensionality
3.1.1. Impact of Fatigue
3.1.2. Signs and Direct Consequences of Fatigue
3.1.3. Mental Fatigue
3.1.4. Physical Fatigue
3.1.5. Coping with Fatigue
3.2. Measurement Invariance across Rehabilitation Settings
3.2.1. Impact of Fatigue
3.2.2. Signs and Direct Consequences of Fatigue
3.2.3. Mental Fatigue
3.3. External Validity
4. Discussion
Limitations
5. Conclusions
Supplementary Materials
Author Contributions
Funding
Institutional Review Board Statement
Informed Consent Statement
Data Availability Statement
Acknowledgments
Conflicts of Interest
Appendix A
References
- Cumming, T.B.; Packer, M.; Kramer, S.F.; English, C. The Prevalence of Fatigue after Stroke: A Systematic Review and Meta-Analysis. Int. J. Stroke 2016, 11, 968–977. [Google Scholar] [CrossRef]
- Duncan, F.H.; Wu, S.; Mead, G.E. Frequency and Natural History of Fatigue after Stroke: A Systematic Review of Longitudinal Studies. J. Psychosom. Res. 2012, 73, 18–27. [Google Scholar] [CrossRef] [PubMed]
- Christensen, D.; Johnsen, S.P.; Watt, T.; Harder, I.; Kirkevold, M.; Andersen, G. Dimensions of Post-Stroke Fatigue: A Two-Year Follow-up Study. Cerebrovasc. Dis. 2008, 26, 134–141. [Google Scholar] [CrossRef] [PubMed]
- Andelic, N.; Røe, C.; Brunborg, C.; Zeldovich, M.; Løvstad, M.; Løke, D.; Borgen, I.M.; Voormolen, D.C.; Howe, E.I.; Forslund, M.V.; et al. Frequency of Fatigue and Its Changes in the First 6 Months after Traumatic Brain Injury: Results from the CENTER-TBI Study. J. Neurol. 2021, 268, 61–73. [Google Scholar] [CrossRef] [PubMed]
- Beaulieu-Bonneau, S.; Ouellet, M.C. Fatigue in the First Year after Traumatic Brain Injury: Course, Relationship with Injury Severity, and Correlates. Neuropsychol. Rehabil. 2017, 27, 983–1001. [Google Scholar] [CrossRef]
- Snaphaan, L.; van der Werf, S.; de Leeuw, F.-E. Time Course and Risk Factors of Post-Stroke Fatigue: A Prospective Cohort Study. Eur. J. Neurol. 2011, 18, 611–617. [Google Scholar] [CrossRef]
- Maaijwee, N.A.M.M.; Arntz, R.M.; Rutten-Jacobs, L.C.A.; Schaapsmeerders, P.; Schoonderwaldt, H.C.; van Dijk, E.J.; de Leeuw, F.-E. Post-Stroke Fatigue and Its Association with Poor Functional Outcome after Stroke in Young Adults. J. Neurol. Neurosurg. Psychiatry 2015, 86, 1120–1126. [Google Scholar] [CrossRef] [PubMed]
- Kjeverud, A.; Østlie, K.; Schanke, A.K.; Gay, C.; Thoresen, M.; Lerdal, A. Trajectories of Fatigue among Stroke Patients from the Acute Phase to 18 Months Post-Injury: A Latent Class Analysis. PLoS ONE 2020, 15, e0231709. [Google Scholar] [CrossRef] [PubMed] [Green Version]
- Andersen, G.; Christensen, D.; Kirkevold, M.; Johnsen, S.P. Post-Stroke Fatigue and Return to Work: A 2-Year Follow-Up. Acta Neurol. Scand. 2012, 125, 248–253. [Google Scholar] [CrossRef] [PubMed]
- Palm, S.; Rönnbäck, L.; Johansson, B. Long-Term Mental Fatigue after Traumatic Brain Injury and Impact on Employment Status. J. Rehabil. Med. 2017, 49, 228–233. [Google Scholar] [CrossRef] [PubMed] [Green Version]
- Van de Port, I.G.L.; Kwakkel, G.; Schepers, V.P.M.; Heinemans, C.T.I.; Lindeman, E. Is Fatigue an Independent Factor Associated with Activities of Daily Living, Instrumental Activities of Daily Living and Health-Related Quality of Life in Chronic Stroke? Cerebrovasc. Dis. 2007, 23, 40–45. [Google Scholar] [CrossRef] [PubMed]
- Kluger, B.M.; Krupp, L.B.; Enoka, R.M. Fatigue and Fatigability in Neurologic Illnesses: Proposal for a Unified Taxonomy. Neurology 2013, 80, 409–416. [Google Scholar] [CrossRef] [PubMed]
- Chaudhuri, A.; Behan, P.O. Fatigue in Neurological Disorders. Lancet 2004, 363, 978–988. [Google Scholar] [CrossRef]
- Aaronson, L.S.; Teel, C.S.; Cassmeyer, V.; Neuberger, G.B.; Pallikkathayil, L.; Pierce, J.; Press, A.N.; Williams, P.D.; Wingate, A. Defining and Measuring Fatigue. Image J. Nurs. Sch. 1999, 31, 45–50. [Google Scholar] [CrossRef] [PubMed]
- Kuppuswamy, A. The Fatigue Conundrum. Brain 2017, 140, 2240–2245. [Google Scholar] [CrossRef] [PubMed] [Green Version]
- Kutlubaev, M.A.; Duncan, F.H.; Mead, G.E. Biological Correlates of Post-Stroke Fatigue: A Systematic Review. Acta Neurol. Scand. 2012, 125, 219–227. [Google Scholar] [CrossRef] [PubMed]
- De Doncker, W.; Dantzer, R.; Ormstad, H.; Kuppuswamy, A. Mechanisms of Poststroke Fatigue. J. Neurol. Neurosurg. Psychiatry 2018, 89, 287–293. [Google Scholar] [CrossRef]
- Wu, S.; Mead, G.E.; Macleod, M.; Chalder, T. Model of Understanding Fatigue after Stroke. Stroke 2015, 46, 893–898. [Google Scholar] [CrossRef] [PubMed] [Green Version]
- Ormstad, H.; Eilertsen, G. A Biopsychosocial Model of Fatigue and Depression Following Stroke. Med. Hypotheses 2015, 85, 835–841. [Google Scholar] [CrossRef] [PubMed]
- Whitehead, L.C. The Measurement of Fatigue in Chronic Illness: A Systematic Review of Unidimensional and Multidimensional Fatigue Measures. J. Pain Symptom Manag. 2009, 37, 107–128. [Google Scholar] [CrossRef]
- Tyson, S.F.; Brown, P. How to Measure Fatigue in Neurological Conditions? A Systematic Review of Psychometric Properties and Clinical Utility of Measures Used so Far. Clin. Rehabil. 2014, 28, 804–816. [Google Scholar] [CrossRef]
- Mead, G.E.; Lynch, J.; Greig, C.; Young, A.; Lewis, S.; Sharpe, M. Evaluation of Fatigue Scales in Stroke Patients. Stroke 2007, 38, 2090–2095. [Google Scholar] [CrossRef] [PubMed] [Green Version]
- Hjollund, N.H.; Andersen, J.H.; Bech, P. Assessment of Fatigue in Chronic Disease: A Bibliographic Study of Fatigue Measurement Scales. Health Qual. Life Outcomes 2007, 5, 12. [Google Scholar] [CrossRef] [Green Version]
- Dittner, A.J.; Wessely, S.C.; Brown, R.G. The Assessment of Fatigue: A Practical Guide for Clinicians and Researchers. J. Psychosom. Res. 2004, 56, 157–170. [Google Scholar] [CrossRef] [PubMed]
- Dornonville de la Cour, F.L.; Norup, A.; Schow, T.; Andersen, T.E. Evaluation of Response Processes to the Danish Version of the Dutch Multifactor Fatigue Scale in Stroke Using the Three-Step Test-Interview. Front. Hum. Neurosci. 2021, 15, 642680. [Google Scholar] [CrossRef] [PubMed]
- Smets, E.M.A.; Garssen, B.; Bonke, B.; De Haes, J.C.J.M. The Multidimensional Fatigue Inventory (MFI) Psychometric Qualities of an Instrument to Assess Fatigue. J. Psychosom. Res. 1995, 39, 315–325. [Google Scholar] [CrossRef] [PubMed] [Green Version]
- Visser-Keizer, A.C.; Hogenkamp, A.; Westerhof-Evers, H.J.; Egberink, I.J.L.; Spikman, J.M. Dutch Multifactor Fatigue Scale: A New Scale to Measure the Different Aspects of Fatigue after Acquired Brain Injury. Arch. Phys. Med. Rehabil. 2015, 96, 1056–1063. [Google Scholar] [CrossRef] [PubMed]
- Skogestad, I.J.; Kirkevold, M.; Indredavik, B.; Gay, C.L.; Lerdal, A. Lack of Content Overlap and Essential Dimensions: A Review of Measures Used for Post-Stroke Fatigue. J. Psychosom. Res. 2019, 124, 109759. [Google Scholar] [CrossRef] [PubMed]
- World Medical Association. World Medical Association Declaration of Helsinki: Ethical Principles for Medical Research Involving Human Subjects. JAMA 2013, 310, 2191–2194. [Google Scholar] [CrossRef] [PubMed] [Green Version]
- Mundfrom, D.J.; Shaw, D.G.; Ke, T.L. Minimum Sample Size Recommendations for Conducting Factor Analyses. Int. J. Test. 2005, 5, 159–168. [Google Scholar] [CrossRef]
- Lovibond, P.F.; Lovibond, S.H. The Structure of Negative Emotional States: Comparison of the Depression Anxiety Stress Scales (DASS) with the Beck Depression and Anxiety Inventories. Behav. Res. Ther. 1995, 33, 335–343. [Google Scholar] [CrossRef] [PubMed]
- Antony, M.M.; Bieling, P.J.; Cox, B.J.; Enns, M.W.; Swinson, R.P. Psychometric Properties of the 42 Item and 21 Item Versions of the Depression Anxiety Stress Scales in Clinical Groups and a Community Sample. Psychol. Assess. 1998, 10, 176–181. [Google Scholar] [CrossRef]
- Janssen, M.F.; Pickard, A.S.; Golicki, D.; Gudex, C.; Niewada, M.; Scalone, L.; Swinburn, P.; Busschbach, J. Measurement Properties of the EQ-5D-5L Compared to the EQ-5D-3L across Eight Patient Groups: A Multi-Country Study. Qual. Life Res. 2013, 22, 1717–1727. [Google Scholar] [CrossRef] [Green Version]
- van Hout, B.; Janssen, M.F.; Feng, Y.S.; Kohlmann, T.; Busschbach, J.; Golicki, D.; Lloyd, A.; Scalone, L.; Kind, P.; Pickard, A.S. Interim Scoring for the EQ-5D-5L: Mapping the EQ-5D-5L to EQ-5D-3L Value Sets. Value Health 2012, 15, 708–715. [Google Scholar] [CrossRef] [Green Version]
- DeVellis, R.F. Scale Development: Theory and Applications, 4th ed.; SAGE: Los Angeles, CA, USA, 2017; ISBN 9781506341569. [Google Scholar]
- Brown, T.A. Confirmatory Factor Analysis for Applied Research, 2nd ed.; Methodology in the Social Sciences; Guilford Press: New York, NY, USA, 2015; ISBN 978-1-4625-1779-4. [Google Scholar]
- McDonald, R.P. Test Theory: A Unified Treatment; Lawrence Erlbaum: Mahwah, NJ, USA, 1999; ISBN 0-8058-3075-8. [Google Scholar]
- Green, S.B.; Yang, Y. Reliability of Summed Item Scores Using Structural Equation Modeling: An Alternative to Coefficient Alpha. Psychometrika 2009, 74, 155–167. [Google Scholar] [CrossRef]
- Svetina, D.; Rutkowski, L.; Rutkowski, D. Multiple-Group Invariance with Categorical Outcomes Using Updated Guidelines: An Illustration Using Mplus and the Lavaan/SemTools Packages. Struct. Equ. Model. 2020, 27, 111–130. [Google Scholar] [CrossRef]
- Wu, H.; Estabrook, R. Identification of Confirmatory Factor Analysis Models of Different Levels of Invariance for Ordered Categorical Outcomes. Psychometrika 2016, 81, 1014–1045. [Google Scholar] [CrossRef] [PubMed] [Green Version]
- Satorra, A.; Bentler, P.M. Ensuring Positiveness of the Scaled Chi-Square Test Statistic. Psychometrika 2010, 75, 243–248. [Google Scholar] [CrossRef] [Green Version]
- Chen, F.F. Sensitivity of Goodness of Fit Indexes to Lack of Measurement Invariance. Struct. Equ. Model. 2007, 14, 464–504. [Google Scholar] [CrossRef]
- Dimitrov, D.M. Testing for Factorial Invariance in the Context of Construct Validation. Meas. Eval. Couns. Dev. 2010, 43, 121–149. [Google Scholar] [CrossRef]
- Naess, H.; Waje-Andreassen, U.; Thomassen, L.; Nyland, H.; Myhr, K.-M. Health-Related Quality of Life among Young Adults with Ischemic Stroke on Long-Term Follow-Up. Stroke 2006, 37, 1232–1236. [Google Scholar] [CrossRef] [PubMed] [Green Version]
- Tang, W.K.; Lu, J.Y.; Chen, Y.K.; Mok, V.C.; Ungvari, G.S.; Wong, K.S. Is Fatigue Associated with Short-Term Health-Related Quality of Life in Stroke? Arch. Phys. Med. Rehabil. 2010, 91, 1511–1515. [Google Scholar] [CrossRef]
- R Core Team. R: A Language and Environment for Statistical Computing; R Foundation for Statistical Computing: Vienna, Austria, 2022. [Google Scholar]
- Revelle, W. psych: Procedures for Personality and Psychological Research; R Package Version 2.1.3; Northwestern University: Evanston, IL, USA, 2020. [Google Scholar]
- Rosseel, Y. lavaan: An R Package for Structural Equation Modeling. J. Stat. Softw. 2012, 48, 1–36. [Google Scholar] [CrossRef] [Green Version]
- Jorgensen, T.D.; Pornprasertmanit, S.; Schoemann, A.M.; Rosseel, Y. semTools: Useful Tools for Structural Equation Modeling; R Package Version 0.5–6; R Foundation for Statistical Computing: Vienna, Austria, 2021. [Google Scholar]
- Kelley, K. MBESS: The MBESS R Package; R Package Version: 4.8.0; R Foundation for Statistical Computing: Vienna, Austria, 2020. [Google Scholar]
- Gagnier, J.J.; Lai, J.; Mokkink, L.B.; Terwee, C.B. COSMIN Reporting Guideline for Studies on Measurement Properties of Patient-Reported Outcome Measures. Qual. Life Res. 2021, 30, 2197–2218. [Google Scholar] [CrossRef]
- Douven, E.; Köhler, S.; Schievink, S.H.J.; van Oostenbrugge, R.J.; Staals, J.; Verhey, F.R.J.; Aalten, P. Temporal Associations between Fatigue, Depression, and Apathy after Stroke: Results of the Cognition and Affect after Stroke, a Prospective Evaluation of Risks Study. Cerebrovasc. Dis. 2017, 44, 330–337. [Google Scholar] [CrossRef] [PubMed]
- Wu, S.; Barugh, A.; Macleod, M.; Mead, G.E. Psychological Associations of Poststroke Fatigue: A Systematic Review and Meta-Analysis. Stroke 2014, 45, 1778–1783. [Google Scholar] [CrossRef] [PubMed] [Green Version]
- Aarnes, R.; Stubberud, J.; Lerdal, A. A Literature Review of Factors Associated with Fatigue after Stroke and a Proposal for a Framework for Clinical Utility. Neuropsychol. Rehabil. 2020, 30, 1449–1476. [Google Scholar] [CrossRef]
- Dornonville de la Cour, F.L.; Forchhammer, B.H.; Mogensen, J.; Norup, A. On the Relation between Dimensions of Fatigue and Depression in Adolescents and Young Adults with Acquired Brain Injury. Neuropsychol. Rehabil. 2020, 30, 872–887. [Google Scholar] [CrossRef]
- Folkman, S.; Moskowitz, J.T. Coping: Pitfalls and Promise. Annu. Rev. Psychol. 2004, 55, 745–774. [Google Scholar] [CrossRef]
- Carver, C.S.; Scheier, M.F.; Weintraub, J.K. Assessing Coping Strategies: A Theoretically Based Approach. J. Pers. Soc. Psychol. 1989, 56, 257–283. [Google Scholar] [CrossRef] [PubMed]
- Billings, A.G.; Moos, R.H. The Role of Coping Responses and Social Resources in Attenuating the Stress of Life Events. J. Behav. Med. 1981, 4, 139–157. [Google Scholar] [CrossRef] [PubMed]
- Kyriazos, T.A. Applied Psychometrics: Sample Size and Sample Power Considerations in Factor Analysis (EFA, CFA) and SEM in General. Psychology 2018, 9, 2207–2230. [Google Scholar] [CrossRef] [Green Version]
- Bovaird, J.A.; Koziol, N.A. Measurement Models for Ordered-Categorical Indicators. In Handbook of Structural Equation Modeling; Hoyle, R.H., Ed.; Guilford Press: New York, NY, USA, 2014; pp. 495–511. ISBN 9781462516797. [Google Scholar]
- Kelley, K.; Pornprasertmanit, S. Confidence Intervals for Population Reliability Coefficients: Evaluation of Methods, Recommendations, and Software for Composite Measures. Psychol. Methods 2016, 21, 69–92. [Google Scholar] [CrossRef] [PubMed] [Green Version]


| Characteristic | Community-Based (n = 100) | Sub-Acute (n = 49) | Full Sample (N = 149) |
|---|---|---|---|
| Sex, n (%) | |||
| Female | 37 (37.0) | 19 (38.8) | 56 (37.6) |
| Male | 63 (63.0) | 30 (61.2) | 93 (62.4) |
| Age, M (SD) | 54.3 (10.7) | 66.7 (12.2) | 58.4 (12.6) |
| Education, M (SD) 1 | 15.0 (3.3) 2 | 14.4 (4.0) | 14.8 (3.6) 3 |
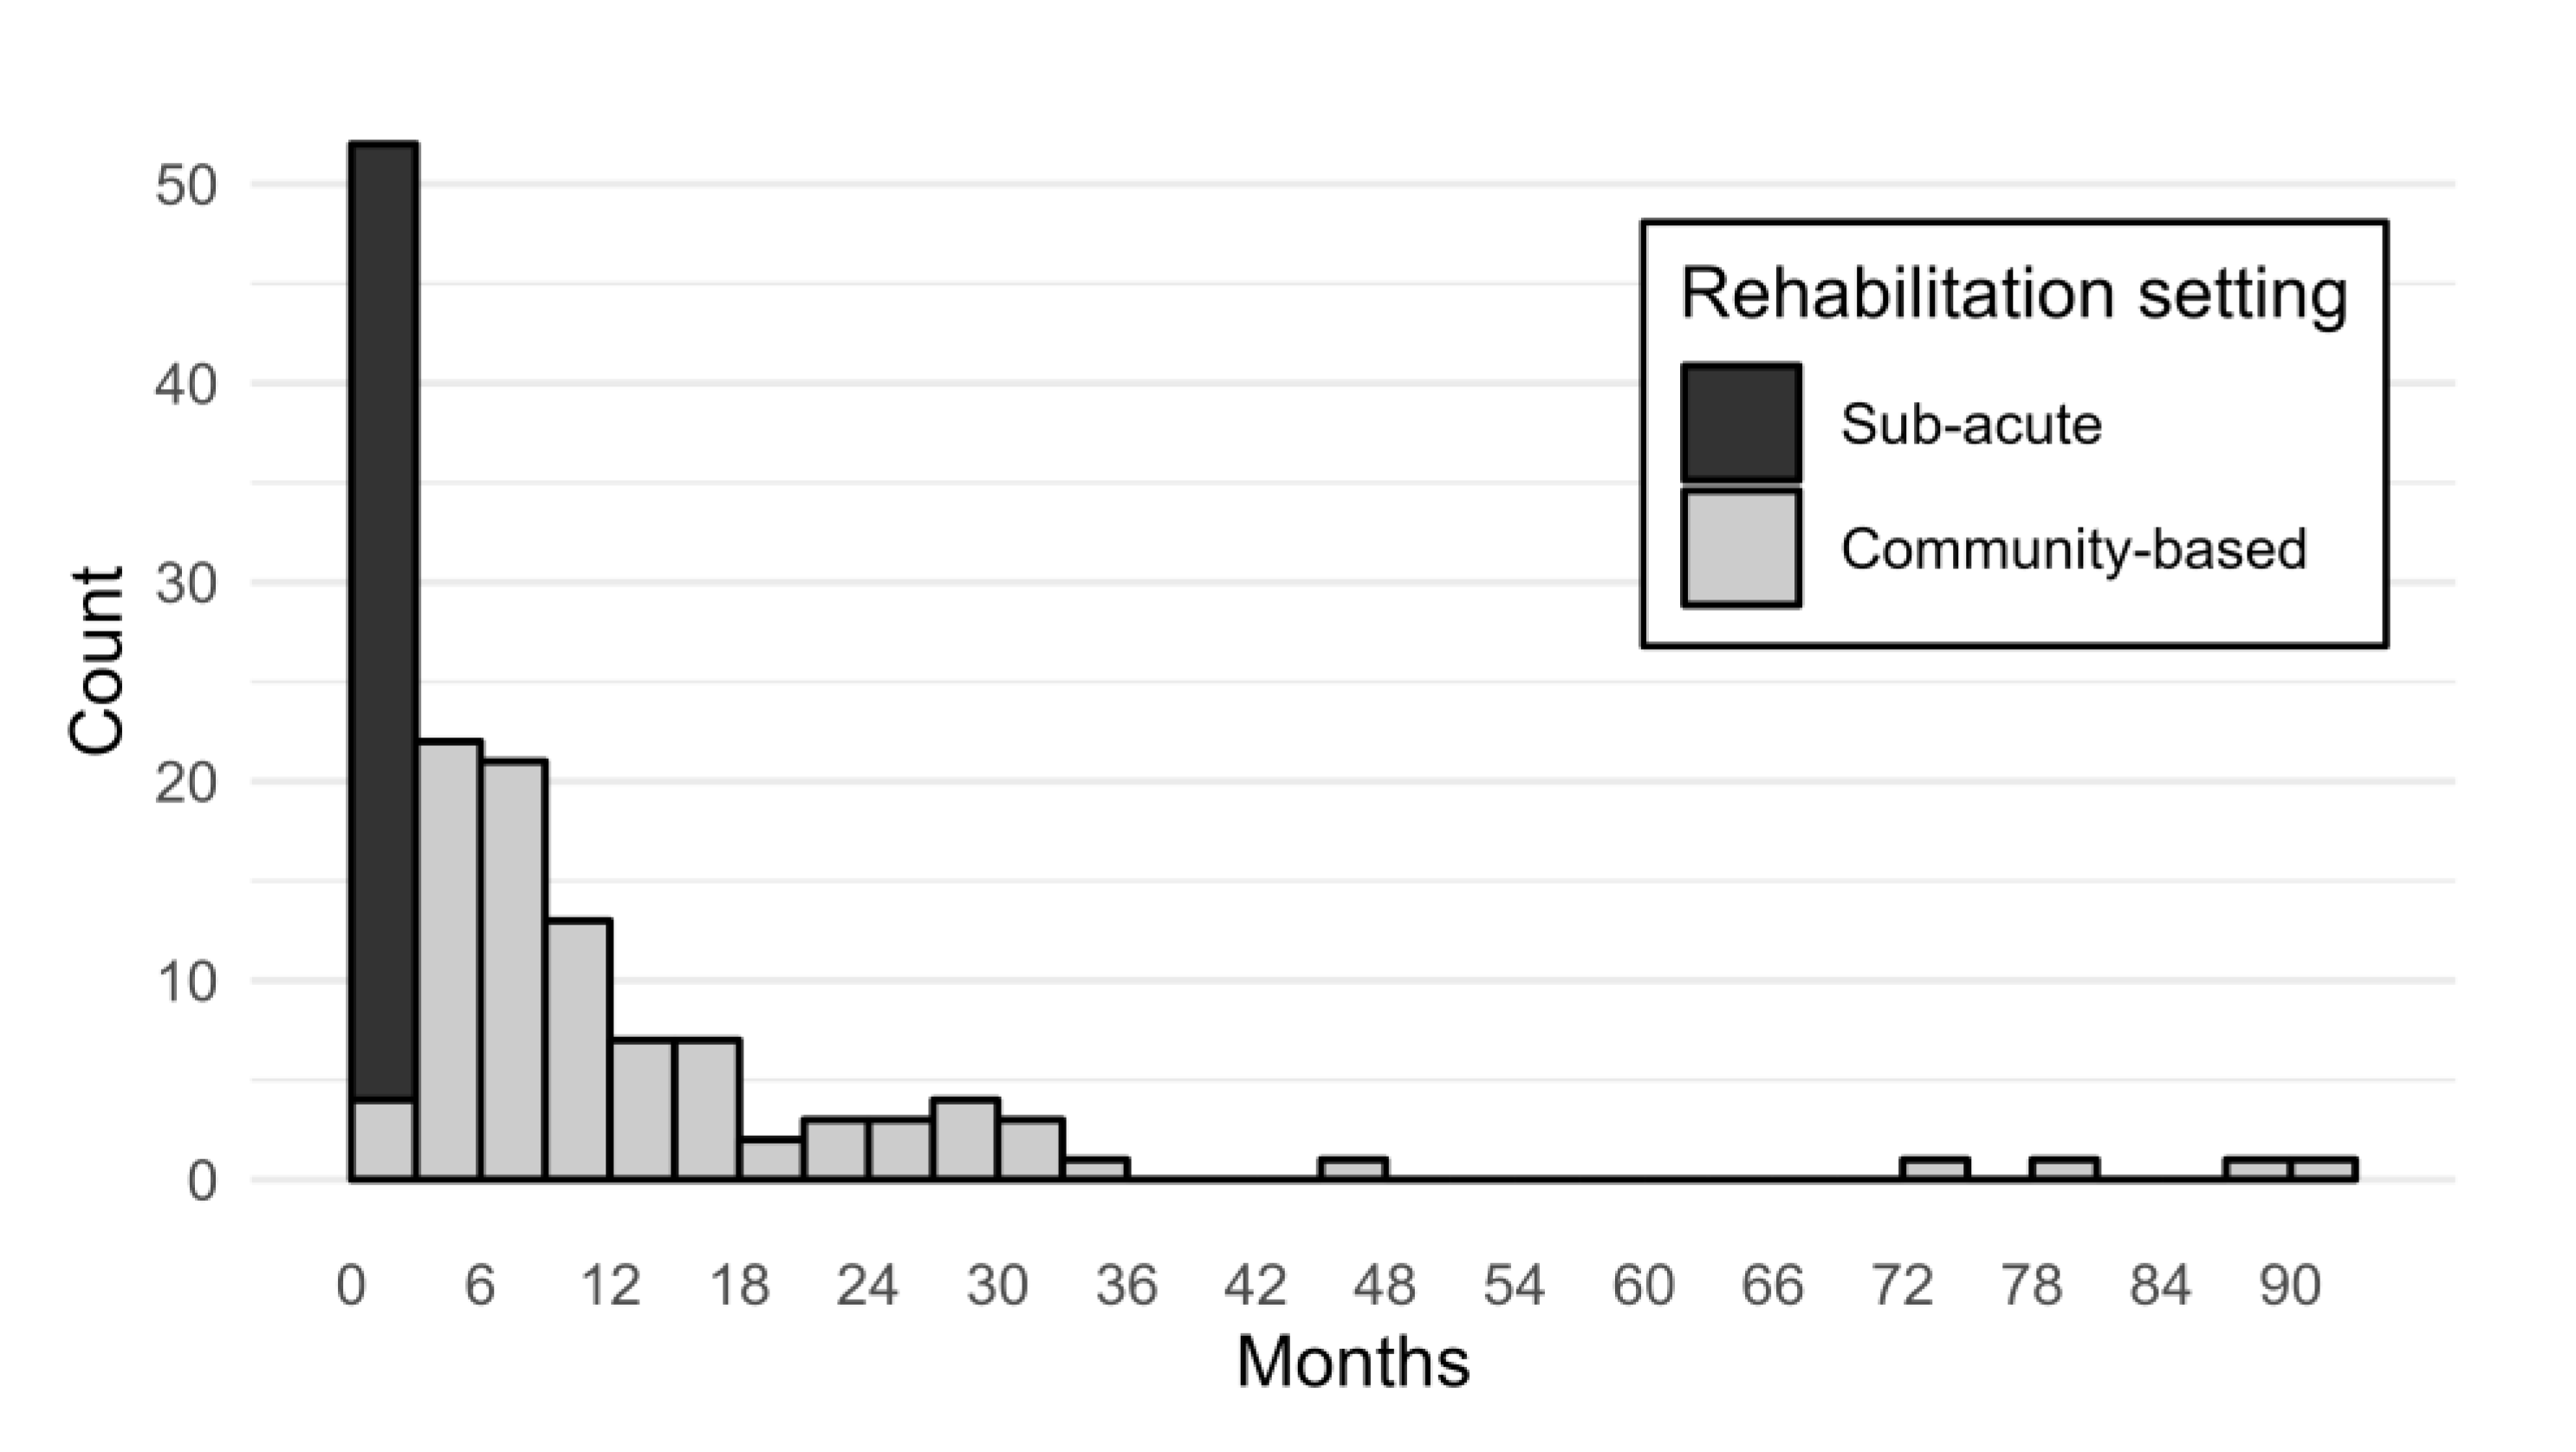
| Days since injury, M (SD) | 540.8 (801.3) 4 | 17.2 (10.5) 5 | 367.4 (669.4) 6 |
| Type of injury, n (%) | |||
| Stroke | 89 (89.0) | 49 (100.0) | 138 (92.6) |
| Traumatic brain injury | 5 (5.0) | 0 (0.0) | 5 (3.4) |
| Other 7 | 6 (6.0) | 0 (0.0) | 6 (4.0) |
| Type of stroke, n (%) | |||
| Ischemic | 59 (66.3) | 33 (67.3) | 92 (66.7) |
| Hemorrhagic | 26 (29.2) | 12 (24.5) | 38 (27.5) |
| Both | 3 (3.4) | 0 (0.0) | 3 (2.2) |
| Missing data | 1 (1.2) | 4 (8.2) | 5 (3.6) |
| Previous brain injury, n (%) | 16 (16.0) | 9 (18.4) | 25 (16.8) |
| Missing data | 4 (4.0) | 7 (14.3) | 11 (7.4) |
| Scale | Descriptive Statistics | Global Model Fit | Reliability | |||||||
|---|---|---|---|---|---|---|---|---|---|---|
| N | M (SD) | Range | χ2 (df) | p | CFI | TLI | RMSEA [90% CI] | ω [95% CI] | α | |
| IF | 147 | 38.7 (10.4) | 11–55 | 73.37 (44) | 0.004 | 0.981 | 0.977 | 0.068 [0.039, 0.094] | 0.90 [0.86, 0.92] | 0.88 |
| SC | 149 | 28.9 (7.6) | 9–45 | 51.01 (27) | 0.003 | 0.944 | 0.925 | 0.078 [0.044, 0.110] | 0.80 [0.71, 0.85] | 0.77 |
| MF | 148 | 25.2 (6.3) | 7–35 | 23.11 (14) | 0.058 | 0.985 | 0.978 | 0.067 [0.000, 0.113] | 0.83 [0.76, 0.87] | 0.81 |
| PF | 148 | 17.4 (5.4) | 6–30 | 40.64 (9) | <0.001 | 0.918 | 0.863 | 0.155 [0.108, 0.204] | 0.76 [0.65, 0.82] | 0.71 |
| CF | 148 | 15.3 (3.9) | 7–25 | 22.06 (5) | 0.001 | 0.806 | 0.613 | 0.152 [0.091, 0.220] | 0.46 [0.15, 0.61] | 0.46 |
| Scale | Equality Constraints | Invariance | Global Model Fit | Model Comparisons | Freed | |||||||
|---|---|---|---|---|---|---|---|---|---|---|---|---|
| χ2 (df) | p | CFI | TLI | RMSEA | ∆χ2 (∆df) | p | ∆CFI | ∆RMSEA | ||||
| IF | Form | - | - | - | - | - | - | |||||
| IF-10 | Form | Full | 91.74 (70) | 0.042 | 0.988 | 0.984 | 0.065 | |||||
| τ | Full | 116.57 (90) | 0.031 | 0.985 | 0.985 | 0.064 | 24.76 (20) | 0.211 | −0.003 | −0.001 | ||
| τ + λ | Full | 116.56 (99) | 0.110 | 0.990 | 0.991 | 0.049 | 5.82 (9) | 0.758 | 0.005 | −0.015 | ||
| SC | Form | Full | 81.53 (54) | 0.009 | 0.939 | 0.919 | 0.083 | |||||
| τ | Full | 101.37 (72) | 0.013 | 0.935 | 0.935 | 0.074 | 16.81 (18) | 0.537 | −0.004 | −0.009 | ||
| τ + λ | Rejected | 114.50 (80) | 0.007 | 0.924 | 0.931 | 0.077 | 12.04 (8) | 0.150 | −0.011 | 0.003 | ||
| Partial | 106.75 (79) | 0.021 | 0.939 | 0.944 | 0.069 | 7.52 (7) | 0.377 | 0.004 | −0.005 | λ7 | ||
| MF | Form | Full | 47.37 (28) | 0.013 | 0.972 | 0.957 | 0.097 | |||||
| τ | Full | 61.08 (42) | 0.029 | 0.972 | 0.972 | 0.079 | 10.64 (14) | 0.714 | 0.000 | −0.018 | ||
| τ + λ | Rejected | 71.52 (48) | 0.015 | 0.966 | 0.970 | 0.082 | 9.07 (6) | 0.170 | −0.006 | 0.003 | ||
| Partial | 61.08 (47) | 0.081 | 0.979 | 0.982 | 0.064 | 3.29 (5) | 0.655 | 0.005 | −0.015 | λ3 | ||
| Variable (Range) | n | M | SD | 1 | 2 | 3 | 4 | 5 | 6 | 7 | 8 | 9 |
|---|---|---|---|---|---|---|---|---|---|---|---|---|
| DMFS | ||||||||||||
| 1. IF (11–55) | 99 | 38.72 | 10.79 | – | ||||||||
| 2. SC (9–45) | 100 | 29.62 | 7.53 | 0.79 *** | – | |||||||
| 3. MF (7–35) | 100 | 25.52 | 6.19 | 0.81 *** | 0.77 *** | – | ||||||
| 4. PF (6–30) | 99 | 16.39 | 5.15 | 0.64 *** | 0.57 *** | 0.49 *** | – | |||||
| 5. CF (5–25) | 99 | 15.22 | 4.14 | 0.26 | 0.30 * | 0.22 | 0.24 | – | ||||
| DASS-21 | ||||||||||||
| 6. Depression (0–42) | 97 | 6.85 | 7.93 | 0.36 ** | 0.38 ** | 0.32 * | 0.37 ** | 0.09 | – | |||
| 7. Anxiety (0–42) | 97 | 4.91 | 7.20 | 0.29 * | 0.32 * | 0.28 | 0.35 ** | 0.09 | 0.55 *** | – | ||
| 8. Stress (0–42) | 98 | 11.20 | 9.91 | 0.47 *** | 0.62 *** | 0.52 *** | 0.42 *** | 0.32 * | 0.68 *** | 0.62 *** | – | |
| EQ-5D-5L | ||||||||||||
| 9. Index (−0.624–1.000) | 98 | 0.77 | 0.14 | −0.45 *** | −0.41 *** | −0.40 ** | −0.45 *** | −0.06 | −0.29 * | −0.19 | −0.31 * | – |
Disclaimer/Publisher’s Note: The statements, opinions and data contained in all publications are solely those of the individual author(s) and contributor(s) and not of MDPI and/or the editor(s). MDPI and/or the editor(s) disclaim responsibility for any injury to people or property resulting from any ideas, methods, instructions or products referred to in the content. |
© 2023 by the authors. Licensee MDPI, Basel, Switzerland. This article is an open access article distributed under the terms and conditions of the Creative Commons Attribution (CC BY) license (https://creativecommons.org/licenses/by/4.0/).
Share and Cite
Dornonville de la Cour, F.L.; Schow, T.; Andersen, T.E.; Petersen, A.H.; Zornhagen, G.; Visser-Keizer, A.C.; Norup, A. Measurement Properties of the Dutch Multifactor Fatigue Scale in Early and Late Rehabilitation of Acquired Brain Injury in Denmark. J. Clin. Med. 2023, 12, 2587. https://doi.org/10.3390/jcm12072587
Dornonville de la Cour FL, Schow T, Andersen TE, Petersen AH, Zornhagen G, Visser-Keizer AC, Norup A. Measurement Properties of the Dutch Multifactor Fatigue Scale in Early and Late Rehabilitation of Acquired Brain Injury in Denmark. Journal of Clinical Medicine. 2023; 12(7):2587. https://doi.org/10.3390/jcm12072587
Chicago/Turabian StyleDornonville de la Cour, Frederik Lehman, Trine Schow, Tonny Elmose Andersen, Annemarie Hilkjær Petersen, Gry Zornhagen, Annemarie C. Visser-Keizer, and Anne Norup. 2023. "Measurement Properties of the Dutch Multifactor Fatigue Scale in Early and Late Rehabilitation of Acquired Brain Injury in Denmark" Journal of Clinical Medicine 12, no. 7: 2587. https://doi.org/10.3390/jcm12072587