
It Is Always the Same—A Complication Classification following Angular Stable Plating of Proximal Humeral Fractures
 , ,
, ,
Abstract
:1. Introduction
2. Materials and Methods
2.1. Selection Criteria
- Polytraumatized;
- diagnosed stroke or dementia;
- open and pathologic fractures;
- primary nerve/vessel injuries;
- primary screw misalignment;
- primary unsuccessful surgical reduction (>5° head–shaft displacement, cranialization of the greater tuberosity of >5 mm and valgus head–shaft alignment >150° or <110° head shaft angle according to Schnetzke et al., 2016) [20].
2.2. Radiographic Assessment
2.3. Statistical Analysis
3. Results
3.1. Radiographic Evaluation
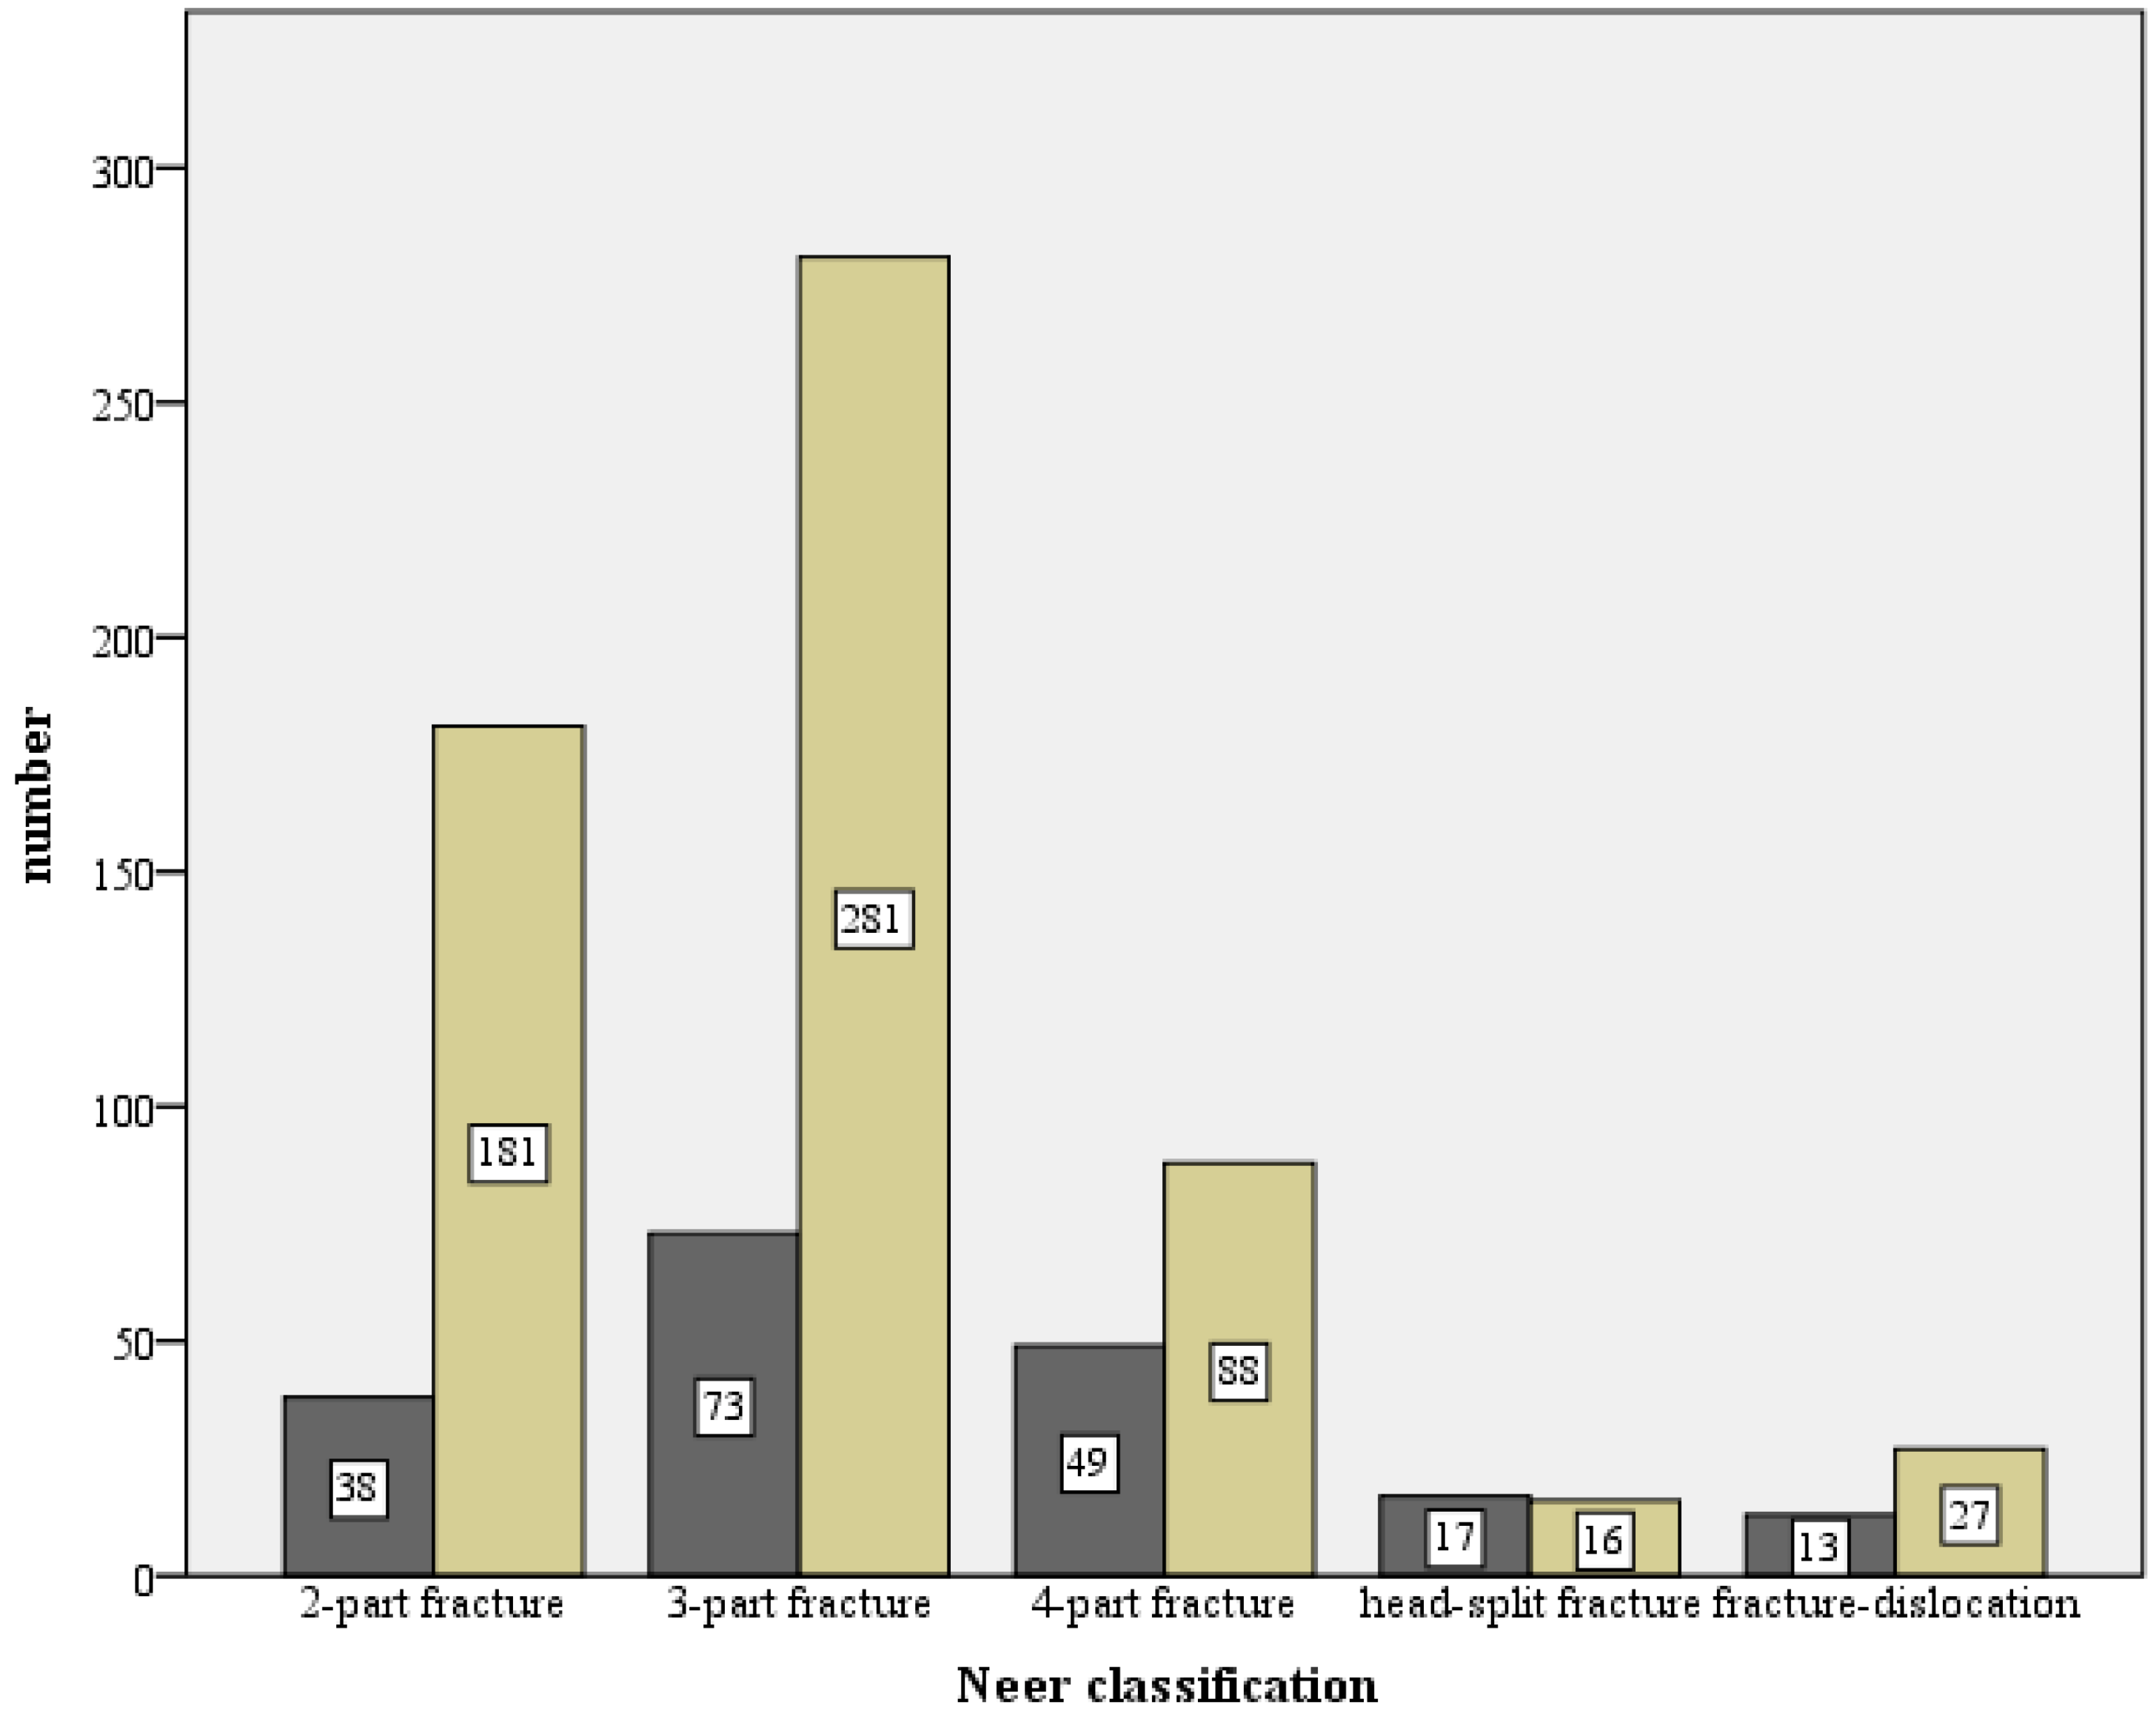
- 308 (29.6%) 2-part fractures;
- 471 (45.3%) 3-part fractures;
- 173 (16.6%) 4-part fractures;
- 36 (3.5%) head-split fractures;
- 52 (5.0%) dislocated fractures.

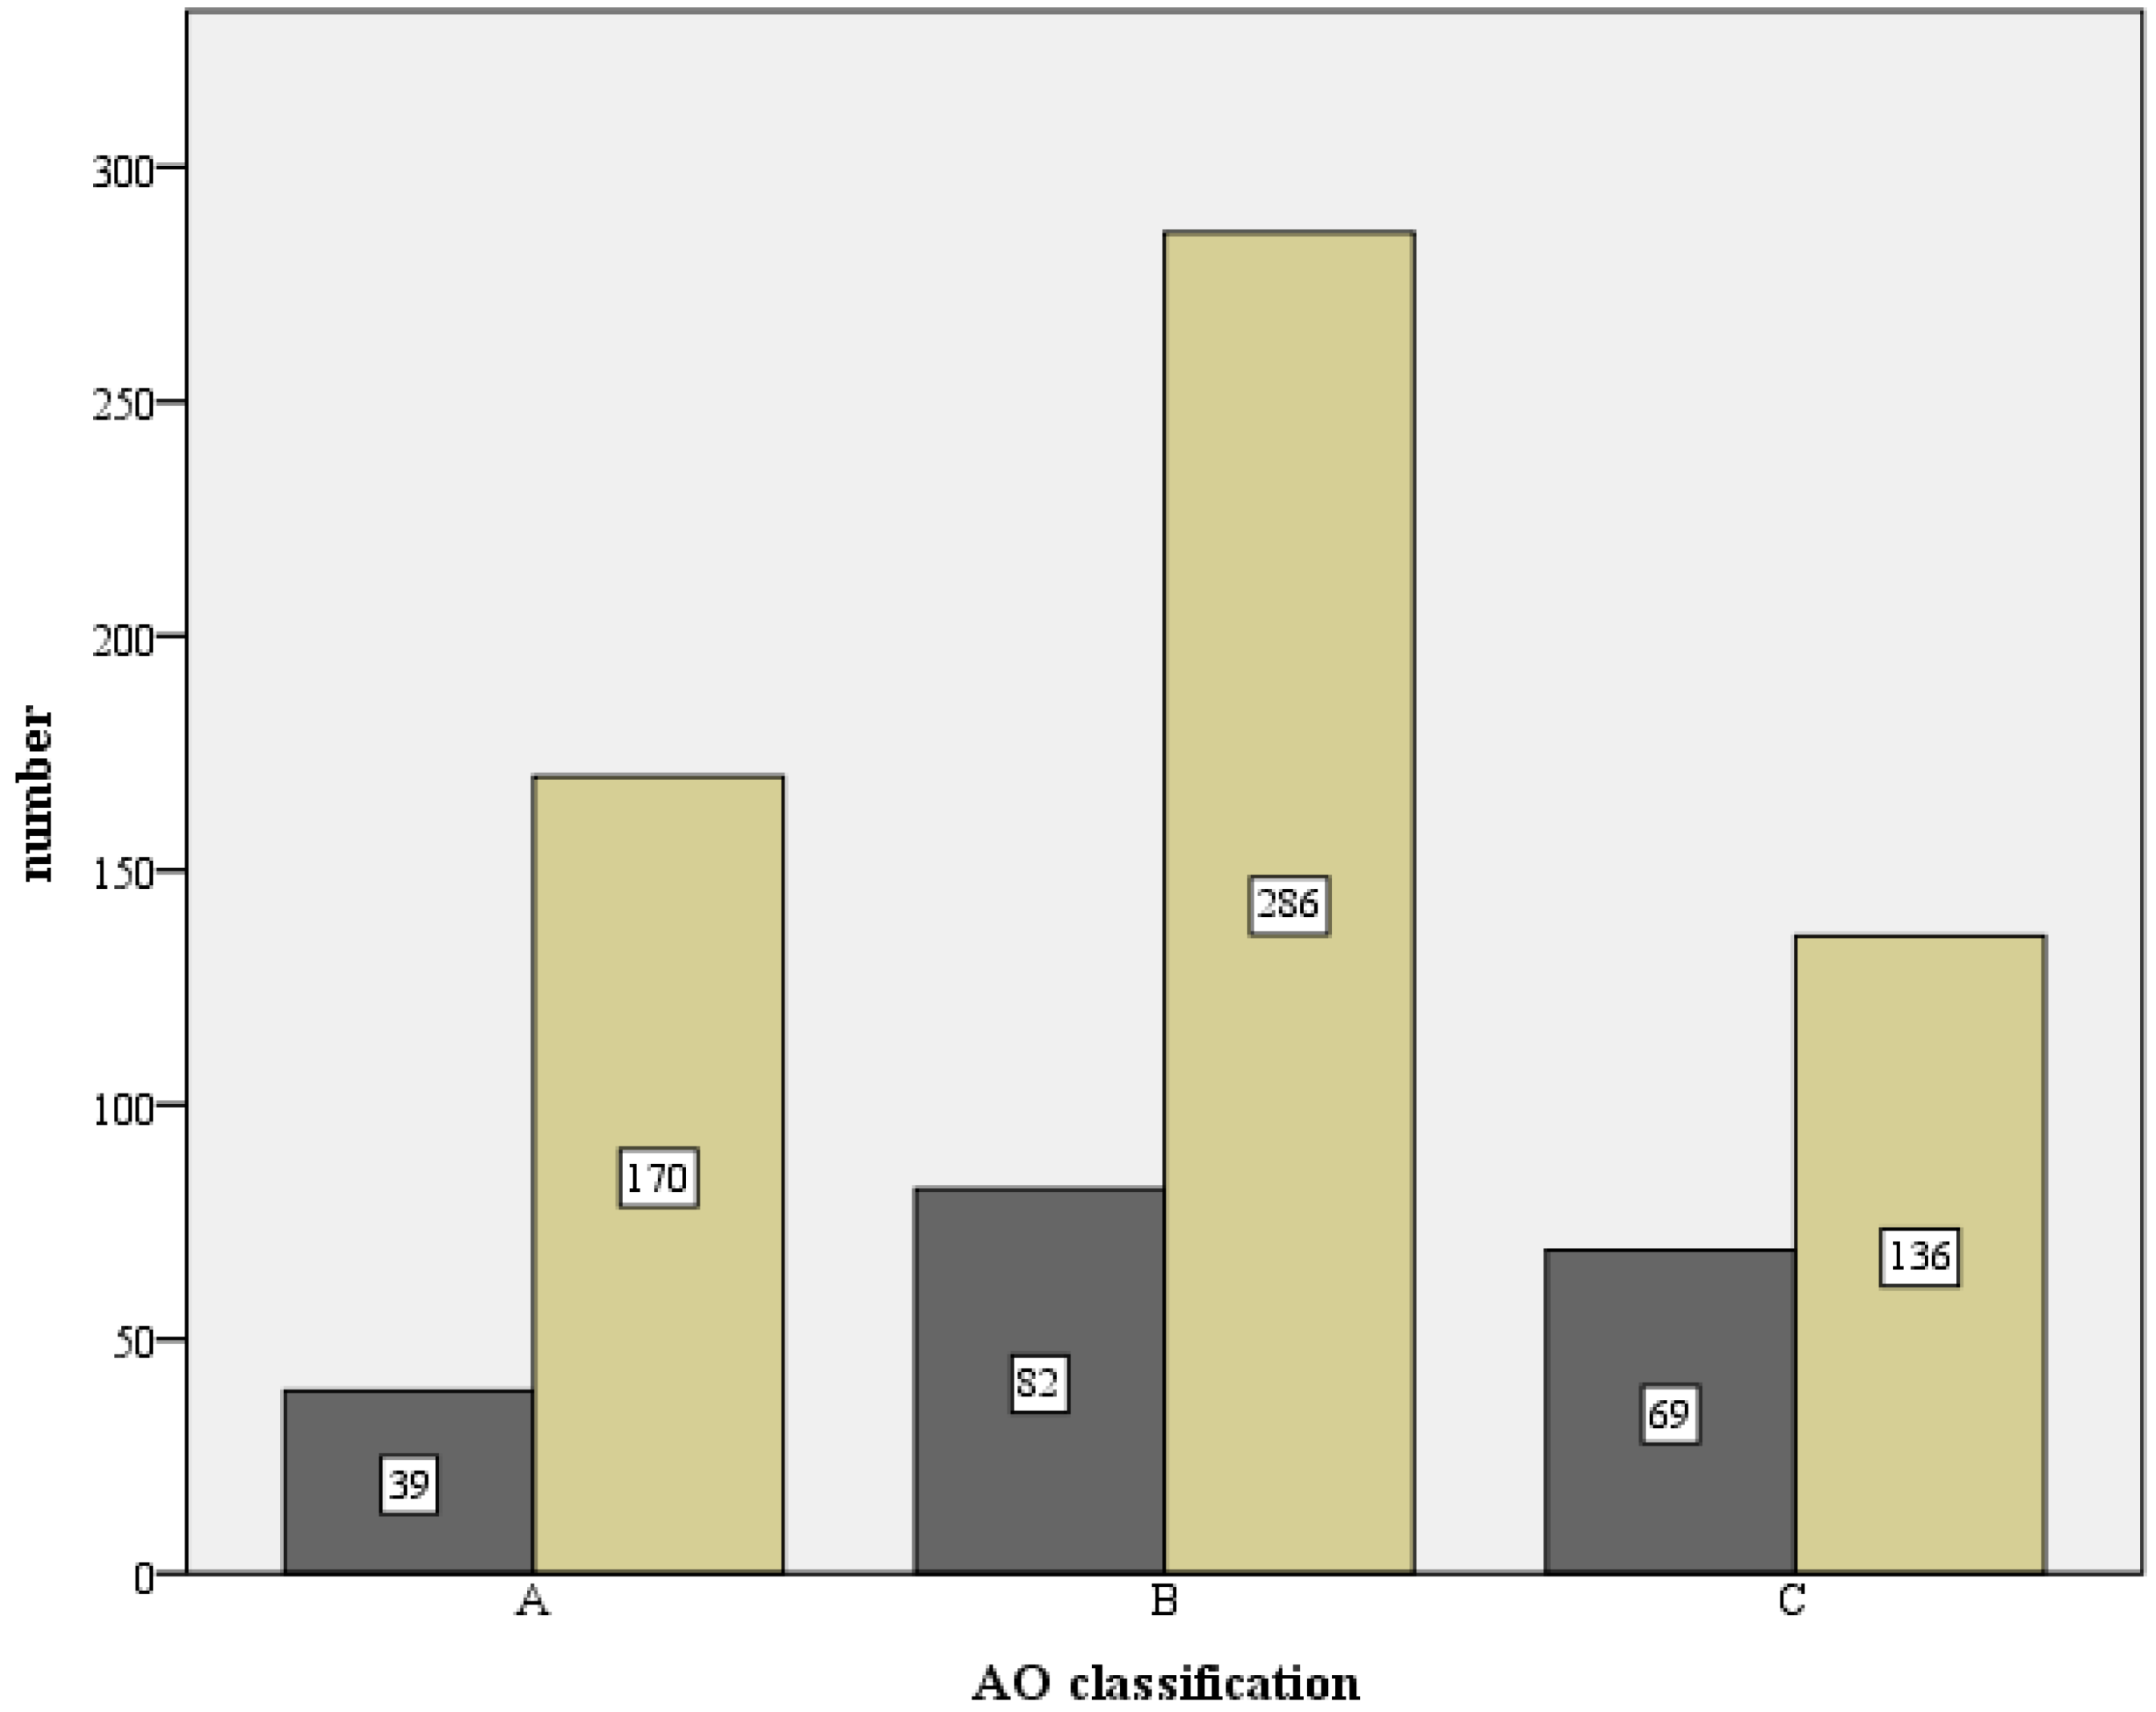
- 20 (1.9%) A1 fractures;
- 112 (10.78%) A2 fractures;
- 161 (15.5%) A3 fractures;
- 252 (24.25%) B1 fractures;
- 214 (20.6%) B2 fractures;
- 32 (3.08%) B3 fractures;
- 65 (6.26%) C1 fractures;
- 152 (14.63%) C2 fractures and;
- 31 (3.0%) C3.

3.2. Complication Types
3.2.1. Complication Type 1
3.2.2. Complication Type 2
Complication Type 2a
Complication Type 2b
Complication Type 2c
3.2.3. Complication Type 3
3.2.4. Complication Type 4
Complication Type 4a
Complication Type 4b
3.3. Results of the Complication Types
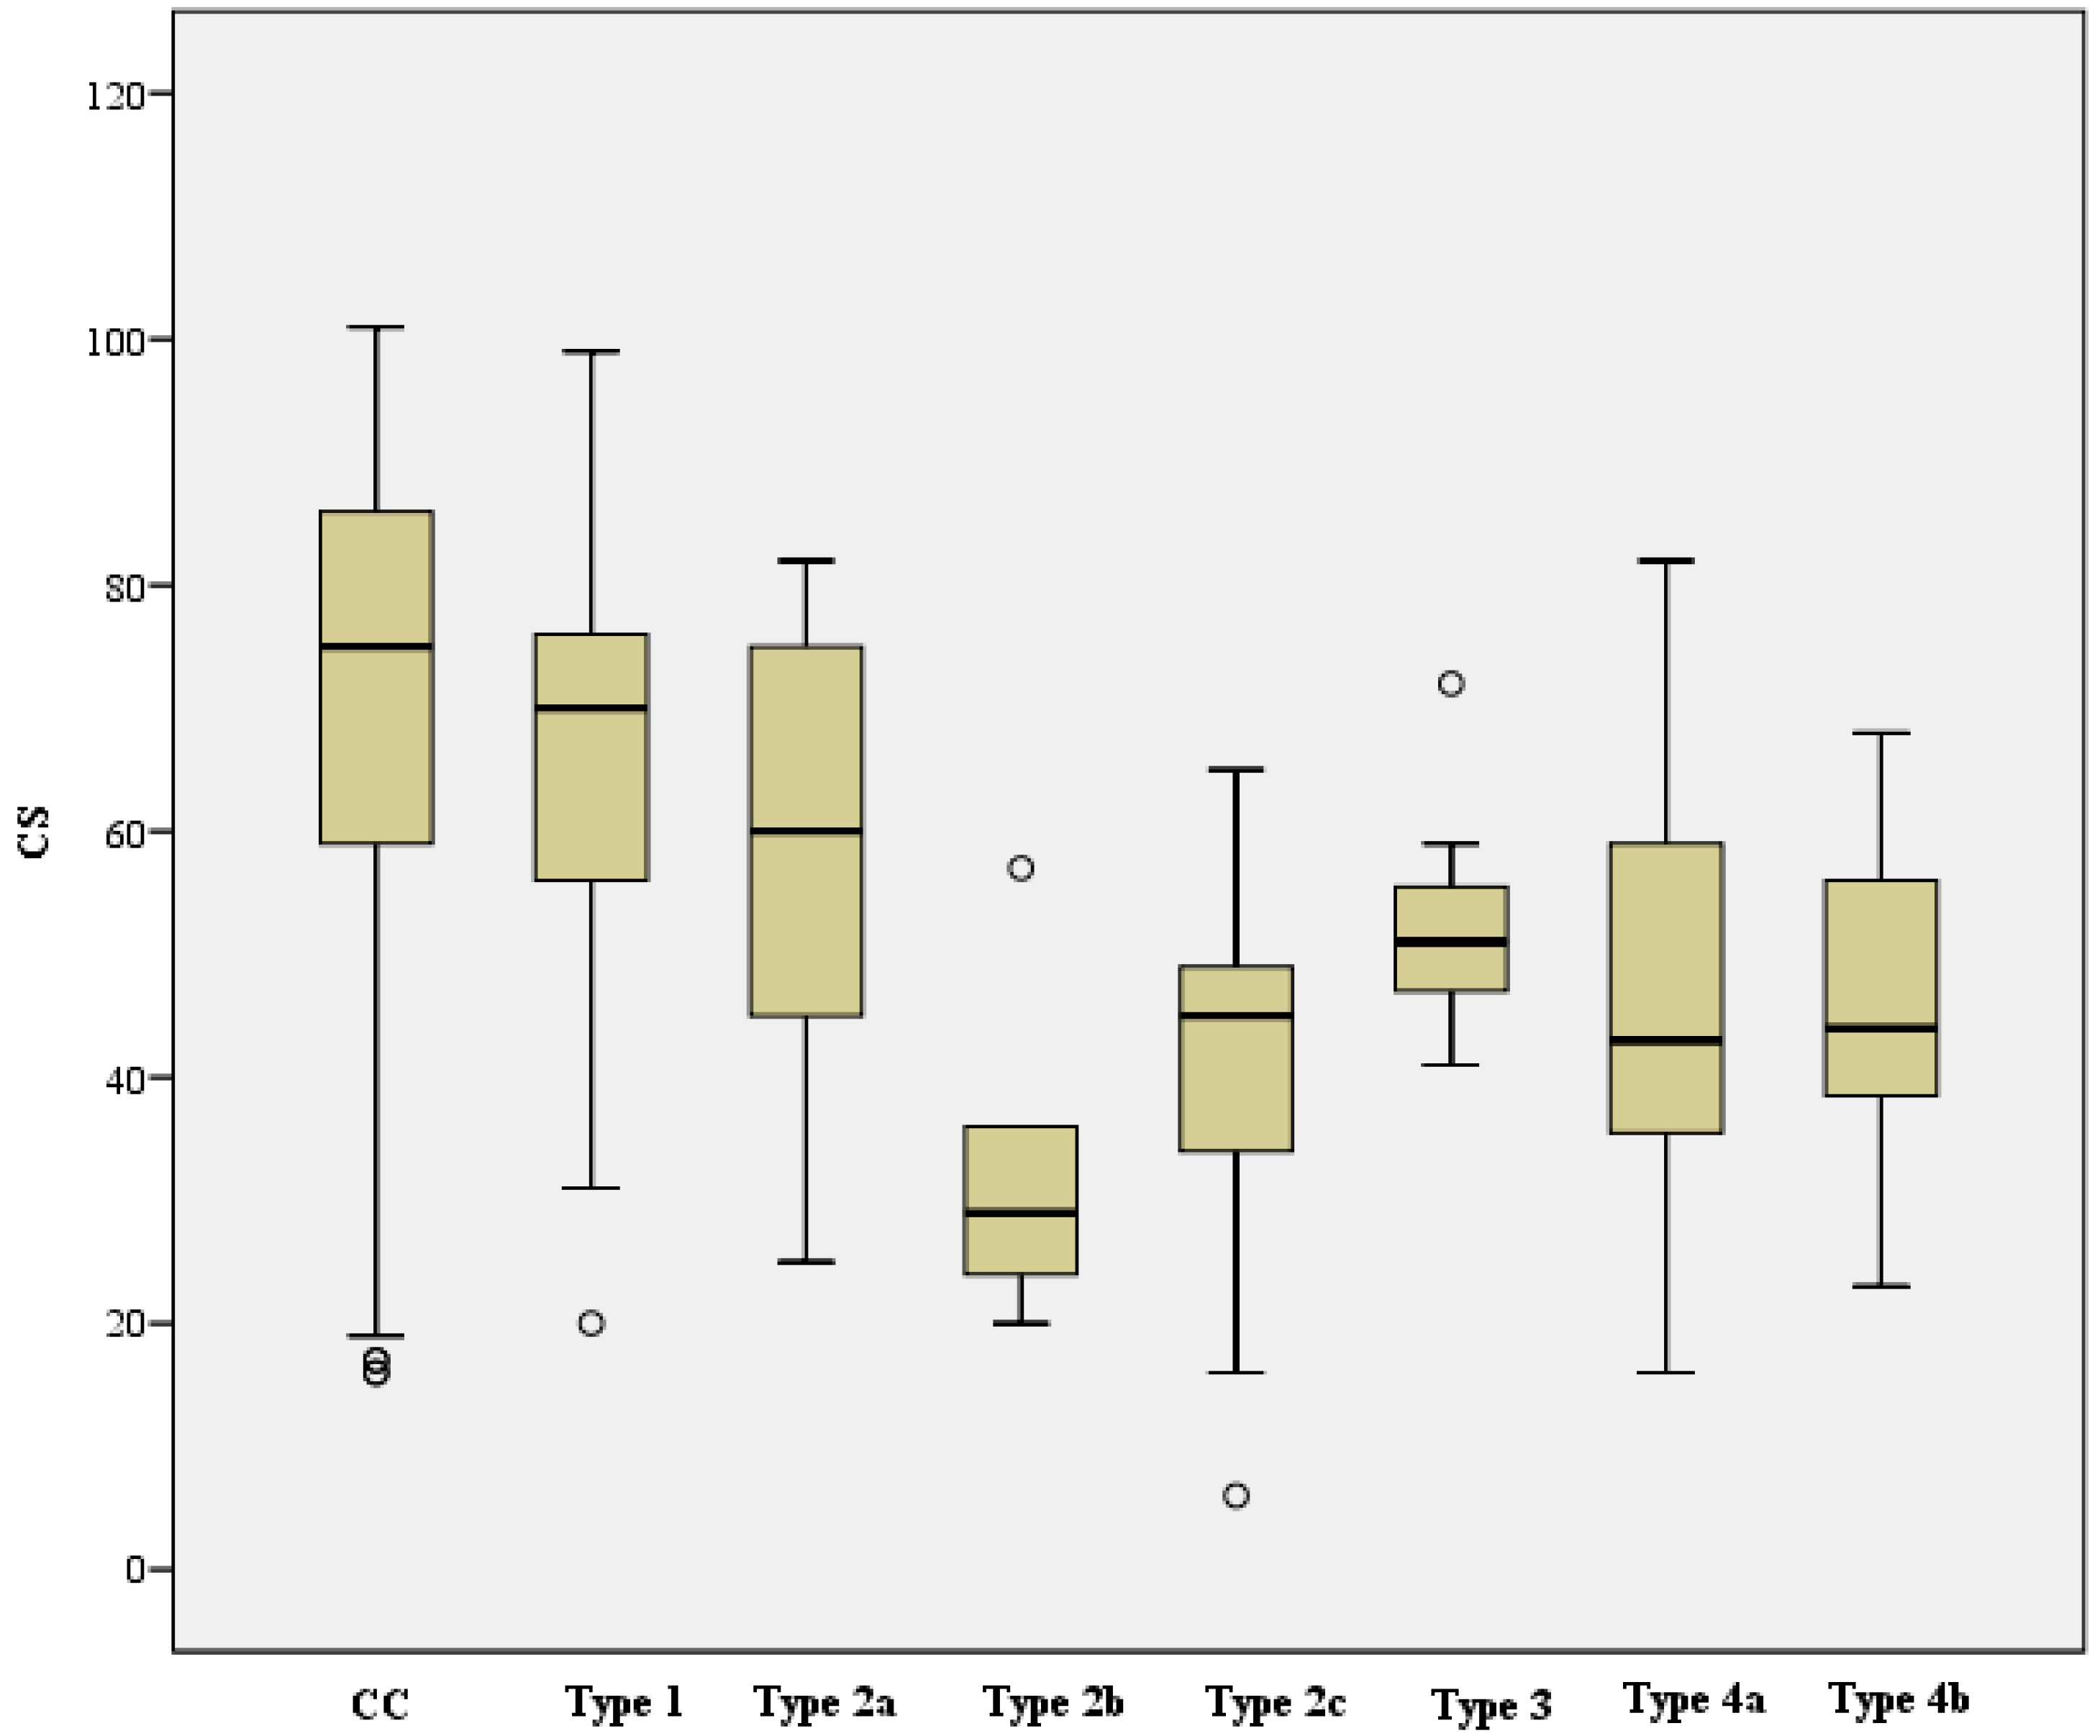
- Complication Type 1 (n = 37) was on average 7.4 points lower compared to the cohort without complications (CC) (95% CI [1.1, 13.8]), t (475) = 2.305, p = 0.022, d = 0.4, r = 0.1.
- Complication Type 2a (n = 29) was on average 13.4 points lower than CC (95% CI [6.3, 20.5]), t (467) = 3.699, p < 0.001, d = 0.7, r = 0.2.
- Complication Type 2b (n = 5) was on average 38.9 points lower than CC (95% CI [22.2, 55.7]), t (443) = 4.571, p < 0.001, d = 2.1, r = 0.2.
- Complication Type 2c (n = 9) was on average 32.8 points lower than CC (95% CI [20.3, 45.3]), t (447) = 5.138, p < 0.001, d = 1.7, r = 0.2.
- Complication Type 3 (n = 7) was on average 19.4 points lower than CC (95% CI [5.3, 33.6]), t (445) = 2.699, p = 0.007, d = 1.0, r = 0.1.
- Complication Type 4a (n = 23) was on average 25.7 points lower than CC (95% CI [17.8, 33.7]), t (461) = 6.364, p < 0.001, d = 1.4, r = 0.3.
- Complication Type 4b (n = 7) was on average 25.8 points lower than CC (95% CI [11.7, 40.0]), t (445) = 3.585, p < 0.001, d = 1.4, r = 0.2.
- Complication Type 1 (n = 37) was on average 8.5 points lower compared to the cohort without complications (CC) (95% CI [1.1, 15.8]), t (475) = 2.270, p = 0.024, d = 0.4, r = 0.1
- Complication Type 2a (n = 29) was on average 14.7 points lower compared to the CC (95% CI [6.4, 22.9]), t (467) = 3.496, p < 0.001, d = 0.7, r = 0.2.
- Complication Type 2b (n = 5) was on average 44.7 points lower compared to the CC (95% CI [25.3, 64.0]), t (443) = 4.543, p < 0.001, d = 2.0, r = 0.2.
- Complication Type 2c (n = 9) was on average 36.7 points lower compared to the CC (95% CI [22.2, 51.2]), t (447) = 4.977, p < 0.001, d = 1.7, r = 0.2.
- Complication Type 3 (n = 7) was on average 21.0 points lower compared to the CC (95% CI [4.7, 37.3]), t (445) = 2.529, p = 0.012, d = 1.0, r = 0.1.
- Complication Type 4a (n = 23) was on average 30.5 points lower compared to the CC (95% CI [21.3, 39.7]), t (461) = 6.527, p < 0.001, d = 1.4, r = 0.3.
- Complication Type 4b (n = 7) was on average 31.2 points lower compared to the CC (95% CI [14.9, 47.6]), t (445) = 3.758, p < 0.001, d = 1.4, r = 0.2.
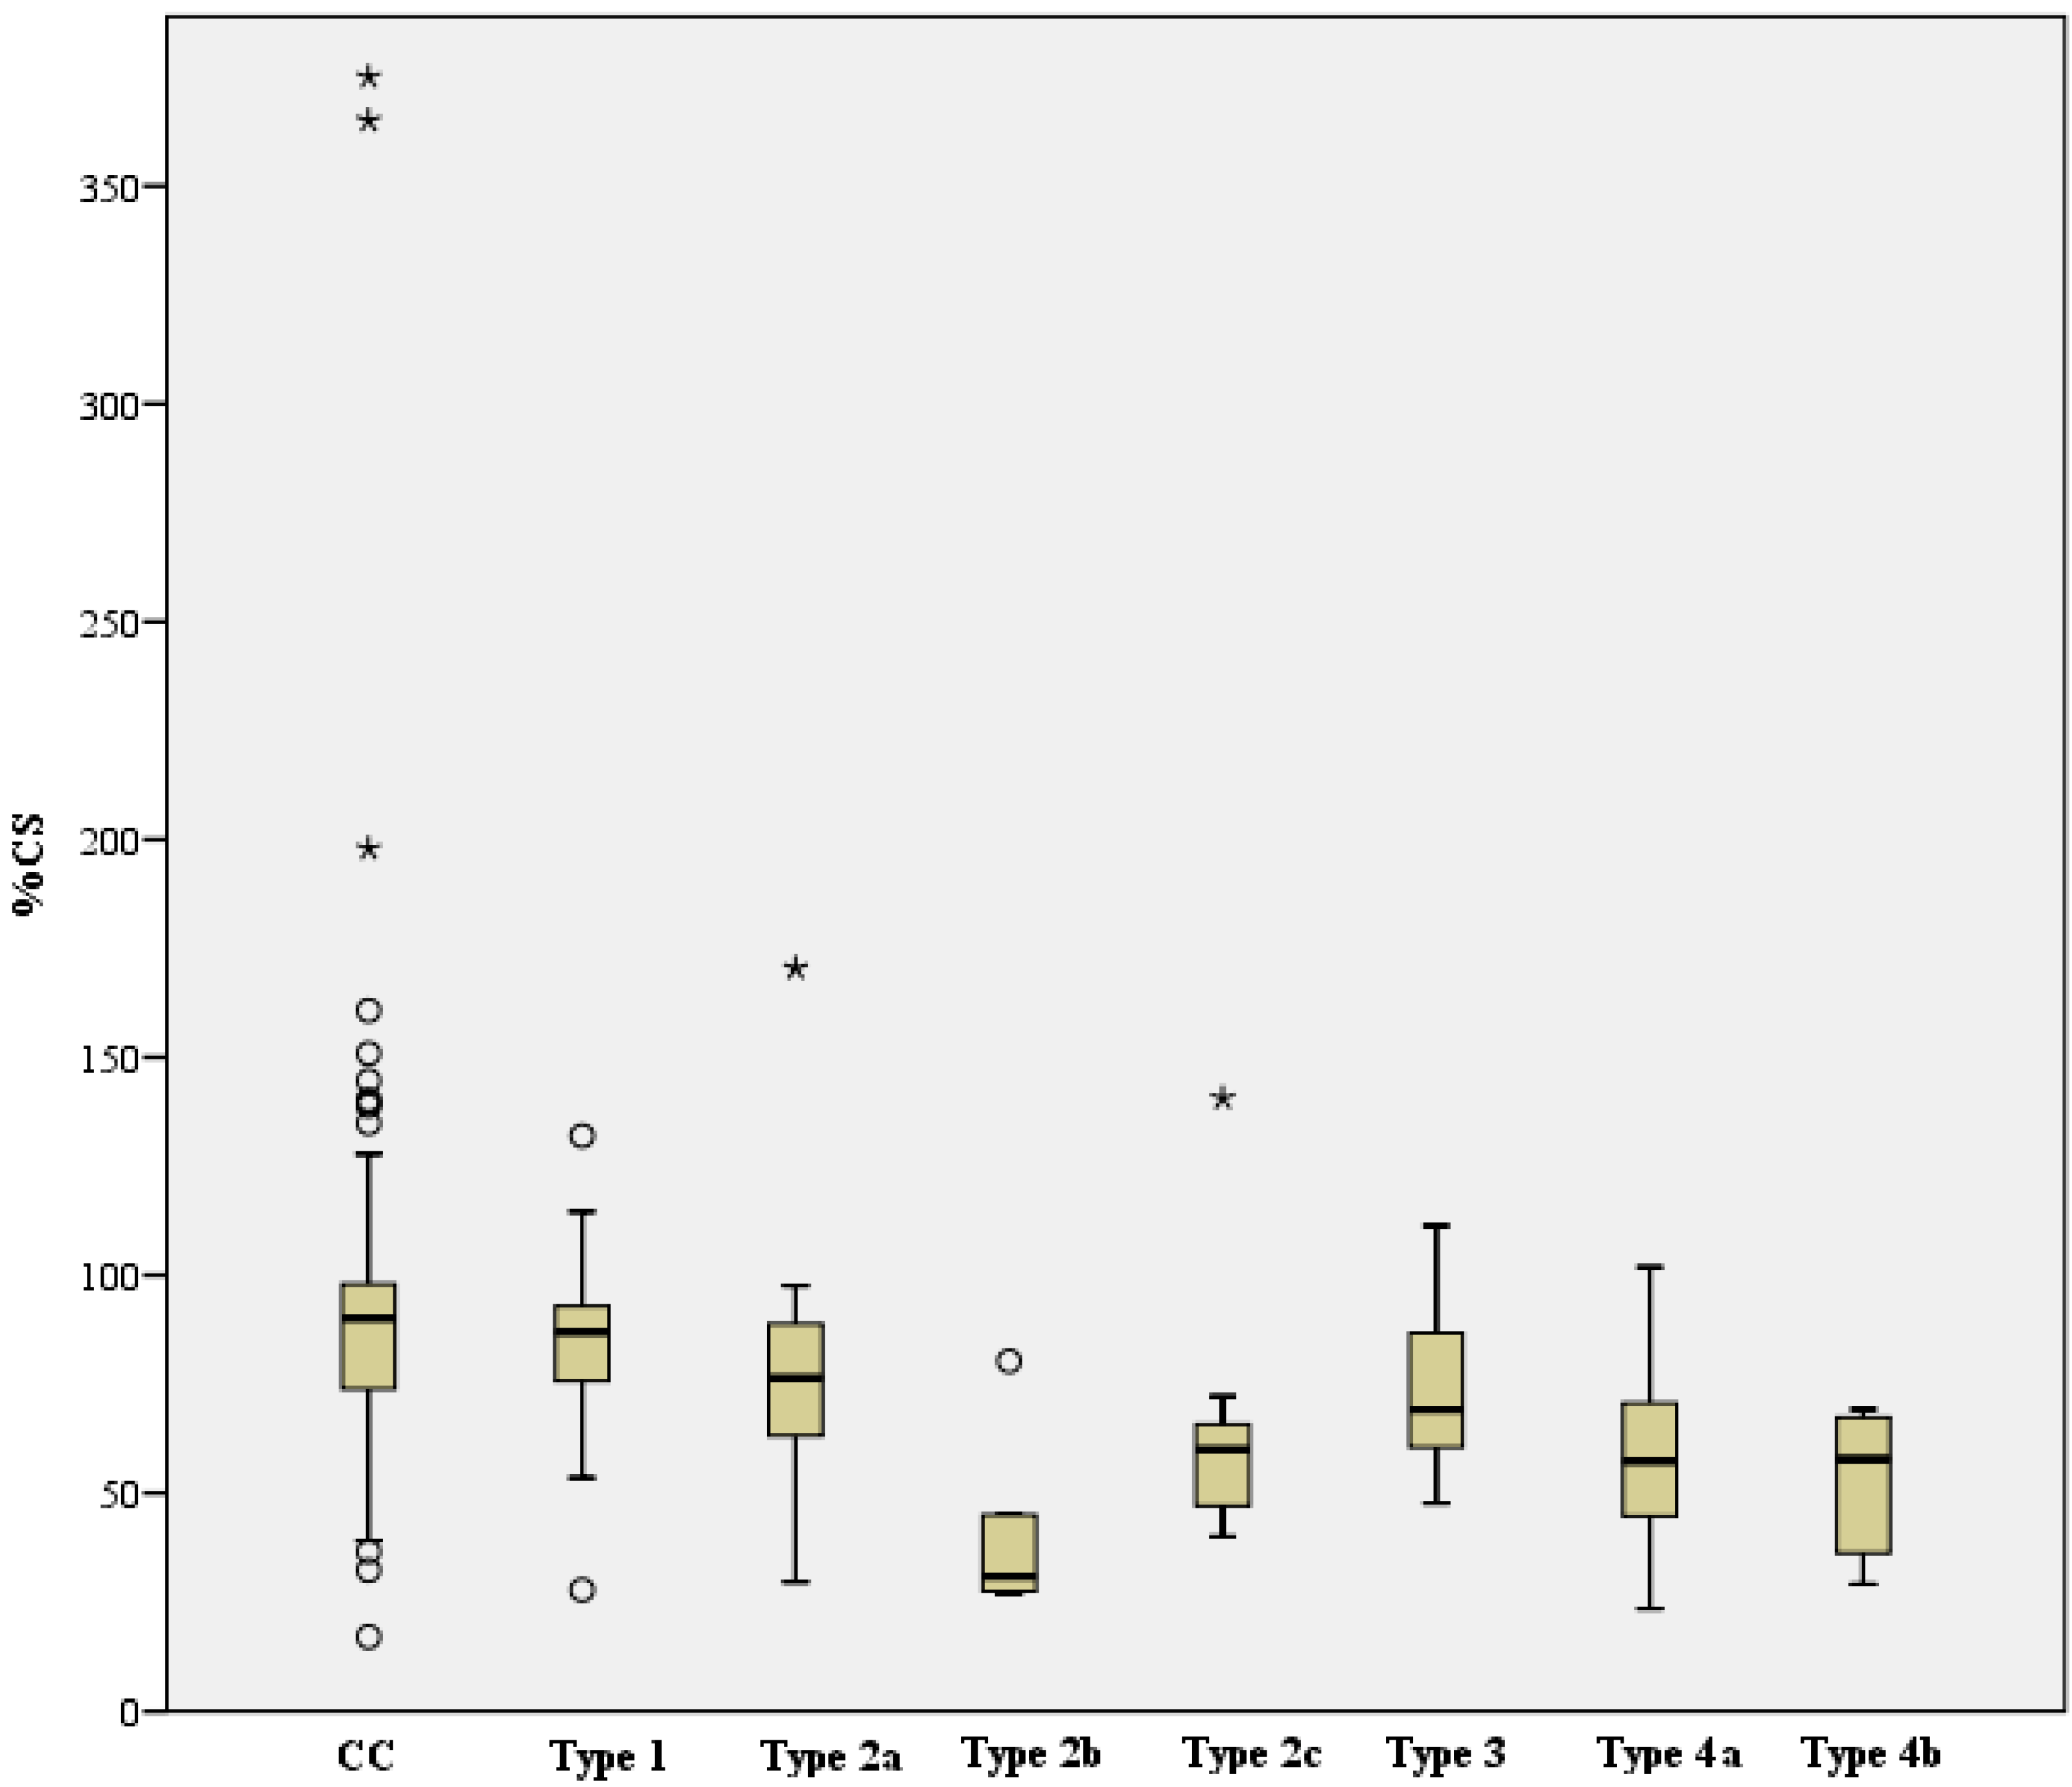
- Complication Type 1 (n = 31) was on average 2.7 percentage points lower than CC (95% CI [−7.3, 12.7]), but thus showed no statistically significant difference, t (440) = 0.532, p = 0.595. There was a statistically significant difference between complication Type 2a (n = 28, median = 76.4) and CC, U (411, 28) = 3796, z = −3.015, p = 0.003, r = 0.14.
- Complication Type 2b (n = 5) was on average 45.2 percentage points lower than CC (95% CI [20.5, 69.8]), thus represented a statistically significant difference, t (414) = 3.599, p < 0.001, d = 1.6, r = 0.2. There was a statistically significant difference between complication Type 2c (n = 9, median = 60.0) and CC, U (411, 9) = 725, z = −3.123, p = 0.002, r = 0.15.
- Complication Type 3 (n = 6) was on average 13.1 percentage points lower than CC (95% CI [−9.4, 35.7]), but showed no statistically significant difference, t (415) = 1.145, p = 0.253.
- Complication Type 4a (n = 21) was on average 29.9 percentage points lower than CC (95% CI [17.7, 42.0]), reflected a statistically significant difference, t (430) = 4.830, p < 0.001, d = 1.1, r = 0.2.
- Complication Type 4b (n = 6) was on average 34.3 percentage points lower than CC (95% CI [11.8, 56.8]), which reflected a statistically significant difference, t (415) = 2.996, p = 0.003, d = 1.2, r = 0.2.
- -
- 31.5 points higher than complication Type 2b (95% CI [15.5, 47.5]), p < 0.001.
- -
- 25.4 points higher than complication Type 2c (95% CI [12.9, 37.8]), p < 0.001.
- -
- 18.3 points higher than complication Type 4a (95% CI [9.4, 27.2]), p < 0.001.
- -
- 18.4 points higher than complication Type 4b (95 CI [4.6, 32.2]), p = 0.009.
- -
- 25.5 points higher than complication Type 2b (95% CI [9.3, 41.8]), p = 0.002.
- -
- 19.4 points higher than complication Type 2c (95% CI [6.6, 32.2]), p = 0.003.
- -
- 12.3 points higher than complication Type 4a (95% CI [3.0, 21.7]), p = 0.01.
- -
- 36.2 p. higher than Complication Type 2b (95% CI [16.8, 55.6]), p < 0.001.
- -
- 28.2 p. higher than Complication Type 2c (95% CI [13.1, 43.4]), p < 0.001.
- -
- 22.0 p. higher than Complication Type 4a (95% CI [11.2, 32.8]), p < 0.001.
- -
- 22.8 p. higher than Complication Type 4b (95% CI [6.0, 40.0]), p = 0.008.
- -
- 30.0 p. higher than Complication Type 2b (95% CI [10.3, 49.7]), p = 0.003.
- -
- 22.0 p. higher than Complication Type 2c (95% CI [6.5, 37.6]), p = 0.006.
- -
- 15.8 p. higher than Complication Type 4a (95% CI [4.4, 27.2]), p = 0.007.
3.4. Complication Management
3.5. Association with Fracture Classification
4. Discussion
4.1. Overview of Complications after Locking Plate Osteosynthesis
4.2. Description of Types of Osteosynthesis-Associated Complications
4.3. Association of Initial Fracture Type with Functional Postoperative Outcome and Complication
4.4. Limitation
5. Conclusions
Author Contributions
Funding
Institutional Review Board Statement
Informed Consent Statement
Data Availability Statement
Conflicts of Interest
References
- Baker, H.P.; Gutbrod, J.; Strelzow, J.A.; Maassen, N.H.; Shi, L. Management of Proximal Humerus Fractures in Adults-A Scoping Review. J. Clin. Med. 2022, 11, 6140. [Google Scholar] [CrossRef]
- Rupp, M.; Walter, N.; Pfeifer, C.; Lang, S.; Kerschbaum, M.; Krutsch, W.; Baumann, F.; Alt, V. The Incidence of Fractures Among the Adult Population of Germany—An Analysis from 2009 through 2019. Dtsch. Arztebl. Int. 2021, 118, 665–669. [Google Scholar] [CrossRef]
- Burkhart, K.J.; Dietz, S.O.; Bastian, L.; Thelen, U.; Hoffmann, R.; Müller, L.P. The treatment of proximal humeral fracture in adults. Dtsch. Arztebl. Int. 2013, 110, 591–597. [Google Scholar] [CrossRef] [Green Version]
- Porschke, F.; Bockmeyer, J.; Nolte, P.C.; Studier-Fischer, S.; Guehring, T.; Schnetzke, M. More Adverse Events after Osteosyntheses Compared to Arthroplasty in Geriatric Proximal Humeral Fractures Involving Anatomical Neck. J. Clin. Med. 2021, 10, 979. [Google Scholar] [CrossRef]
- Laux, C.J.; Grubhofer, F.; Werner, C.M.L.; Simmen, H.P.; Osterhoff, G. Current concepts in locking plate fixation of proximal humerus fractures. J. Orthop. Surg. Res. 2017, 12, 137. [Google Scholar] [CrossRef] [Green Version]
- Agudelo, J.; Schürmann, M.; Stahel, P.; Helwig, P.; Morgan, S.J.; Zechel, W.; Bahrs, C.; Parekh, A.; Ziran, B.; Williams, A.; et al. Analysis of efficacy and failure in proximal humerus fractures treated with locking plates. J. Orthop. Trauma 2007, 21, 676–681. [Google Scholar] [CrossRef]
- Haasters, F.; Siebenbürger, G.; Helfen, T.; Daferner, M.; Böcker, W.; Ockert, B. Complications of locked plating for proximal humeral fractures-are we getting any better? J. Shoulder Elb. Surg. 2016, 25, e295–e303. [Google Scholar] [CrossRef]
- Südkamp, N.; Bayer, J.; Hepp, P.; Voigt, C.; Oestern, H.; Kääb, M.; Luo, C.; Plecko, M.; Wendt, K.; Köstler, W. Open reduction and internal fixation of proximal humeral fractures with use of the locking proximal humerus plate: Results of a prospective, multicenter, observational study. JBJS 2009, 91, 1320–1328. [Google Scholar] [CrossRef]
- Schuetze, K.; Boehringer, A.; Cintean, R.; Gebhard, F.; Pankratz, C.; Richter Eickhoff, A.M. Feasibility and Radiological Outcome of Minimally Invasive Locked Plating of Proximal Humeral Fractures in Geriatric Patients. J. Clin. Med. 2022, 11, 6751. [Google Scholar] [CrossRef]
- Brunner, F.; Sommer, C.; Bahrs, C.; Heuwinkel, R.; Hafner, C.; Rillmann, P.; Kohut, G.; Ekelund, A.; Muller, M.; Audigé, L.; et al. Open reduction and internal fixation of proximal humerus fractures using a proximal humeral locked plate: A prospective multicenter analysis. J. Orthop. Trauma 2009, 23, 163–172. [Google Scholar] [CrossRef]
- Ockert, B.; Siebenbürger, G.; Kettler, M.; Braunstein, V.; Mutschler, W. Long-term functional outcomes (median 10 years) after locked plating for displaced fractures of the proximal humerus. J. Shoulder Elb. Surg. 2014, 23, 1223–1231. [Google Scholar] [CrossRef]
- Acklin, Y.P.; Stoffel, K.; Sommer, C. A prospective analysis of the functional and radiological outcomes of minimally invasive plating in proximal humerus fractures. Injury 2013, 44, 456–460. [Google Scholar] [CrossRef]
- Siebenbürger, G.; Biermann, N.; Haasters, F.; Mutschler, W.; Ockert, B. Klinisches Outcome (Median 5 Jahre) nach winkelstabiler Plattenosteosynthese von 228 Patienten mit dislozierter proximaler Humerusfraktur. Obere Extrem. 2014, 9, 215–221. [Google Scholar] [CrossRef]
- Fleischhacker, E.; Siebenbürger, G.; Gleich, J.; Helfen, T.; Böcker, W.; Ockert, B. Open reduction and internal fixation of displaced head-split type humeral fractures and role of the rotator-interval approach. Shoulder Elb. 2021, 17585732211065449. [Google Scholar] [CrossRef]
- Sproul, R.C.; Iyengar, J.J.; Devcic, Z.; Feeley, B.T. A systematic review of locking plate fixation of proximal humerus fractures. Injury 2011, 42, 408–413. [Google Scholar] [CrossRef]
- Thanasas, C.; Kontakis, G.; Angoules, A.; Limb, D.; Giannoudis, P. Treatment of proximal humerus fractures with locking plates: A systematic review. J. Shoulder Elb. Surg. 2009, 18, 837–844. [Google Scholar] [CrossRef]
- Jost, B.; Spross, C.; Grehn, H.; Gerber, C. Locking plate fixation of fractures of the proximal humerus: Analysis of complications, revision strategies and outcome. J. Shoulder Elb. Surg. 2013, 22, 542–549. [Google Scholar] [CrossRef]
- Owsley, K.C.; Gorczyca, J.T. Displacement/screw cutout after open reduction and locked plate fixation of humeral fractures. JBJS 2008, 90, 233–240. [Google Scholar] [CrossRef]
- Saltzman, B.M.; Erickson, B.J.; Harris, J.D.; Gupta, A.K.; Mighell, M.; Romeo, A.A. Fibular Strut Graft Augmentation for Open Reduction and Internal Fixation of Proximal Humerus Fractures: A Systematic Review and the Authors' Preferred Surgical Technique. Orthop. J. Sports Med. 2016, 4, 2325967116656829. [Google Scholar] [CrossRef] [Green Version]
- Schnetzke, M.; Bockmeyer, J.; Porschke, F.; Studier-Fischer, S.; Grützner, P.A.; Guehring, T. Quality of Reduction Influences Outcome After Locked-Plate Fixation of Proximal Humeral Type-C Fractures. JBJS 2016, 98, 1777–1785. [Google Scholar] [CrossRef]
- Jeong, J.; Bryan, J.; Iannotti, J.P. Effect of a variable prosthetic neck-shaft angle and the surgical technique on replication of normal humeral anatomy. JBJS 2009, 91, 1932–1941. [Google Scholar] [CrossRef]
- Tepass, A.; Blumenstock, G.; Weise, K.; Rolauffs, B.; Bahrs, C. Current strategies for the treatment of proximal humeral fractures: An analysis of a survey carried out at 348 hospitals in Germany, Austria, and Switzerland. J. Shoulder Elb. Surg. 2013, 22, e8–e14. [Google Scholar] [CrossRef]
- Culham, E.; Peat, M. Functional anatomy of the shoulder complex. J. Orthop. Sports Phys. Ther. 1993, 18, 342–350. [Google Scholar] [CrossRef]
- Fleischhacker, E.; Siebenbürger, G.; Helfen, T.; Gleich, J.; Böcker, W.; Ockert, B. Varus malposition relates to functional outcomes following open reduction and internal fixation for proximal humeral fractures: A retrospective comparative cohort study with minimum 2 years follow-up. Injury 2021, 52, 506–510. [Google Scholar] [CrossRef]
- Solberg, B.D.; Moon, C.N.; Franco, D.P.; Paiement, G.D. Surgical treatment of three and four-part proximal humeral fractures. JBJS 2009, 91, 1689–1697. [Google Scholar] [CrossRef]
- Greiner, S.; Kääb, M.; Haas, N.; Bail, H. Humeral head necrosis rate at mid-term follow-up after open reduction and angular stable plate fixation for proximal humeral fractures. Injury 2009, 40, 186–191. [Google Scholar] [CrossRef]
- Lill, H.; Josten, C. Conservative or operative treatment of humeral head fractures in the elderly? Chirurg 2001, 72, 1224–1234. [Google Scholar] [CrossRef]
- Königshausen, M.K.L.; Godry, H.; Citak, M.; Schildhauer, T.; Seybold, D. Clinical outcome and complications using a polyaxial locking plate in the treatment of displaced proximal humerus fractures. A reliable system? Injury 2012, 43, 223–231. [Google Scholar] [CrossRef]
- Spross, C.M.J.; Mazzucchelli, R.A.; Puskás, G.J.; Zdravkovic, V.; Jost, B. Evidence-based algorithm to treat patients with proximal humerus fractures—A prospective study with early clinical and overall performance results. J. Shoulder Elb. Surg. 2019, 28, 1022–1032. [Google Scholar] [CrossRef]
- Larose, G.; Virk, M.S. The Evolution of Reverse Total Shoulder Arthroplasty and Its Current Use in the Treatment of Proximal Humerus Fractures in the Older Population. J. Clin. Med. 2022, 11, 5832. [Google Scholar] [CrossRef]
- Imiolczyk, J.P.B.U.; Imiolczyk, T.; Freislederer, F.; Endell, D.; Scheibel, M. Reverse Shoulder Arthroplasty for Proximal Humerus Head-Split Fractures-A Retrospective Cohort Study. J. Clin. Med. 2022, 11, 2835. [Google Scholar] [CrossRef]


| Complication Type | Exemplary Images by X-rays or Pattern Images | Definition |
|---|---|---|
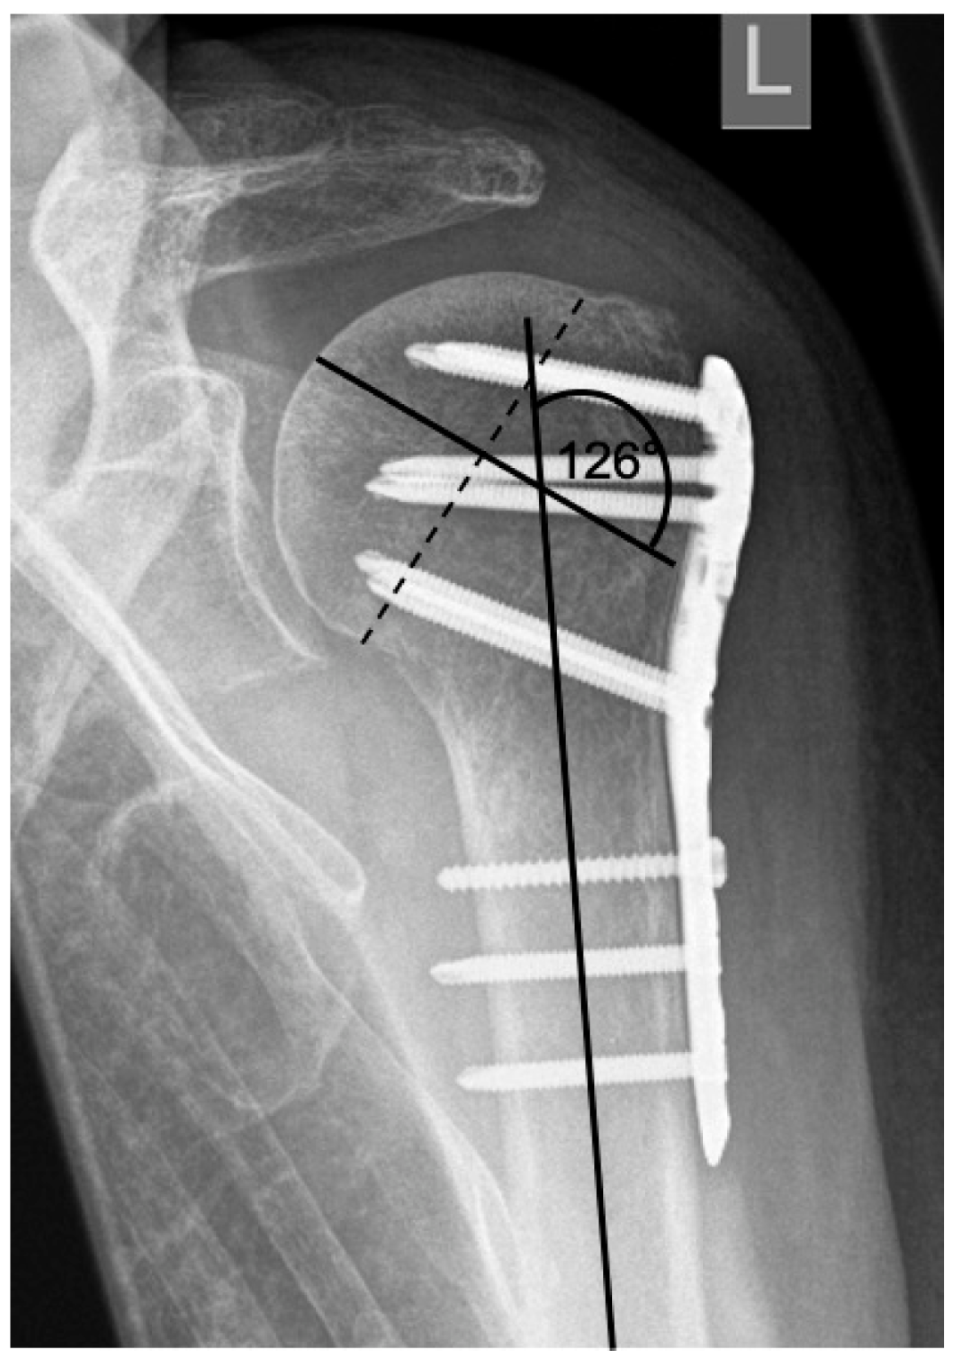
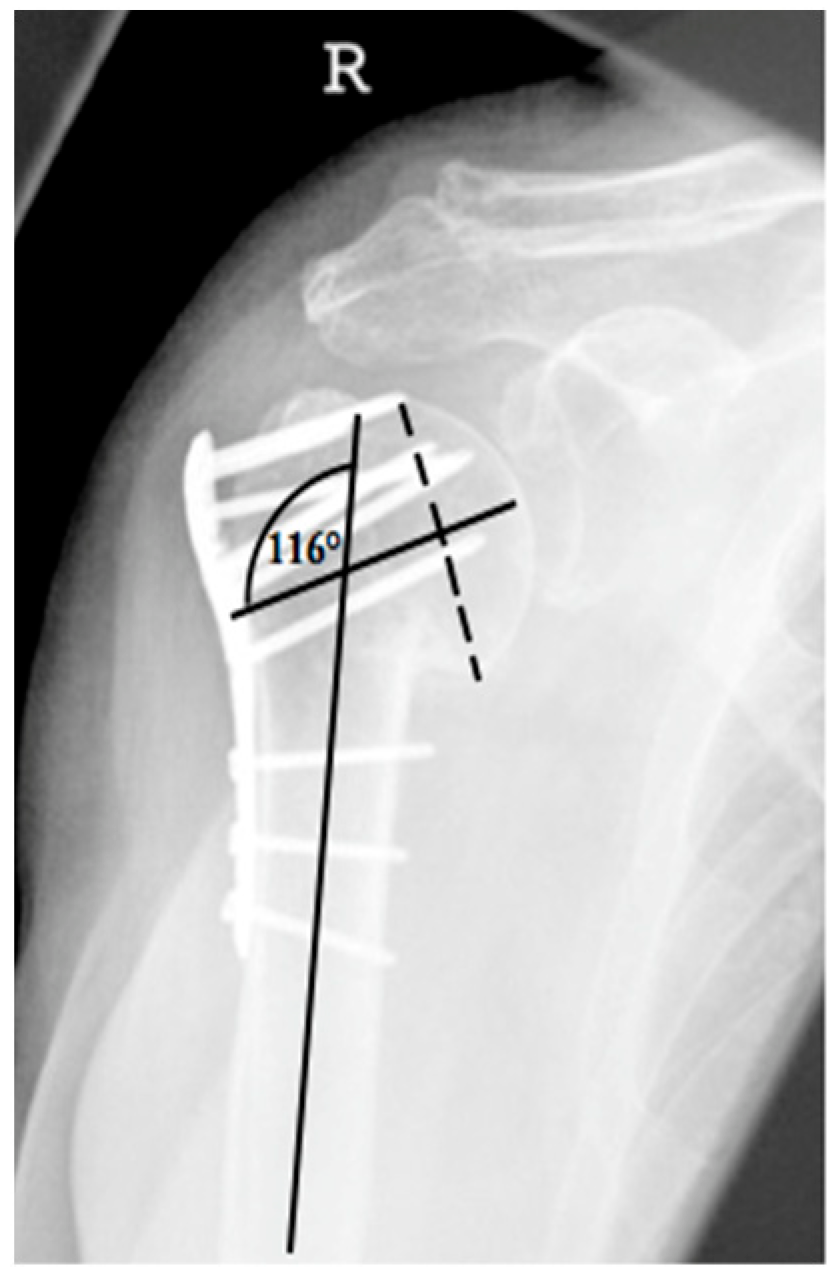
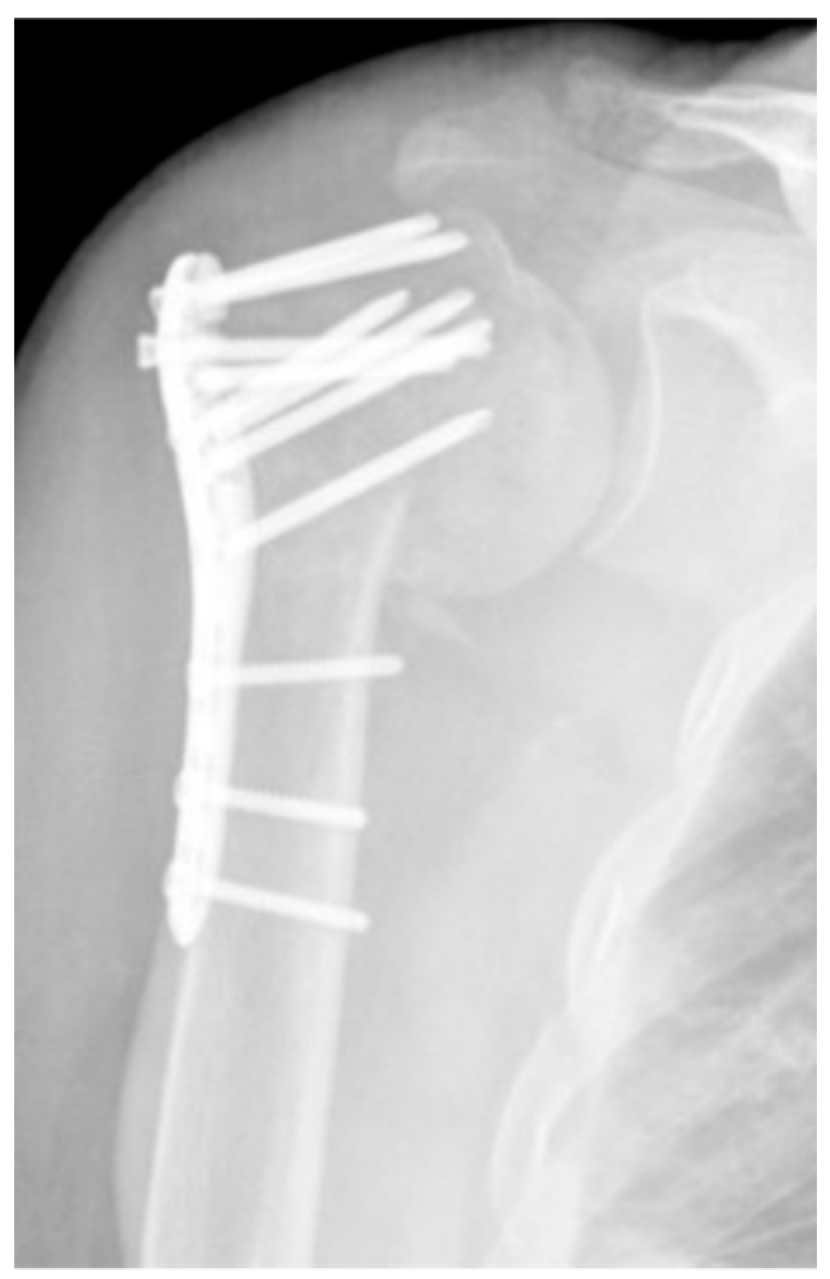
| 1 |  | Complication Type 1 is defined by a mild, stable varus or valgus displacement (<20°) of the humeral head without resulting in a screw cutout through the humeral head cortex. |
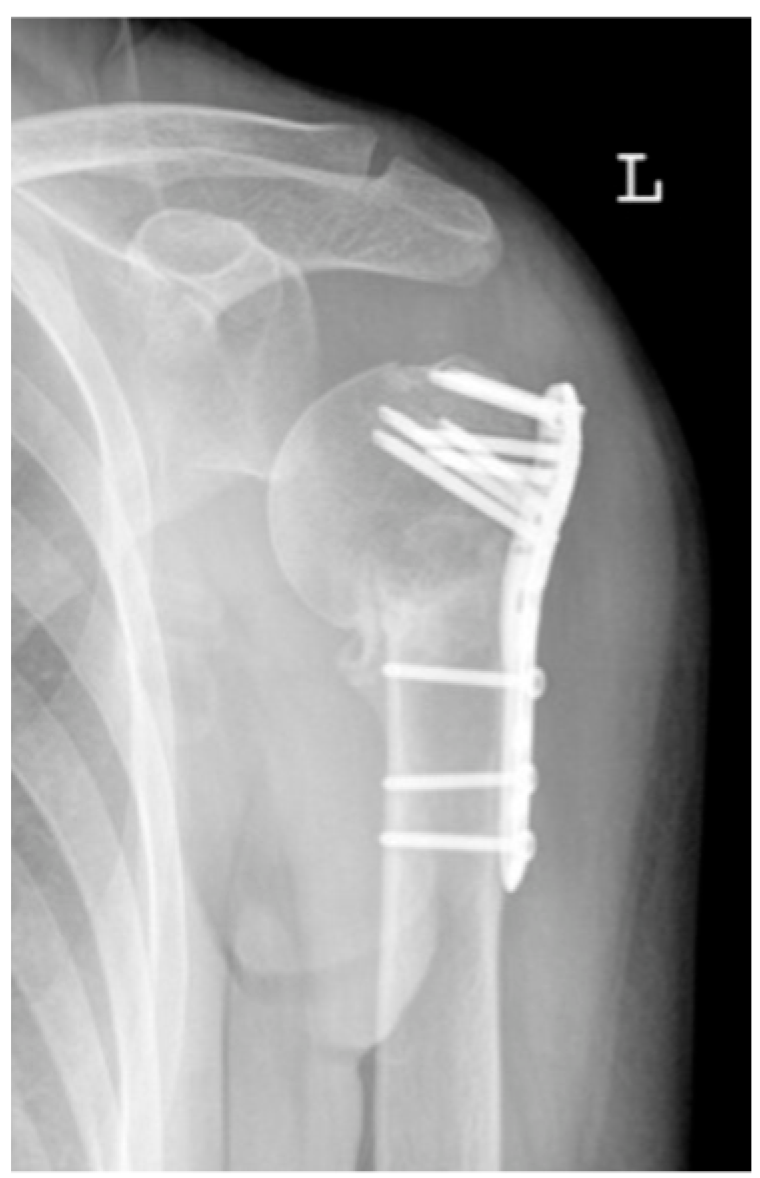
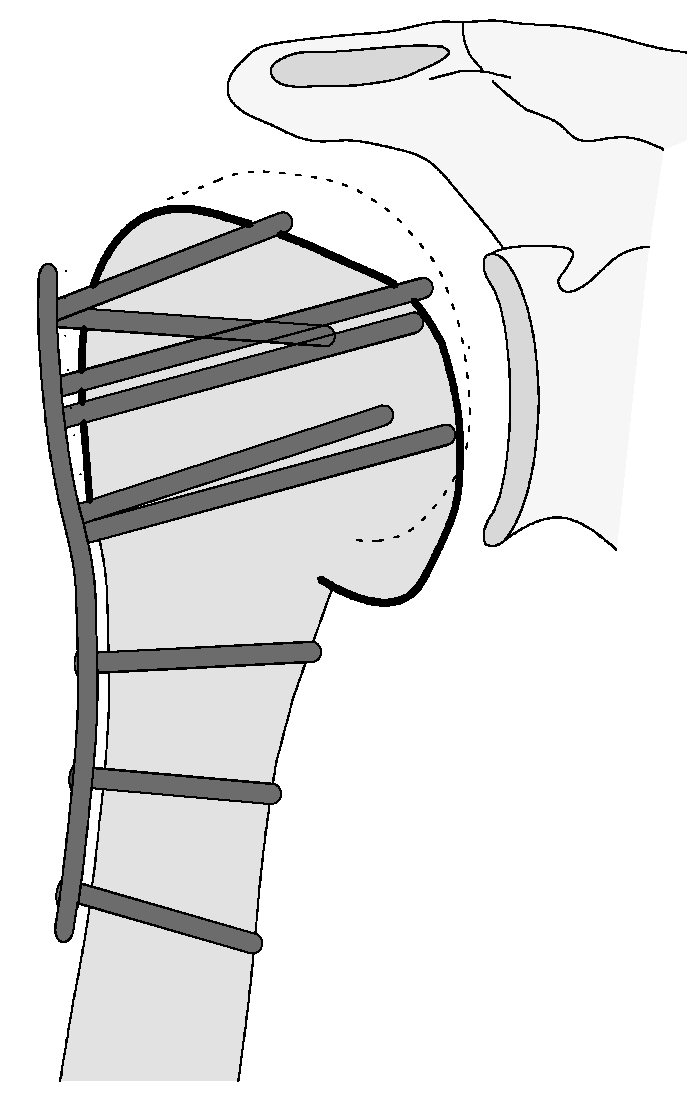
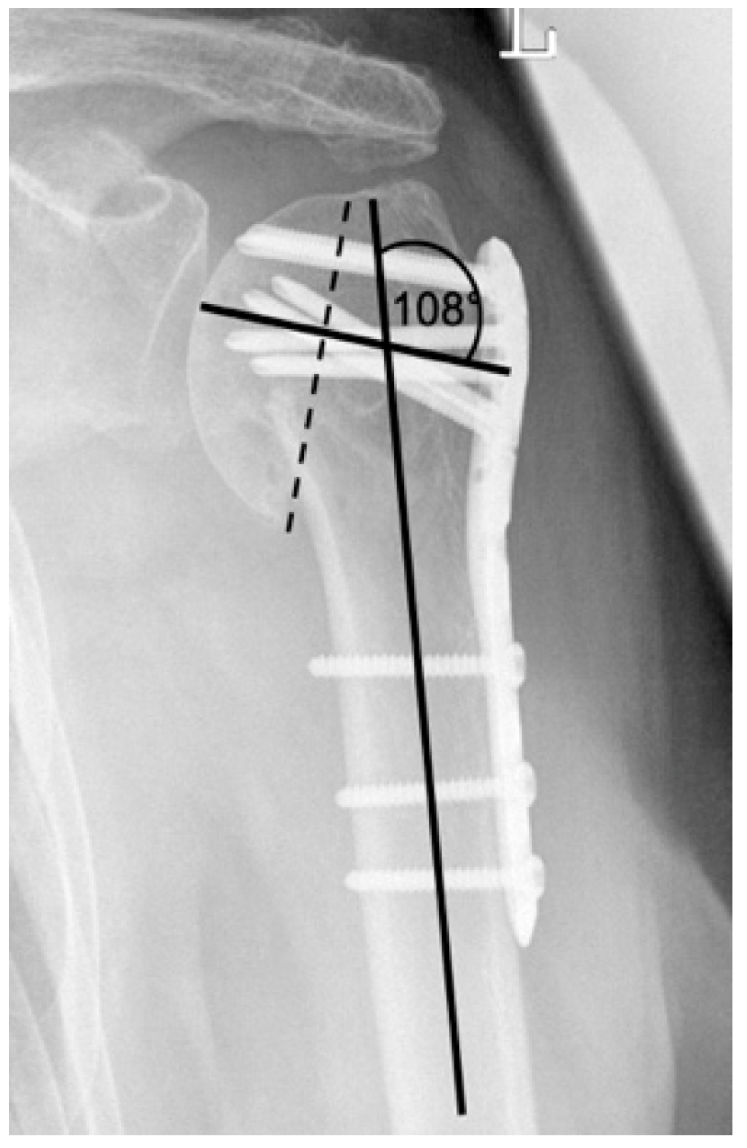
| 2a |  | Complication Type 2a is defined by varus displacement (<20°) of the humeral head associated with screw cutout through the humeral head cortex. The head sintering is considered relatively stable and non-progressive. |
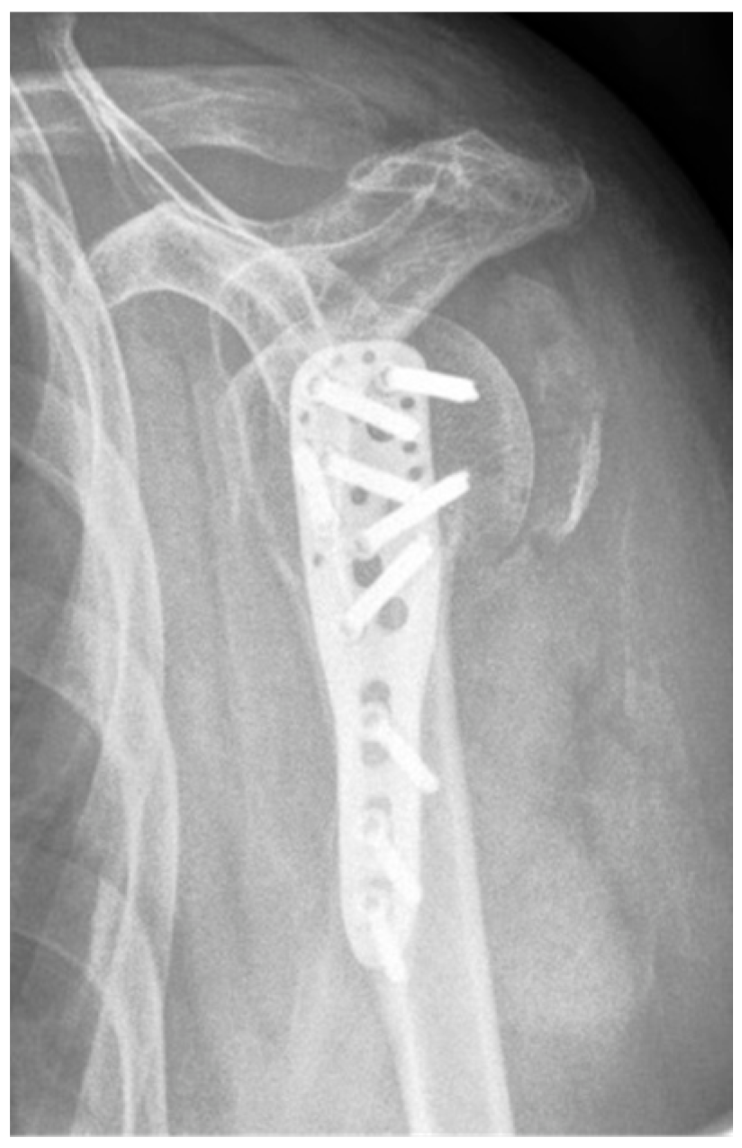
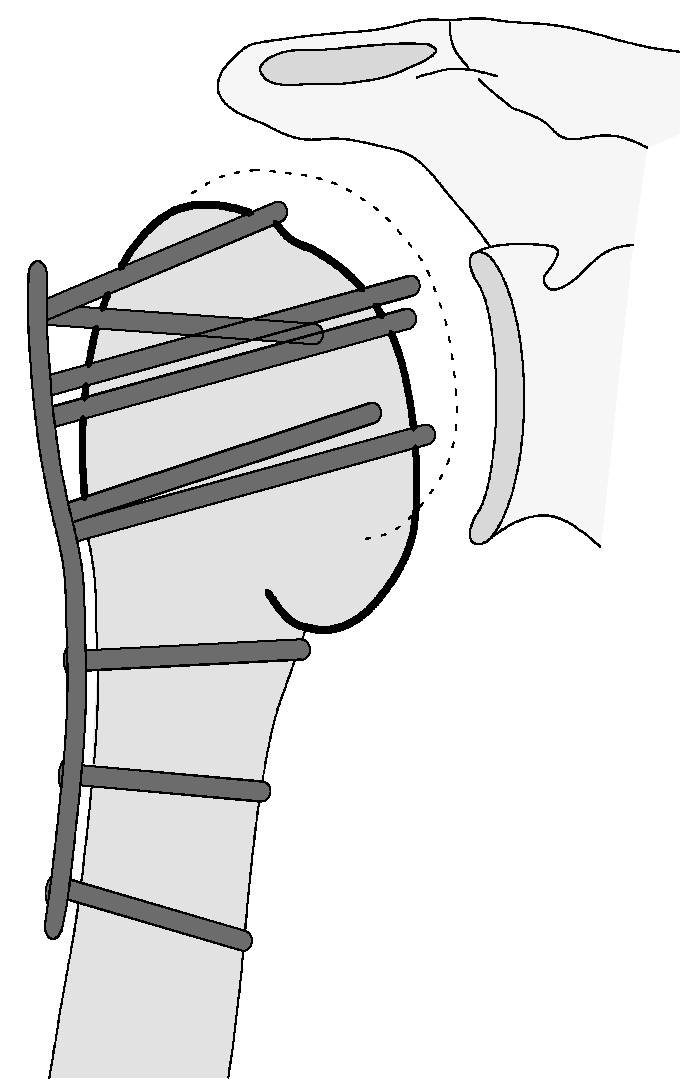
| 2b |  | Complication Type 2b is limited to displacement of the greater tuberosity, lesser tuberosity, or both tuberosities. |
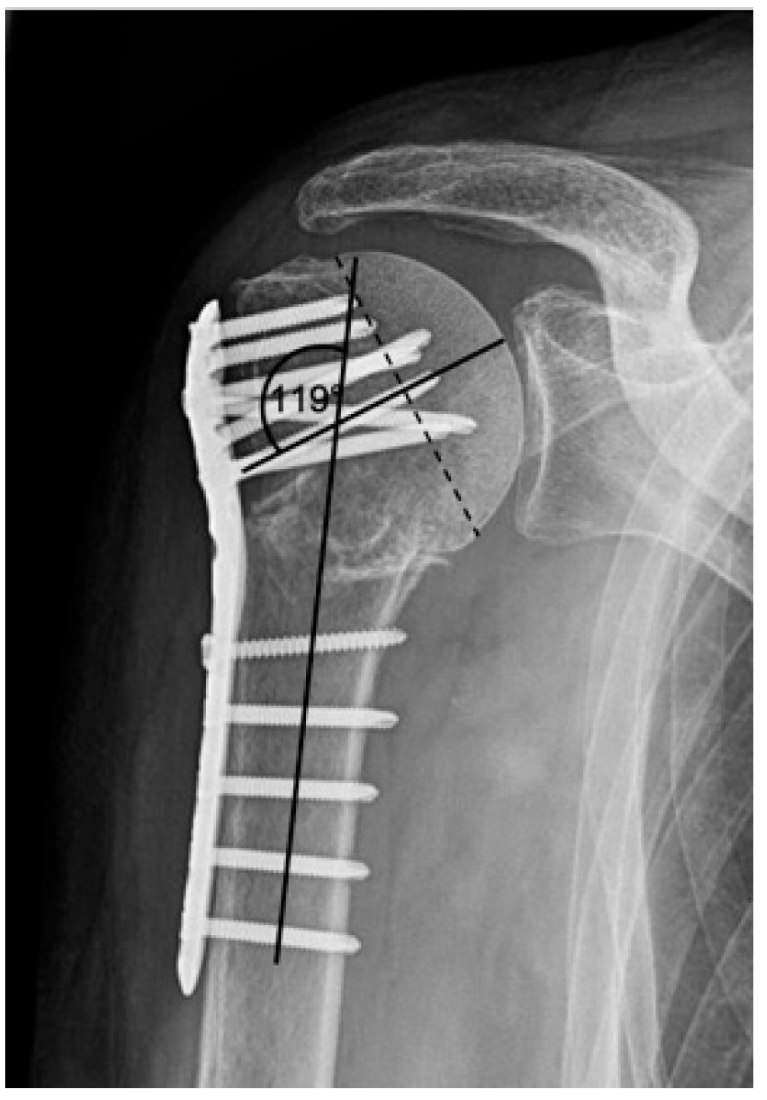
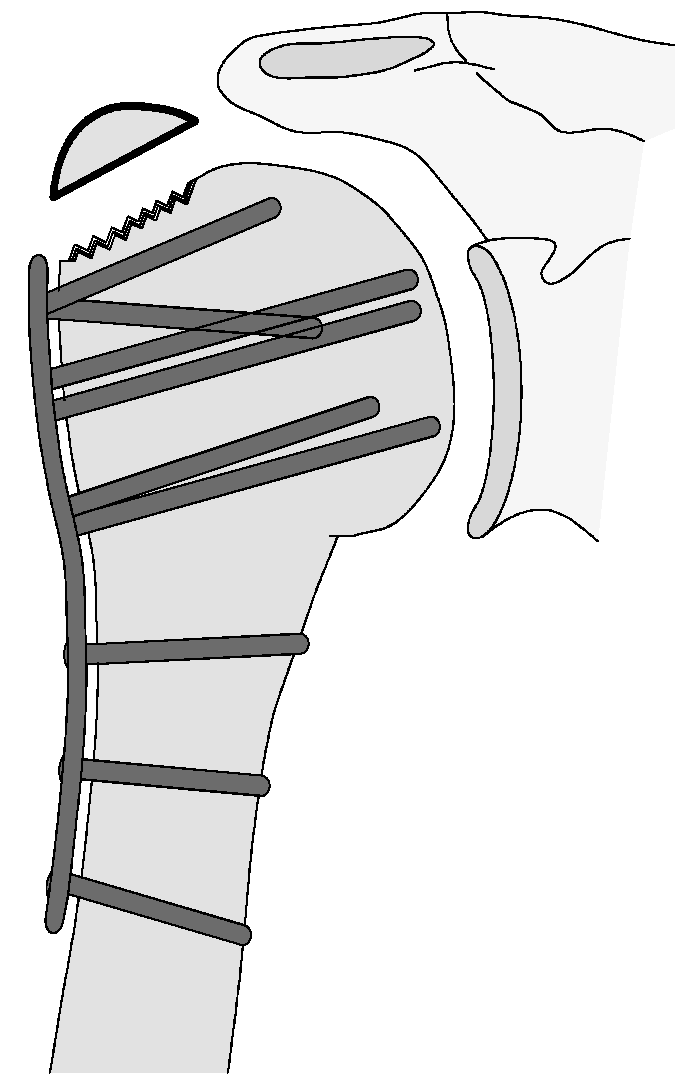
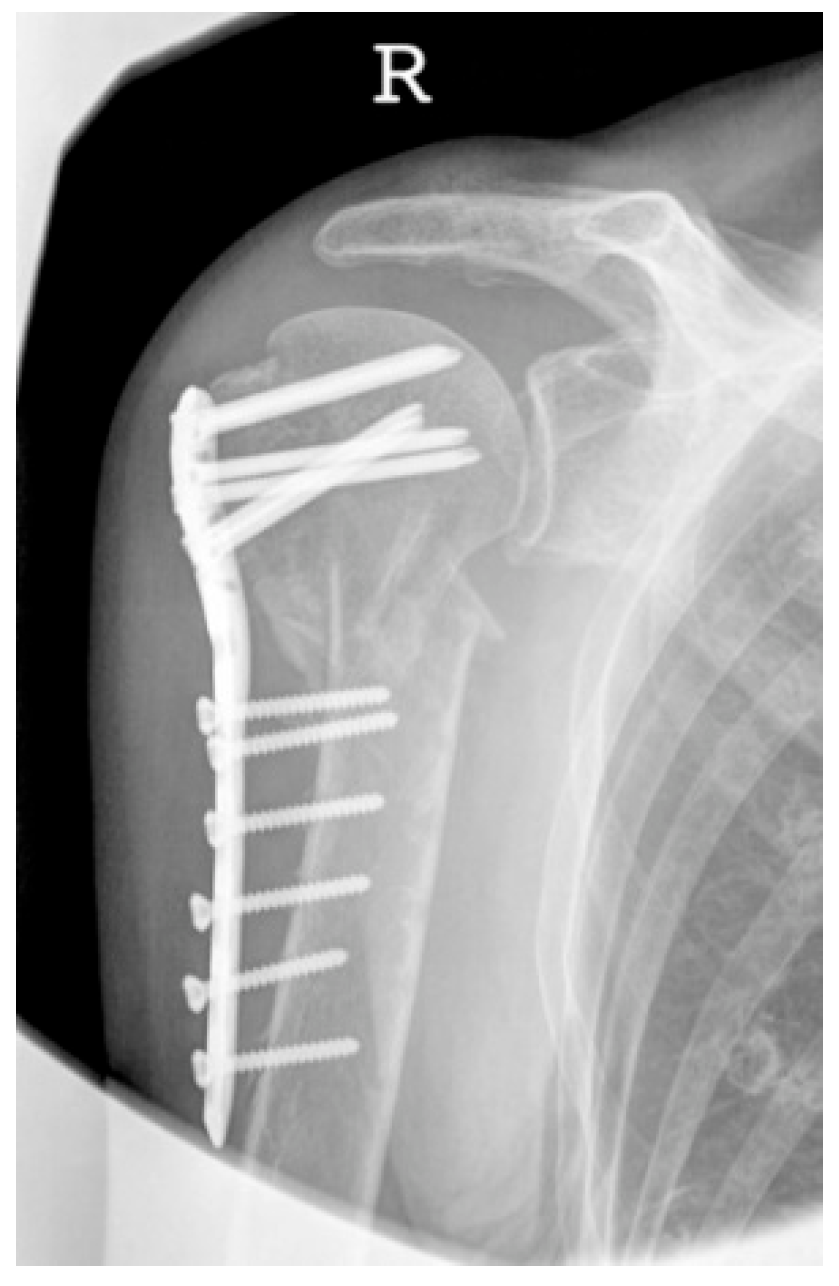
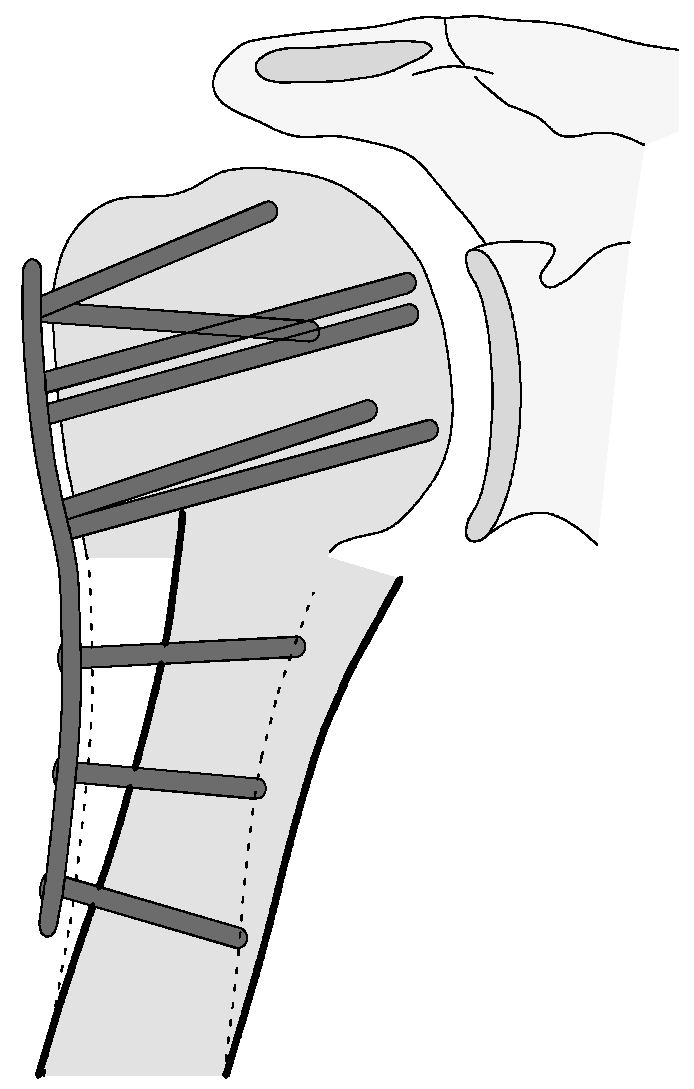
| 2c |  | Type 2c is defined by a severe varus displacement (>20°) of the humeral head, which is associated with a screw cutout at the humeral head in parallel to Type 2a. In contrast to Type 2a, this varus displacement is characterized by an unstable osteosynthesis situation and progression. |
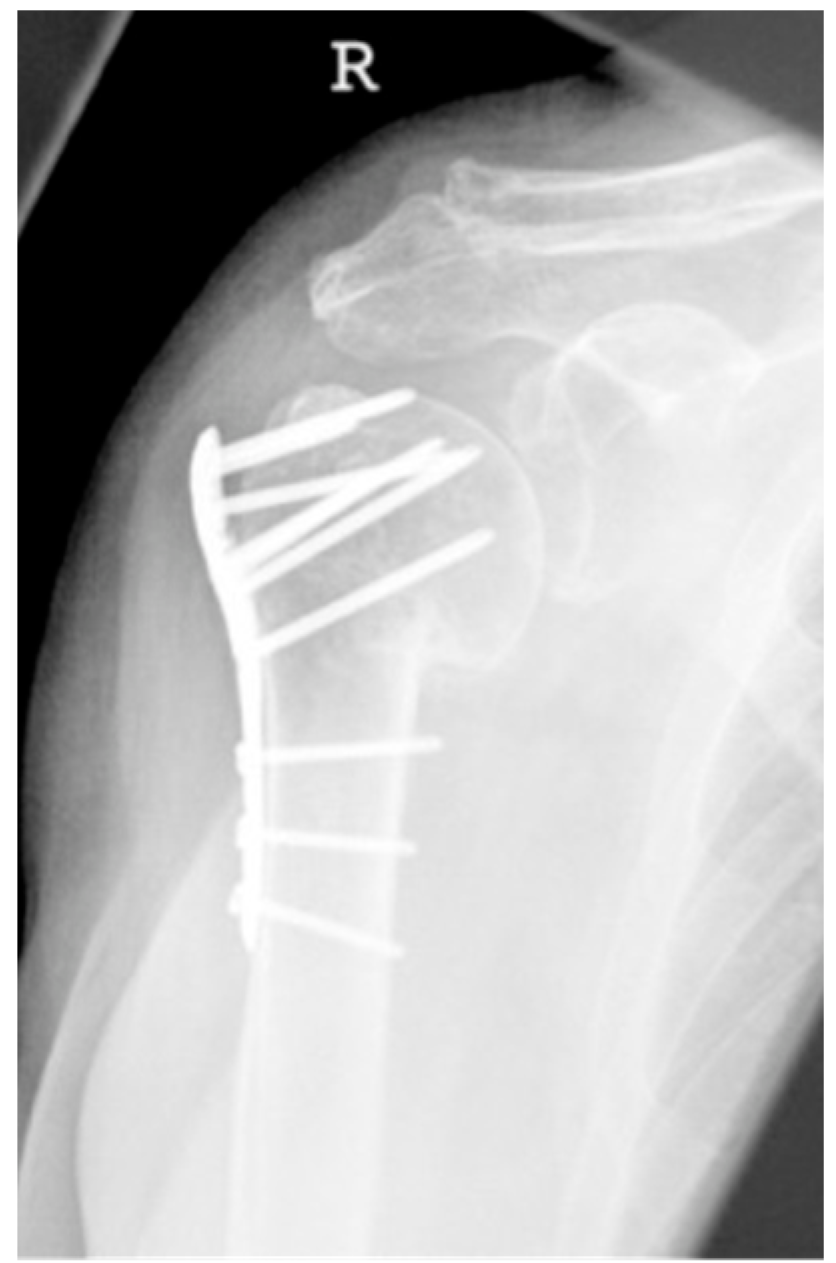
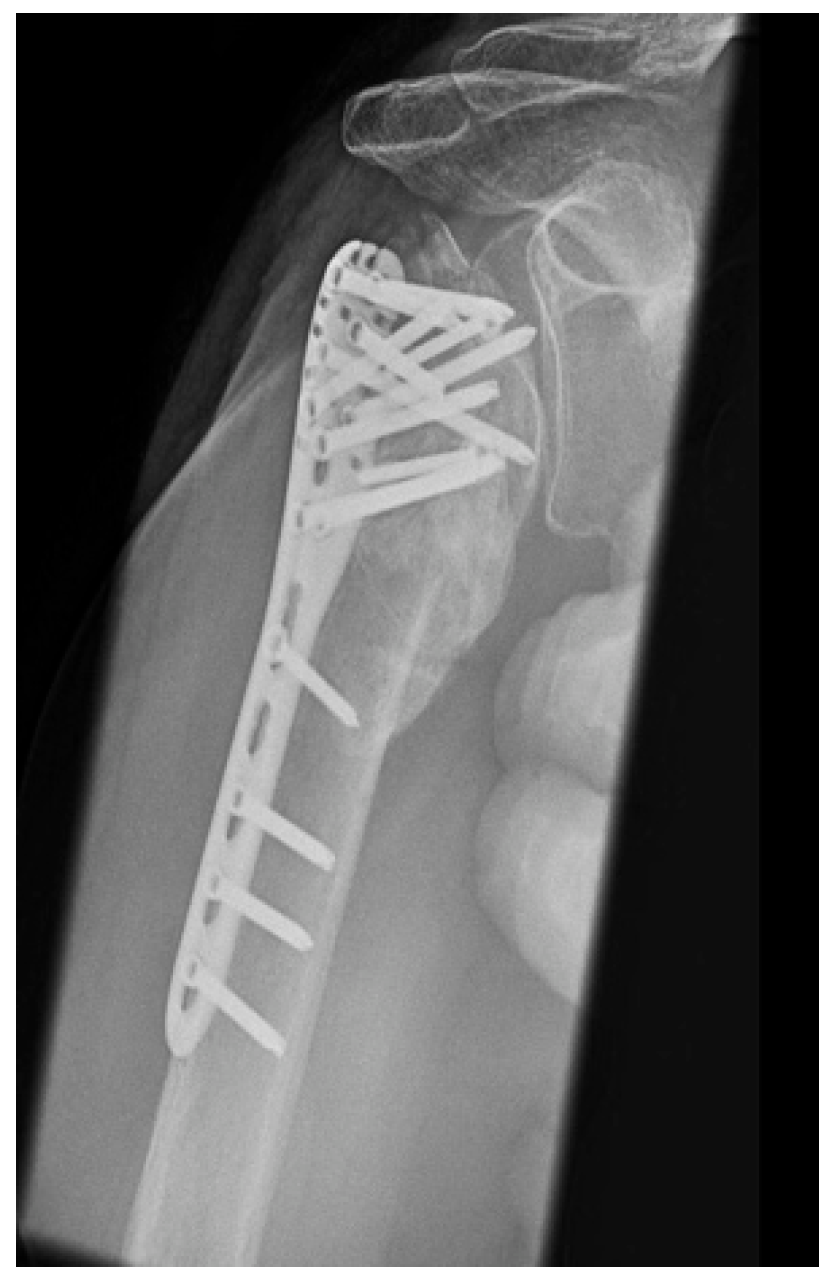
| 3 |  | Type 3 describes a displacement of the angular stable plate osteosynthesis with screw cutout/fracture avulsion in the humeral shaft region, while the humeral head position remains intact. |
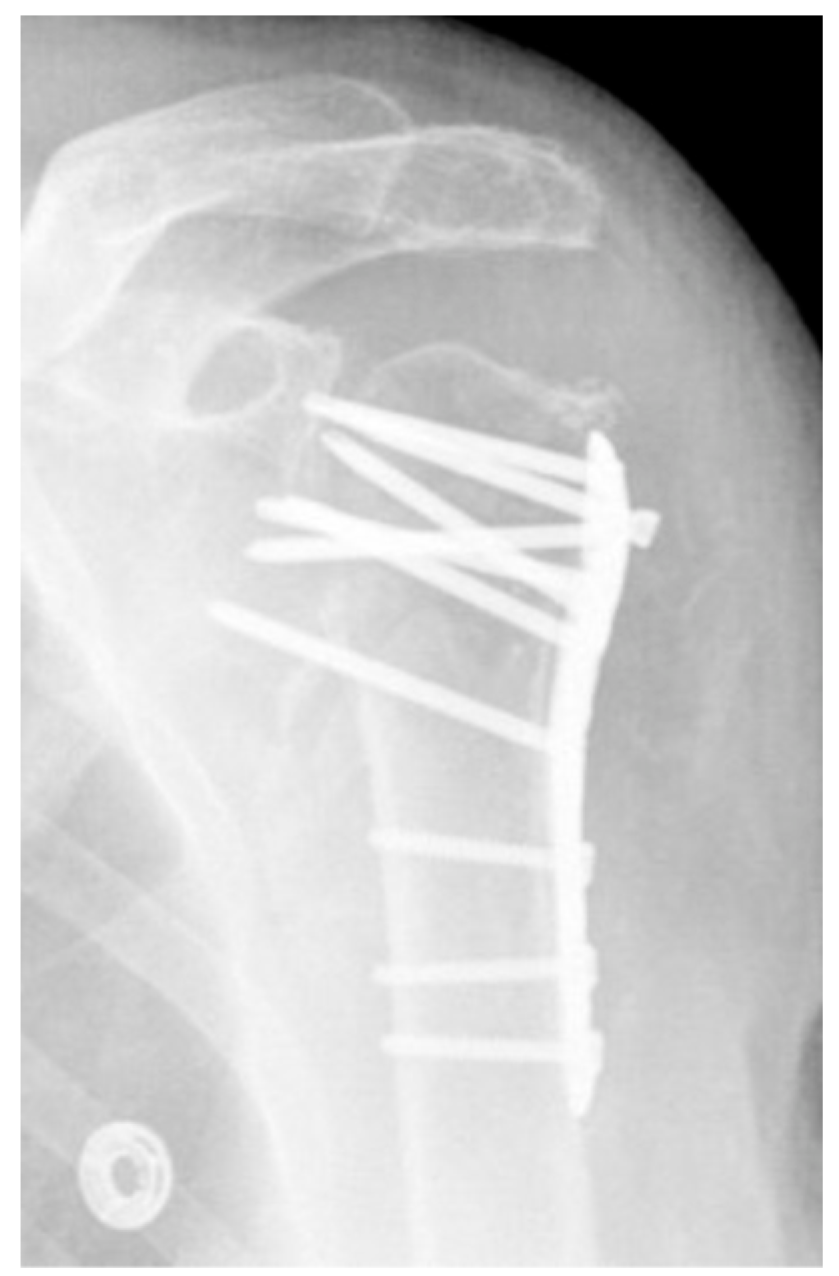
| 4 |  | Complication Type 4a is based on the presence of AVN of the humeral head without concomitant destruction of the glenoid articular surface due to an associated screw cutout through the humeral head cortex. |
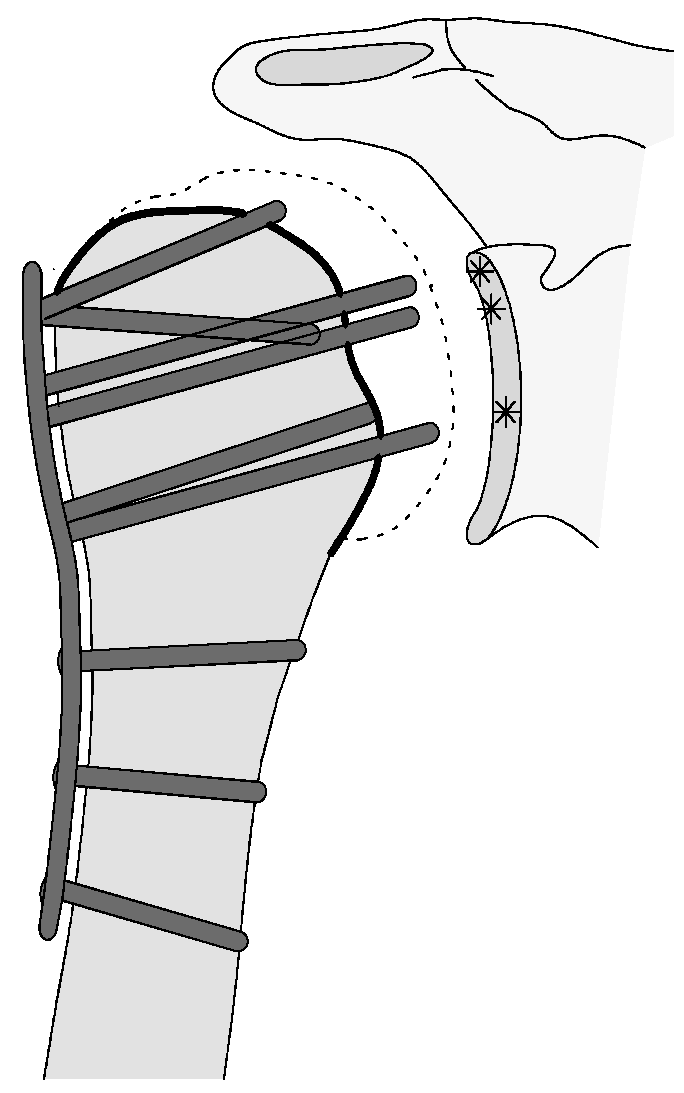
| 4b |  | Complication Type 4b is also based on the presence of an AVN of the humeral head combined with a destruction of the glenoid articular surface due to the associated screw cutout through the humeral head cortex. |
| n | % Complications | % Total (n = 787) | Age in Years (Mean, SD) | Distribution Men to Women, Percent Women (%) | |
|---|---|---|---|---|---|
| Type 1 | 54 | 28.0 | 6.9 | 69.1 ± 12.1 | 19/35 |
| Type 2a | 41 | 21.2 | 5.2 | 75.1 ± 11.9 | 11/30 |
| Type 2b | 13 | 6.7 | 1.6 | 77.8 ± 7.5 | 2/11 |
| Type 2c | 25 | 13.0 | 3.2 | 71.4 ± 13.1 | 7/18 |
| Type 3 | 18 | 9.3 | 2.3 | 82.7 ± 9.1 | 6/12 |
| Type 4a | 34 | 17.6 | 4.3 | 66.4 ± 13.0 | 12/22 |
| Type 4b | 8 | 4.2 | 1.0 | 69.3 ± 14.6 | 4/4 |
| Total Complications | 193 | 100 | 24.5 | 72.1 ± 12.9 | 61/132 (68.4%) |
| Total | 787 | 66.5 ± 15.6 | 255/532 (67.6%) |
| CS (Mean, SD) | nCS (Mean, SD) | %CS (Mean, SD) | Follow-up (Mean, SD; Median) | |
|---|---|---|---|---|
| Case Cohort | 68.4 ± 20.3 p. (n = 557) | 80.4 ± 23.8 p. (n = 557) | 83.9 ± 28.1% (n = 517) | CS/nCS: 4.0 ± 2.7; 3.3 %CS: 3.5 ± 2.5; 2.8 |
| Cohort without complications CC | 72.1 ± 19.0 p. (n = 440) | 84.7 ± 21.9 p. (n = 440) | 87.2 ± 27.9% (n = 411) | CS/nCS: 4.2 ± 2.9; 3.2 %CS: 4.4 ± 2.7; 3.8 |
| Cohort with complications CWC | 54.5 ± 19.0 p. (n = 117) | 64.5 ± 229 p. (n = 117) | 71.2 ± 25.0% (n = 106) | CS/nCS: 3.3 ± 2.5; 2.8 %CS: 3.5 ± 2.5; 2.8 |
| Type 1 | 64.7 ± 16.7 p. (n = 37) | 76.2 ± 20.3 p. (n = 37) | 84.5 ± 18.0% (n = 31) | CS/nCS: 3.2 ± 1.9; 3.1 %CS: 3.5 ± 1.8; 3.3 |
| Type 2a | 58.7 ± 17.5 p. (n = 29) | 70.0 ± 21.6 p. (n = 29) | 77.5 ± 24.6% (n = 28) | CS/nCS: 2.7 ± 2.2; 1.9 %CS: 2.8 ± 2.2; 2.1 |
| Type 2b | 33.2 ± 13.0 p. (n = 5) | 40.0 ± 16.6 p. (n = 5) | 42.0 ± 20.2% (n = 5) | CS/nCS/%CS: 1.2 ± 0.8; 0.9 |
| Type 2c | 39.3 ± 17.1 p. (n = 9) | 48.0 ± 21.1 p. (n = 9) | 65.3 ± 28.5% (n = 9) | CS/nCS/%CS: 3.3 ± 2.7; 2.2 |
| Type 3 | 52.7 ± 9.4 p. (n = 7) | 63.7 ± 12.2 p. (n = 7) | 74.1 ± 20.5% (n = 6) | CS/nCS: 2.7 ± 2.7; 1.0 %CS: 3.1 ± 2.7; 2.4 |
| Type 4a | 46.4 ± 17.2 p. (n = 23) | 54.2 ± 20.4 p. (n = 23) | 57.3 ± 20.4% (n = 21) | CS/nCS: 4.7 ± 3.2; 3.5 %CS: 5.0 ± 3.3; 4.0 |
| Type 4b | 46.3 ± 14.0 p. (n = 7) | 53.4 ± 14.9 p. (n = 7) | 52.9 ± 15.1% (n = 6) | CS/nCS: 3.6 ± 2.1; 3.3 %CS: 3.8 ± 2.2; 4.0 |
| Type 1 | Type 2a | Type 2b | Type 2c | Type 3 | Type 4a | Type 4b | Total | |
|---|---|---|---|---|---|---|---|---|
| Early-IR (<9 Month.) | 5 | 9 (35%) | 3 (25%) | 2 (8%) | 1 (7%) | 13 (39%) | 2 (20%) | 35 |
| IR | 9 | 4 (15%) | 1 (8%) | 2 (8%) | 0 | 7 (21%) | 0 | 23 |
| screw replacement/removal | 1 | 13 (50%) | 1 (8%) | 3 (12%) | 0 | 5 (15%) | 0 | 23 |
| Reosteosynthesis | 0 | 0 | 3 (25%) | 4 (16%) | 11 (73%) | 0 | 0 | 18 |
| Resection | 0 | 0 | 0 | 2 (8%) | 0 | 0 | 1 (10%) | 3 |
| intramedullary nailing | 0 | 0 | 0 | 1 (4%) | 2 (13%) | 0 | 0 | 3 |
| Hemiarthroplasty | 0 | 0 | 2 (17%) | 4 (16%) | 1 (7%) | 5 (15%) | 0 | 12 |
| Reverse Arthroplasty | 0 | 0 | 2 (17%) | 7 (28%) | 0 | 3 (10%) | 7 (70%) | 19 |
| Total | 15 | 26 | 12 | 25 | 15 | 33 | 10 | 136 |
| No Revision | 39 | 17 | 5 | 4 | 4 | 6 | 0 | 75 |
| Revision rate | 28% | 59% | 62% | 84% | 78% | 82% | 100% | 61% |
| Neer- Classification | 2-Part Fracture | 3-Part Fracture | 4-Part Fracture | Head-Split-Fracture | Fracture-Dislocation |
|---|---|---|---|---|---|
| % Complication | 17.4 | 20.6 | 35.8 | 51.5 | 32.5 |
| Type 1 | Type 2a | Type 2b | Type 2c | Type 3 | Type 4a | Type 4b | |
|---|---|---|---|---|---|---|---|
| 2-part fracture | 12 | 9 | 0 | 8 (35%) | 7 (39%) | 2 | 0 |
| 3-part fracture | 24 (44%) | 19 (46%) | 5 | 8 (35%) | 9 (50%) | 7 | 1 |
| 4-part fracture | 12 | 9 | 6 (46%) | 5 | 0 | 14 (41%) | 3 (43%) |
| Head-Split-Fractur | 2 | 2 | 1 | 0 | 2 | 7 (21%) | 3 (43%) |
| Fracture-Dislocation | 4 | 2 | 1 | 2 | 0 | 4 | 0 |
| A2 | 7 | 2 | 0 | 2 | 2 | 1 | 0 |
| A3 | 6 | 6 | 0 | 6 (26%) | 6 (33%) | 1 | 0 |
| B1 | 12 (22%) | 12 (29%) | 2 | 2 | 1 | 2 | 1 |
| B2 | 14 (26%) | 6 | 3 | 7 (30%) | 7 (39%) | 5 | 0 |
| B3 | 2 | 2 | 0 | 1 | 0 | 3 | 0 |
| C1 | 2 | 5 | 2 | 1 | 0 | 1 | 0 |
| C2 | 10 | 6 | 5 (38%) | 3 | 1 | 16 (47%) | 5 (71%) |
| C3 | 1 | 2 | 1 | 1 | 1 | 5 | 1 |
| No X-Rays | 0 | 0 | 0 | 2 | 0 | 0 | 1 |
Disclaimer/Publisher’s Note: The statements, opinions and data contained in all publications are solely those of the individual author(s) and contributor(s) and not of MDPI and/or the editor(s). MDPI and/or the editor(s) disclaim responsibility for any injury to people or property resulting from any ideas, methods, instructions or products referred to in the content. |
© 2023 by the authors. Licensee MDPI, Basel, Switzerland. This article is an open access article distributed under the terms and conditions of the Creative Commons Attribution (CC BY) license (https://creativecommons.org/licenses/by/4.0/).
Share and Cite
Siebenbürger, G.; Neudeck, R.; Daferner, M.P.; Fleischhacker, E.; Böcker, W.; Ockert, B.; Helfen, T. It Is Always the Same—A Complication Classification following Angular Stable Plating of Proximal Humeral Fractures. J. Clin. Med. 2023, 12, 2556. https://doi.org/10.3390/jcm12072556
Siebenbürger G, Neudeck R, Daferner MP, Fleischhacker E, Böcker W, Ockert B, Helfen T. It Is Always the Same—A Complication Classification following Angular Stable Plating of Proximal Humeral Fractures. Journal of Clinical Medicine. 2023; 12(7):2556. https://doi.org/10.3390/jcm12072556
Chicago/Turabian StyleSiebenbürger, Georg, Rouven Neudeck, Mark Philipp Daferner, Evi Fleischhacker, Wolfgang Böcker, Ben Ockert, and Tobias Helfen. 2023. "It Is Always the Same—A Complication Classification following Angular Stable Plating of Proximal Humeral Fractures" Journal of Clinical Medicine 12, no. 7: 2556. https://doi.org/10.3390/jcm12072556