
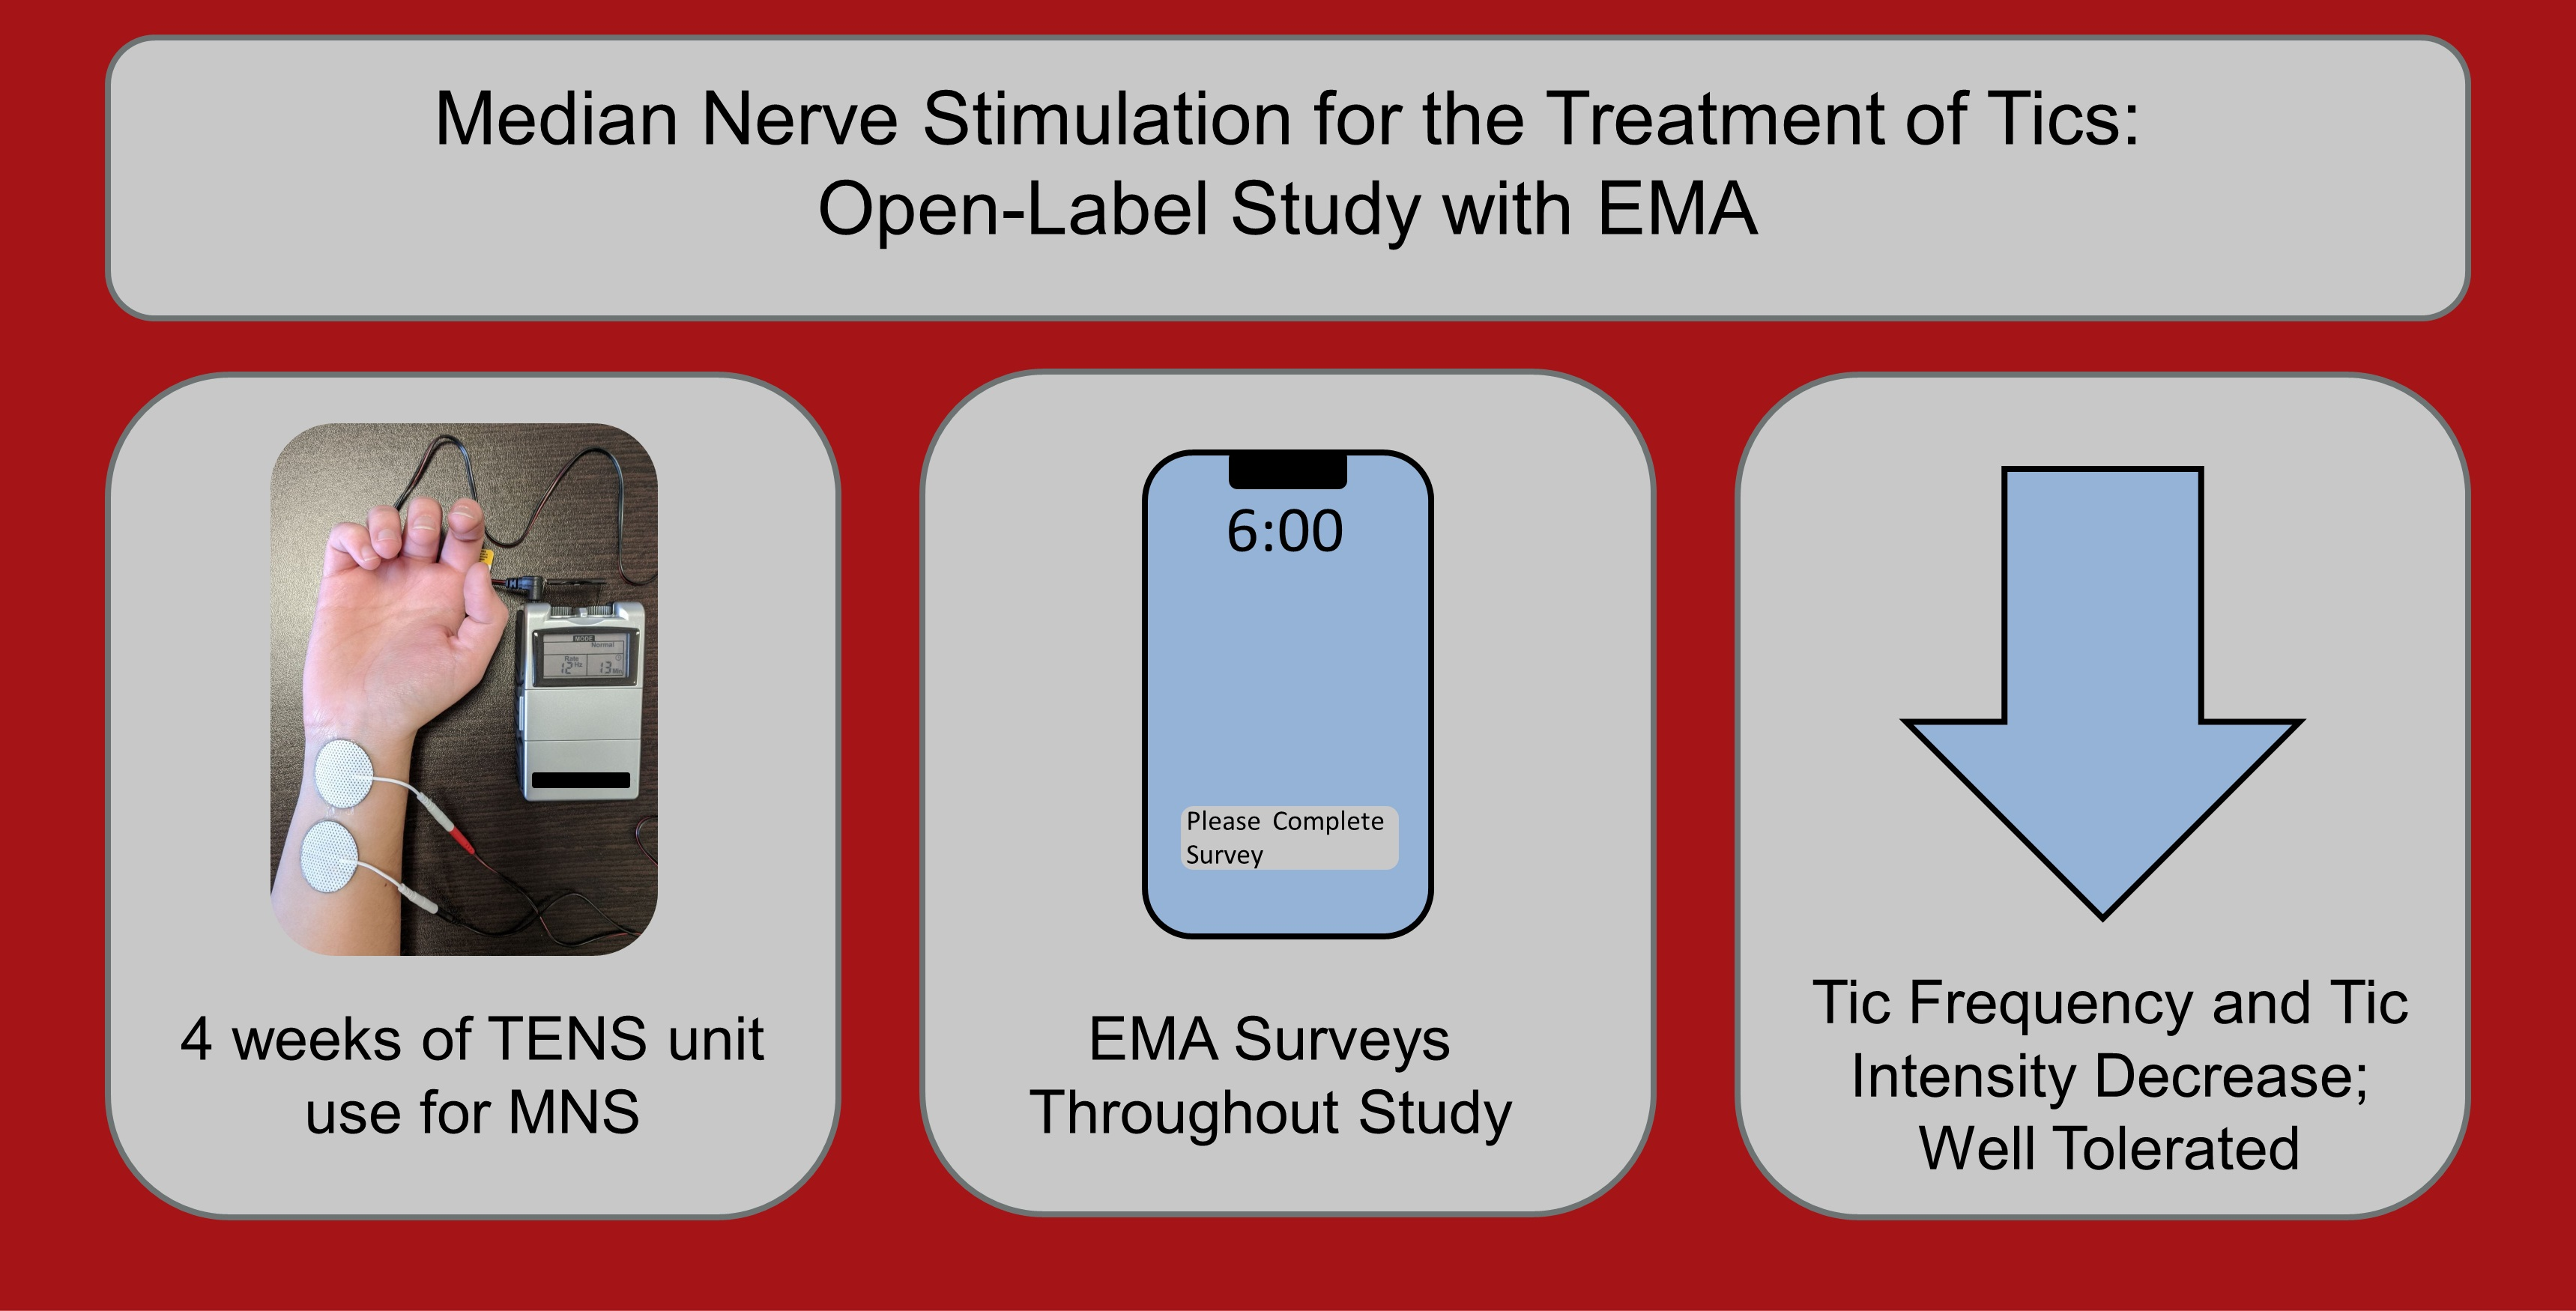
Median Nerve Stimulation for Treatment of Tics: A 4-Week Open Trial with Ecological Momentary Assessment

Abstract
:
1. Introduction
2. Materials and Methods
2.1. Ethics Approval
2.2. Companion Randomized Controlled Trial
2.3. Study Design
2.4. Participants
2.5. Intervention
2.6. Outcome Measures
2.7. Statistical Analysis
3. Results
3.1. Participants
3.2. Outcomes
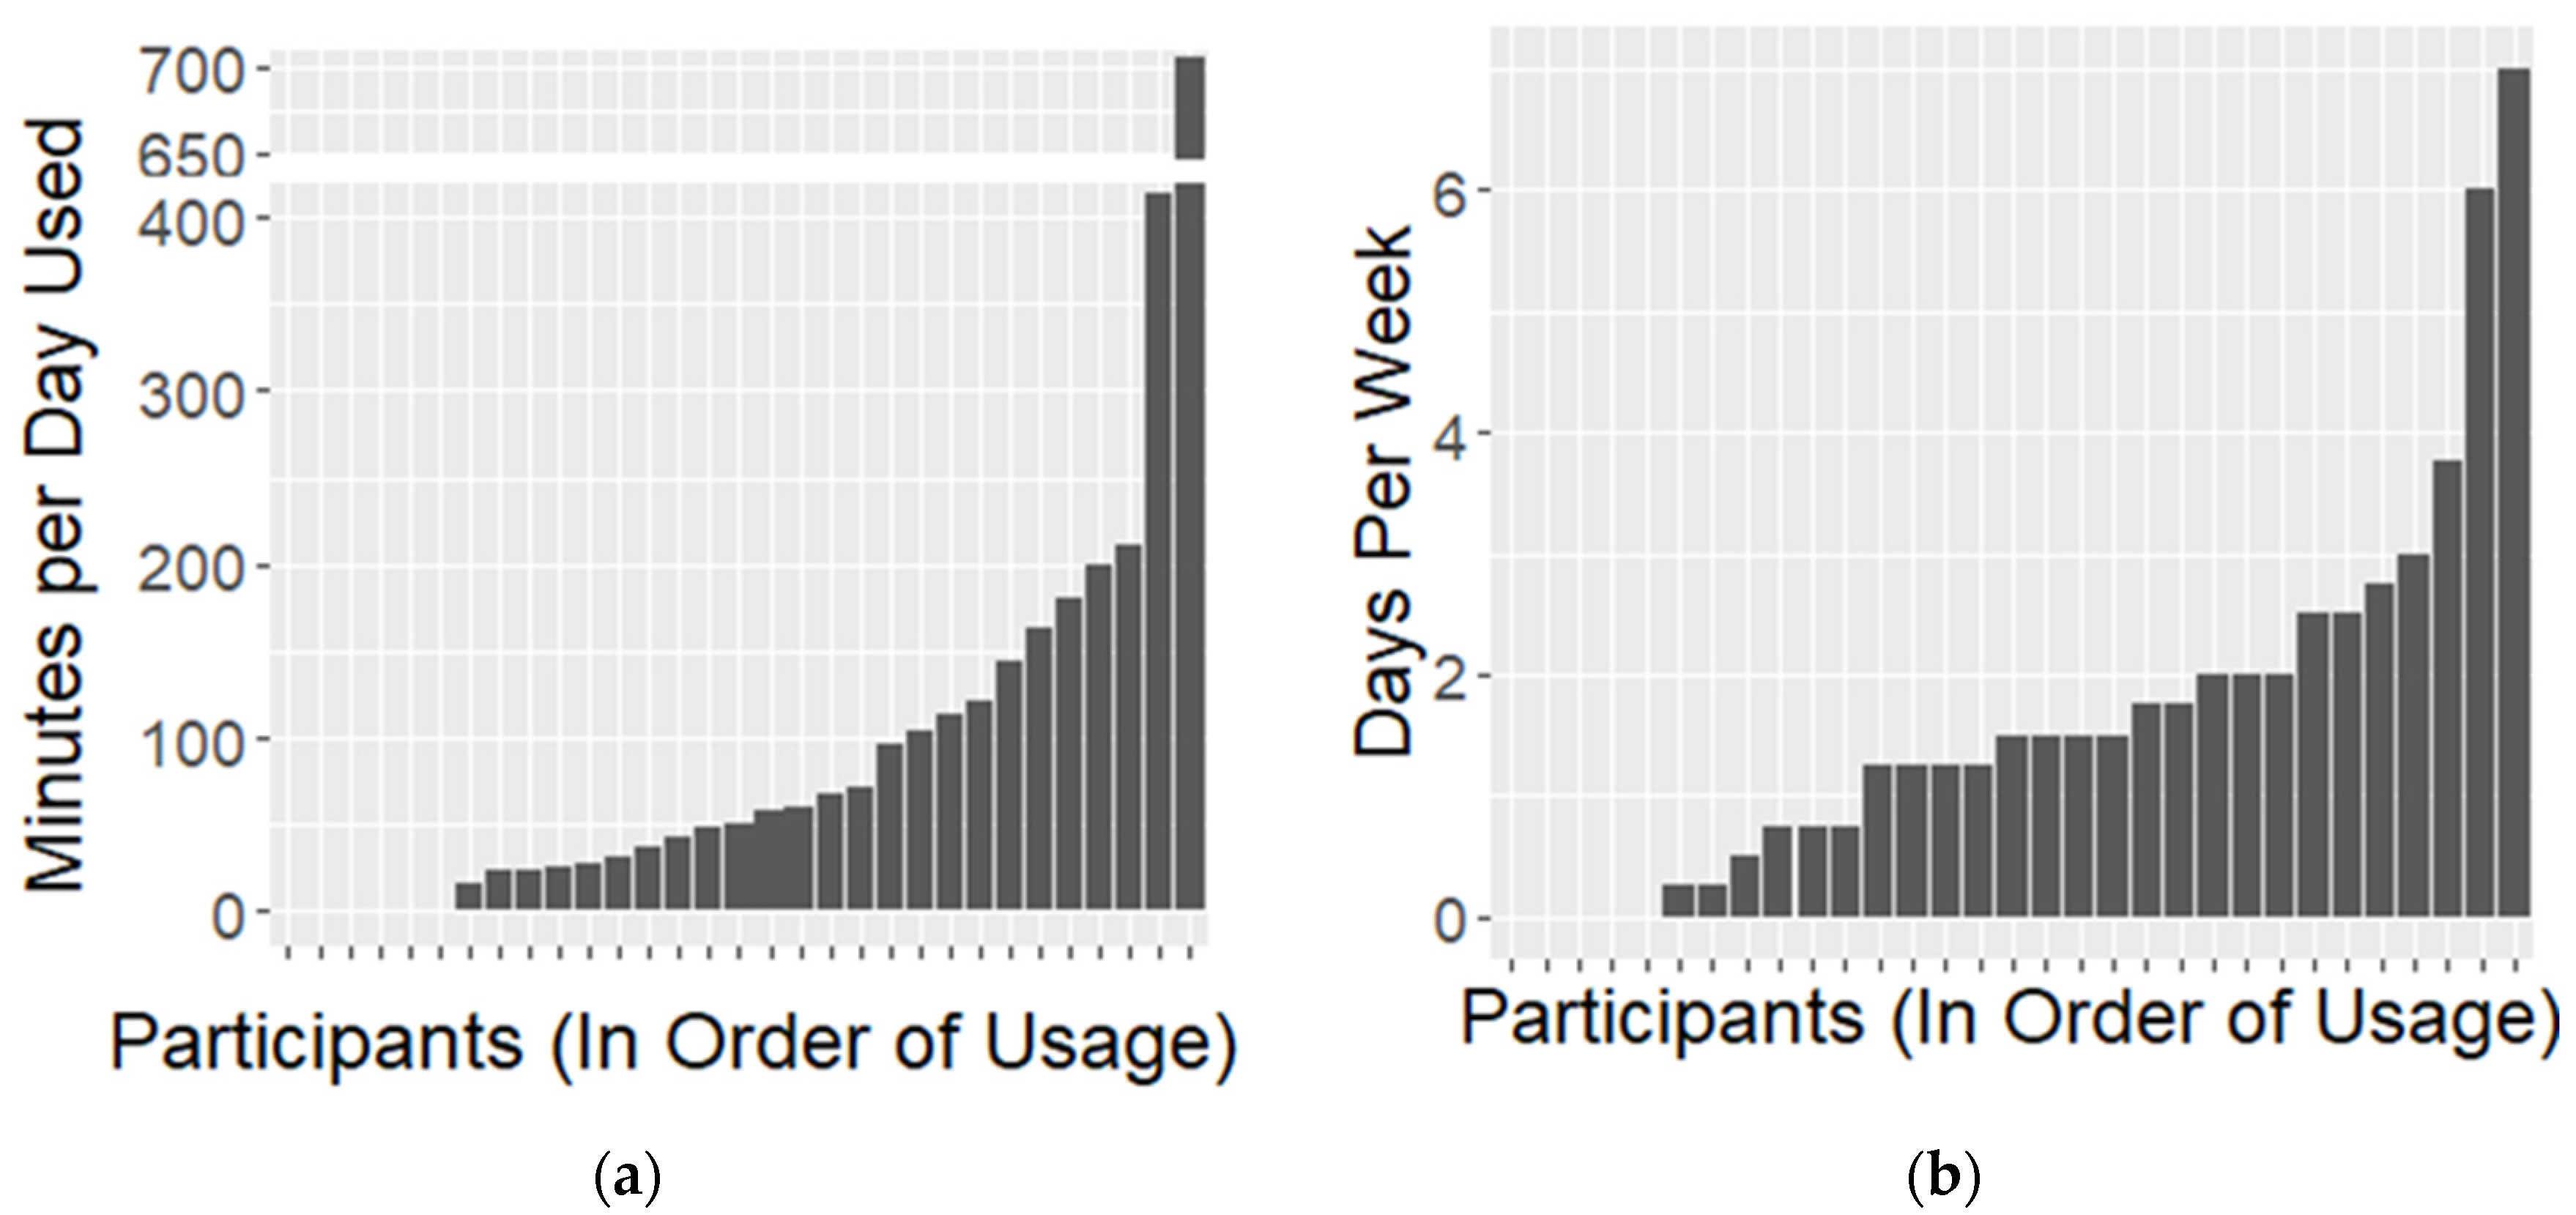
3.3. Usage Patterns
3.4. Daily Survey Results
3.5. Duration of Improvement in Symptoms after Stimulation Ends
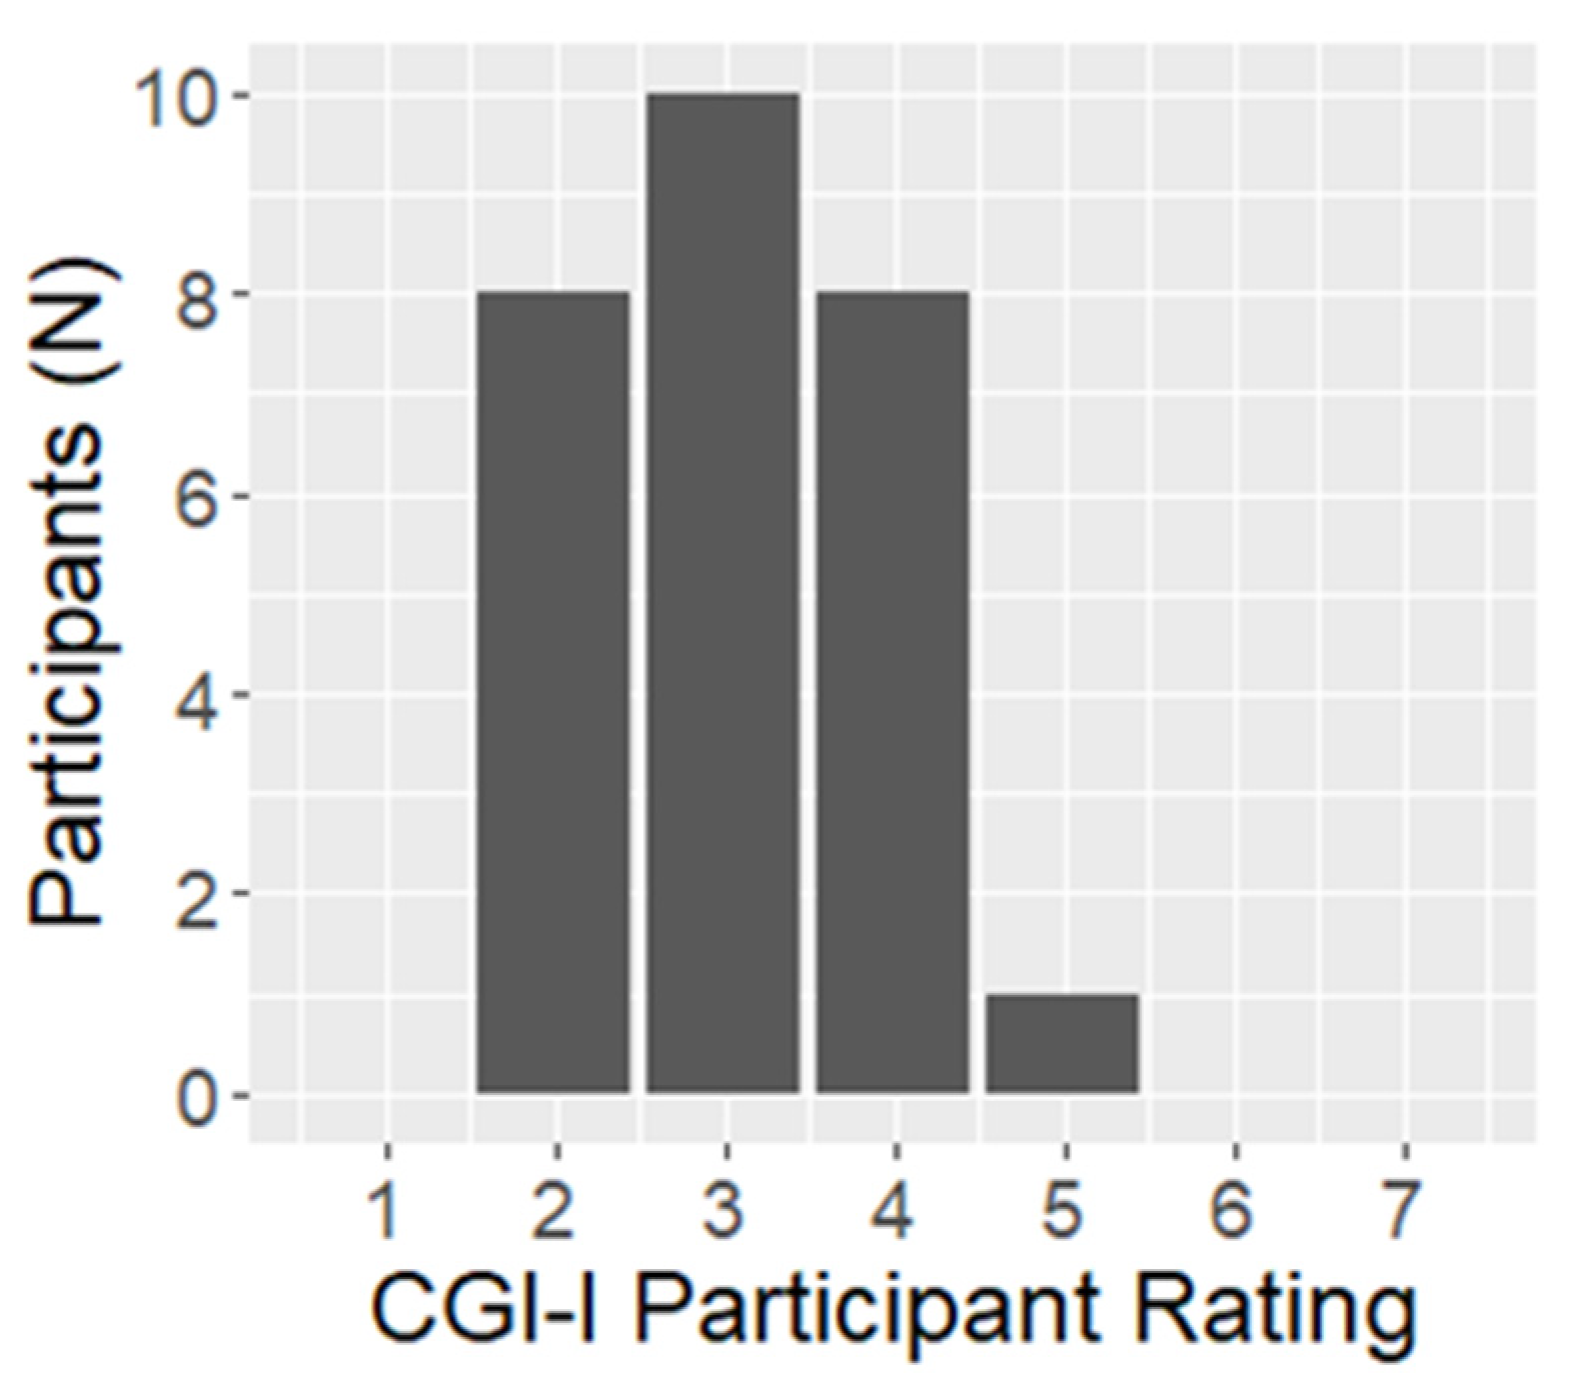
3.6. Final Survey Results
3.7. Responders Analysis
3.8. Open-ended Comments and Adverse Events
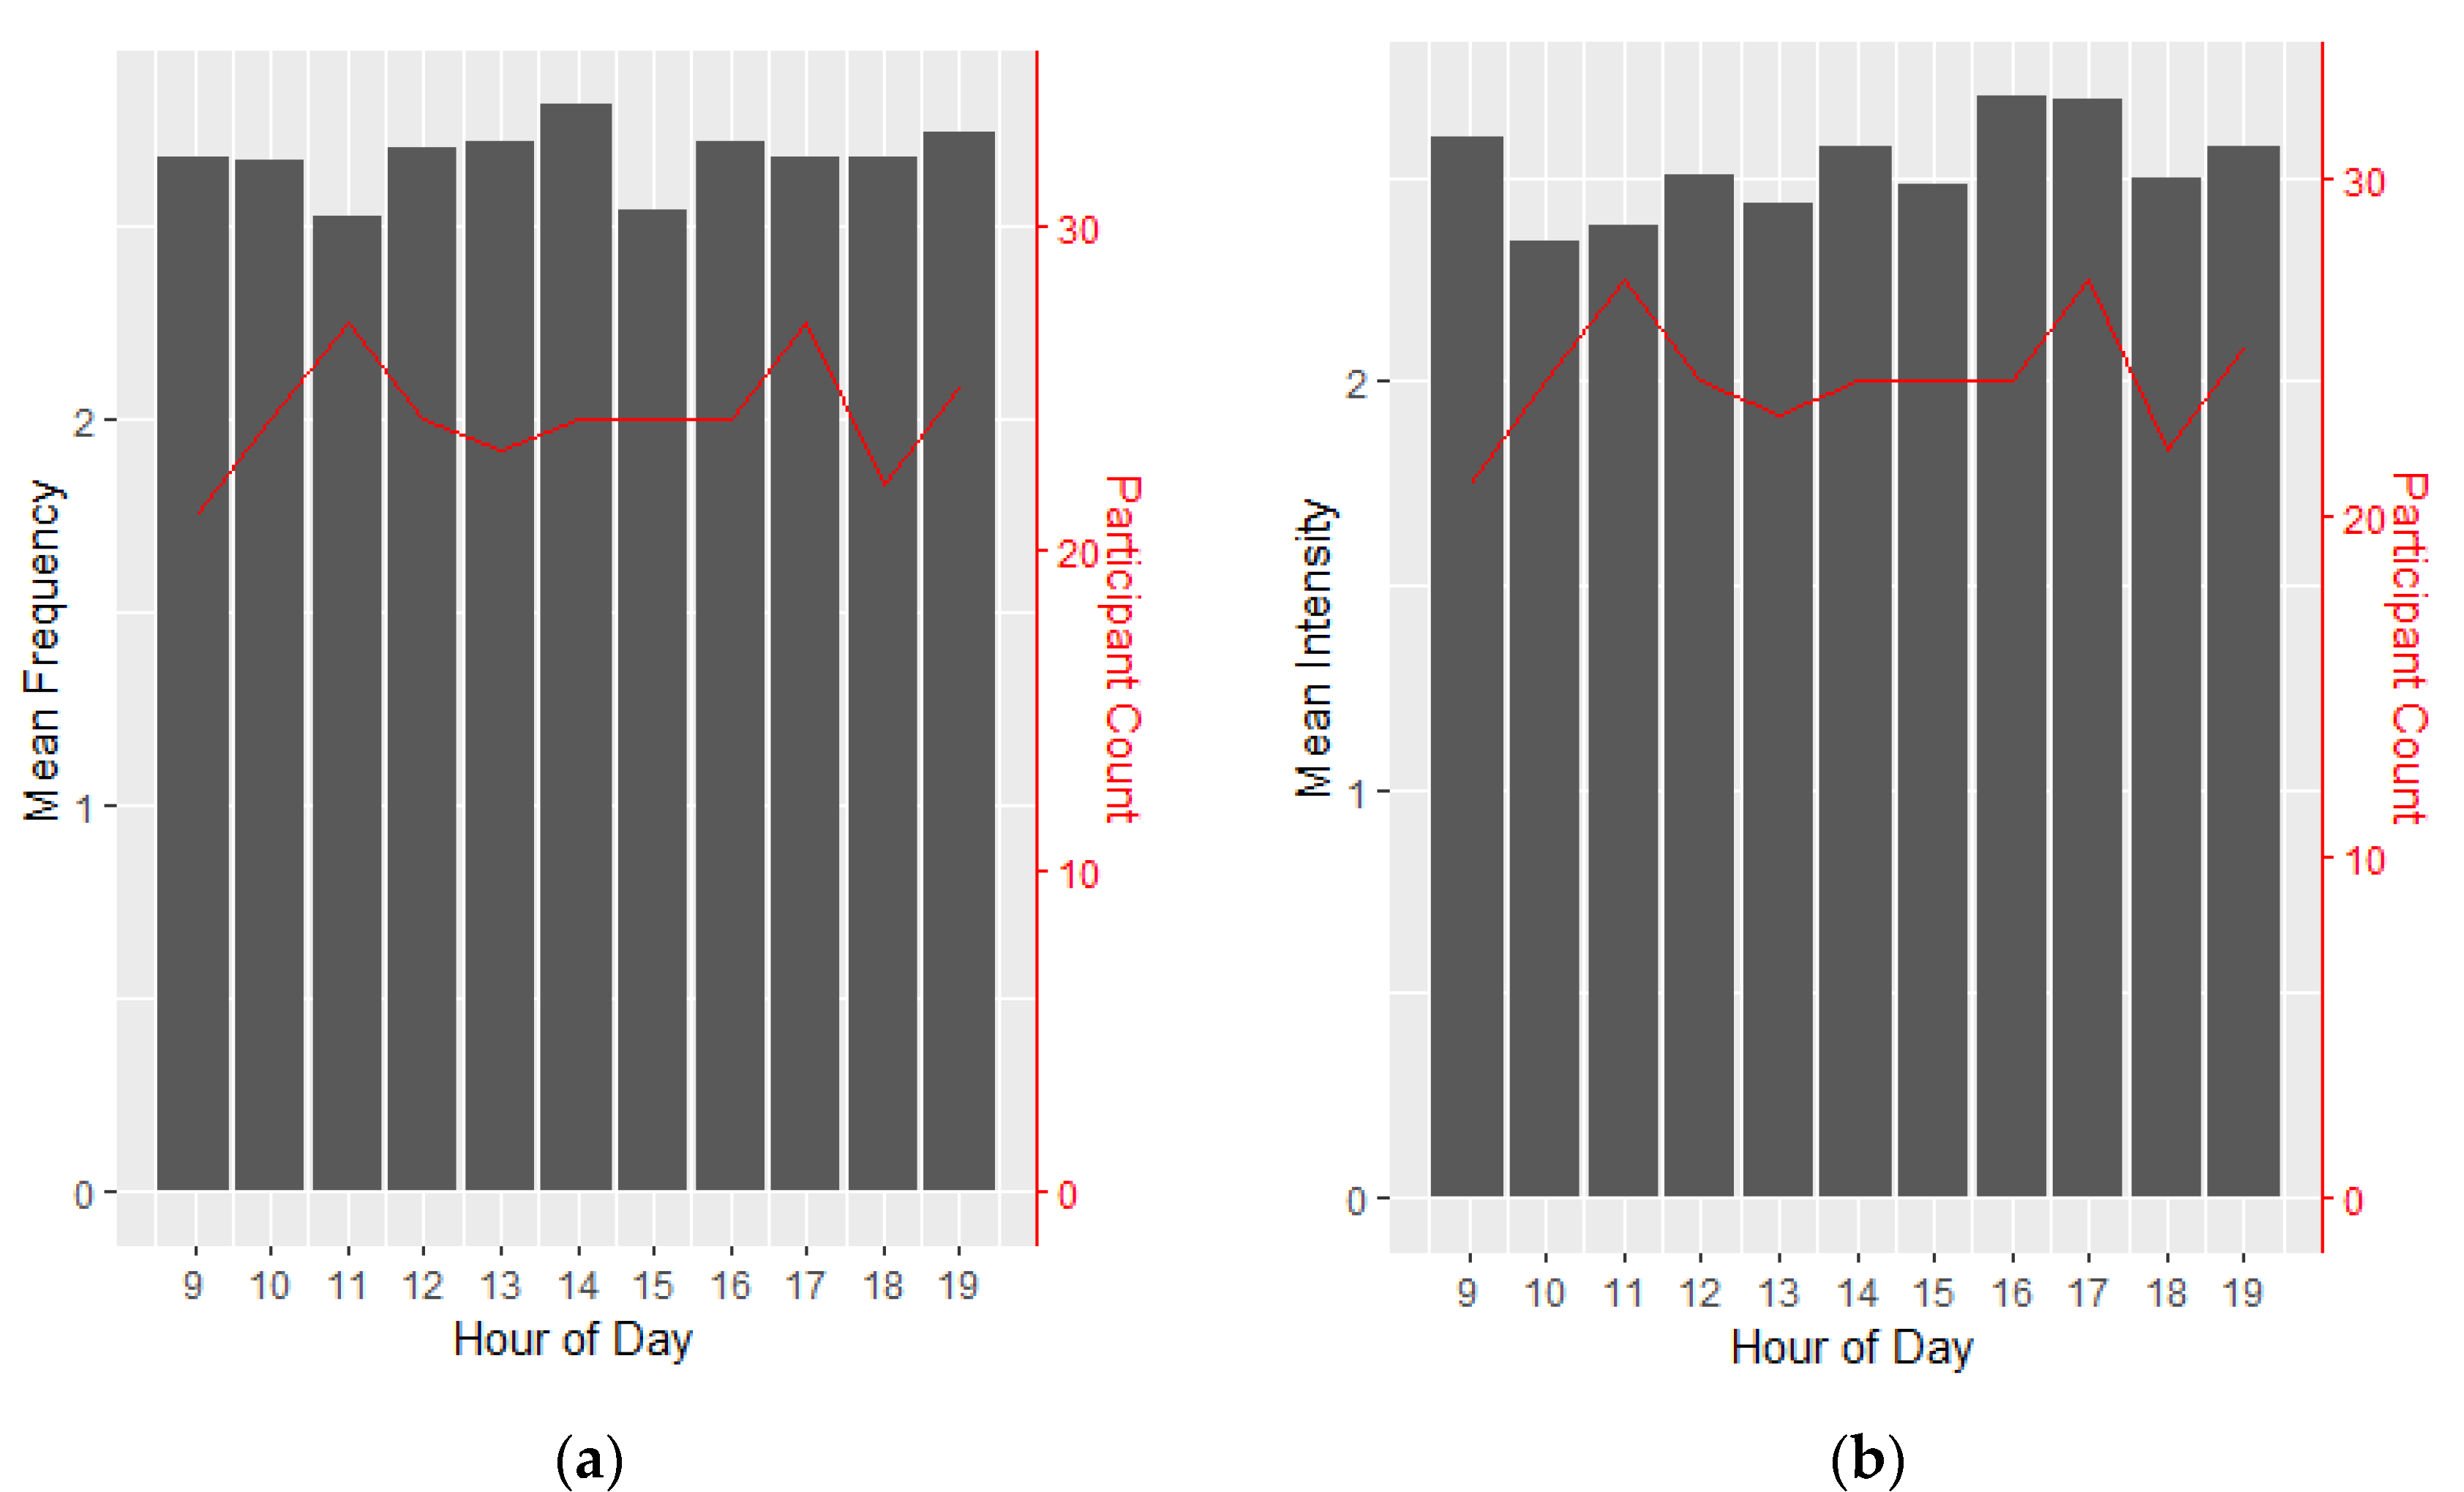
3.9. Diurnal Variation of Tics
4. Discussion
4.1. Limitations
4.2. Conclusions
4.3. Clinical Significance
Supplementary Materials
Author Contributions
Funding
Institutional Review Board Statement
Informed Consent Statement
Data Availability Statement
Acknowledgments
Conflicts of Interest
References
- Cuenca, J.; Glazebrook, C.; Kendall, T.; Hedderly, T.; Heyman, I.; Jackson, G.; Murphy, T.; Rickards, H.; Robertson, M.; Stern, J.; et al. Perceptions of treatment for tics among young people with Tourette syndrome and their parents: A mixed methods study. BMC Psychiatry 2015, 15, 46. [Google Scholar] [CrossRef] [PubMed] [Green Version]
- Tinker, S.C.; Bitsko, R.H.; Danielson, M.L.; Newsome, K.; Kaminski, J.W. Estimating the number of people with Tourette syndrome and persistent tic disorder in the United States. Psychiatry Res. 2022, 314, 114684. [Google Scholar] [CrossRef]
- American Psychiatric Association. Diagnostic and Statistical Manual of Mental Disorders: DSM-5; American Psychiatric Publishing: Washington, DC, USA, 2013. [Google Scholar]
- Hirschtritt, M.E.; Lee, P.C.; Pauls, D.L.; Dion, Y.; Grados, M.A.; Illmann, C.; King, R.A.; Sandor, P.; McMahon, W.M.; Lyon, G.J.; et al. Lifetime prevalence, age of risk, and genetic relationships of comorbid psychiatric disorders in Tourette syndrome. JAMA Psychiatry 2015, 72, 325–333. [Google Scholar] [CrossRef] [Green Version]
- Ueda, K.; Black, K.J. A Comprehensive Review of Tic Disorders in Children. J. Clin. Med. 2021, 10, 2479. [Google Scholar] [CrossRef] [PubMed]
- Seideman, M.F.; Seideman, T.A. A Review of the Current Treatment of Tourette Syndrome. J. Pediatr. Pharmacol. Ther. 2020, 25, 401–412. [Google Scholar] [CrossRef] [PubMed]
- Greene, D.J.; Kim, S.; Black, K.J.; Schlaggar, B.L. Neurobiology and functional anatomy of tic disorders. In Tourette Syndrome, 2nd ed.; Martino, D., Leckman, J.F., Eds.; Oxford University Press: Oxford, UK, 2022. [Google Scholar]
- Morera Maiquez, B.; Sigurdsson, H.P.; Dyke, K.; Clarke, E.; McGrath, P.; Pasche, M.; Rajendran, A.; Jackson, G.M.; Jackson, S.R. Entraining movement-related brain oscillations to suppress tics in Tourette syndrome. Curr. Biol. 2020, 30, 2334–2342.e2333. [Google Scholar] [CrossRef]
- Iverson, A.M.; Arbuckle, A.L.; Ueda, K.; Song, D.Y.; Bihun, E.C.; Koller, J.M.; Wallendorf, M.; Black, K.J. Median nerve stimulation for treatment of tics: Randomized, controlled, crossover trial. J. Clin. Med. 2023, 12, 2514. [Google Scholar] [CrossRef]
- Shiffman, S.; Stone, A.A.; Hufford, M.R. Ecological momentary assessment. Annu. Rev. Clin. Psychol. 2008, 4, 1–32. [Google Scholar] [CrossRef]
- Reeves, B.C.; Gaus, W. Guidelines for reporting non-randomised studies. Komplement. Kl. Nat. 2004, 11, 46–52. [Google Scholar] [CrossRef]
- Iverson, A.; Bihun, E.C.; Arbuckle, A.; Song, D.; Black, K.J. Public (MNS open-label). OSF 2021. [Google Scholar] [CrossRef]
- Iverson, A.; Ueda, K.; Arbuckle, A.; Bihun, E.C.; Koller, J.; Song, D.; Viehoever, A.; Wallendorf, M.; Black, K.J. Public (MNS pilot). Open Sci. Framew. 2020. [Google Scholar] [CrossRef]
- Leckman, J.F.; Riddle, M.A.; Hardin, M.T.; Ort, S.I.; Swartz, K.L.; Stevenson, J.; Cohen, D.J. The Yale Global Tic Severity Scale: Initial testing of a clinician-rated scale of tic severity. J. Am. Acad. Child. Adolesc. Psychiatry 1989, 28, 566–573. [Google Scholar] [CrossRef] [PubMed]
- Robertson, M.M.; Banerjee, S.; Kurlan, R.; Cohen, D.J.; Leckman, J.F.; McMahon, W.; Pauls, D.L.; Sandor, P.; van de Wetering, B.J. The Tourette syndrome diagnostic confidence index: Development and clinical associations. Neurology 1999, 53, 2108–2112. [Google Scholar] [CrossRef]
- Wilhelm, S.; Peterson, A.L.; Piacentini, J.; Woods, D.W.; Deckersbach, T.; Sukhodolsky, D.G.; Chang, S.; Liu, H.; Dziura, J.; Walkup, J.T.; et al. Randomized trial of behavior therapy for adults with Tourette syndrome. Arch. Gen. Psychiatry 2012, 69, 795–803. [Google Scholar] [CrossRef] [Green Version]
- Abramovitch, A.; Reese, H.; Woods, D.W.; Peterson, A.; Deckersbach, T.; Piacentini, J.; Scahill, L.; Wilhelm, S. Psychometric Properties of a Self-Report Instrument for the Assessment of Tic Severity in Adults With Tic Disorders. Behav. Ther. 2015, 46, 786–796. [Google Scholar] [CrossRef] [Green Version]
- Woods, D.W.; Piacentini, J.; Himle, M.B.; Chang, S. Premonitory Urge for Tics Scale (PUTS): Initial psychometric results and examination of the premonitory urge phenomenon in youths with tic disorders. J. Dev. Behav. Pediatr. 2005, 26, 397–403. [Google Scholar] [CrossRef]
- DuPaul, G.J.; Power, T.J.; Anastopoulos, A.D.; Reid, R. ADHD Rating Scale-IV: Checklists, Norms, and Clinical Interpretations; Guilford Press: New York, NY, USA, 1998. [Google Scholar]
- Scahill, L.; King, R.A.; Schultz, R.T.; Leckman, J.F. Selection and use of diagnostic and clinical rating instruments. In Tourette's Syndrome—Tics, Obsessions, Compulsions: Developmental Psychopathology and Clinical Care; Leckman, J.F., Cohen, D.J., Eds.; John Wiley & Sons, Inc.: New York, NY, USA, 1999; pp. 310–324. [Google Scholar]
- Goodman, W.K.; Price, L.H.; Rasmussen, S.A.; Mazure, C.; Fleischmann, R.L.; Hill, C.L.; Heninger, G.R.; Charney, D.S. The Yale-Brown Obsessive Compulsive Scale. I. Development, use, and reliability. Arch. Gen. Psychiatry 1989, 46, 1006–1011. [Google Scholar] [CrossRef] [PubMed]
- Goodman, W.K.; Price, L.H.; Rasmussen, S.A.; Mazure, C.; Delgado, P.; Heninger, G.R.; Charney, D.S. The Yale-Brown Obsessive Compulsive Scale. II. Validity. Arch. Gen. Psychiatry 1989, 46, 1012–1016. [Google Scholar] [CrossRef]
- Arbuckle, A.; Black, K.J. Setting Up the TENS Device for Median Nerve Stimulation. Available online: https://web.archive.org/web/20220904184235/https://tics.wustl.edu/participate/median-nerve-stimulation-study/setting-up-tens-device/ (accessed on 9 April 2022).
- Guy, W. CGI: Clinical Global Impressions. In ECDEU Assessment Manual for Psychopharmacology, Revised, 1976; National Institute of Mental Health: Rockville, MD, USA, 1976; pp. 217–222. [Google Scholar]
- Harris, P.A.; Taylor, R.; Thielke, R.; Payne, J.; Gonzalez, N.; Conde, J.G. Research electronic data capture (REDCap)—A metadata-driven methodology and workflow process for providing translational research informatics support. J. Biomed. Inform. 2009, 42, 377–381. [Google Scholar] [CrossRef] [Green Version]
- R Core Team. R: A Language and Environment for Statistical Computing. Available online: https://www.R-project.org/ (accessed on 20 March 2023).
- Xu, S.; Chen, M.; Feng, T.; Zhan, L.; Zhou, L.; Yu, G. Use ggbreak to effectively utilize plotting space to deal with large datasets and outliers. Front. Genet. 2021, 12, 774846. [Google Scholar] [CrossRef]
- Weber-Muller, F.; Reichert-Penetrat, S.; Schmutz, J.L.; Barbaud, A. Eczéma de contact aux polyacrylates du gel conducteur des électrodes de neurostimulation [Contact dermatitis from polyacrylate in TENS electrode]. Ann. Dermatol. Venereol. 2004, 131, 478–480. [Google Scholar] [CrossRef] [PubMed]
- McGuire, J.F.; Piacentini, J.; Storch, E.A.; Murphy, T.K.; Ricketts, E.J.; Woods, D.W.; Walkup, J.W.; Peterson, A.L.; Wilhelm, S.; Lewin, A.B.; et al. A multicenter examination and strategic revisions of the Yale Global Tic Severity Scale. Neurology 2018, 90, e1711–e1719. [Google Scholar] [CrossRef] [PubMed] [Green Version]
- Iverson, A.; Arbuckle, A.; Song, D.; Bihun, E.C.; Black, K.J. Median Nerve Stimulation for Treatment of Tics: A 4-Week, Open Trial with Ecological Momentary Assessment. OSF Preprints 2022. [Google Scholar] [CrossRef]


| Mean | SD | Median | IQR | |
|---|---|---|---|---|
| Age | 34.5 | 16.6 | 35 | 16–45 |
| Sex (male) | 64.5% | NA | NA | NA |
| YGTSS Impairment | 19.2 | 16.1 | 20 | 0–30 |
| YGTSS Total Tic Score | 24.9 | 9.1 | 25 | 20–29.5 |
| DCI | 60.9 | 20.2 | 56 | 44.5–78.5 |
| ATQ | 38.5 | 21.4 | 35 | 21.5–55 |
| PUTS | 21.7 | 7.2 | 23 | 15.5–27 |
| Distress/Impairment Last Week | 61.3% | NA | NA | NA |
| Distress/Impairment Lifetime | 100% | NA | NA | NA |
| Current Antipsychotic Use | 22.6% | NA | NA | NA |
| Current Alpha-2 Agonist Use | 9.7% | NA | NA | NA |
| Lifetime Antipsychotic Use | 35.5% | NA | NA | NA |
| Lifetime Alpha-2 Agonist Use | 51.6% | NA | NA | NA |
| Number of Treatments Tried | 3.9 | 3.8 | 3 | 1.0–5.5 |
| Successful Treatments | 0.6 | 1.0 | 0 | 0–1 |
| Adequate Behavior Therapy | 9.7% | NA | NA | NA |
| % of Participants with Family History of Tics in First Degree Relatives | 45.2% | NA | NA | NA |
| % of Participants with Family History of Tics, OCD, or ADHD in First Degree Relatives | 67.7% | NA | NA | NA |
| Y-BOCS Obsession Subtotal | 3.5 | 3.7 | 3 | 0–5.5 |
| Y-BOCS Compulsion Subtotal | 3.0 | 2.9 | 2 | 0–6 |
| Y-BOCS Total | 6.5 | 5.9 | 5 | 0–11 |
| ADHD Rating Scale | 13.2 | 13.3 | 7 | 2.5–20.5 |
| Outcome | Result | 95% C.I. | p | Type |
|---|---|---|---|---|
| Days per week device used (n = 31) | 1.5, 1.4 (median, IQR) | 1.1–2.3 | — | primary |
| Minutes per day used (n = 31) | 49.6, 93.0 (median, IQR) | 45.5–150.3 | — | primary |
| Number who plan to continue using device after 4 weeks (n = 27) | 21 yes (77.8%), 6 no | 62.1–93.4 | — | primary |
| Change in tic frequency when turning device OFF versus previous ON (n = 25 for t-test) | Turning off: 2.1 ± 1.1 (mean ± SD) Turning on: 3.1 ± 1.0 (mean ± SD) Difference: 1.0 (mean) | 0.6–1.4 | <0.001 (paired t test) | primary |
| Change in tic intensity when turning device OFF versus previous ON (n = 25 for t-test) | Turning off: 2.0 ± 1.1 (mean ± SD) Turning on: 2.9 ± 0.8 (mean ± SD) Difference: 0.9 (mean) | 0.6–1.9 | <0.001 a | primary |
| Mean discomfort while using stimulator (n = 26) | 1, 0.9 (median, IQR) | 1.0–1.7 | — | primary |
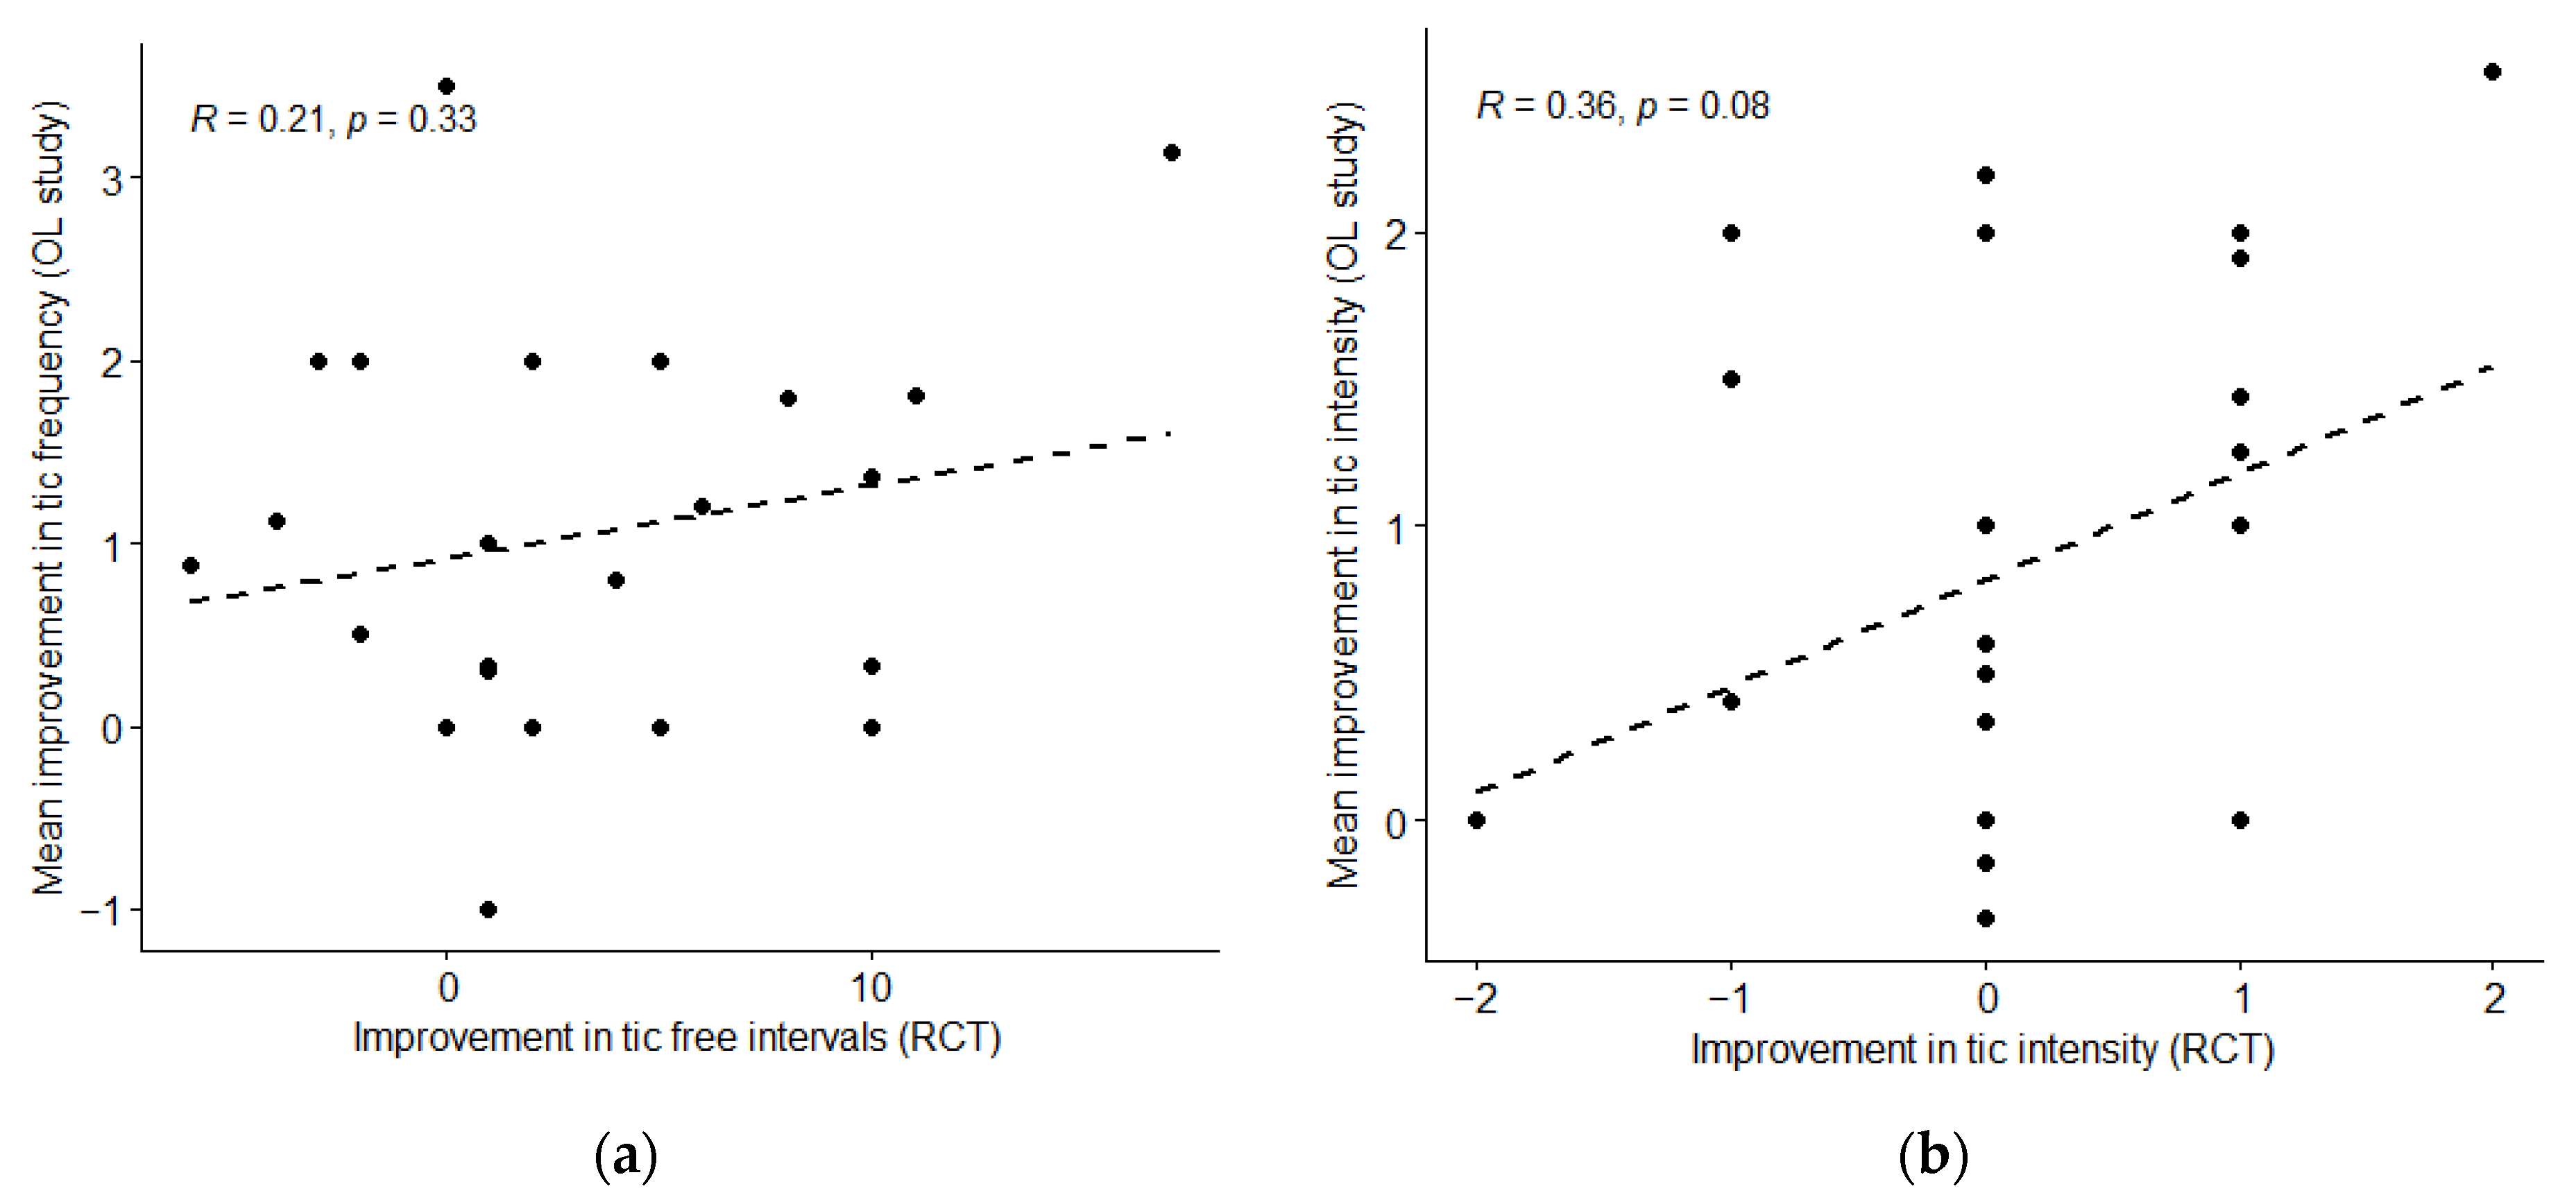
| Effect on tic frequency compared to in RCT (see Figure 5a) (n = 24) | r = 0.21 | −0.22–0.56 | 0.33 | primary |
| Effect on tic intensity compared to in RCT (see Figure 5b) (n = 25) | r = 0.36 | −0.05–0.66 | 0.08 | primary |
| Overall impact of stimulation on symptoms throughout study period (n = 27) | 3.1 ± 0.9 (mean ± SD) | 2.7–3.4 | — | secondary |
| Discomfort from final survey (n = 27) | 1.2 ± 1.0 (mean ± SD) | 0.8–1.6 | — | secondary |
| Therapeutic effect while using from final survey (n = 27) | 1.5 ± 0.9 (mean ± SD) | 1.1–1.9 | — | secondary |
| Difference in ATQ before and after study (n = 25) | 0.7 ± 18.0 (mean ± SD) | −6.7–8.2 | 0.84 | secondary |
| Difference in PUTS before and after study (n = 25) | −0.9 ± 4.3 (mean ± SD) | −2.8–1.0 | 0.35 | secondary |
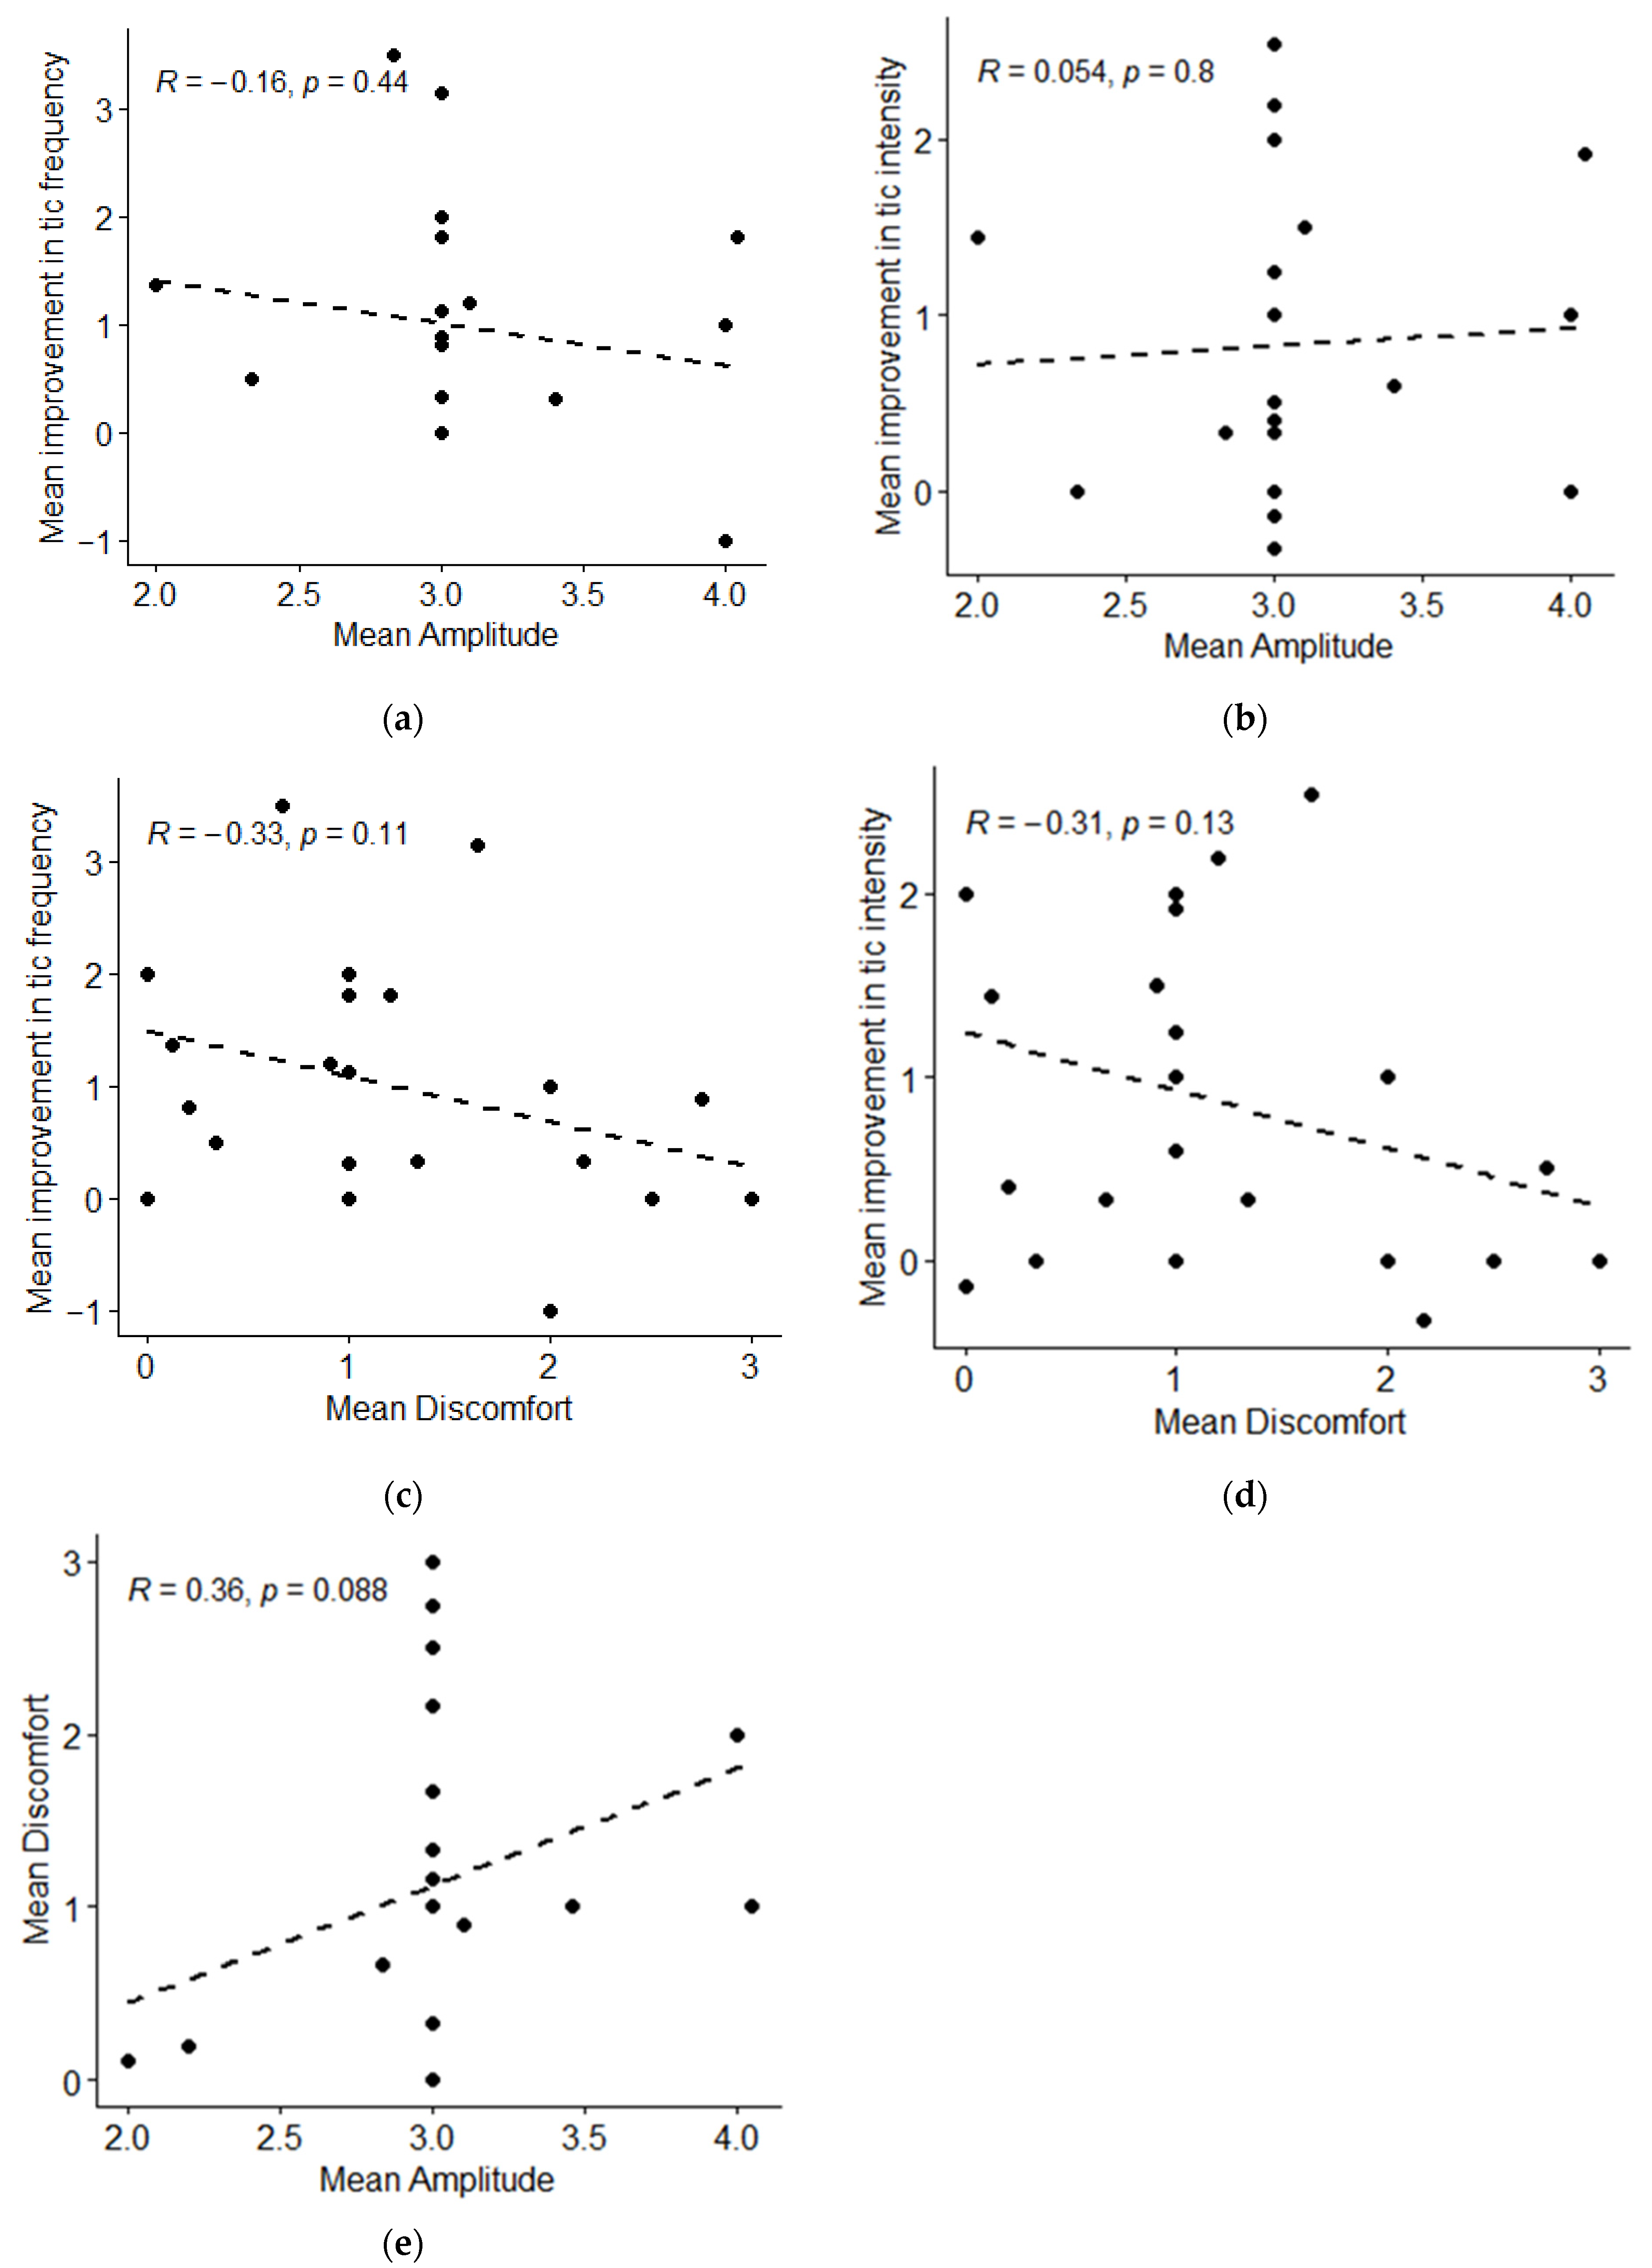
| Correlation between tic frequency and stimulation amplitude (see Figure 2a) (n = 24) | R = −0.16 Rho = −0.19 | −0.5–0.26 | 0.44 0.37 | secondary |
| Correlation between tic intensity and stimulation amplitude (see Figure 2b) (n = 24) | R = 0.05 Rho = 0.15 | −0.36–0.45 | 0.80 0.49 | secondary |
| Correlation between tic frequency and stimulation discomfort (see Figure 2c) (n = 25) | R = −0.33 Rho = −0.36 | −0.64–0.08 | 0.11 0.08 | secondary |
| Correlation between tic intensity and stimulation discomfort (see Figure 2d) (n = 25) | R = −0.31 Rho = −0.27 | −0.63–0.09 | 0.13 0.19 | secondary |
| Correlation between stimulation amplitude and stimulation discomfort (see Figure 2e) (n = 24) | R = 0.36 Rho = 0.31 | −0.06–0.66 | 0.09 0.13 | exploratory |
| Change in tic frequency when device OFF for more than 60 min vs. less than 60 min (t test, n = 16) | More than 60: 2.7 ± 0.9 (mean ± SD) Less than 60: 2.3, 2.1 (median, IQR) Difference: 0.3 (mean) | −0.2–0.7 | 0.20 | secondary |
| Change in tic intensity when device OFF for more than 60 min vs. less than 60 min (t test, n = 16) | More than 60: 2.5 ± 0.8 (mean ± SD) Less than 60: 2.3, 2.2 (median, IQR) Difference: 0.1 (mean) | −0.4–0.5 | 0.77 | secondary |
| Participants’ perception of length of tic improvement (n = 21) | 15, 35 (median, IQR) | 15–60 | — | secondary |
| Change in tic frequency when device OFF for more than 10 min vs. less than 10 min (n = 7 for t test) | More than 10: 3, 2 (median, IQR) Less than 10: 2.2, 1.3 (median, IQR) Difference: 0.4 (mean) | −0.5–1.3 | 0.30 | secondary |
| Change in tic intensity when device OFF for more than 10 min vs. less than 10 min (n = 7 for t test) | More than 10: 3, 2.5 (median, IQR) Less than 10: 1.9, 1.3 (median, IQR) Difference: 0.3 (mean) | −0.7–1.3 | 0.47 | secondary |
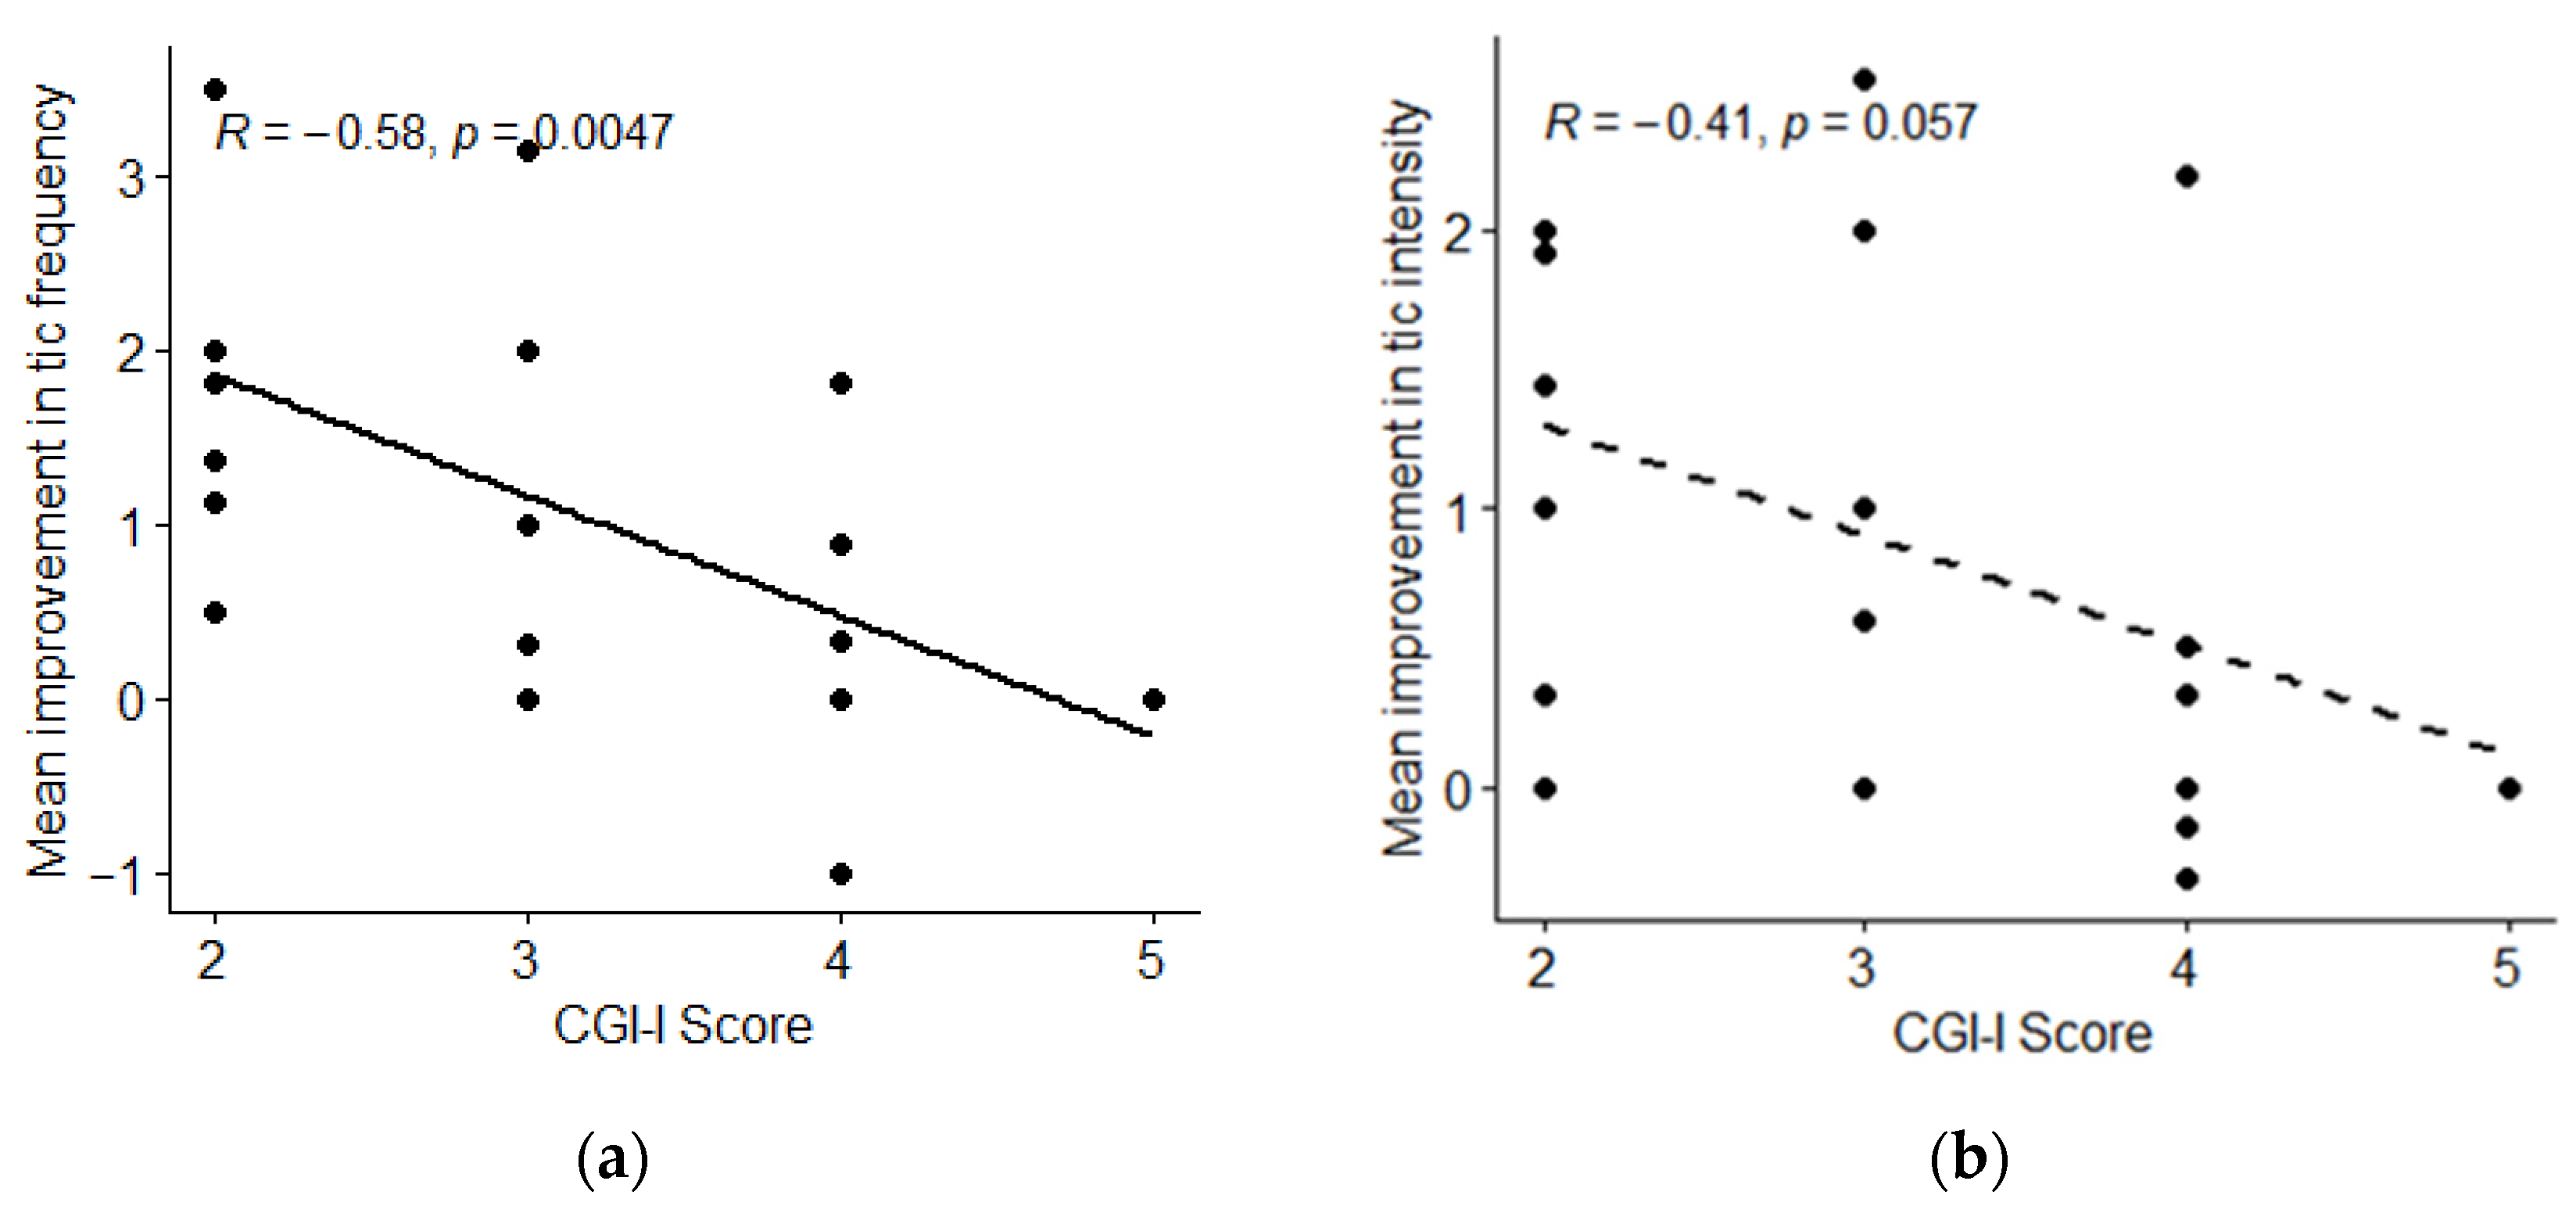
| Correlation between tic frequency and CGI-I (see Figure 4a) (n = 22) | R= −0.58 Rho= −0.64 | −0.80–−0.21 | 0.005 0.001 | secondary |
| Correlation between tic intensity and CGI-I (see Figure 4b) (n = 22) | R= −0.41 Rho = −0.44 | −0.71–0.01 | 0.06 0.04 | secondary |
| Difference in days per week device used between RCT responders b (n = 13) and non-responders (n = 18) | RCT responders: 133.4 ± 207.9 (mean, SD) RCT non-responders: 72.3 ± 62.0 (mean, SD) | −66.9–189.0 | 0.32 | exploratory |
| Difference in minutes per day used between RCT responders b (n = 13) and non-responders (n = 18) | RCT responders: 2.0 ± 2.3 (mean, SD) RCT non-responders: 1.4 ± 0.9 (mean, SD) | −0.9–2.0 | 0.44 | exploratory |
| Mean, Non-Responders (n = 9) | Mean, Responders (n = 18) | p Value | |
|---|---|---|---|
| Age | 37.7 | 33.9 | 0.52 |
| Y-BOCS Obsession Subtotal | 2.7 | 4.2 | 0.45 |
| Y-BOCS Compulsion Subtotal | 2.9 | 3.3 | 0.90 |
| Y-BOCS Total | 5.6 | 7.6 | 0.51 |
| PUTS | 19.4 | 21.9 | 0.45 |
| YGTSS Impairment | 20.6 | 15.6 | 0.52 |
| YGTSS Total Tic Score | 22.9 | 25.8 | 0.12 |
| DCI | 52.7 | 64.3 | 0.20 |
| ATQ | 34.8 | 41.2 | 0.43 |
| ADHD | 9.1 | 14.4 | 0.20 |
| Number of Treatments Tried | 3.9 | 4 | 0.73 |
| Successful Treatments | 0.3 | 0.8 | 0.44 |
| Family History of Tics (% of participants with history in first degree relative) | 55.6 | 27.8 | 0.22 |
| Family History Tics/OCD/ADHD (% of participants with history in first degree relative) | 77.8 | 55.6 | 0.41 |
| Sex (% male) | 66.7 | 72.2 | 1 |
| Distress/Impairment Last Week (% yes) | 66.6 | 66.6 | 1 |
| Distress/Impairment Lifetime (% yes) | 100 | 100 | 1 |
| Adequate Behavior Therapy (% yes) | 0 | 16.7 | 0.53 |
Disclaimer/Publisher’s Note: The statements, opinions and data contained in all publications are solely those of the individual author(s) and contributor(s) and not of MDPI and/or the editor(s). MDPI and/or the editor(s) disclaim responsibility for any injury to people or property resulting from any ideas, methods, instructions or products referred to in the content. |
© 2023 by the authors. Licensee MDPI, Basel, Switzerland. This article is an open access article distributed under the terms and conditions of the Creative Commons Attribution (CC BY) license (https://creativecommons.org/licenses/by/4.0/).
Share and Cite
Iverson, A.M.; Arbuckle, A.L.; Song, D.Y.; Bihun, E.C.; Black, K.J. Median Nerve Stimulation for Treatment of Tics: A 4-Week Open Trial with Ecological Momentary Assessment. J. Clin. Med. 2023, 12, 2545. https://doi.org/10.3390/jcm12072545
Iverson AM, Arbuckle AL, Song DY, Bihun EC, Black KJ. Median Nerve Stimulation for Treatment of Tics: A 4-Week Open Trial with Ecological Momentary Assessment. Journal of Clinical Medicine. 2023; 12(7):2545. https://doi.org/10.3390/jcm12072545
Chicago/Turabian StyleIverson, Ann M., Amanda L. Arbuckle, David Y. Song, Emily C. Bihun, and Kevin J. Black. 2023. "Median Nerve Stimulation for Treatment of Tics: A 4-Week Open Trial with Ecological Momentary Assessment" Journal of Clinical Medicine 12, no. 7: 2545. https://doi.org/10.3390/jcm12072545