
The Associations between Insomnia Severity and Health Outcomes in the United States
Abstract
:1. Introduction
2. Materials and Methods
2.1. Study Design and Data Source
2.2. Participants
2.3. Insomnia Cohort Identification
2.4. Insomnia Severity
2.5. Outcomes
2.5.1. Health-Related Quality of Life
2.5.2. Health Utility Status
2.5.3. Workplace Productivity
2.5.4. Healthcare Resource Utilization and Costs
2.6. Analytic Plan
3. Results
3.1. Characteristics of Study Population
3.2. Association between Insomnia Severity and Outcomes
4. Discussion
5. Conclusions
Supplementary Materials
Author Contributions
Funding
Institutional Review Board Statement
Informed Consent Statement
Data Availability Statement
Conflicts of Interest
References
- Ford, D.E.; Kamerow, D.B. Epidemiologic study of sleep disturbances and psychiatric disorders. An opportunity for prevention? JAMA 1989, 262, 1479–1484. [Google Scholar] [CrossRef] [PubMed]
- Roth, T.; Coulouvrat, C.; Hajak, G.; Lakoma, M.D.; Sampson, N.A.; Shahly, V.; Shillington, A.C.; Stephenson, J.J.; Walsh, J.K.; Kessler, R.C. Prevalence and perceived health associated with insomnia based on DSM-IV-TR; International Statistical Classification of Diseases and Related Health Problems, Tenth Revision; and Research Diagnostic Criteria/International Classification of Sleep Disorders, Second Edition criteria: Results from the America Insomnia Survey. Biol. Psychiatry 2011, 69, 592–600. [Google Scholar] [CrossRef] [PubMed]
- American Psychiatric Association. Diagnostic and Statistical Manual of Mental Disorders, 5th ed.; American Psychiatric Association: Washington, DC, USA, 2013. [Google Scholar]
- Morin, C.M.; Drake, C.L.; Harvey, A.G.; Krystal, A.D.; Manber, R.; Riemann, D.; Spiegelhalder, K. Insomnia disorder. Nat. Rev. Dis. Primers 2015, 1, 15026. [Google Scholar] [CrossRef] [PubMed]
- Wickwire, E.M.; Shaya, F.T.; Scharf, S.M. Health economics of insomnia treatments: The return on investment for a good night’s sleep. Sleep Med. Rev. 2016, 30, 72–82. [Google Scholar] [CrossRef] [PubMed]
- Wickwire, E.M.; Tom, S.E.; Scharf, S.M.; Vadlamani, A.; Bulatao, I.G.; Albrecht, J.S. Untreated insomnia increases all-cause health care utilization and costs among Medicare beneficiaries. Sleep 2019, 42, zsz007. [Google Scholar] [CrossRef]
- Wickwire, E.M. Value-based sleep in the workplace. Sleep 2016, 39, 1767–1768. [Google Scholar] [CrossRef] [Green Version]
- Riemann, D.; Baglioni, C.; Bassetti, C.; Bjorvatn, B.; Groselj, L.D.; Ellis, J.G.; Espie, C.A.; Garcia-Borreguero, D.; Gjerstad, M.; Gonçalves, M.; et al. European guideline for the diagnosis and treatment of insomnia. J. Sleep Res. 2017, 26, 675–700. [Google Scholar] [CrossRef]
- Sateia, M.J.V.; Buysse, D.J.; Krystal, A.D.; Neubauer, D.N.; Heald, J.L. Clinical practice guideline for the pharmacologic treatment of chronic insomnia in adults: An American Academy of Sleep Medicine clinical practice guideline. J. Clin. Sleep Med. 2017, 13, 307–349. [Google Scholar] [CrossRef]
- Grima, N.A.; Bei, B.; Mansfield, D. Insomnia theory and assessment. Aust. J. Gen. Pract. 2019, 48, 193–197. [Google Scholar] [CrossRef] [Green Version]
- Sarsour, K.; Kalsekar, M.S.; Swindle, R.; Foley, K.; Walsh, J.K. The association between insomnia severity and healthcare and productivity costs in a health plan sample. Sleep 2011, 34, 443–450. [Google Scholar] [CrossRef] [Green Version]
- Daley, M.; Morin, C.M.; LeBlanc, M.; Grégoire, J.P.; Savard, J. The economic burden of insomnia: Direct and indirect costs for individuals with insomnia syndrome, insomnia symptoms, and good sleepers. Sleep 2009, 32, 55–64. [Google Scholar] [PubMed] [Green Version]
- Kessler, R.C.; Berglund, P.A.; Coulouvrat, C.; Hajak, G.; Roth, T.; Shahly, V.; Shillington, A.C.; Stephenson, J.J.; Walsh, J.K. Insomnia and the performance of US workers: Results from the America insomnia survey. Sleep 2011, 34, 1161–1171. [Google Scholar] [CrossRef] [PubMed] [Green Version]
- DiBonaventura, M.; Richard, L.; Kumar, M.; Forsythe, A.; Flores, N.M.; Moline, M. The association between insomnia and insomnia treatment side effects on health status, work productivity, and healthcare resource use. PLoS ONE 2015, 10, e0137117. [Google Scholar] [CrossRef] [PubMed]
- Gupta, S.; Goren, A.; Phillips, A.L.; Stewart, M. Self-reported burden among caregivers of patients with multiple sclerosis. Int. J. MS Care 2012, 14, 179–187. [Google Scholar] [CrossRef] [PubMed] [Green Version]
- Morin, C.M.; Stone, J.; Trinkle, D.; Mercer, J.; Remsberg, S. Dysfunctional beliefs and attitudes about sleep among older adults with and without insomnia complaints. Psychol. Aging 1993, 8, 463–467. [Google Scholar] [CrossRef]
- Bastien, C.H.; Vallières, A.; Morin, C.M. Validation of the Insomnia Severity Index as an outcome measure for insomnia research. Sleep Med. 2001, 2, 297–307. [Google Scholar] [CrossRef]
- Morin, C.M.; Belleville, G.; Bélanger, L.; Ivers, H. The Insomnia Severity Index: Psychometric indicators to detect insomnia cases and evaluate treatment response. Sleep 2011, 34, 601–608. [Google Scholar] [CrossRef] [Green Version]
- Thorndike, F.P.; Ritterband, L.M.; Saylor, D.K.; Magee, J.C.; Gonder-Frederick, L.A.; Morin, C.M. Validation of the insomnia severity index as a web-based measure. Behav. Sleep Med. 2011, 9, 216–223. [Google Scholar] [CrossRef]
- Montazeri, A.; Vahdaninia, M.; Mousavi, S.J.; Asadi-Lari, M.; Omidvari, S.; Tavousi, M. The 12-item medical outcomes study short form health survey version 2.0 (SF-12v2): A population-based validation study from Tehran, Iran. Health Qual. Life Outcomes 2011, 9, 12. [Google Scholar] [CrossRef] [Green Version]
- Frendl, D.M.; Ware, J.E., Jr. Patient-reported functional health and well-being outcomes with drug therapy: A systematic review of randomized trials using the SF-36 health survey. Med. Care 2014, 52, 439–445. [Google Scholar] [CrossRef]
- Walters, S.J.; Brazier, J.E. Comparison of the minimally important difference for two health state utility measures: EQ-5D and SF-6D. Qual. Life Res. 2005, 14, 1523–1532. [Google Scholar] [CrossRef] [PubMed]
- Herdman, M.; Gudex, C.; Lloyd, A.; Janssen, M.F.; Kind, P.; Parkin, D.; Bonsel, G.; Badia, X. Development and preliminary testing of the new five-level version of EQ-5D (EQ-5D-5L). Qual. Life Res. 2011, 20, 1727–1736. [Google Scholar] [CrossRef] [PubMed] [Green Version]
- Reilly, M.C.; Zbrozek, A.S.; Dukes, E.M. The validity and reproducibility of a work productivity and activity impairment instrument. Pharmacoeconomics 1993, 4, 353–365. [Google Scholar] [CrossRef] [PubMed]
- DiBonaventura, M.D.; Gupta, S.; McDonald, M.; Sadosky, A. Evaluating the health and economic impact of osteoarthritis pain in the workforce: Results from the National Health and Wellness Survey. BMC Musculoskelet. Disord. 2011, 12, 83. [Google Scholar] [CrossRef] [PubMed] [Green Version]
- Goren, A.; Liu, X.; Gupta, S.; Simon, T.A.; Phatak, H. Quality of Life, Activity Impairment, and Healthcare Resource Utilization Associated with Atrial Fibrillation in the US National Health and Wellness Survey. PLoS ONE 2013, 8, e71264. [Google Scholar] [CrossRef] [Green Version]
- United States Census Bureau. 2020 Census. 2020. Available online: https://www.census.gov/programs-surveys/decennial-census/decade/2020/2020-census-main.html (accessed on 26 August 2022).


| Categorical | Overall Population | Severe Insomnia | Moderate Insomnia | Mild (Subthreshold) Insomnia | No clinically Significant Insomnia | p Value | ||||||
|---|---|---|---|---|---|---|---|---|---|---|---|---|
| (n = 8920) | (n = 498) | (n = 2132) | (n = 4348) | (n = 1942) | ||||||||
| n | % | n | % | n | % | N | % | n | % | |||
| Sex | Male | 2776 | 31.1 | 161 | 32.3 | 570 | 26.7 | 1380 | 31.7 | 665 | 34.2 | <0.001 |
| Female | 6144 | 68.9 | 337 | 67.7 | 1562 | 73.3 | 2968 | 68.3 | 1277 | 65.8 | ||
| Marital status | Married or living with partner | 4527 | 50.8 | 236 | 47.4 | 1004 | 47.1 | 2238 | 51.5 | 1049 | 54.0 | <0.001 |
| Single/never married or divorced or separated or widowed | 4374 | 49 | 260 | 52.2 | 1119 | 52.5 | 2102 | 48.3 | 893 | 46.0 | ||
| Decline to answer | 19 | 0.2 | 2 | 0.4 | 9 | 0.4 | 8 | 0.2 | 0 | 0.0 | ||
| Level of education | 4-year university degree or higher | 4132 | 46.3 | 197 | 39.6 | 818 | 38.4 | 2073 | 47.7 | 1044 | 53.8 | <0.001 |
| Less than 4-year university degree | 4773 | 53.5 | 301 | 60.4 | 1314 | 61.6 | 2267 | 52.1 | 891 | 45.9 | ||
| Did not attend school or declined to answer | 15 | 0.2 | 0 | 0 | 0 | 0 | 8 | 0.2 | 7 | 0.4 | ||
| Employment status | Employed full time/part time/self-employed | 5301 | 59.4 | 296 | 59.4 | 1201 | 56.3 | 2655 | 61.1 | 1149 | 59.2 | <0.001 |
| Not employed | 2227 | 25 | 149 | 29.9 | 695 | 32.6 | 1011 | 23.3 | 372 | 19.2 | ||
| Retired | 1392 | 15.6 | 53 | 10.6 | 236 | 11.1 | 682 | 15.7 | 421 | 21.7 | ||
| Household income (categorical) | Less than $49,999 | 3845 | 43.1 | 263 | 52.8 | 1084 | 50.8 | 1802 | 41.4 | 696 | 35.8 | <0.001 |
| $50,000 or more | 4679 | 52.5 | 212 | 42.6 | 970 | 45.5 | 2353 | 54.1 | 1144 | 58.9 | ||
| Decline to answer | 396 | 4.4 | 23 | 4.6 | 78 | 3.7 | 193 | 4.4 | 102 | 5.3 | ||
| Insurance status | Yes | 7774 | 87.2 | 414 | 83.1 | 1818 | 85.3 | 3807 | 87.6 | 1735 | 89.3 | <0.001 |
| No | 1146 | 12.8 | 84 | 16.9 | 314 | 14.7 | 541 | 12.4 | 207 | 10.7 | ||
| Smoking status | Current smoker | 1639 | 18.4 | 157 | 31.5 | 506 | 23.7 | 720 | 16.6 | 256 | 13.2 | <0.001 |
| Former smoker | 2259 | 25.3 | 112 | 22.5 | 538 | 25.2 | 1131 | 26.0 | 478 | 24.6 | ||
| Never | 5022 | 56.3 | 229 | 46.0 | 1088 | 51.0 | 2497 | 57.4 | 1208 | 62.2 | ||
| Alcohol use | None | 2613 | 29.3 | 162 | 32.5 | 674 | 31.6 | 1194 | 27.5 | 583 | 30.0 | <0.001 |
| Low-moderate | 5216 | 58.5 | 257 | 51.6 | 1207 | 56.6 | 2616 | 60.2 | 1136 | 58.5 | ||
| 4+ times per week | 1091 | 12.2 | 79 | 15.9 | 251 | 11.8 | 538 | 12.4 | 223 | 11.5 | ||
| Depression | 3071 | 34.4 | 291 | 58.4 | 1001 | 47.0 | 1388 | 31.9 | 391 | 20.1 | <0.001 | |
| Post-traumatic stress disorder | 532 | 6 | 76 | 15.3 | 200 | 9.4 | 207 | 4.8 | 49 | 2.5 | <0.001 | |
| Anxiety | 3040 | 34.1 | 277 | 55.6 | 1032 | 48.4 | 1355 | 31.2 | 376 | 19.4 | <0.001 | |
| Pain | 3913 | 43.9 | 288 | 57.8 | 1088 | 51.0 | 1667 | 38.3 | 582 | 30.0 | <0.001 | |
| Insomnia, diagnosed | 2445 | 27.4 | 264 | 53.0 | 858 | 40.2 | 1046 | 24.1 | 277 | 14.3 | <0.001 | |
| Insomnia, treated | 1219 | 13.7 | 139 | 27.9 | 392 | 18.4 | 511 | 11.8 | 177 | 9.1 | <0.001 | |
| Continuous | Mean | SD | Mean | SD | Mean | SD | Mean | SD | Mean | SD | p Value | |
| Age (years) | 45.44 | 16.49 | 41.12 | 14.64 | 42.33 | 15.65 | 45.43 | 16.56 | 49.99 | 16.60 | <0.001 | |
| Body mass index | 27.73 | 7.05 | 28.69 | 8.70 | 28.32 | 7.59 | 27.67 | 6.97 | 26.97 | 5.96 | <0.001 | |
| Charlson comorbidity index (CCI) | 0.33 | 0.79 | 0.53 | 0.98 | 0.43 | 0.92 | 0.29 | 0.72 | 0.25 | 0.70 | <0.001 | |
| Duration of symptoms in last 12 months (days) | 191.41 | 145.76 | 283.5 | 120.6 | 259.3 | 126.7 | 189.0 | 141.1 | 98.7 | 125.8 | <0.001 | |
| Severe Insomnia (n = 498) | Moderate Insomnia (n = 2132) | Mild (Subthreshold) Insomnia (n = 4348) | No Clinically Significant Insomnia (n = 1942) | p Value | |||||||||
|---|---|---|---|---|---|---|---|---|---|---|---|---|---|
| n | Mean | SD | n | Mean | SD | n | Mean | SD | n | Mean | SD | ||
| SF-6D | 498 | 0.54 | 0.12 | 2132 | 0.61 | 0.11 | 4348 | 0.68 | 0.11 | 1942 | 0.75 | 0.11 | <0.001 |
| PCS | 498 | 43.65 | 12.23 | 2132 | 47.72 | 10.82 | 4348 | 50.89 | 9.05 | 1942 | 52.57 | 7.76 | <0.001 |
| MCS | 498 | 30.90 | 12.83 | 2132 | 36.78 | 12.28 | 4348 | 43.43 | 11.29 | 1942 | 49.75 | 9.68 | <0.001 |
| EQ-5D | 498 | 0.60 | 0.25 | 2132 | 0.72 | 0.16 | 4348 | 0.80 | 0.12 | 1942 | 0.85 | 0.11 | <0.001 |
| Absenteeism % | 284 | 26.52 | 30.97 | 1140 | 12.28 | 22.41 | 2549 | 6.48 | 16.78 | 1101 | 3.65 | 13.48 | <0.001 |
| Presenteeism % | 270 | 51.41 | 35.30 | 1124 | 34.86 | 29.51 | 2538 | 21.27 | 25.07 | 1097 | 11.73 | 20.80 | <0.001 |
| Total work productivity impairment % | 267 | 55.88 | 35.87 | 1114 | 38.32 | 31.76 | 2523 | 23.61 | 27.33 | 1092 | 12.94 | 22.59 | <0.001 |
| Activity impairment % | 498 | 58.27 | 31.29 | 2132 | 42.20 | 29.45 | 4348 | 26.37 | 26.31 | 1942 | 15.79 | 22.57 | <0.001 |
| Number of HCP visits in past 6 months | 498 | 6.57 | 9.59 | 2132 | 4.85 | 6.51 | 4348 | 3.76 | 5.19 | 1942 | 3.27 | 4.46 | <0.001 |
| Number of ER visits in the past 6 months | 498 | 0.85 | 1.94 | 2132 | 0.40 | 1.05 | 4348 | 0.24 | 0.74 | 1942 | 0.13 | 0.60 | <0.001 |
| Number of hospitalizations in the past 6 months | 498 | 0.57 | 1.98 | 2132 | 0.24 | 1.26 | 4348 | 0.12 | 0.73 | 1942 | 0.09 | 0.74 | <0.001 |
| Severe Insomnia | Moderate Insomnia | Mild (Subthreshold) Insomnia | No Clinically Significant Insomnia | p Value | |||||||||||||
|---|---|---|---|---|---|---|---|---|---|---|---|---|---|---|---|---|---|
| (n = 462) | (n = 2049) | (n = 4180) | (n = 1865) | ||||||||||||||
| Mean | SE | 95% CI | B | Mean | SE | 95% CI | B | Mean | SE | 95% CI | B | Mean | SE | 95% CI | B | ||
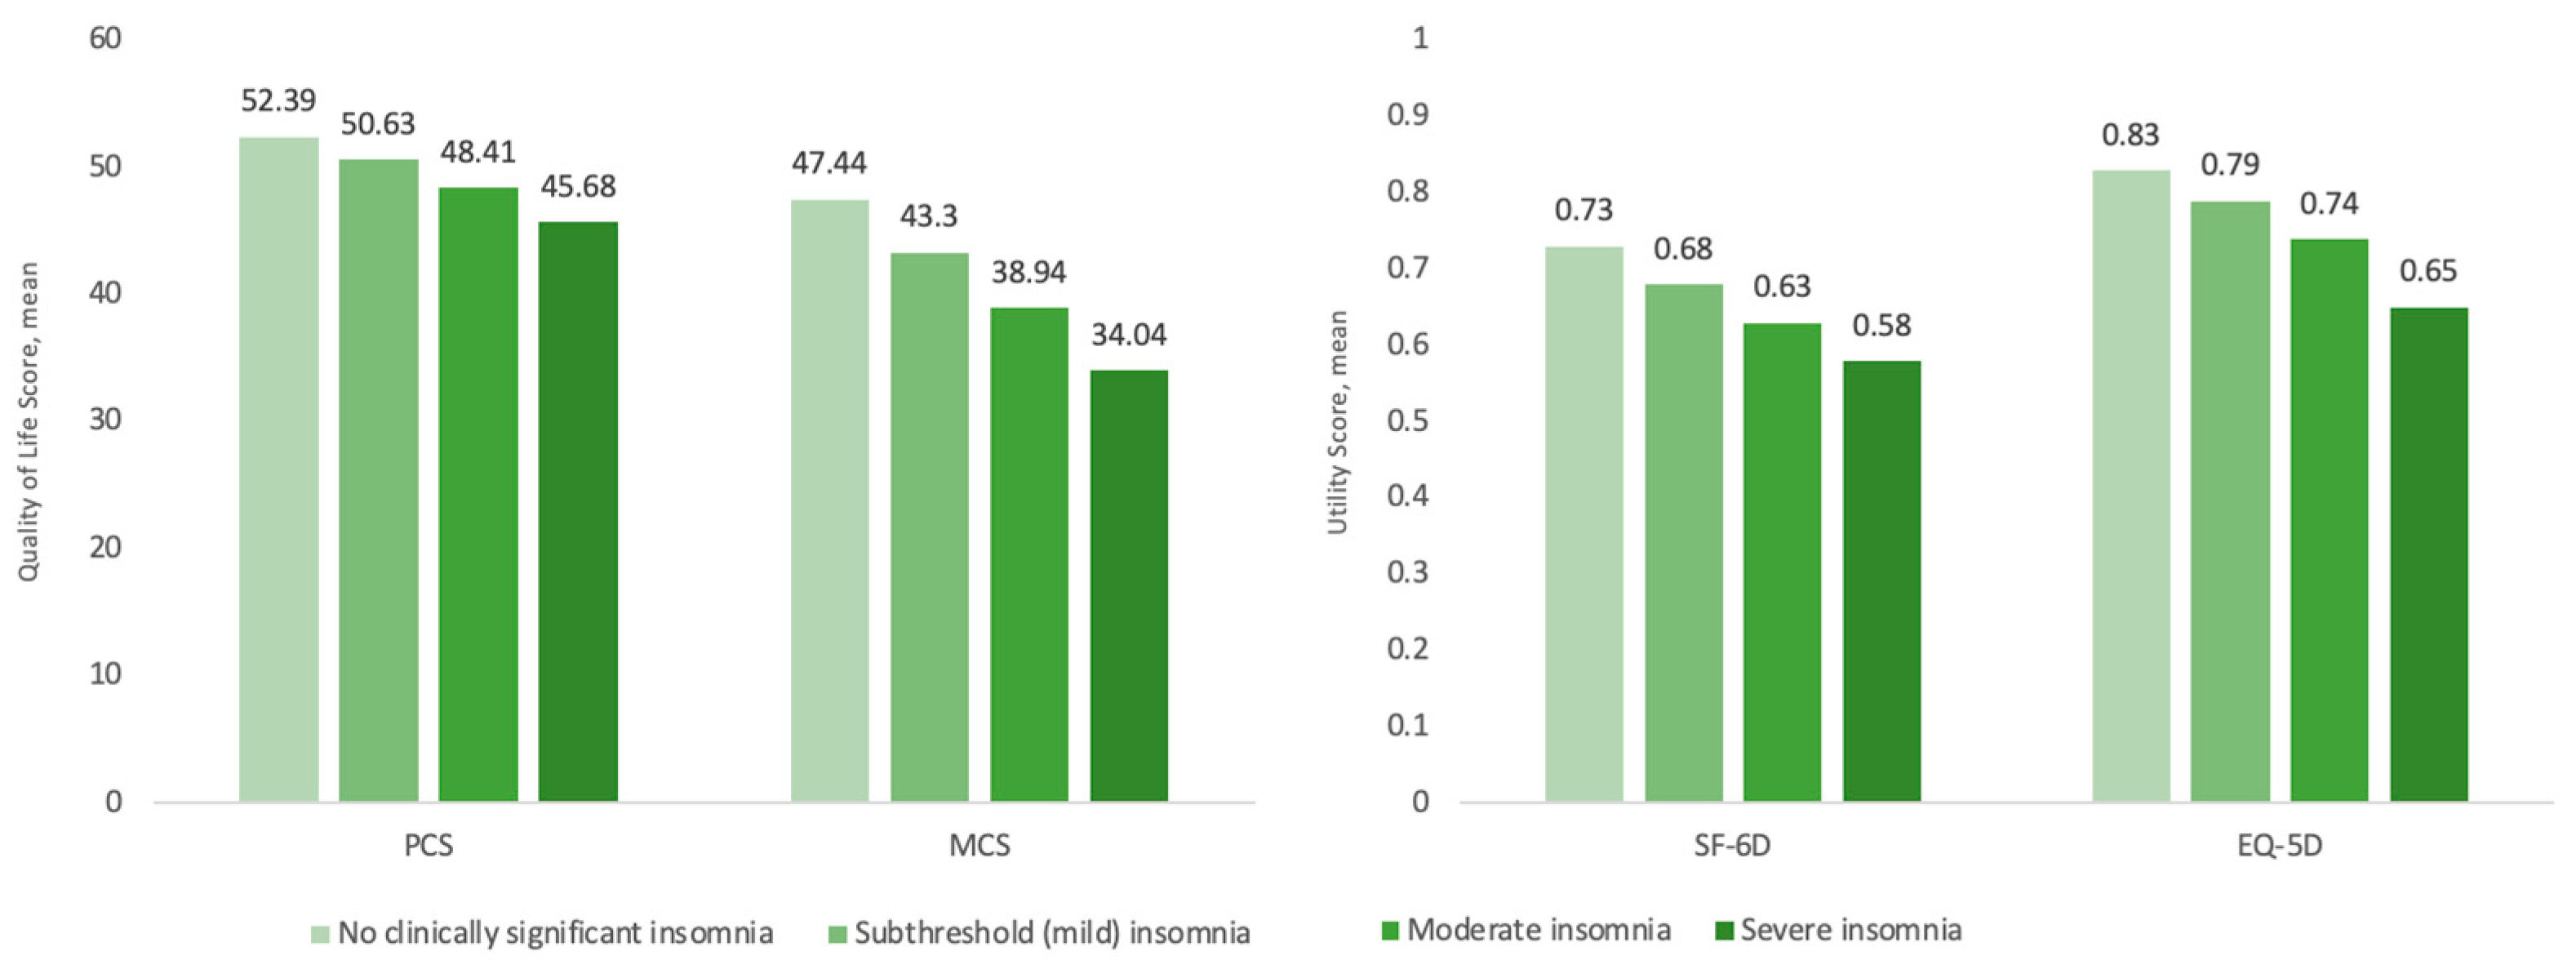
| SF-6D | 0.58 | 0.00 | 0.57–0.59 | −0.15 | 0.63 | 0.00 | 0.63–0.64 | −0.10 | 0.68 | 0.00 | 0.67–0.68 | −0.05 | 0.73 | 0.00 | 0.72–0.73 | 0.00 | <0.001 |
| EQ-5D | 0.65 | 0.01 | 0.64–0.66 | −0.18 | 0.74 | 0.00 | 0.74–0.75 | −0.09 | 0.79 | 0.00 | 0.79–0.80 | −0.04 | 0.83 | 0.00 | 0.82–0.84 | 0.00 | <0.001 |
| PCS | 45.68 | 0.39 | 44.92–46.44 | −6.71 | 48.41 | 0.19 | 48.04–48.77 | −3.98 | 50.63 | 0.13 | 50.38–50.87 | −1.76 | 52.39 | 0.20 | 51.99–52.79 | 0.00 | <0.001 |
| MCS | 34.04 | 0.47 | 33.13–34.96 | −13.4 | 38.94 | 0.23 | 38.49–39.38 | −8.50 | 43.30 | 0.15 | 43.00–43.60 | −4.14 | 47.44 | 0.24 | 46.96–47.92 | 0.00 | <0.001 |
| RR | RR | RR | RR | ||||||||||||||
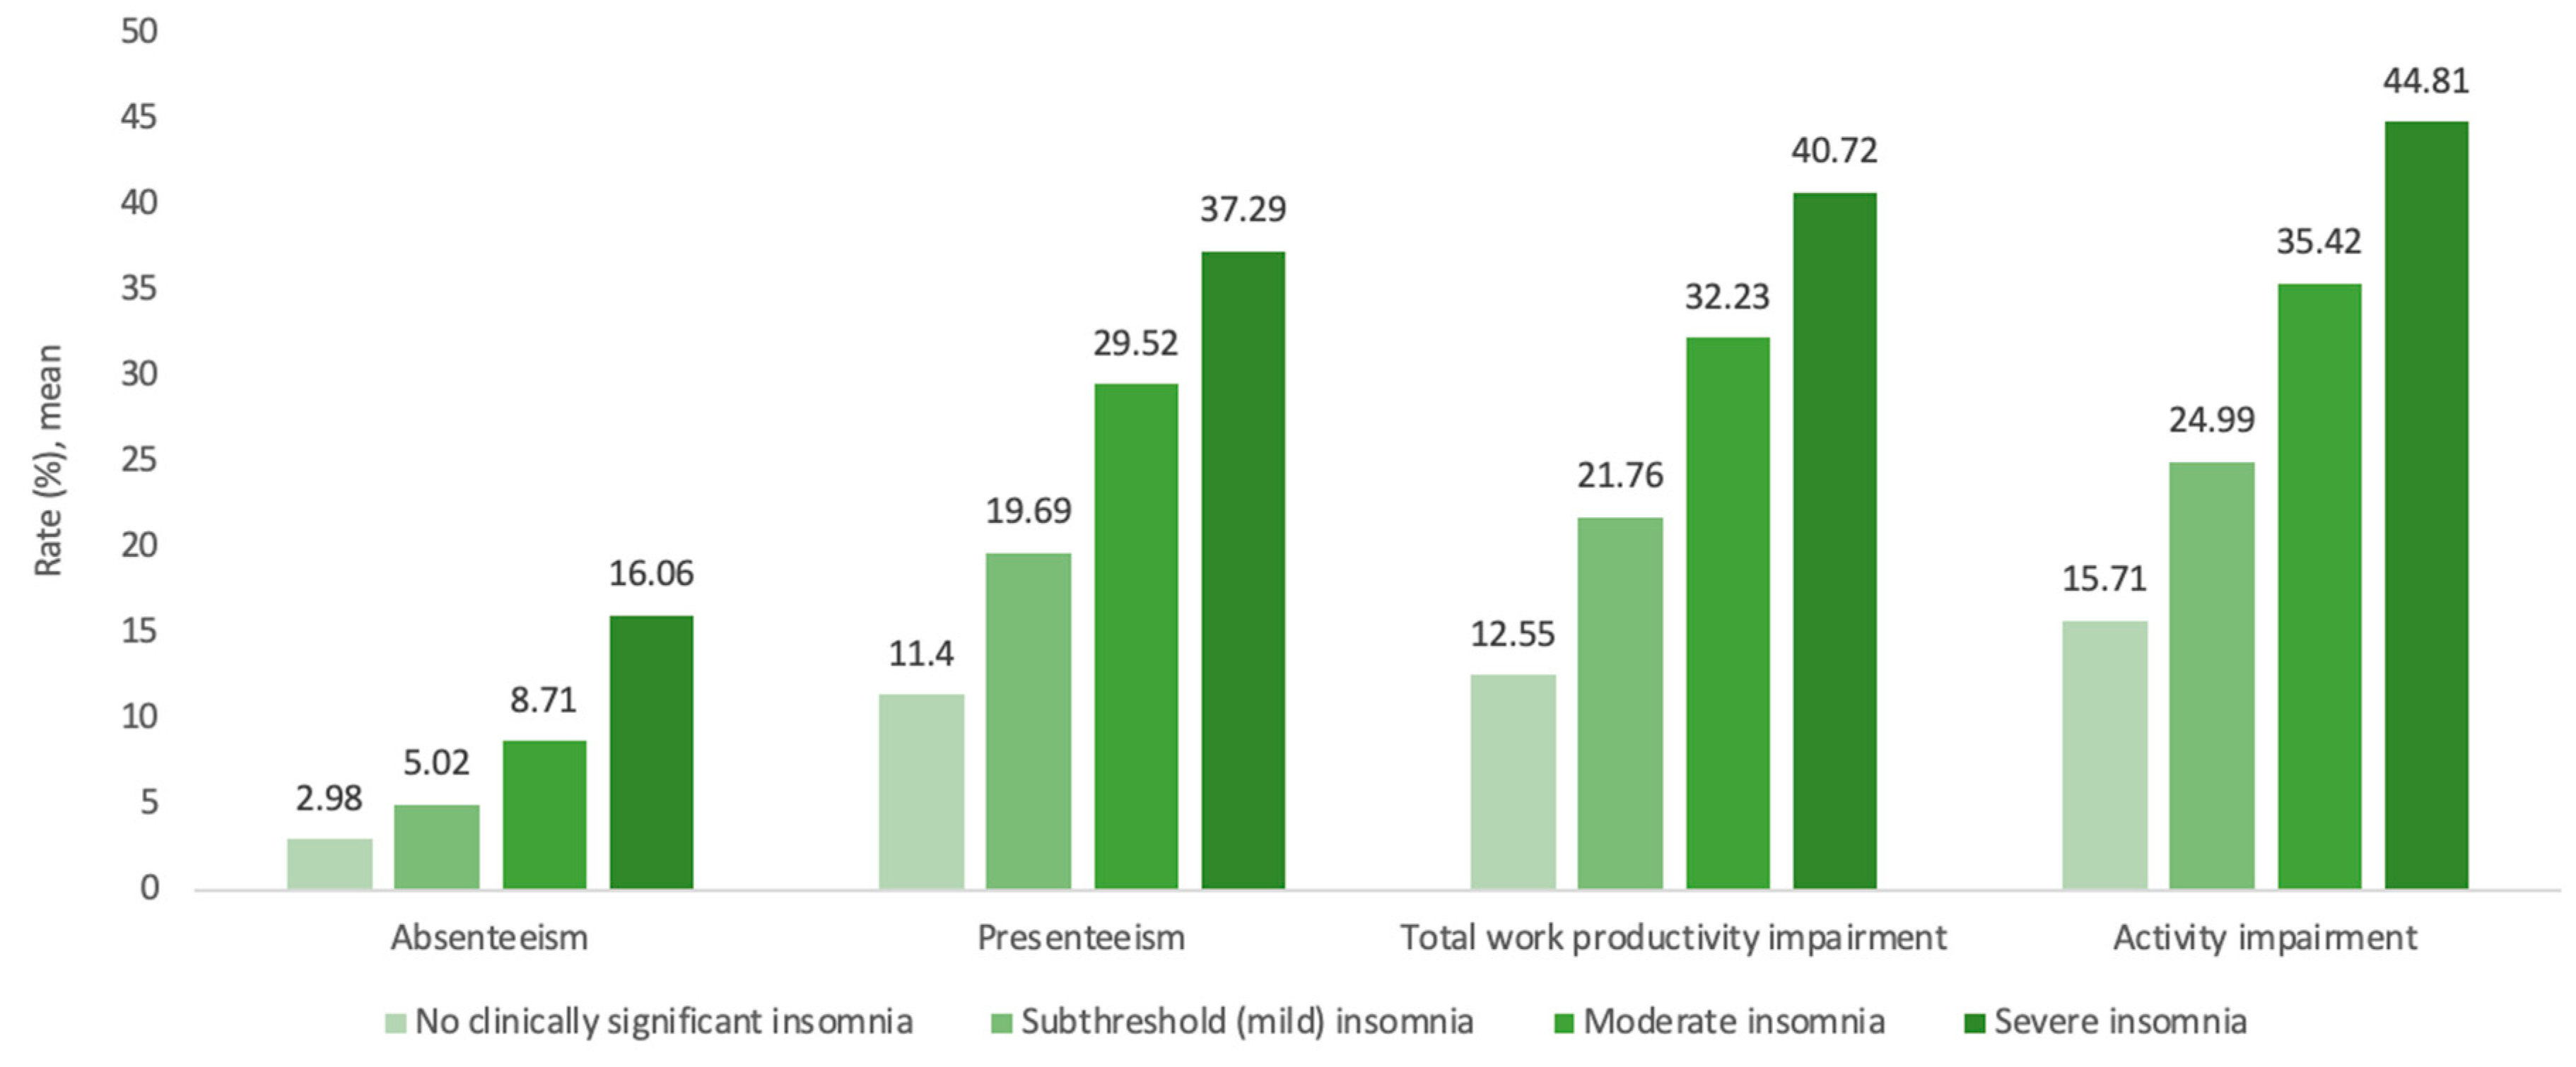
| Absenteeism (%) | 16.06 | 3.23 | 10.83–23.81 | 5.39 | 8.71 | 0.86 | 7.18–10.57 | 2.92 | 5.02 | 0.32 | 4.43–5.69 | 1.68 | 2.98 | 0.30 | 2.44–3.64 | 1.00 | <0.001 |
| Presenteeism (%) | 37.29 | 3.17 | 31.56–44.06 | 3.27 | 29.52 | 1.23 | 27.21–32.04 | 2.59 | 19.69 | 0.52 | 18.69–20.73 | 1.73 | 11.40 | 0.50 | 10.47–12.42 | 1.00 | <0.001 |
| Total work productivity impairment (%) | 40.72 | 3.44 | 34.51–48.04 | 3.24 | 32.23 | 1.33 | 29.73–34.94 | 2.57 | 21.76 | 0.57 | 20.68–22.91 | 1.73 | 12.55 | 0.54 | 11.54–13.65 | 1.00 | <0.001 |
| Activity impairment (%) | 44.81 | 2.30 | 40.51–49.56 | 2.85 | 35.42 | 0.89 | 33.72–37.20 | 2.25 | 24.99 | 0.42 | 24.18–25.83 | 1.59 | 15.71 | 0.42 | 14.90–16.56 | 1.00 | <0.001 |
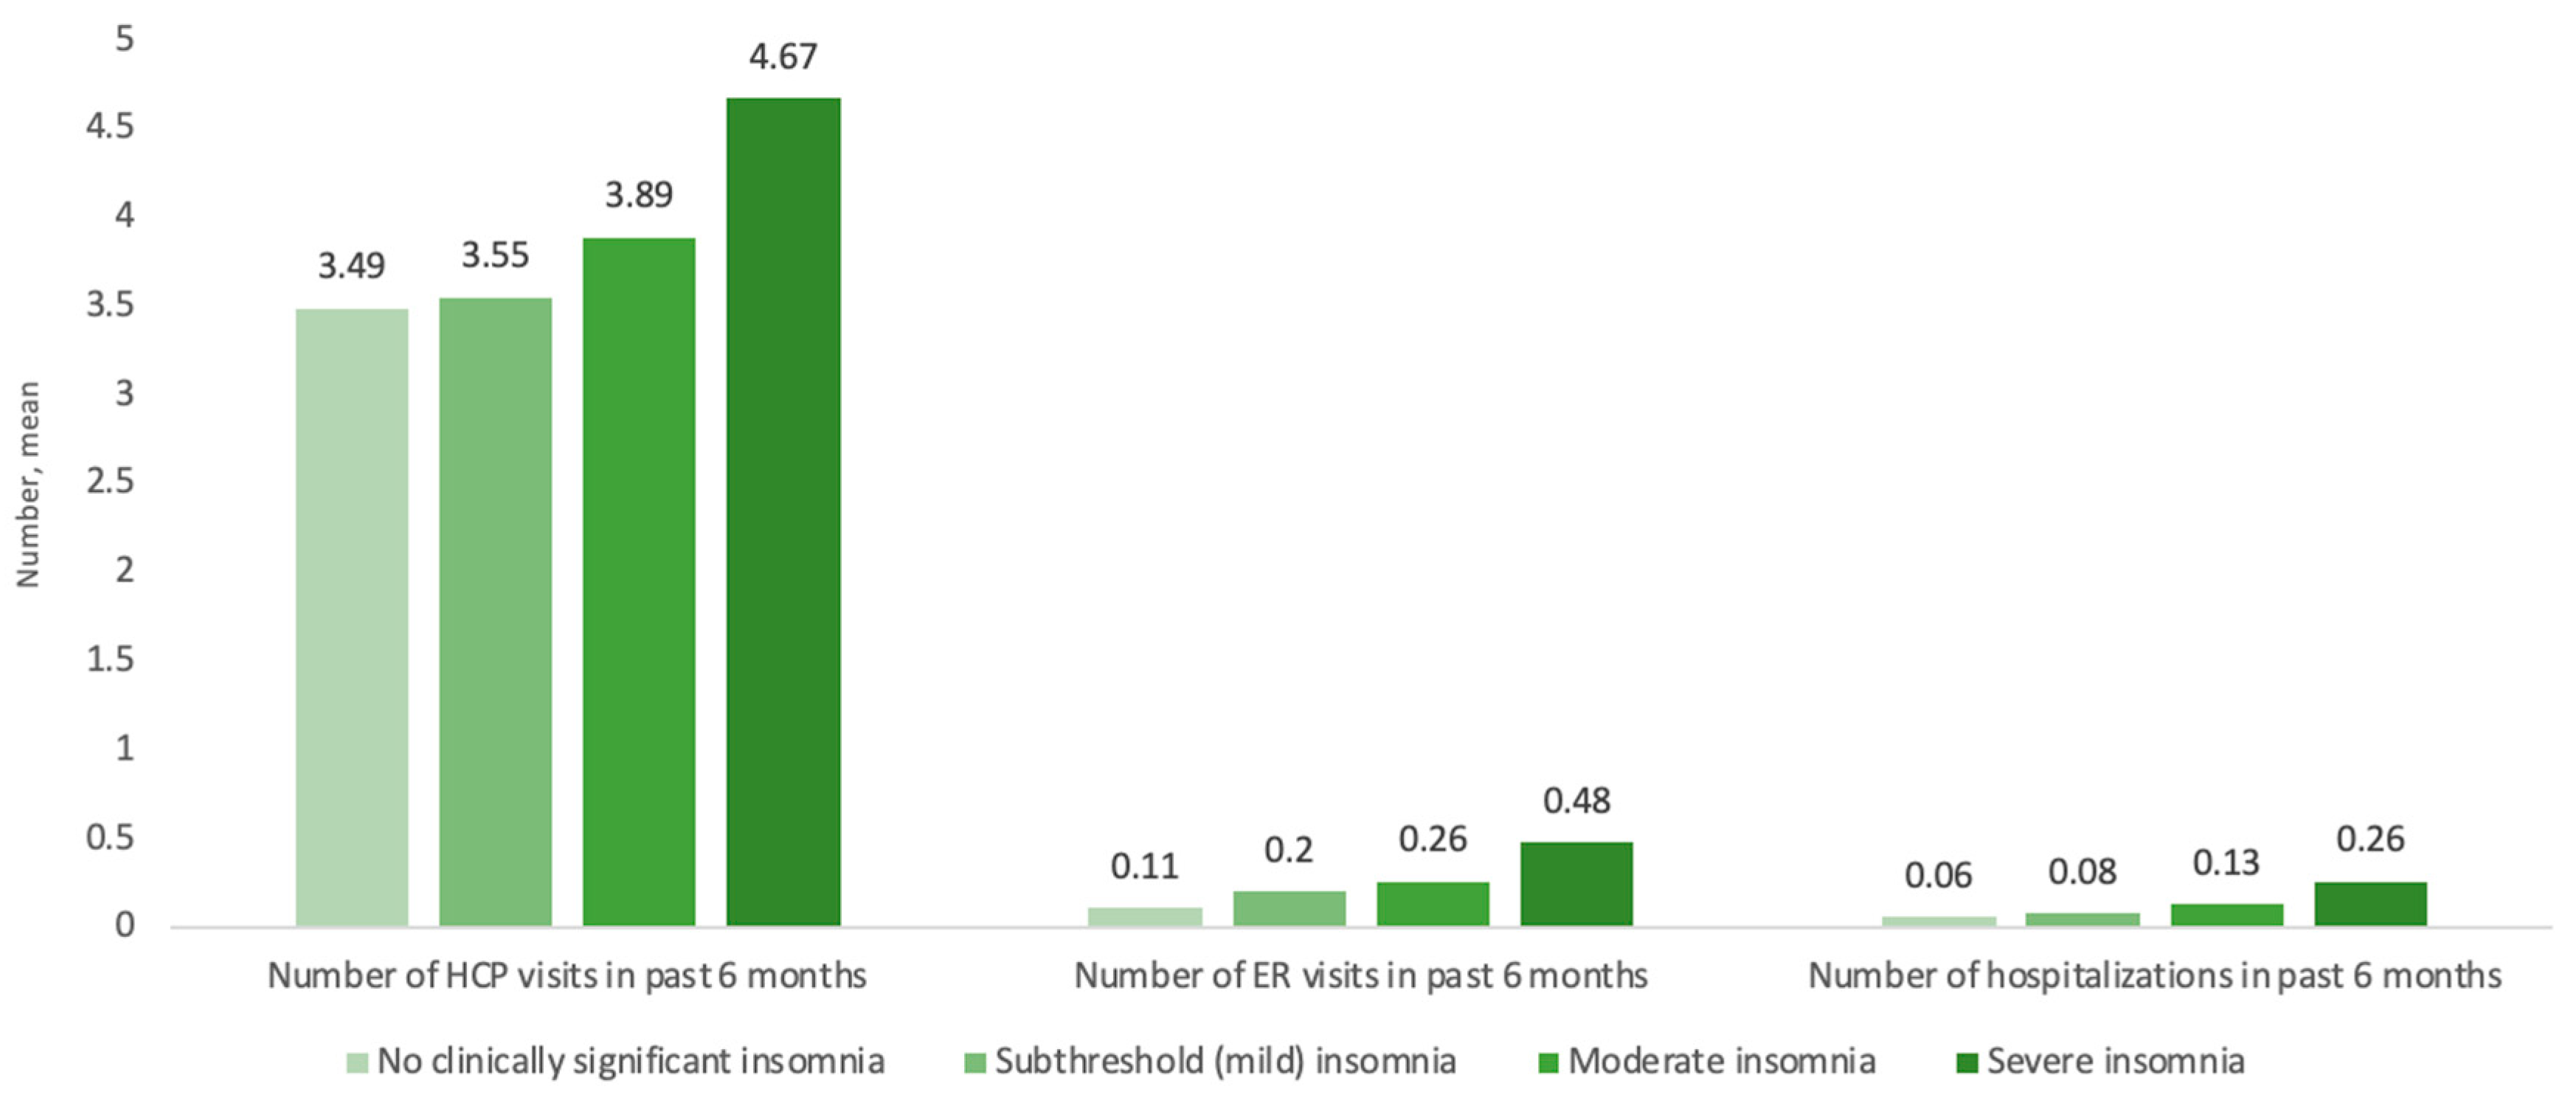
| Number of HCP visits in past 6 months | 4.67 | 0.27 | 4.16–5.24 | 1.34 | 3.89 | 0.11 | 3.67–4.12 | 1.11 | 3.55 | 0.07 | 3.41–3.69 | 1.02 | 3.49 | 0.11 | 3.27–3.72 | 1.00 | <0.001 |
| Number of ER visits in past 6 months | 0.48 | 0.06 | 0.37–0.61 | 4.19 | 0.26 | 0.02 | 0.23–0.30 | 2.31 | 0.20 | 0.01 | 0.18–0.22 | 1.73 | 0.11 | 0.01 | 0.09–0.14 | 1.00 | <0.001 |
| Number of hospitalizations in past 6 months | 0.26 | 0.04 | 0.20–0.35 | 4.26 | 0.13 | 0.01 | 0.11–0.16 | 2.11 | 0.08 | 0.01 | 0.07–0.10 | 1.34 | 0.06 | 0.01 | 0.05–0.08 | 1.00 | <0.001 |
Disclaimer/Publisher’s Note: The statements, opinions and data contained in all publications are solely those of the individual author(s) and contributor(s) and not of MDPI and/or the editor(s). MDPI and/or the editor(s) disclaim responsibility for any injury to people or property resulting from any ideas, methods, instructions or products referred to in the content. |
© 2023 by the authors. Licensee MDPI, Basel, Switzerland. This article is an open access article distributed under the terms and conditions of the Creative Commons Attribution (CC BY) license (https://creativecommons.org/licenses/by/4.0/).
Share and Cite
Chalet, F.-X.; Saskin, P.; Ahuja, A.; Thompson, J.; Olopoenia, A.; Modi, K.; Morin, C.M.; Wickwire, E.M. The Associations between Insomnia Severity and Health Outcomes in the United States. J. Clin. Med. 2023, 12, 2438. https://doi.org/10.3390/jcm12062438
Chalet F-X, Saskin P, Ahuja A, Thompson J, Olopoenia A, Modi K, Morin CM, Wickwire EM. The Associations between Insomnia Severity and Health Outcomes in the United States. Journal of Clinical Medicine. 2023; 12(6):2438. https://doi.org/10.3390/jcm12062438
Chicago/Turabian StyleChalet, François-Xavier, Paul Saskin, Ajay Ahuja, Jeffrey Thompson, Abisola Olopoenia, Kushal Modi, Charles M. Morin, and Emerson M. Wickwire. 2023. "The Associations between Insomnia Severity and Health Outcomes in the United States" Journal of Clinical Medicine 12, no. 6: 2438. https://doi.org/10.3390/jcm12062438