
Prospective Assessment of Cerebral Microbleeds with Low-Field Magnetic Resonance Imaging (0.55 Tesla MRI)
 ,
,
Abstract
:1. Introduction
2. Materials and Methods
2.1. Data Acquisition
2.2. Data Analysis
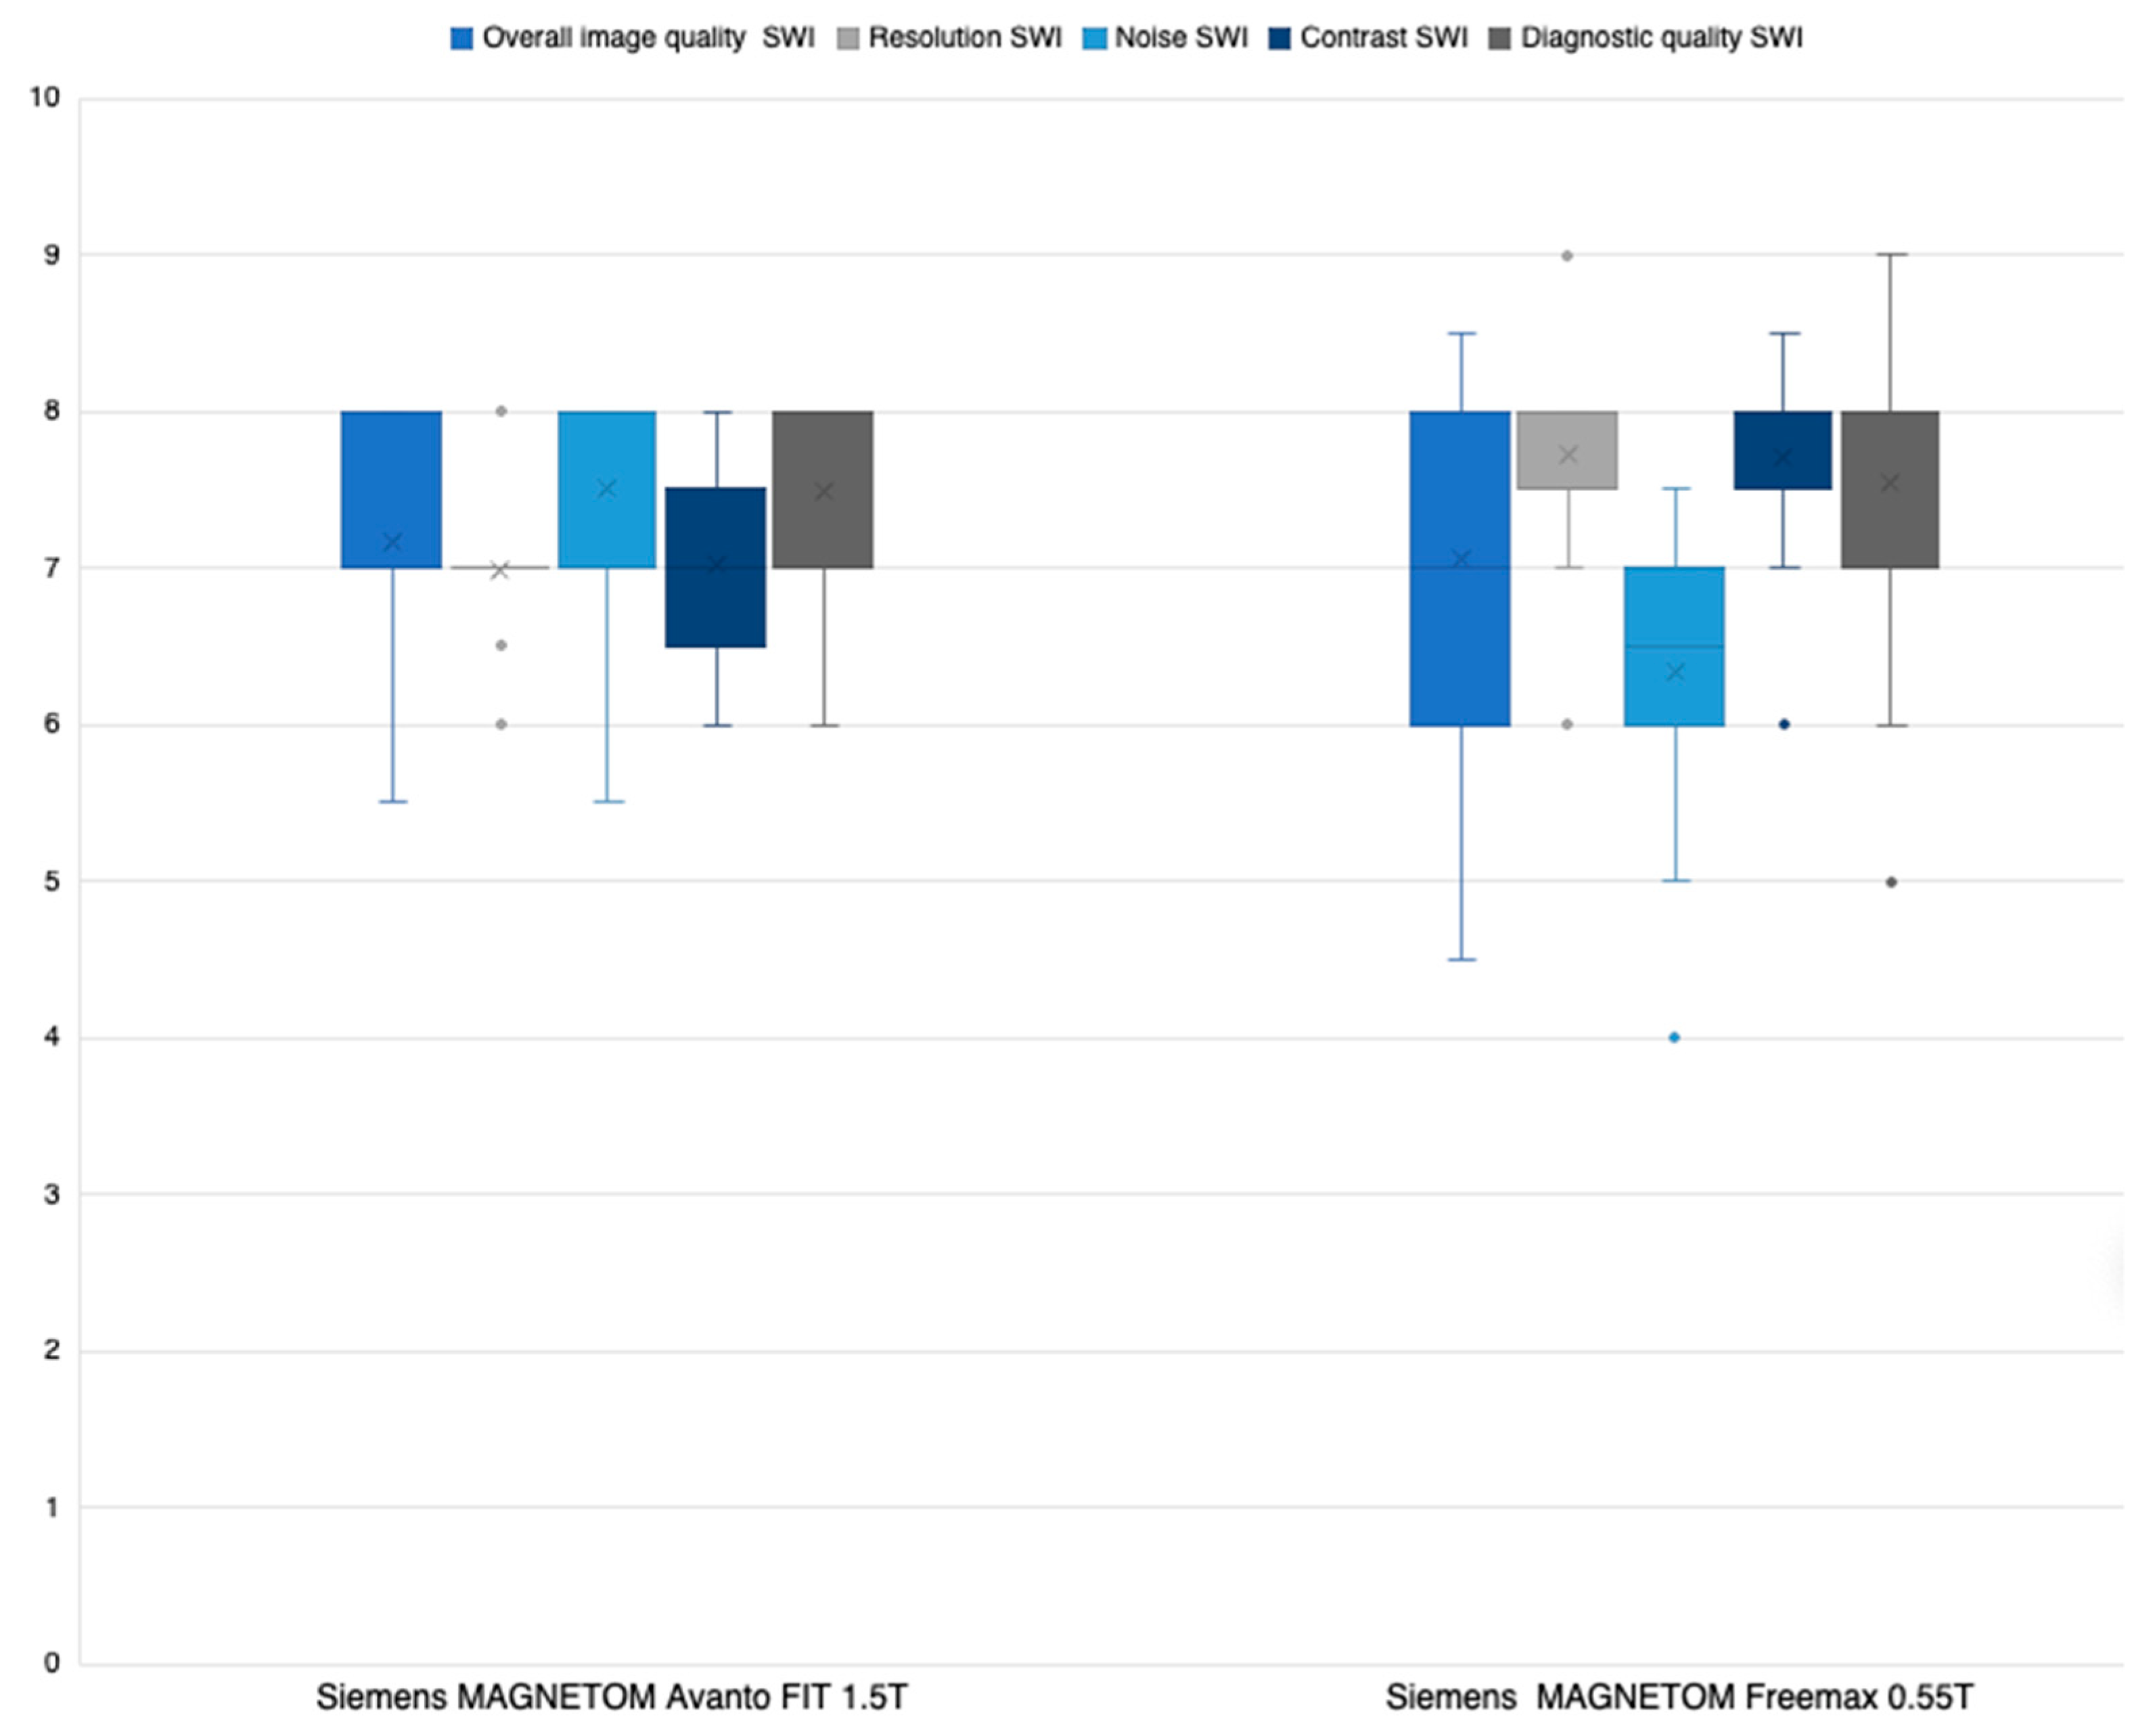
2.3. Likert Rating
- (a)
- Overall image quality;
- (b)
- Resolution;
- (c)
- Noise;
- (d)
- Contrast;
- (e)
- Diagnostic quality.
2.4. Reading Study
3. Statistical Analysis
4. Results
5. Discussion
Limitations
6. Conclusions
Author Contributions
Funding
Institutional Review Board Statement
Informed Consent Statement
Data Availability Statement
Conflicts of Interest
Abbreviations
| ADC | apparent diffusion coefficient |
| bSSFP | balanced steady-state free precession |
| BW | bandwidth |
| CAA | cerebral amyloid angiopathy |
| CMB | cerebral microbleed |
| CNR | contrast-to-noise ratio |
| CT | computed tomography |
| DWI | diffusion-weighted imaging |
| FLAIR | fluid-attenuated inversion recovery |
| ICC | intraclass correlation coefficient |
| MRI | magnetic resonance imaging |
| NIHSS | National Institutes of Health Stroke Scale |
| PACS | Picture Archiving and Communication System |
| QALY | quality-adjusted life-years |
| SNR | signal-to-noise ratio |
| SP | slice spacing |
| ST | slice thickness |
| SWI | susceptibility-weighted imaging |
| TIA | transient ischemic attack |
References
- Fazekas, F.; Kleinert, R.; Roob, G.; Kapeller, P.; Schmidt, R.; Hartung, H.P. Histopathologic analysis of foci of signal loss on gradient-echo T2*-weighted MR images in patients with spontaneous intracerebral hemorrhage: Evidence of microangiopathy-related microbleeds. Am. J. Neuroradiol. 1999, 20, 637–642. [Google Scholar] [PubMed]
- Greenberg, S.M.; Vernooij, M.W.; Cordonnier, C.; Viswanathan, A.; Al-Shahi Salman, R.; Warach, S.; Launer, L.J.; Van Buchem, M.A.; Breteler, M.M.; Microbleed Study Group. Cerebral microbleeds: A guide to detection and interpretation. Lancet Neurol. 2009, 8, 165–174. [Google Scholar] [CrossRef] [PubMed]
- Shams, S.; Martola, J.; Cavallin, L.; Granberg, T.; Shams, M.; Aspelin, P.; Wahlund, L.O.; Kristoffersen-Wiberg, M. SWI or T2*: Which MRI sequence to use in the detection of cerebral microbleeds? The Karolinska Imaging Dementia Study. Am. J. Neuroradiol. 2015, 36, 1089–1095. [Google Scholar] [CrossRef] [PubMed]
- Conijn, M.M.A.; Geerlings, M.I.; Biessels, G.J.; Takahara, T.; Witkamp, T.D.; Zwanenburg, J.J.M.; Luijten, P.R.; Hendrikse, J. Cerebral microbleeds on MR imaging: Comparison between 1.5 and 7T. Am. J. Neuroradiol. 2011, 32, 1043–1049. [Google Scholar] [CrossRef]
- Liu, Y.; Leong, A.T.L.; Zhao, Y.; Xiao, L.; Mak, H.K.F.; Tsang, A.C.O.; Lau, G.K.K.; Leung, G.K.K.; Wu, E.X. A low-cost and shielding-free ultra-low-field brain MRI scanner. Nat. Commun. 2021, 12, 7238. [Google Scholar] [CrossRef] [PubMed]
- Heye, T.; Knoerl, R.; Wehrle, T.; Mangold, D.; Cerminara, A.; Loser, M.; Plumeyer, M.; Degen, M.; Lüthy, R.; Brodbeck, D.; et al. The energy consumption of Radiology: Energy- And cost-saving opportunities for CT and MRI operation. Radiology 2020, 295, 593–605. [Google Scholar] [CrossRef] [PubMed]
- Rusche, T.; Breit, H.C.; Bach, M.; Wasserthal, J.; Gehweiler, J.; Manneck, S.; Lieb, J.M.; De Marchis, G.M.; Psychogios, M.N.; Sporns, P.B. Potential of Stroke Imaging Using a New Prototype of Low-Field MRI: A Prospective Direct 0.55 T/1.5 T Scanner Comparison. J. Clin. Med. 2022, 11, 2798. [Google Scholar] [CrossRef] [PubMed]
- Osmanodja, F.; Rösch, J.; Knott, M.; Doerfler, A.; Grodzki, D.; Uder, M.; Heiss, R. Diagnostic Performance of 0.55 T MRI for Intracranial Aneurysm Detection. Investig. Radiol. 2023, 58, 121–125. [Google Scholar] [CrossRef] [PubMed]
- Rusche, T.; Vosshenrich, J.; Winkel, D.J.; Donners, R.; Segeroth, M.; Bach, M.; Merkle, E.M.; Breit, H.-C. More Space, Less Noise-New-generation Low-Field Magnetic Resonance Imaging Systems Can Improve Patient Comfort: A Prospective 0.55 T–1.5 T-Scanner Comparison. J. Clin. Med. 2022, 11, 6705. [Google Scholar] [CrossRef] [PubMed]
- Vosshenrich, J.; Breit, H.C.; Bach, M.; Merkle, E.M. Economic aspects of low-field magnetic resonance imaging: Acquisition, installation, and maintenance costs of 0.55 T systems. Radiologe 2022, 62, 400–404. [Google Scholar] [CrossRef] [PubMed]
- Charidimou, A.; Shams, S.; Romero, J.R.; Ding, J.; Veltkamp, R.; Horstmann, S.; Eiriksdottir, G.; van Buchem, M.A.; Gudnason, V.; Himali, J.J.; et al. Clinical significance of cerebral microbleeds on MRI: A comprehensive meta-analysis of risk of intracerebral hemorrhage, ischemic stroke, mortality, and dementia in cohort studies (v1). Int. J. Stroke 2018, 13, 454–468. [Google Scholar] [CrossRef] [PubMed]
- Charidimou, A.; Imaizumi, T.; Moulinm, S.; Biffi, A.; Samarasekera, N.; Yakushiji, Y.; Peeters, A.; Vandermeeren, Y.; Laloux, P.; Baron, J.C.; et al. Brain hemorrhage recurrence, small vessel disease type, and cerebral microbleeds: A meta-analysis. Neurology 2017, 89, 820–829. [Google Scholar] [CrossRef] [PubMed]
- Charidimou, A.; Werring, D.J. Cerebral microbleeds and cognition in cerebrovascular disease: An update. J. Neurol. Sci. 2012, 322, 50–55. [Google Scholar] [CrossRef] [PubMed]
- Bian, W.; Hess, C.P.; Chang, S.M.; Nelson, S.J.; Lupo, J.M. Susceptibility-weighted MR imaging of radiation therapy-induced cerebral microbleeds in patients with glioma: A comparison between 3 T and 7 T. Neuroradiology 2014, 56, 91–96. [Google Scholar] [CrossRef]
- Hütter, B.O.; Altmeppen, J.; Kraff, O.; Maderwa, S.; Theysohn, J.M.; Ringelstein, A.; Wrede, K.H.; Dammann, P.; Quick, H.H.; Schlamann, M.; et al. Higher sensitivity for traumatic cerebral microbleeds at 7 T ultra-high field MRI: Is it clinically significant for the acute state of the patients and later quality of life? Ther. Adv. Neurol. Disord. 2020, 13, 1756286420911295. [Google Scholar] [CrossRef] [PubMed]
- Conijn, M.M.; Hoogduin, J.M.; van der Graaf, Y.; Hendrikse, J.; Luijten, P.R.; Geerlings, M.I. Microbleeds, lacunar infarcts, white matter lesions and cerebrovascular reactivity—A 7 T study. Neuroimage 2012, 59, 950–956. [Google Scholar] [CrossRef]
- Theysohn, J.M.; Kraff, O.; Maderwald, S.; Barth, M.; Ladd, S.C.; Forsting, M.; Ladd, M.E.; Gizewski, E.R. 7 tesla MRI of microbleeds and white matter lesions as seen in vascular dementia. J. Magn. Reson. Imaging 2011, 33, 782–791. [Google Scholar] [CrossRef] [PubMed]
- Stehling, C.; Wersching, H.; Kloska, S.P.; Kirchhof, P.; Ring, J.; Nassenstein, I.; Allkemper, T.; Knecht, S.; Bachmann, R.; Heindel, W. Detection of asymptomatic cerebral microbleeds: A comparative study at 1.5 and 3.0 T. Acad. Radiol. 2008, 15, 895–900. [Google Scholar] [CrossRef] [PubMed]


| Siemens MAGNETOM FreeMax 0.55 T | Siemens MAGNETOM Avanto Fit 1.5 T | |
|---|---|---|
| FLAIR tra | ||
| Field strength in T | 0.55 | 1.5 |
| Field of view (FOV) in mm2 | 209 × 230 | 187 × 230 |
| Slice thickness (ST) in mm | 3 | 3 |
| Slice spacing (SS) | 3.6 | 3.6 |
| Number of slices | 40 | 40 |
| Pixel spacing (PS) in mm2 | 1.28 × 1.03 | 0.9 × 0.9 |
| Repetition time (TR) in msec | 7780 | 8510 |
| Echo time (TE) in msec | 96 | 112 |
| Inversion delay (TI) in msec | 2368.8 | 2460 |
| Turbo factor | 15 | 19 |
| Time of acquisition (TA) in min | 05:28 | 03:26 |
| BW ((BW)) | 150 | 130 |
| 3D SWI tra | ||
| Field strength in T | 0.55 | 1.5 |
| Sequence type | Multi-shot 3D EPI | 3D FLASH |
| Field of view (FOV) in mm2 | 201 × 230 | 194 × 230 |
| Slice thickness (ST) in mm | 3 | 3 |
| Number of slices | 40 | 48 |
| Pixel spacing (PS) in mm2 | 0.94 × 0.8 | 1.12 × 0.9 |
| Repetition time (TR) in msec | 172 | 48 |
| Echo time (TE) in msec | 100 | 40 |
| Parallel imaging | - | GRAPPA factor 2 |
| Time of acquisition (TA) in min | 02:23 | 02:17 |
| BW ((BW)) | 276 | 80 |
| Single-shot diffusion EPI tra | ||
| Field strength in T | 0.55 | 1.5 |
| Field of view (FOV) in mm2 | 220 × 220 | 230 × 230 |
| Slice thickness (ST) in mm | 3 | 3 |
| Slice spacing (SS) | 3.6 | 3.6 |
| Number of slices | 40 | 40 |
| Pixel spacing (PS) in mm2 | 1.67 × 1.67 | 1.44 × 1.44 |
| b-values in s/mm2 | 0, 1000 | 0, 1000 |
| Repetition time (TR) in msec | 7400 | 6200 |
| Echo time (TE) in msec | 102 | 103 |
| Parallel imaging | GRAPPA factor 2 | GRAPPA factor 2 |
| Time of acquisition (TA) in min | 04:35 | 02:04 |
| BW ((BW)) | 842 | 1490 |
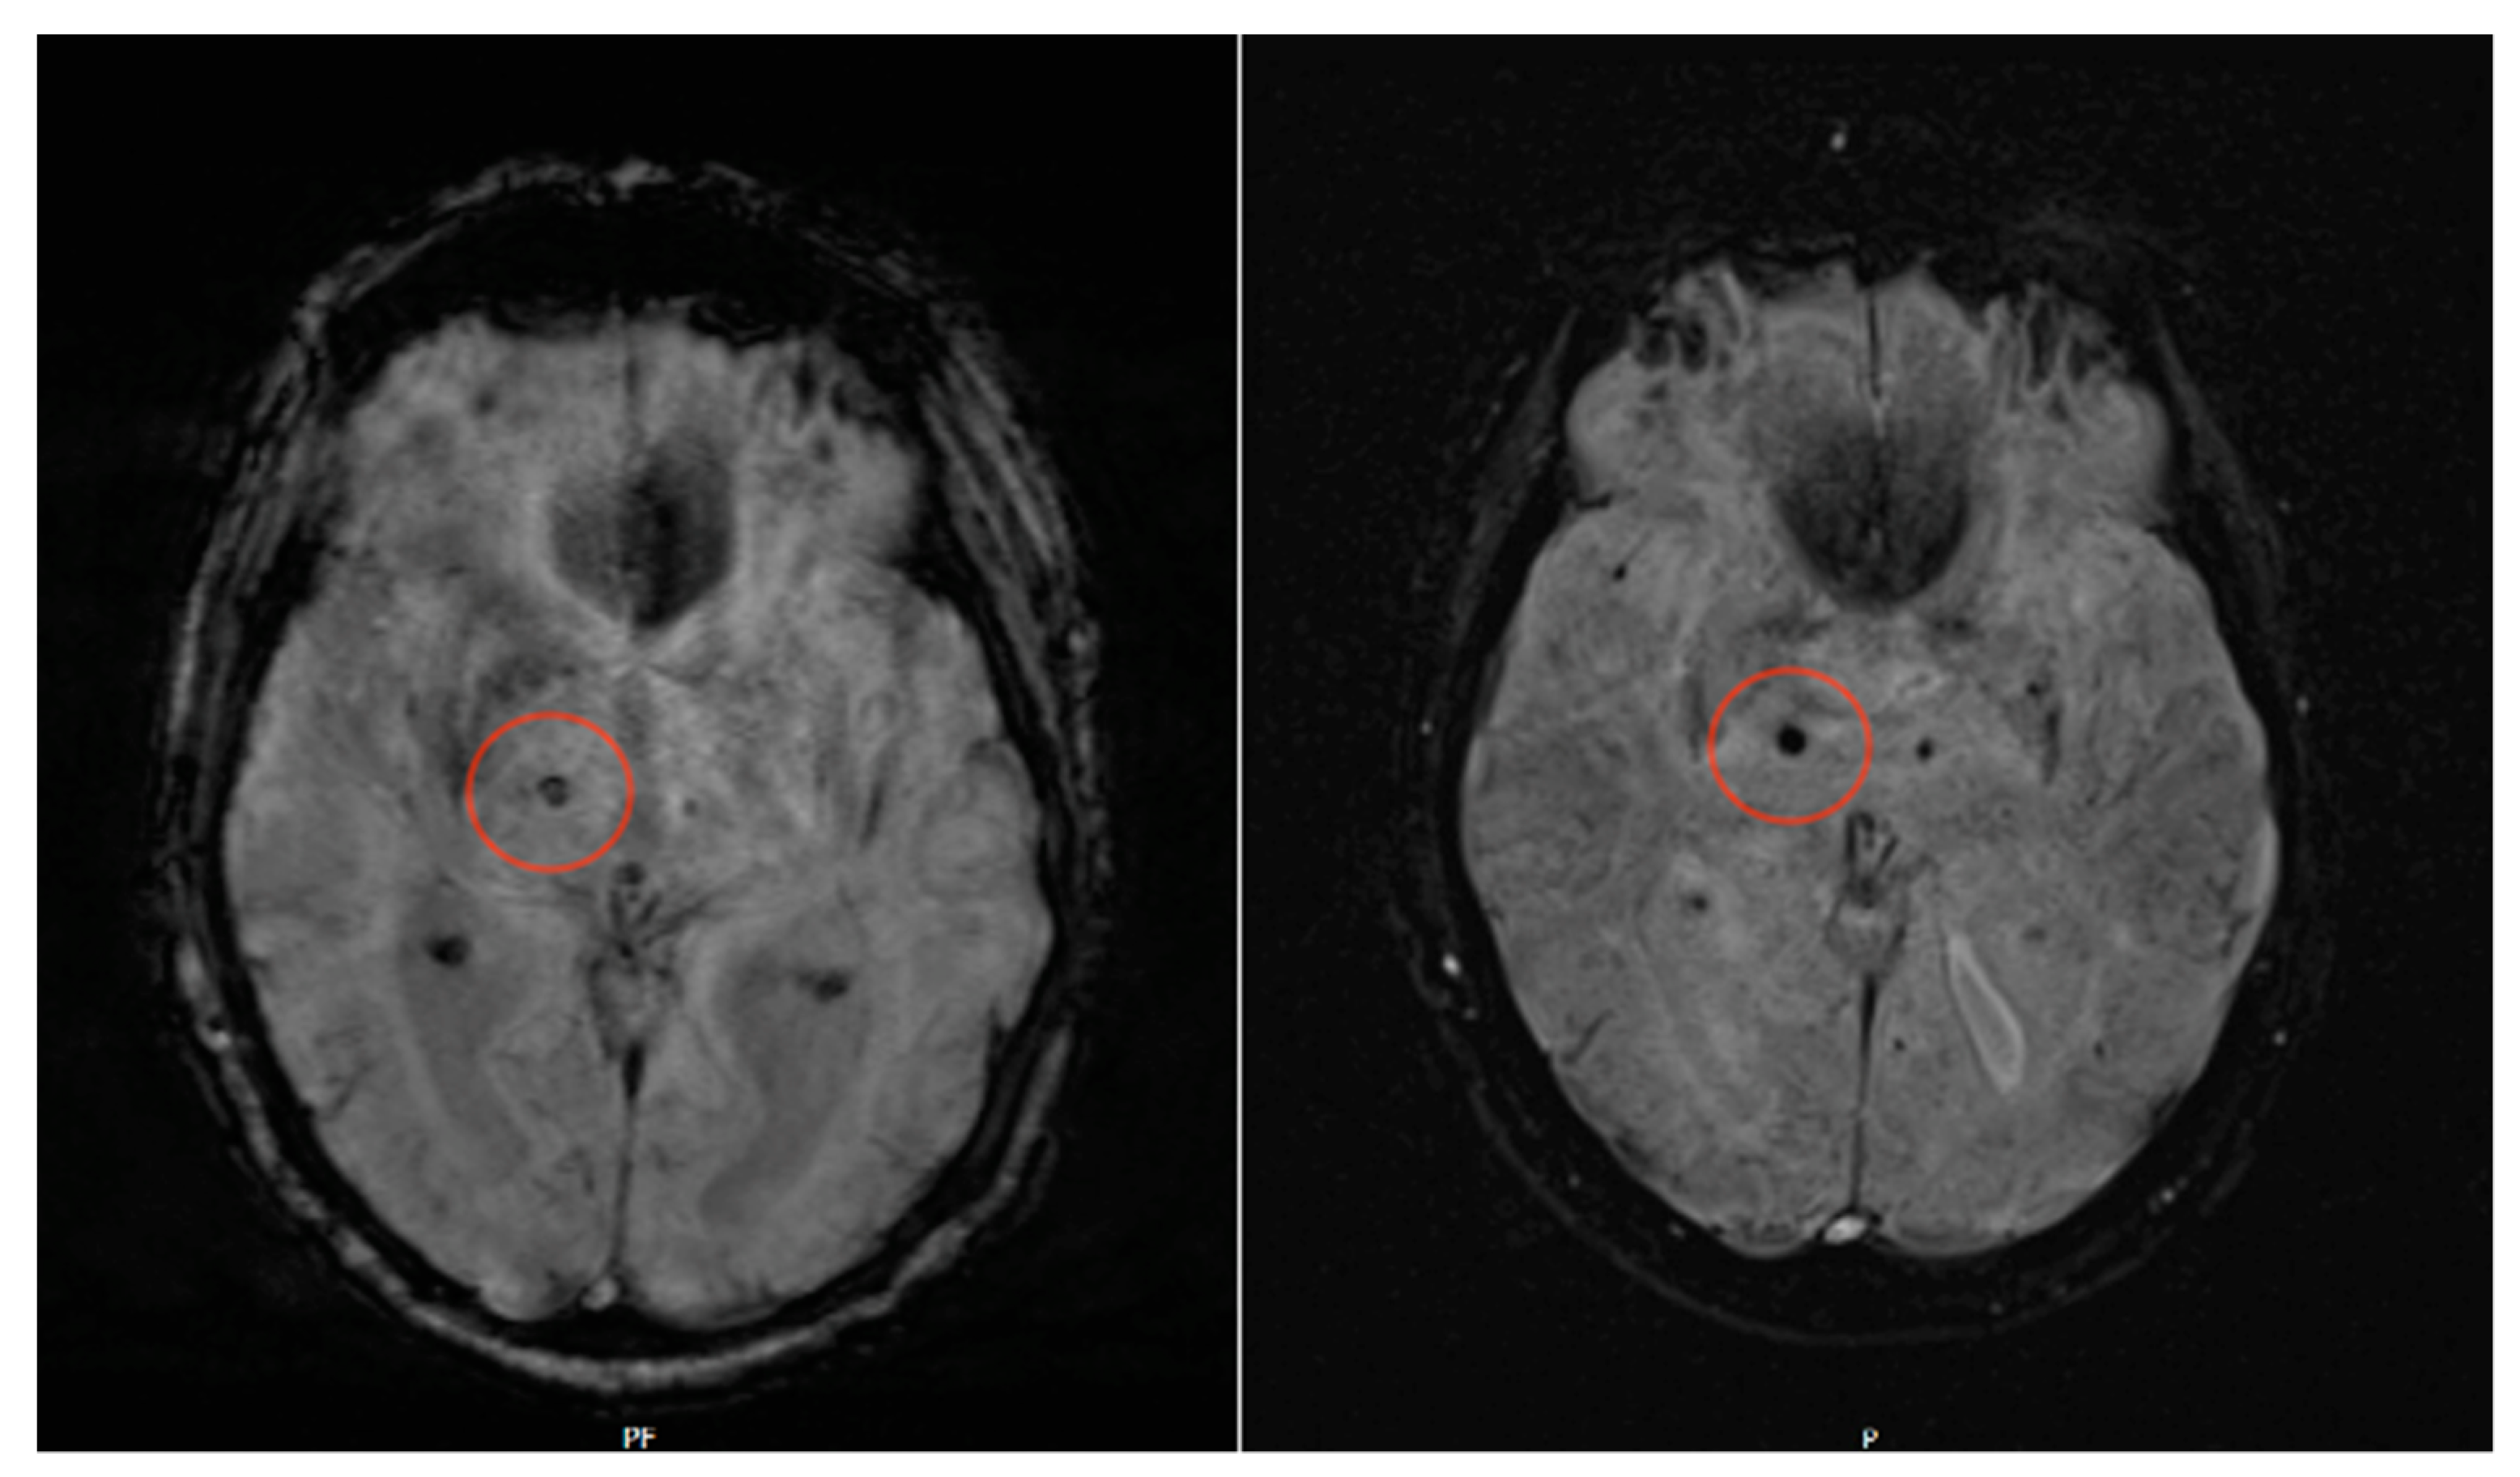
| Patient | Patient Age | CMB Yes/No | Number of CMB | (Main)-Localization of CMB | Time Gap between Scans in min |
|---|---|---|---|---|---|
| Patient 1 | 87 | Yes | 1 | Left occipital | 46 |
| Patient 2 | 73 | Yes | 3 | Right frontal/periventricular | 25 |
| Patient 3 | 88 | Yes | 4 | Right temporal/parietal | 37 |
| Patient 4 | 29 | No | 0 | - | 33 |
| Patient 5 | 82 | No | 0 | - | 93 |
| Patient 6 | 70 | No | 0 | - | 44 |
| Patient 7 | 87 | Yes | 2 | Left occipital | 32 |
| Patient 8 | 74 | No | 0 | - | 25 |
| Patient 9 | 60 | No | 0 | - | 21 |
| Patient 10 | 44 | No | 0 | - | 49 |
| Patient 11 | 84 | Yes | 1 | Left occipital | 33 |
| Patient 12 | 58 | No | 0 | - | 40 |
| Patient 13 | 80 | No | 0 | - | 35 |
| Patient 14 | 65 | Yes | 1 | Left Putamen | 20 |
| Patient 15 | 65 | Yes | 2 | Left frontal | 24 |
| Patient 16 | 75 | No | 0 | - | 22 |
| Patient 17 | 84 | No | 0 | - | 48 |
| Patient 18 | 82 | Yes | 4 | Left frontal | 32 |
| Patient 19 | 79 | Yes | 1 | Left occipital | 42 |
| Patient 20 | 84 | Yes | 1 | Left periventricular | 32 |
| Patient 21 | 86 | Yes | >10 | Bilateral Thalamus | 25 |
| Patient 22 | 83 | No | 0 | - | 31 |
| Patient 23 | 89 | No | 0 | - | 38 |
| Patient 24 | 69 | Yes | 3 | Left periventricular | 42 |
| Patient 25 | 53 | Excluded | - | - | 916 |
| Patient 26 | 59 | Excluded | - | - | 2936 |
| Patient 27 | 46 | Excluded | - | - | 2812 |
Disclaimer/Publisher’s Note: The statements, opinions and data contained in all publications are solely those of the individual author(s) and contributor(s) and not of MDPI and/or the editor(s). MDPI and/or the editor(s) disclaim responsibility for any injury to people or property resulting from any ideas, methods, instructions or products referred to in the content. |
© 2023 by the authors. Licensee MDPI, Basel, Switzerland. This article is an open access article distributed under the terms and conditions of the Creative Commons Attribution (CC BY) license (https://creativecommons.org/licenses/by/4.0/).
Share and Cite
Rusche, T.; Breit, H.-C.; Bach, M.; Wasserthal, J.; Gehweiler, J.; Manneck, S.; Lieb, J.M.; De Marchis, G.M.; Psychogios, M.; Sporns, P.B. Prospective Assessment of Cerebral Microbleeds with Low-Field Magnetic Resonance Imaging (0.55 Tesla MRI). J. Clin. Med. 2023, 12, 1179. https://doi.org/10.3390/jcm12031179
Rusche T, Breit H-C, Bach M, Wasserthal J, Gehweiler J, Manneck S, Lieb JM, De Marchis GM, Psychogios M, Sporns PB. Prospective Assessment of Cerebral Microbleeds with Low-Field Magnetic Resonance Imaging (0.55 Tesla MRI). Journal of Clinical Medicine. 2023; 12(3):1179. https://doi.org/10.3390/jcm12031179
Chicago/Turabian StyleRusche, Thilo, Hanns-Christian Breit, Michael Bach, Jakob Wasserthal, Julian Gehweiler, Sebastian Manneck, Johanna M. Lieb, Gian Marco De Marchis, Marios Psychogios, and Peter B. Sporns. 2023. "Prospective Assessment of Cerebral Microbleeds with Low-Field Magnetic Resonance Imaging (0.55 Tesla MRI)" Journal of Clinical Medicine 12, no. 3: 1179. https://doi.org/10.3390/jcm12031179