

iERM: An Interpretable Deep Learning System to Classify Epiretinal Membrane for Different Optical Coherence Tomography Devices: A Multi-Center Analysis

 , ,
, ,
Abstract
:1. Introduction
2. Materials and Methods
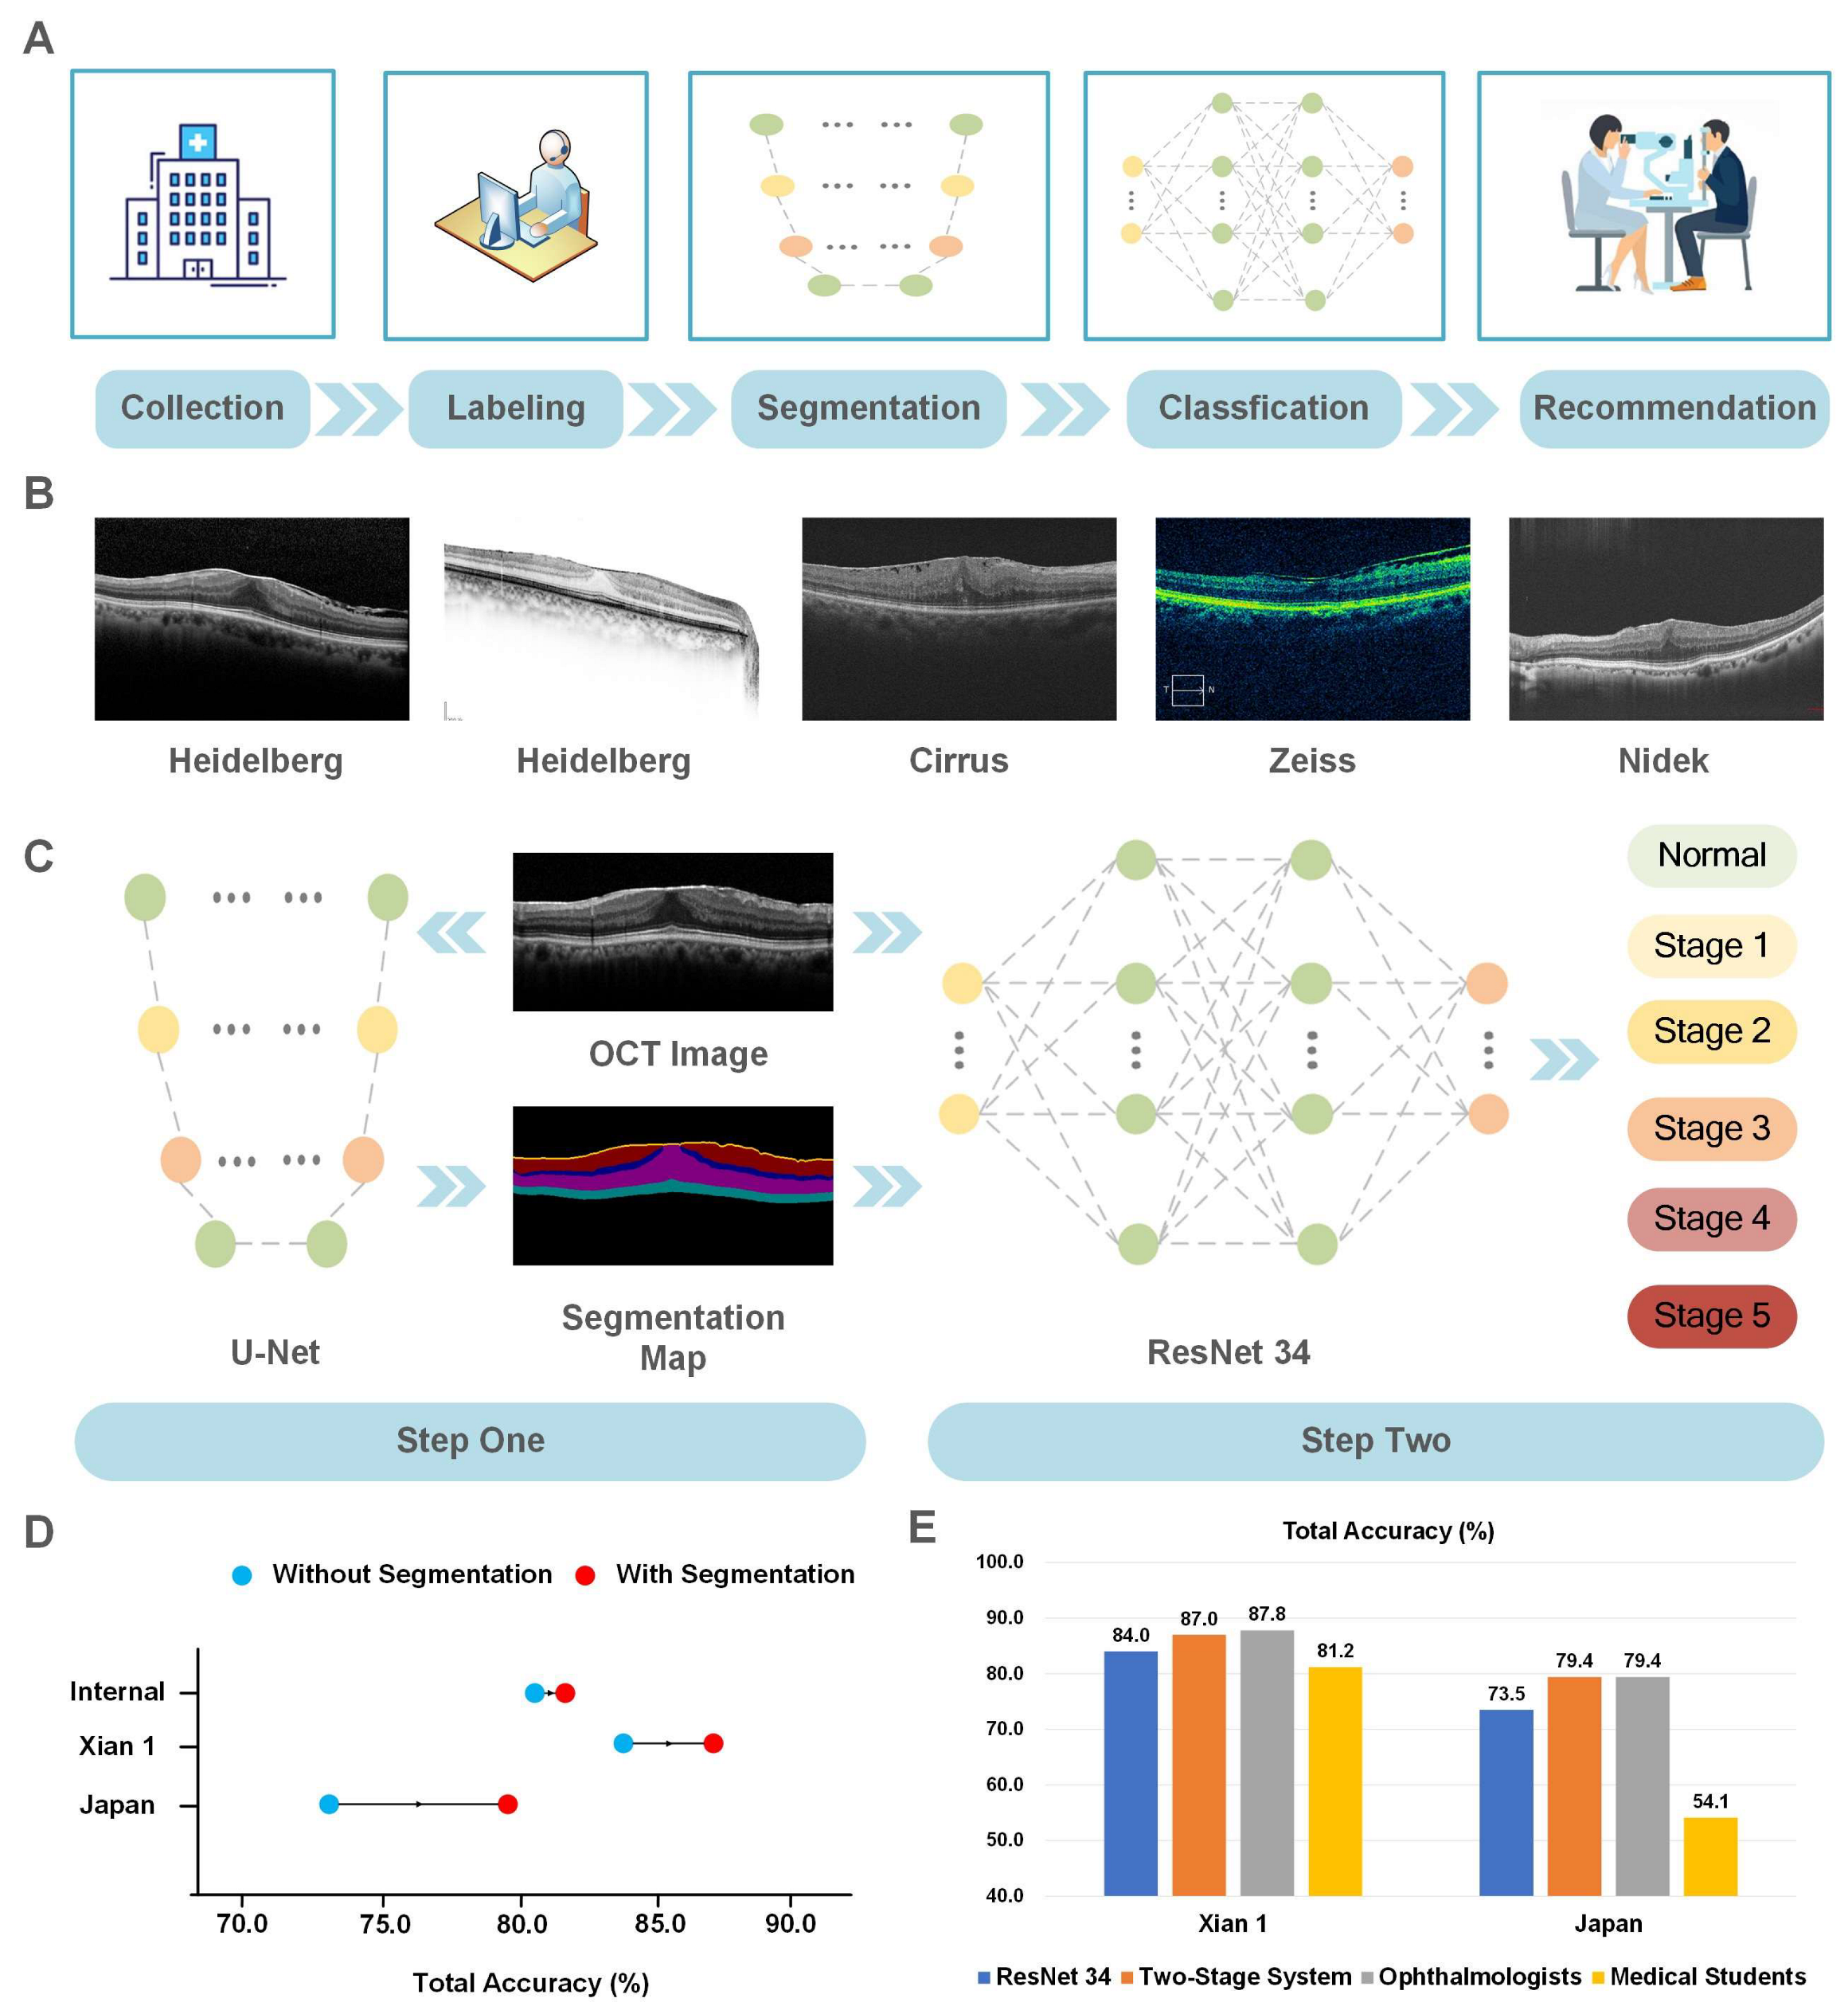
2.1. Data Collection
2.2. Image Labeling
2.3. Data Processing
2.4. Development of the DL System
- (1)
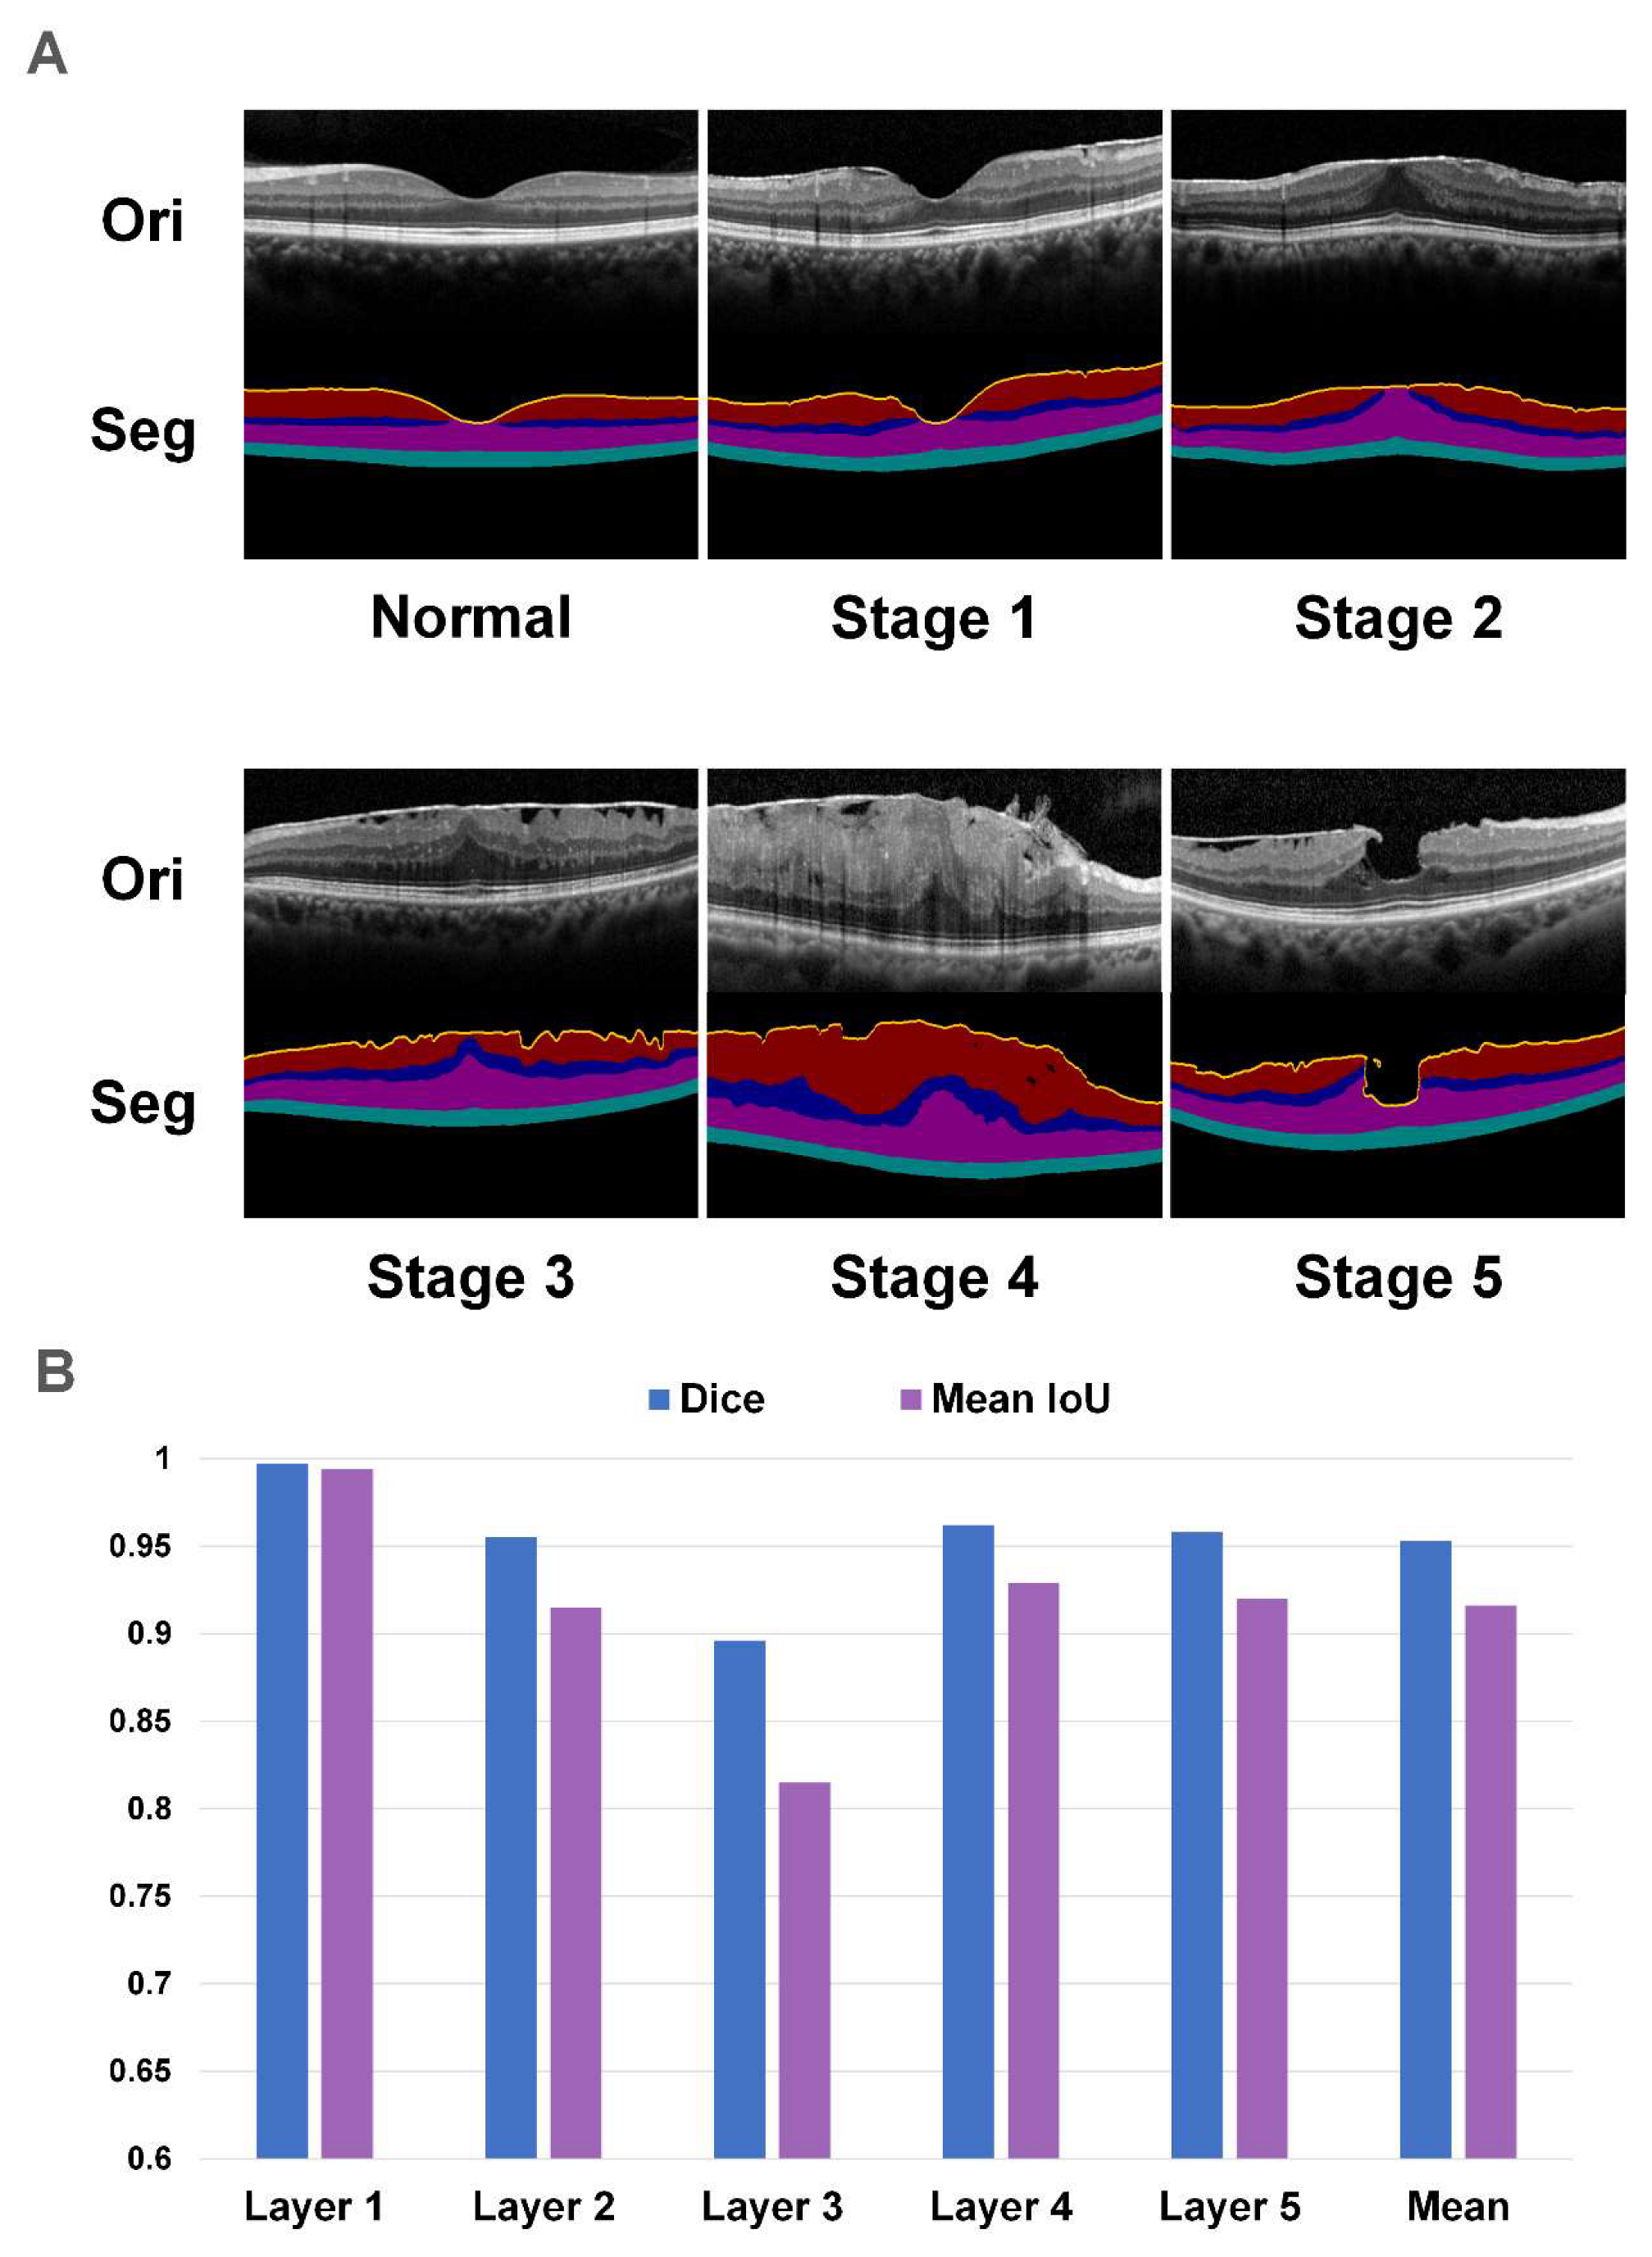
- Segmentation model
- (2)
- Classification Model
- (3)
- Two-stage System
2.5. Statistical Analysis
2.6. Model Visualization
3. Results
3.1. The Performance of the Segmentation Network
3.2. The Comparison of Three Classification Networks
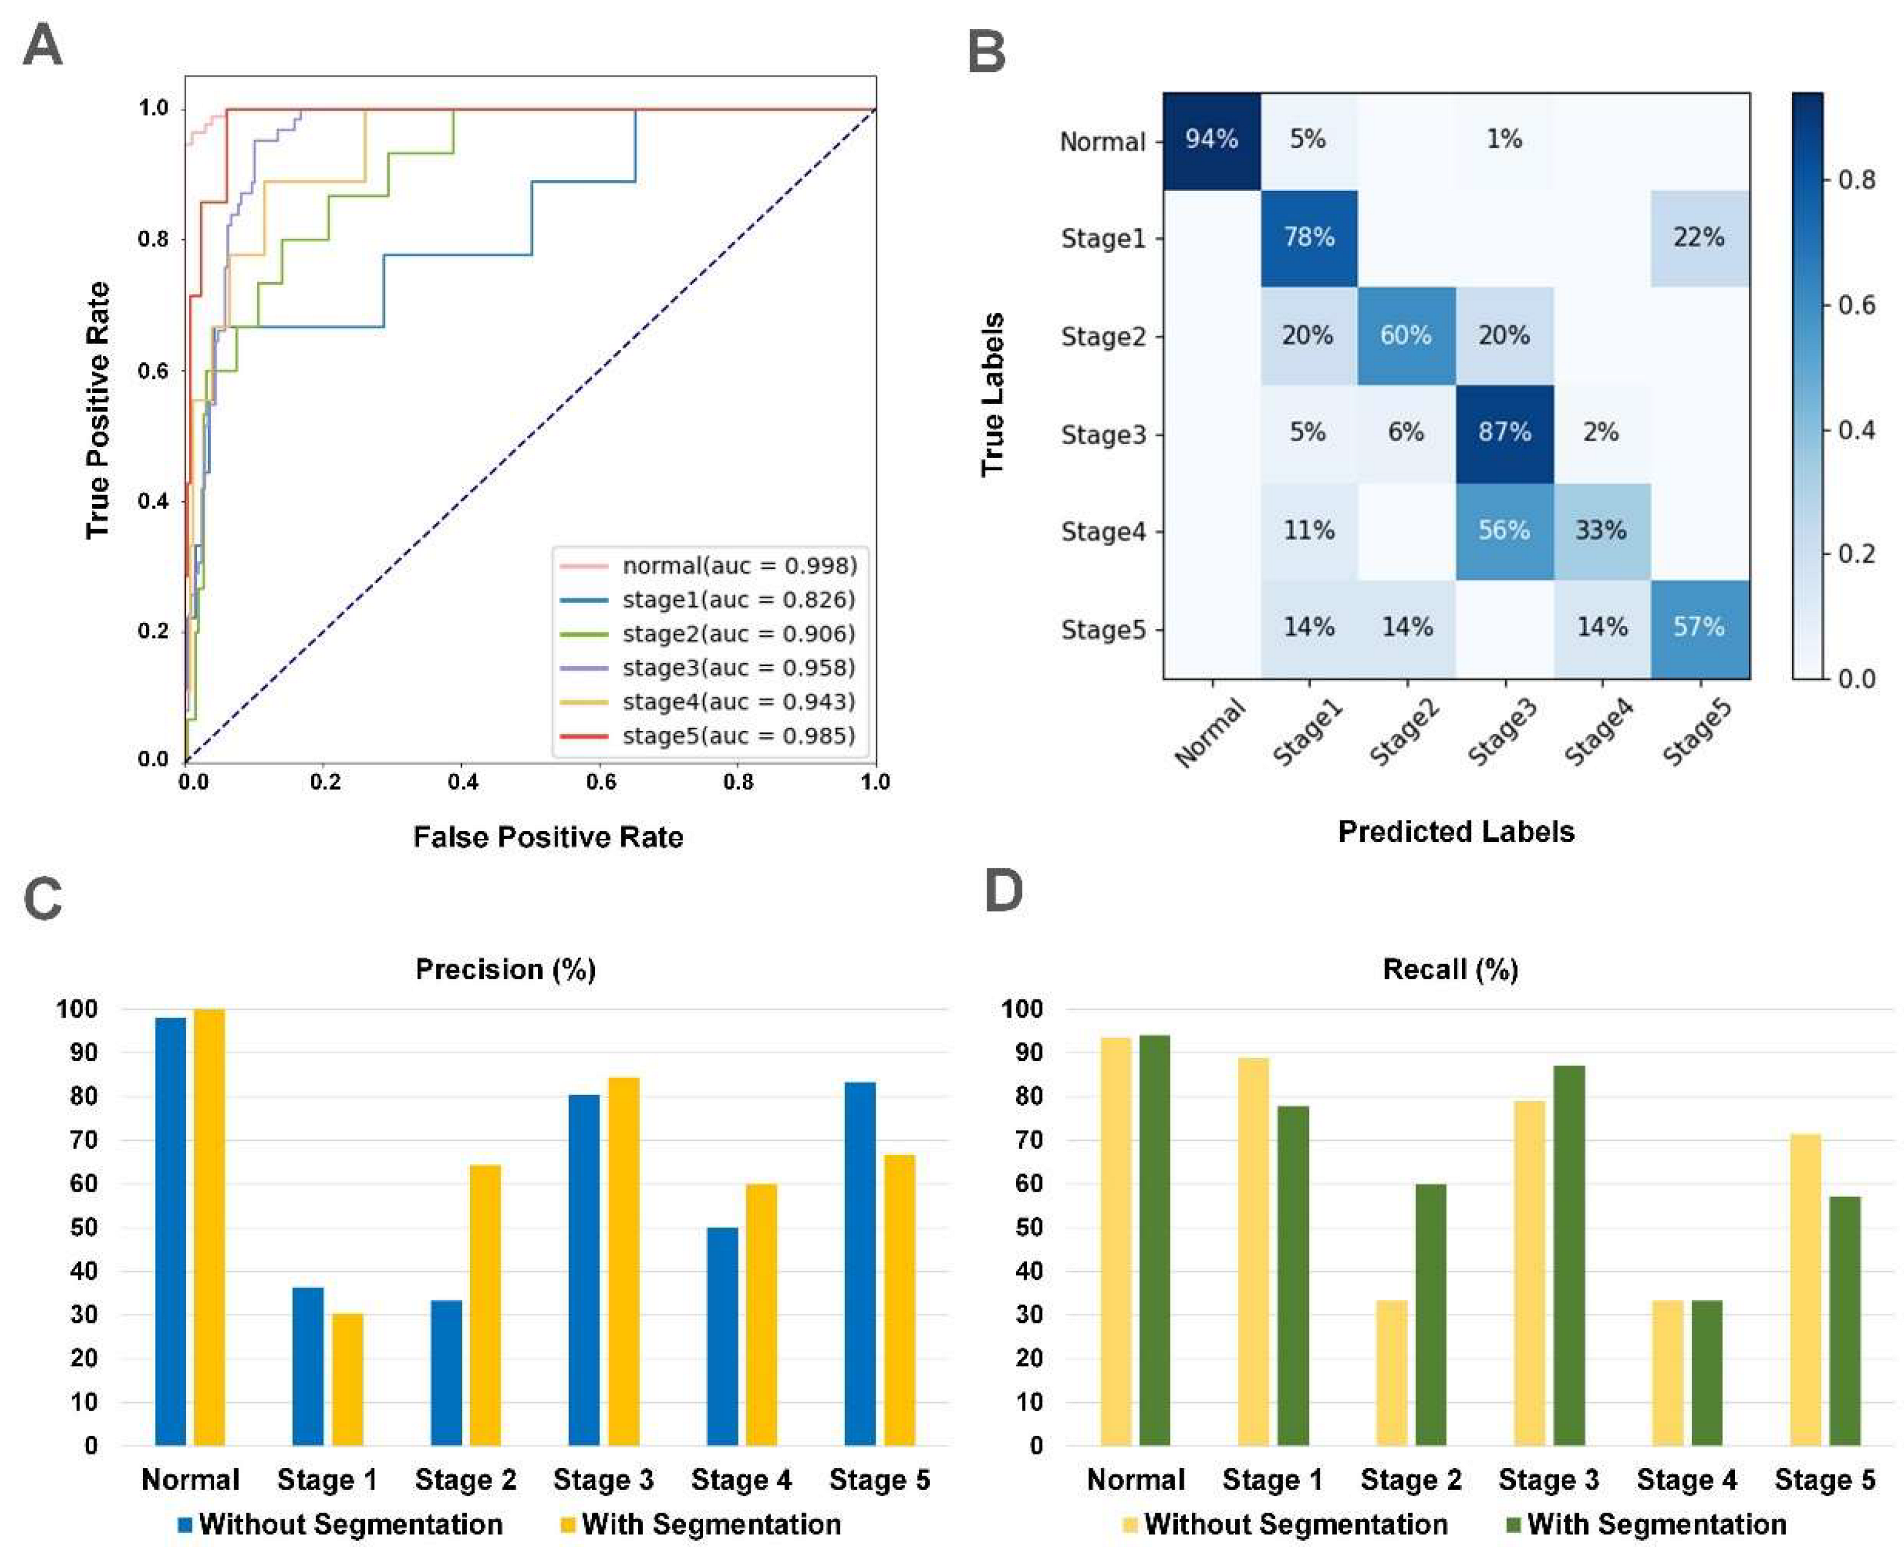
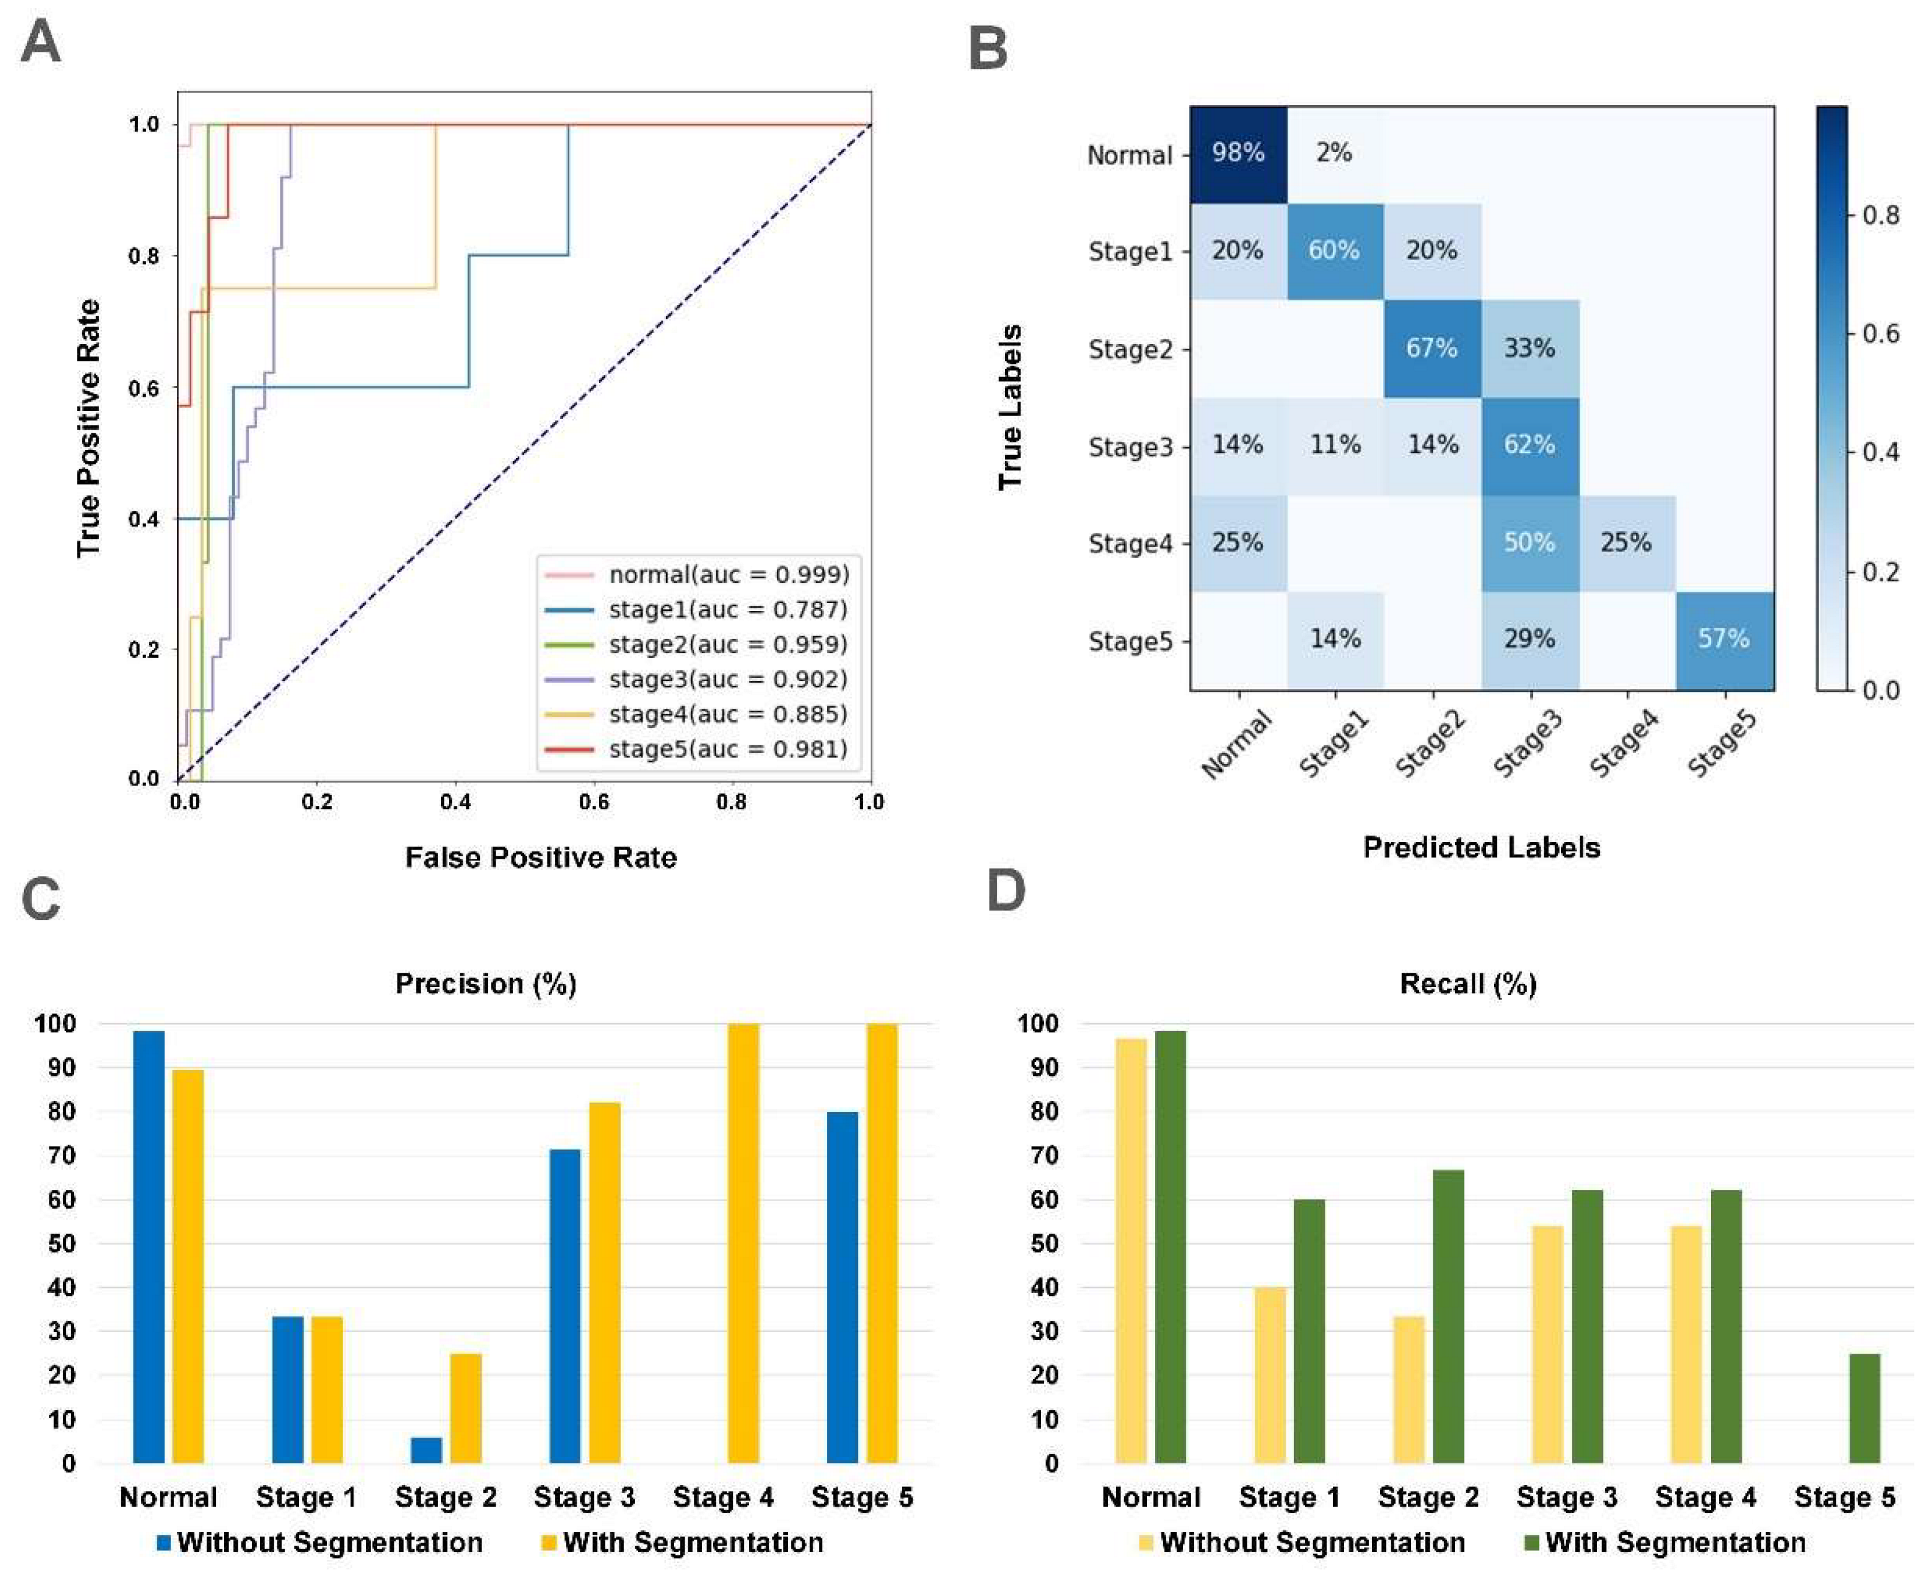
3.3. The Performance of iERM
3.4. The Comparison of iERM and Human
4. Discussion
5. Conclusions
Supplementary Materials
Author Contributions
Funding
Institutional Review Board Statement
Informed Consent Statement
Data Availability Statement
Acknowledgments
Conflicts of Interest
Abbreviations
References
- Fraser-Bell, S.; Guzowski, M.; Rochtchina, E.; Wang, J.J.; Mitchell, P. Five-year cumulative incidence and progression of epiretinal membranes: The Blue Mountains Eye Study. Ophthalmology 2003, 110, 34–40. [Google Scholar] [CrossRef] [PubMed]
- Carpineto, P.; Ciciarelli, V.; Borrelli, E.; Aharrh-Gnama, A.; Mastropasqua, R. Epiretinal Membrane in Eyes with Vitreomacular Traction. Retina 2019, 39, 1061–1065. [Google Scholar] [CrossRef] [PubMed]
- Meuer, S.M.; Myers, C.E.; Klein, B.E.; Swift, M.K.; Huang, Y.; Gangaputra, S.; Pak, J.W.; Danis, R.P.; Klein, R. The Epidemiology of Vitreoretinal Interface Abnormalities as Detected by Spectral-Domain Optical Coherence Tomography. Ophthalmology 2014, 122, 787–795. [Google Scholar] [CrossRef] [PubMed] [Green Version]
- Cheung, N.; Tan, S.-P.; Lee, S.Y.; Cheung, G.C.M.; Tan, G.; Kumar, N.; Cheng, C.-Y.; Wong, T.Y. Prevalence and risk factors for epiretinal membrane: The Singapore Epidemiology of Eye Disease study. Br. J. Ophthalmol. 2017, 101, 371–376. [Google Scholar] [CrossRef] [PubMed]
- Flaxman, S.R.; Bourne, R.R.A.; Resnikoff, S.; Ackland, P.; Braithwaite, T.; Cicinelli, M.V.; Das, A.; Jonas, J.B.; Keeffe, J.; Kempen, J.H.; et al. Global causes of blindness and distance vision impairment 1990–2020: A systematic review and meta-analysis. Lancet Glob. Health 2017, 5, e1221–e1234. [Google Scholar] [CrossRef] [Green Version]
- Do, D.V.; Cho, M.; Nguyen, Q.D.; Shah, S.M.; Handa, J.T.; Campochiaro, P.A.; Zimmer-Galler, I.; Sung, J.U.; Haller, J.A. The impact of optical coherence tomography on surgical decision making in epiretinal membrane and vitreomacular traction. Trans. Am. Ophthalmol. Soc. 2006, 104, 161–166. [Google Scholar] [CrossRef]
- Theodossiadis, G.P.; Grigoropoulos, V.G.; Theodoropoulou, S.; Datseris, I.; Theodossiadis, P.G. Spontaneous Resolution of Vitreomacular Traction Demonstrated by Spectral-Domain Optical Coherence Tomography. Am. J. Ophthalmol. 2014, 157, 842–851.e1. [Google Scholar] [CrossRef]
- Delyfer, M.; Legout, P.; Le Goff, M.; Blaizeau, M.; Rougier, M.; Schweitzer, C.; Korobelnik, J.; Delcourt, C. Prevalence of epiretinal membranes in the ageing population using retinal colour images and SD-OCT: The Alienor Study. Acta Ophthalmol. 2020, 98, e830–e838. [Google Scholar] [CrossRef]
- Konidaris, V.; Androudi, S.; Alexandridis, A.; Dastiridou, A.; Brazitikos, P. Optical coherence tomography-guided classification of epiretinal membranes. Int. Ophthalmol. 2014, 35, 495–501. [Google Scholar] [CrossRef]
- Watanabe, K.; Tsunoda, K.; Mizuno, Y.; Akiyama, K.; Noda, T. Outer Retinal Morphology and Visual Function in Patients with Idiopathic Epiretinal Membrane. JAMA Ophthalmol. 2013, 131, 172–177. [Google Scholar] [CrossRef]
- Zheng, S.; Choo, J.; Chen, J.; Joshi, S.; Sun, Z. The barriers to global eye care equity and the role of digital innovations. Adv. Ophthalmol. Pr. Res. 2021, 1, 100021. [Google Scholar] [CrossRef]
- Kermany, D.S.; Goldbaum, M.; Cai, W.; Valentim, C.C.S.; Liang, H.; Baxter, S.L.; McKeown, A.; Yang, G.; Wu, X.; Yan, F.; et al. Identifying Medical Diagnoses and Treatable Diseases by Image-Based Deep Learning. Cell 2018, 172, 1122–1131.e9. [Google Scholar] [CrossRef] [PubMed]
- Hwang, D.-K.; Hsu, C.-C.; Chang, K.-J.; Chao, D.; Sun, C.-H.; Jheng, Y.-C.; Yarmishyn, A.A.; Wu, J.-C.; Tsai, C.-Y.; Wang, M.-L.; et al. Artificial intelligence-based decision-making for age-related macular degeneration. Theranostics 2019, 9, 232–245. [Google Scholar] [CrossRef] [PubMed]
- Yim, J.; Chopra, R.; Spitz, T.; Winkens, J.; Obika, A.; Kelly, C.; Askham, H.; Lukic, M.; Huemer, J.; Fasler, K.; et al. Predicting conversion to wet age-related macular degeneration using deep learning. Nat. Med. 2020, 26, 892–899. [Google Scholar] [CrossRef] [PubMed]
- Zhang, G.; Fu, D.J.; Liefers, B.; Faes, L.; Glinton, S.; Wagner, S.; Struyven, R.; Pontikos, N.; Keane, P.A.; Balaskas, K. Clinically relevant deep learning for detection and quantification of geographic atrophy from optical coherence tomography: A model development and external validation study. Lancet Digit. Health 2021, 3, e665–e675. [Google Scholar] [CrossRef] [PubMed]
- Lu, W.; Tong, Y.; Yu, Y.; Xing, Y.; Chen, C.; Shen, Y. Deep Learning-Based Automated Classification of Multi-Categorical Abnormalities from Optical Coherence Tomography Images. Transl. Vis. Sci. Technol. 2018, 7, 41. [Google Scholar] [CrossRef] [PubMed] [Green Version]
- Sonobe, T.; Tabuchi, H.; Ohsugi, H.; Masumoto, H.; Ishitobi, N.; Morita, S.; Enno, H.; Nagasato, D. Comparison between support vector machine and deep learning, machine-learning technologies for detecting epiretinal membrane using 3D-OCT. Int. Ophthalmol. 2018, 39, 1871–1877. [Google Scholar] [CrossRef]
- Lo, Y.-C.; Lin, K.-H.; Bair, H.; Sheu, W.H.-H.; Chang, C.-S.; Shen, Y.-C.; Hung, C.-L. Epiretinal Membrane Detection at the Ophthalmologist Level using Deep Learning of Optical Coherence Tomography. Sci. Rep. 2020, 10, 8424. [Google Scholar] [CrossRef]
- Govetto, A.; Lalane, R.A., III; Sarraf, D.; Figueroa, M.S.; Hubschman, J.P. Insights Into Epiretinal Membranes: Presence of Ectopic Inner Foveal Layers and a New Optical Coherence Tomography Staging Scheme. Am. J. Ophthalmol. 2017, 175, 99–113. [Google Scholar] [CrossRef]
- Ronneberger, O.; Fischer, P.; Brox, T. U-Net: Convolutional Networks for Biomedical Image Segmentation. In Proceedings of the Medical Image Computing and Computer-Assisted Intervention, PT III, Nagoya, Japan, 22–26 September 2013; pp. 234–241. [Google Scholar]
- He, K.M.; Zhang, X.Y.; Ren, S.Q.; Sun, J. Deep Residual Learning for Image Recognition. In Proceedings of the 2016 IEEE Conference on Computer Vision and Pattern Recognition (CVPR), Las Vegas, NV, USA, 27–30 June 2016; pp. 770–778. [Google Scholar]
- Szegedy, C.; Vanhoucke, V.; Ioffe, S.; Shlens, J.; Wojna, Z. Rethinking the Inception Architecture for Computer Vision. In Proceedings of the 2016 IEEE Conference on Computer Vision and Pattern Recognition (CVPR), Las Vegas, NV, USA, 27–30 June 2016; pp. 2818–2826. [Google Scholar]
- Tan, M.X.; Le, Q.V. EfficientNet: Rethinking Model Scaling for Convolutional Neural Networks. In Proceedings of the 36th International Conference on Machine Learning, Long Beach, CA, USA, 9–15 June 2019; pp. 6105–6114. [Google Scholar]
- Selvaraju, R.R.; Cogswell, M.; Das, A.; Vedantam, R.; Parikh, D.; Batra, D. Grad-CAM: Visual Explanations from Deep Networks via Gradient-based Localization. In Proceedings of the 2017 IEEE International Conference on Computer Vision (ICCV), Venice, Italy, 22–29 October 2017; pp. 618–626. [Google Scholar]
- Wei, X.-S.; Song, Y.-Z.; Mac Aodha, O.; Wu, J.; Peng, Y.; Tang, J.; Yang, J.; Belongie, S. Fine-Grained Image Analysis With Deep Learning: A Survey. IEEE Trans. Pattern Anal. Mach. Intell. 2021, 44, 8927–8948. [Google Scholar] [CrossRef]
- De Fauw, J.; Ledsam, J.R.; Romera-Paredes, B.; Nikolov, S.; Tomasev, N.; Blackwell, S.; Askham, H.; Glorot, X.; O’Donoghue, B.; Visentin, D.; et al. Clinically applicable deep learning for diagnosis and referral in retinal disease. Nat. Med. 2018, 24, 1342–1350. [Google Scholar] [CrossRef] [PubMed]
- Xu, Y.; Hu, M.; Liu, H.; Yang, H.; Wang, H.; Lu, S.; Liang, T.; Li, X.; Xu, M.; Li, L.; et al. A hierarchical deep learning approach with transparency and interpretability based on small samples for glaucoma diagnosis. Npj Digit. Med. 2021, 4, 48. [Google Scholar] [CrossRef] [PubMed]
- Zhou, Y.; Wang, B.; Huang, L.; Cui, S.; Shao, L. A Benchmark for Studying Diabetic Retinopathy: Segmentation, Grading, and Transferability. IEEE Trans. Med. Imaging 2021, 40, 818–828. [Google Scholar] [CrossRef] [PubMed]
- Sussillo, D.; Barak, O. Opening the Black Box: Low-Dimensional Dynamics in High-Dimensional Recurrent Neural Networks. Neural Comput. 2013, 25, 626–649. [Google Scholar] [CrossRef] [PubMed]
- He, J.; Baxter, S.L.; Xu, J.; Xu, J.; Zhou, X.; Zhang, K. The practical implementation of artificial intelligence technologies in medicine. Nat. Med. 2019, 25, 30–36. [Google Scholar] [CrossRef]


| Age (Year) | Male Sex (%) | OD/OS | OCT Images | |
|---|---|---|---|---|
| Normal | 61.52 ± 7.90 | 44.6 | 0.96 | 1674 |
| Stage 1 | 63.12 ± 9.13 | 49.4 | 0.98 | 288 |
| Stage 2 | 64.35 ± 7.98 | 44.1 | 1.02 | 440 |
| Stage 3 | 65.52 ± 8.71 | 47.6 | 0.96 | 741 |
| Stage 4 | 65.14 ± 6.34 | 45.9 | 1.03 | 185 |
| Stage 5 | 65.47 ± 7.83 | 52.0 | 1.03 | 229 |
| Total | 63.29 ± 8.29 | 46.0 | 0.98 | 3557 |
| Dataset | OCT Device | Image Number | Normal | Stage 1 | Stage 2 | Stage 3 | Stage 4 | Stage 5 |
|---|---|---|---|---|---|---|---|---|
| ZJU | Heidelberg | 3557 | 1674 | 288 | 440 | 741 | 185 | 229 |
| Xian 1 | Heidelberg | 270 | 168 | 9 | 15 | 62 | 9 | 7 |
| Ningbo | Heidelberg | 84 | 17 | 10 | 16 | 35 | 3 | 3 |
| Jinhua | Heidelberg | 126 | 40 | 12 | 11 | 42 | 11 | 10 |
| Dali | Heidelberg | 121 | 0 | 2 | 6 | 69 | 38 | 6 |
| Anhui | Heidelberg | 19 | 0 | 1 | 0 | 13 | 3 | 2 |
| Japan | Heidelberg | 117 | 61 | 5 | 3 | 37 | 4 | 7 |
| Singapore 1 | Heidelberg | 71 | 8 | 5 | 17 | 19 | 5 | 17 |
| Taizhou | Nidek | 22 | 0 | 5 | 4 | 12 | 1 | 0 |
| Xian 2 | Zeiss | 109 | 0 | 16 | 10 | 49 | 26 | 8 |
| Singapore 2 | Cirrus | 78 | 0 | 21 | 12 | 23 | 8 | 14 |
| Xian 1 | Normal | Stage 1 | Stage 2 | Stage 3 | Stage 4 | Stage 5 |
|---|---|---|---|---|---|---|
| without segmentation | ||||||
| Precision (%) | 98.1 | 36.4 | 33.3 | 80.3 | 50.0 | 83.3 |
| Recall (%) | 93.5 | 88.9 | 33.3 | 79.0 | 33.3 | 71.4 |
| F1-score (%) | 95.7 | 51.6 | 33.3 | 79.7 | 40.0 | 76.9 |
| AUC (%) | 99.4 | 86.3 | 81.7 | 97.1 | 89.7 | 97.1 |
| Accuracy (%) | 84.0 | |||||
| with segmentation | ||||||
| Precision (%) | 100.0 | 30.4 | 64.3 | 84.4 | 60.0 | 66.7 |
| Recall (%) | 94.0 | 77.8 | 60.0 | 87.1 | 33.3 | 57.1 |
| F1-score (%) | 96.9 | 43.7 | 62.1 | 85.7 | 42.9 | 61.5 |
| AUC (%) | 99.8 | 82.6 | 90.6 | 95.8 | 94.3 | 98.5 |
| Accuracy (%) | 87.0 | |||||
| Japan | Normal | Stage 1 | Stage 2 | Stage 3 | Stage 4 | Stage 5 |
|---|---|---|---|---|---|---|
| without segmentation | ||||||
| Precision (%) | 98.3 | 33.3 | 5.9 | 71.4 | 0.0 | 80.0 |
| Recall (%) | 96.7 | 40.0 | 33.3 | 54.1 | 0.0 | 57.1 |
| F1-score (%) | 97.5 | 36.4 | 10.0 | 61.5 | 0.0 | 66.7 |
| AUC (%) | 96.5 | 72.3 | 83.3 | 90.9 | 84.5 | 96.0 |
| Accuracy (%) | 73.5 | |||||
| with segmentation | ||||||
| Precision (%) | 89.6 | 33.3 | 25.0 | 82.1 | 100.0 | 100.0 |
| Recall (%) | 98.4 | 60.0 | 66.7 | 62.2 | 25.0 | 57.1 |
| F1-score (%) | 93.7 | 42.9 | 36.6 | 70.8 | 40.0 | 72.7 |
| AUC (%) | 99.9 | 78.7 | 95.9 | 90.2 | 88.5 | 98.1 |
| Accuracy (%) | 79.4 | |||||
Disclaimer/Publisher’s Note: The statements, opinions and data contained in all publications are solely those of the individual author(s) and contributor(s) and not of MDPI and/or the editor(s). MDPI and/or the editor(s) disclaim responsibility for any injury to people or property resulting from any ideas, methods, instructions or products referred to in the content. |
© 2023 by the authors. Licensee MDPI, Basel, Switzerland. This article is an open access article distributed under the terms and conditions of the Creative Commons Attribution (CC BY) license (https://creativecommons.org/licenses/by/4.0/).
Share and Cite
Jin, K.; Yan, Y.; Wang, S.; Yang, C.; Chen, M.; Liu, X.; Terasaki, H.; Yeo, T.-H.; Singh, N.G.; Wang, Y.; et al. iERM: An Interpretable Deep Learning System to Classify Epiretinal Membrane for Different Optical Coherence Tomography Devices: A Multi-Center Analysis. J. Clin. Med. 2023, 12, 400. https://doi.org/10.3390/jcm12020400
Jin K, Yan Y, Wang S, Yang C, Chen M, Liu X, Terasaki H, Yeo T-H, Singh NG, Wang Y, et al. iERM: An Interpretable Deep Learning System to Classify Epiretinal Membrane for Different Optical Coherence Tomography Devices: A Multi-Center Analysis. Journal of Clinical Medicine. 2023; 12(2):400. https://doi.org/10.3390/jcm12020400
Chicago/Turabian StyleJin, Kai, Yan Yan, Shuai Wang, Ce Yang, Menglu Chen, Xindi Liu, Hiroto Terasaki, Tun-Hang Yeo, Neha Gulab Singh, Yao Wang, and et al. 2023. "iERM: An Interpretable Deep Learning System to Classify Epiretinal Membrane for Different Optical Coherence Tomography Devices: A Multi-Center Analysis" Journal of Clinical Medicine 12, no. 2: 400. https://doi.org/10.3390/jcm12020400