
High-Intensity Interval Training (HIIT) on Biological and Body Composition Variables in Patients with Musculoskeletal Disorders: A Systematic Review and Meta-Analysis

 , ,
, ,  , ,
, ,  ,
,  , and
, and
Abstract
:1. Introduction
2. Methods
2.1. Inclusion Criteria
2.1.1. Population
2.1.2. Intervention and Control
2.1.3. Outcomes
2.1.4. Study Design
2.2. Search Strategy
2.3. Selection Criteria and Data Extraction
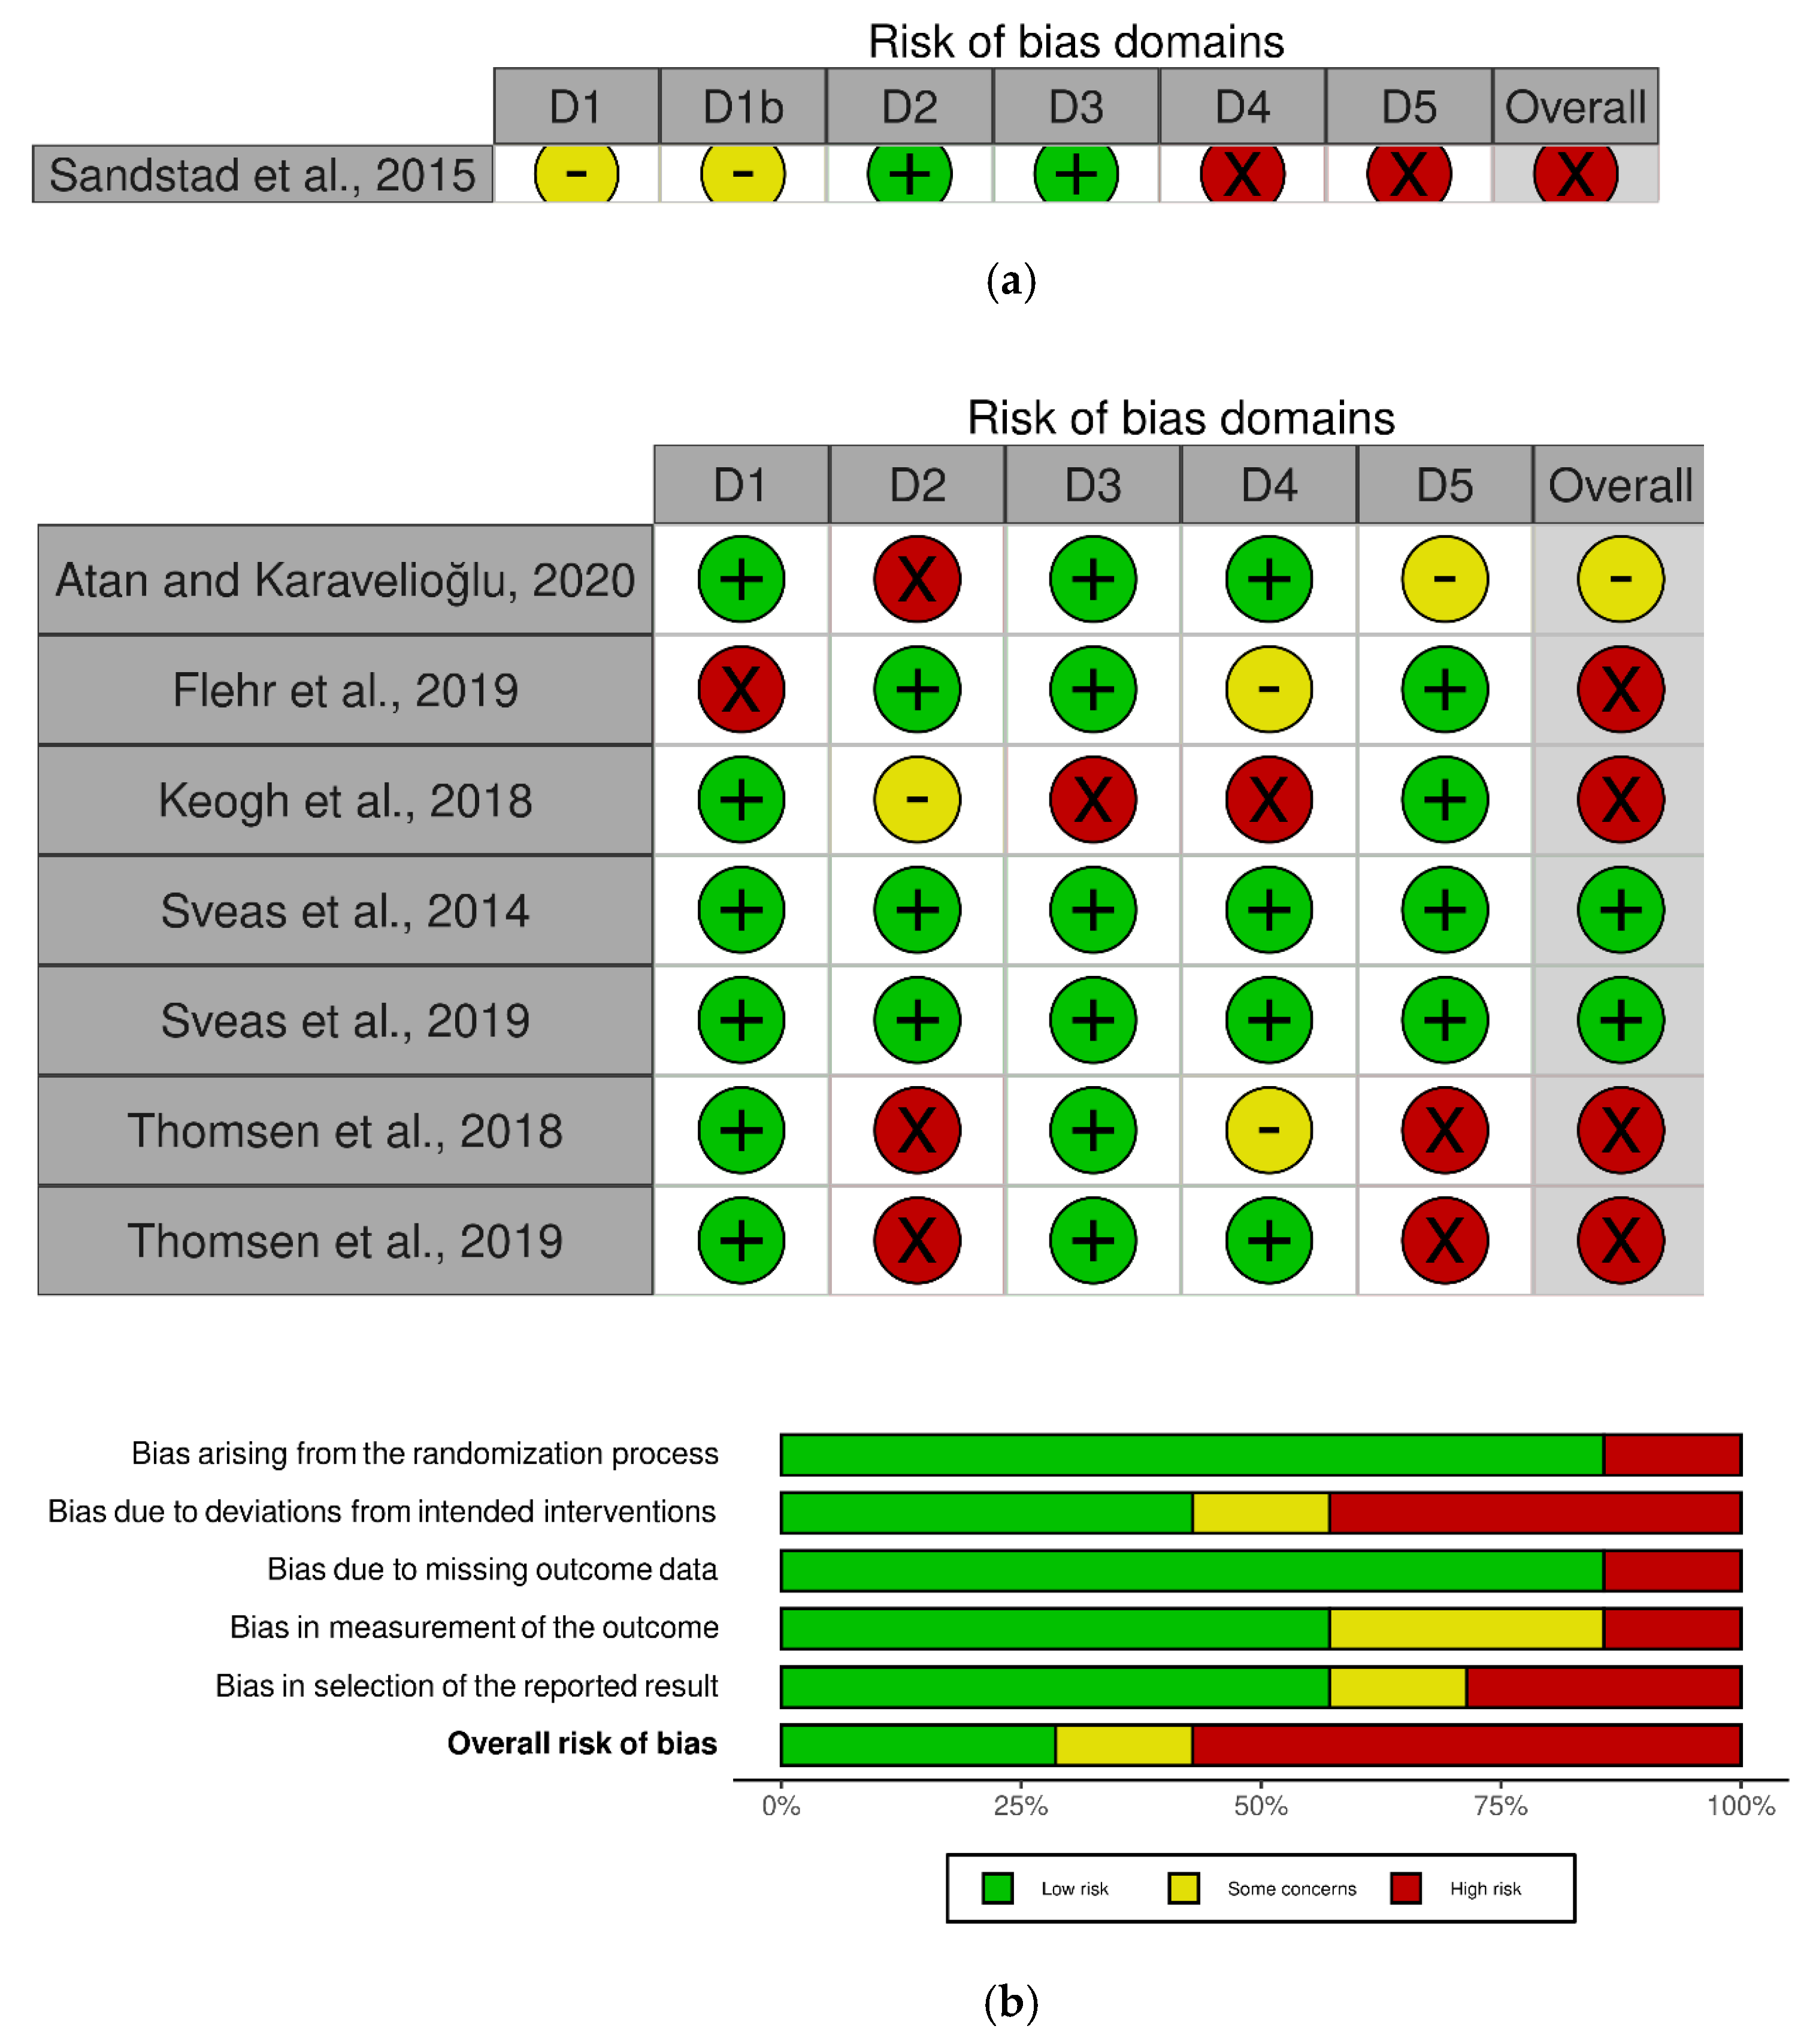
2.4. Risk of Bias Assessment
2.5. Methodological Quality Assessment
2.6. Certainty of Evidence
2.7. Data Synthesis and Analysis
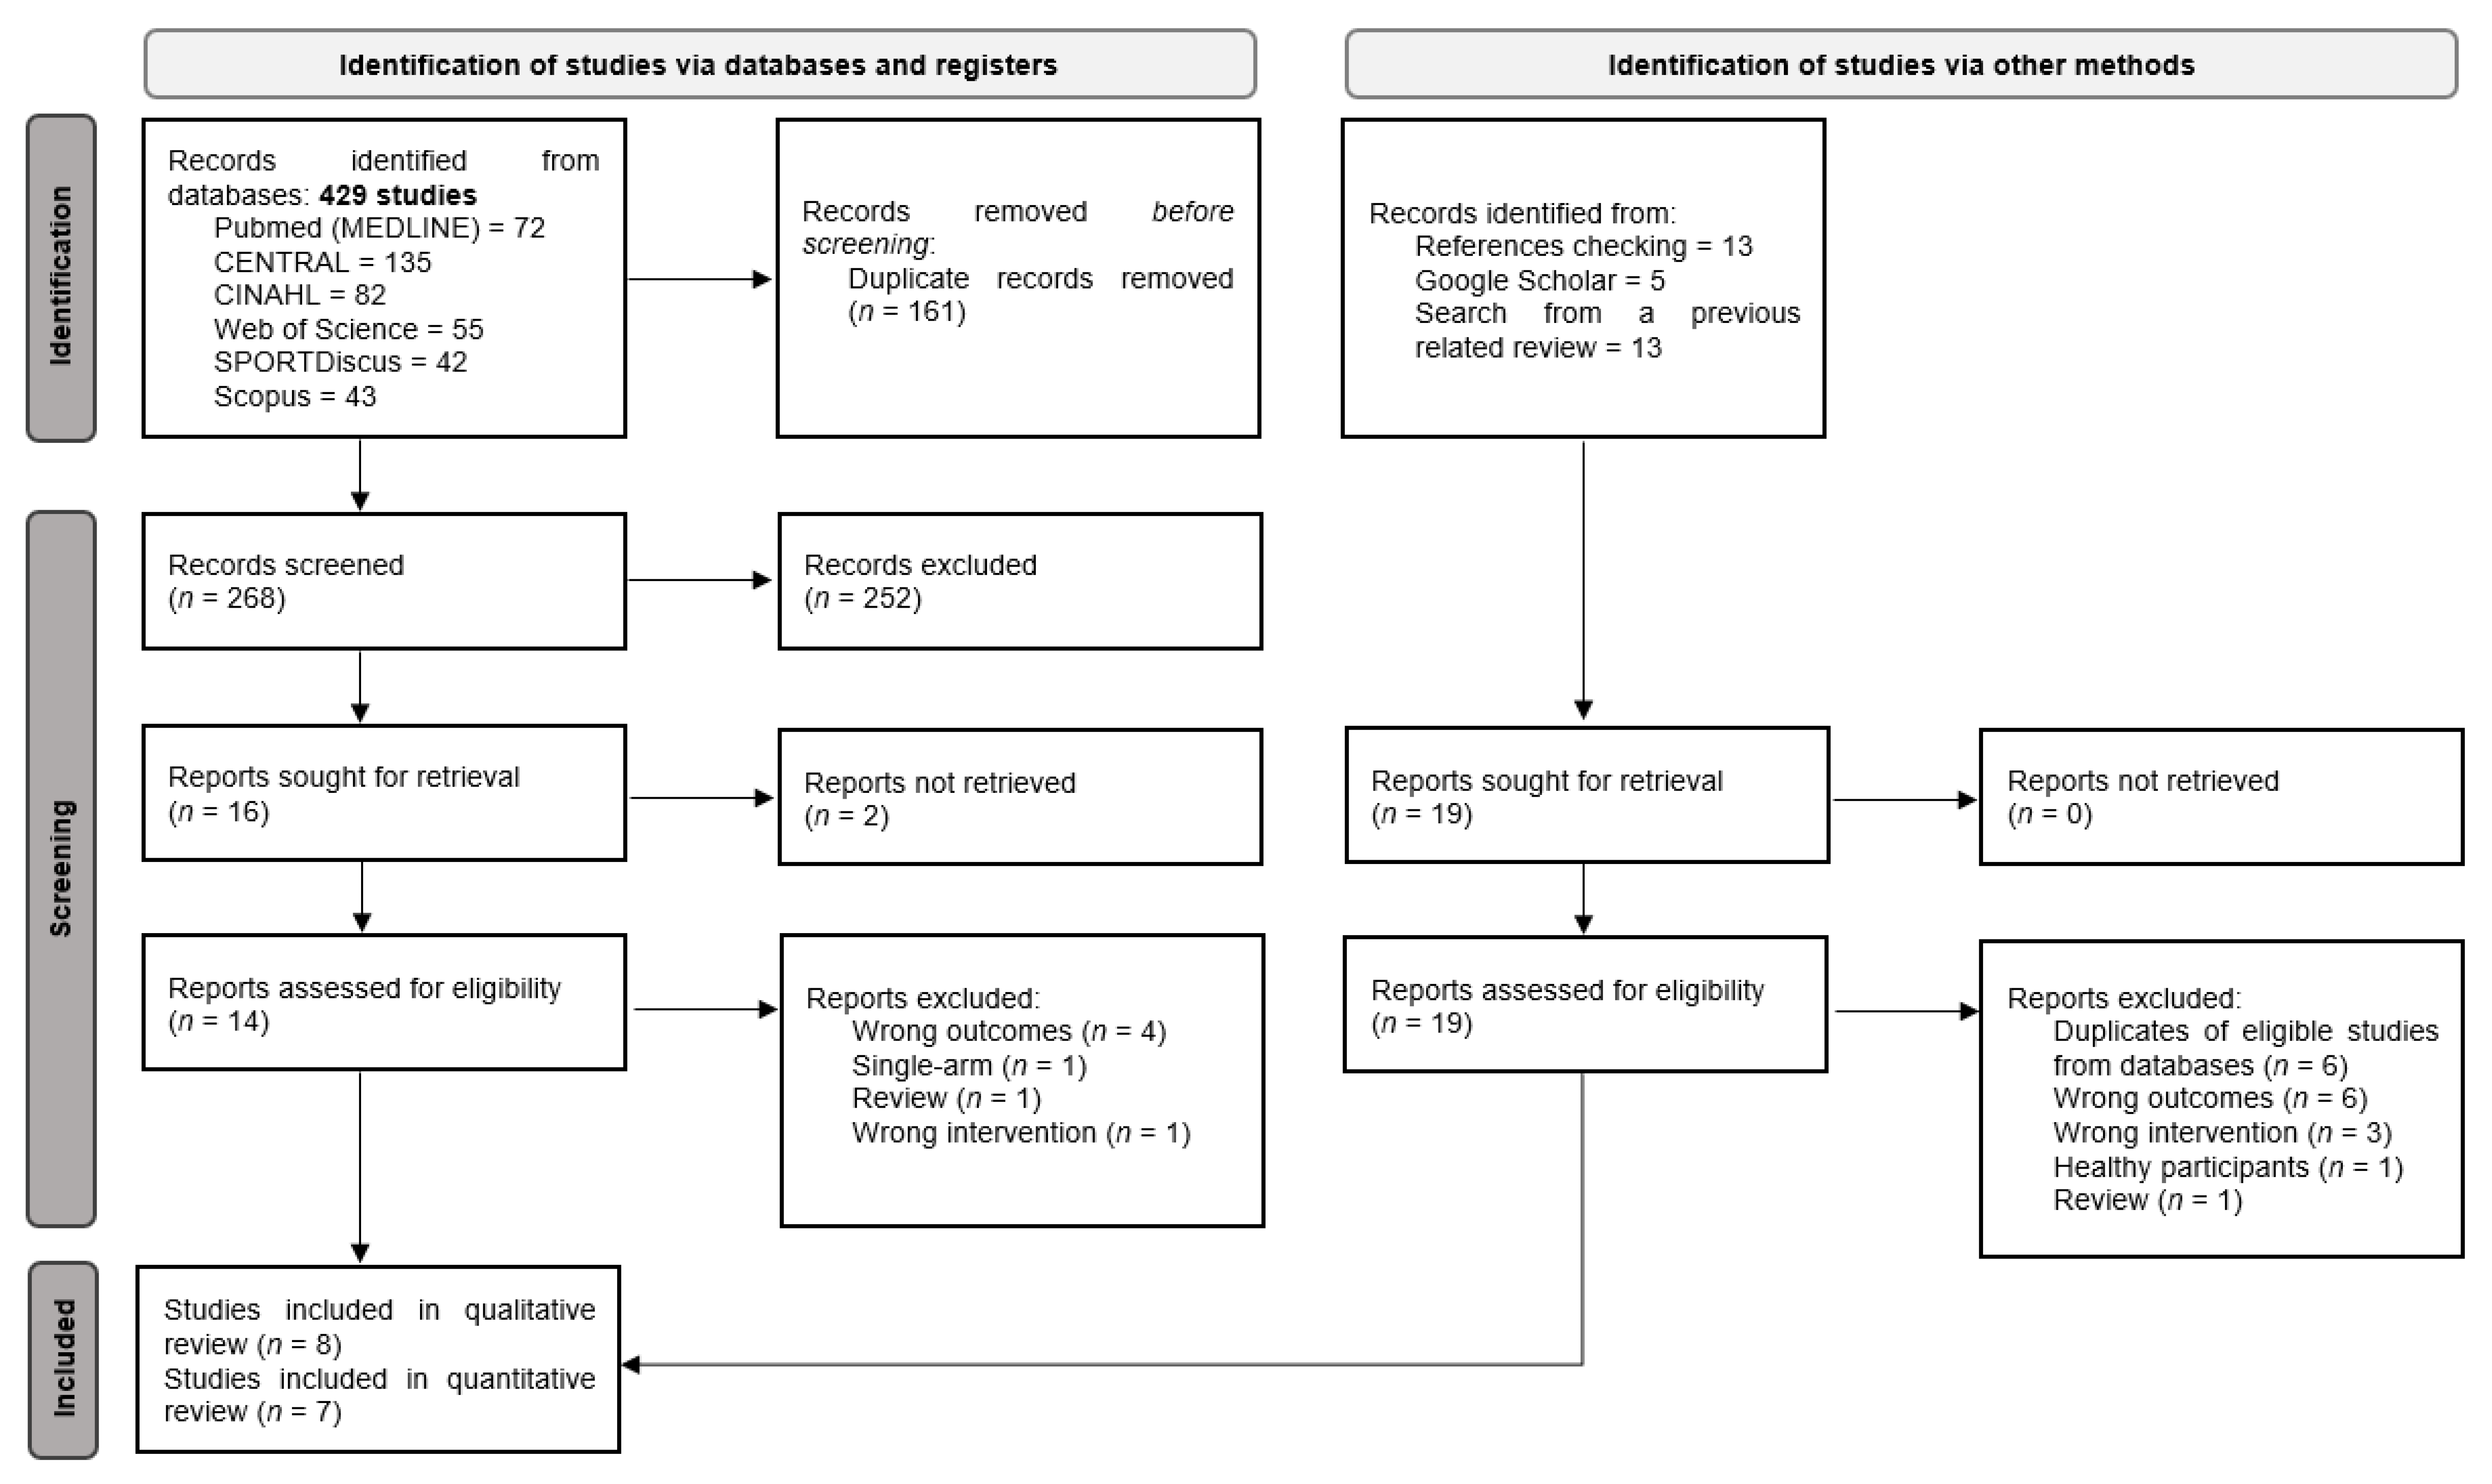
3. Results
3.1. Characteristics of the Included Studies
3.2. Methodological Quality and Risk of Bias Results
3.3. Qualitative Analysis
3.3.1. HIIT Training against No Intervention, Minimal Intervention, or Usual Care
3.3.2. HIIT Training against Moderate-Intensity Continuous Training
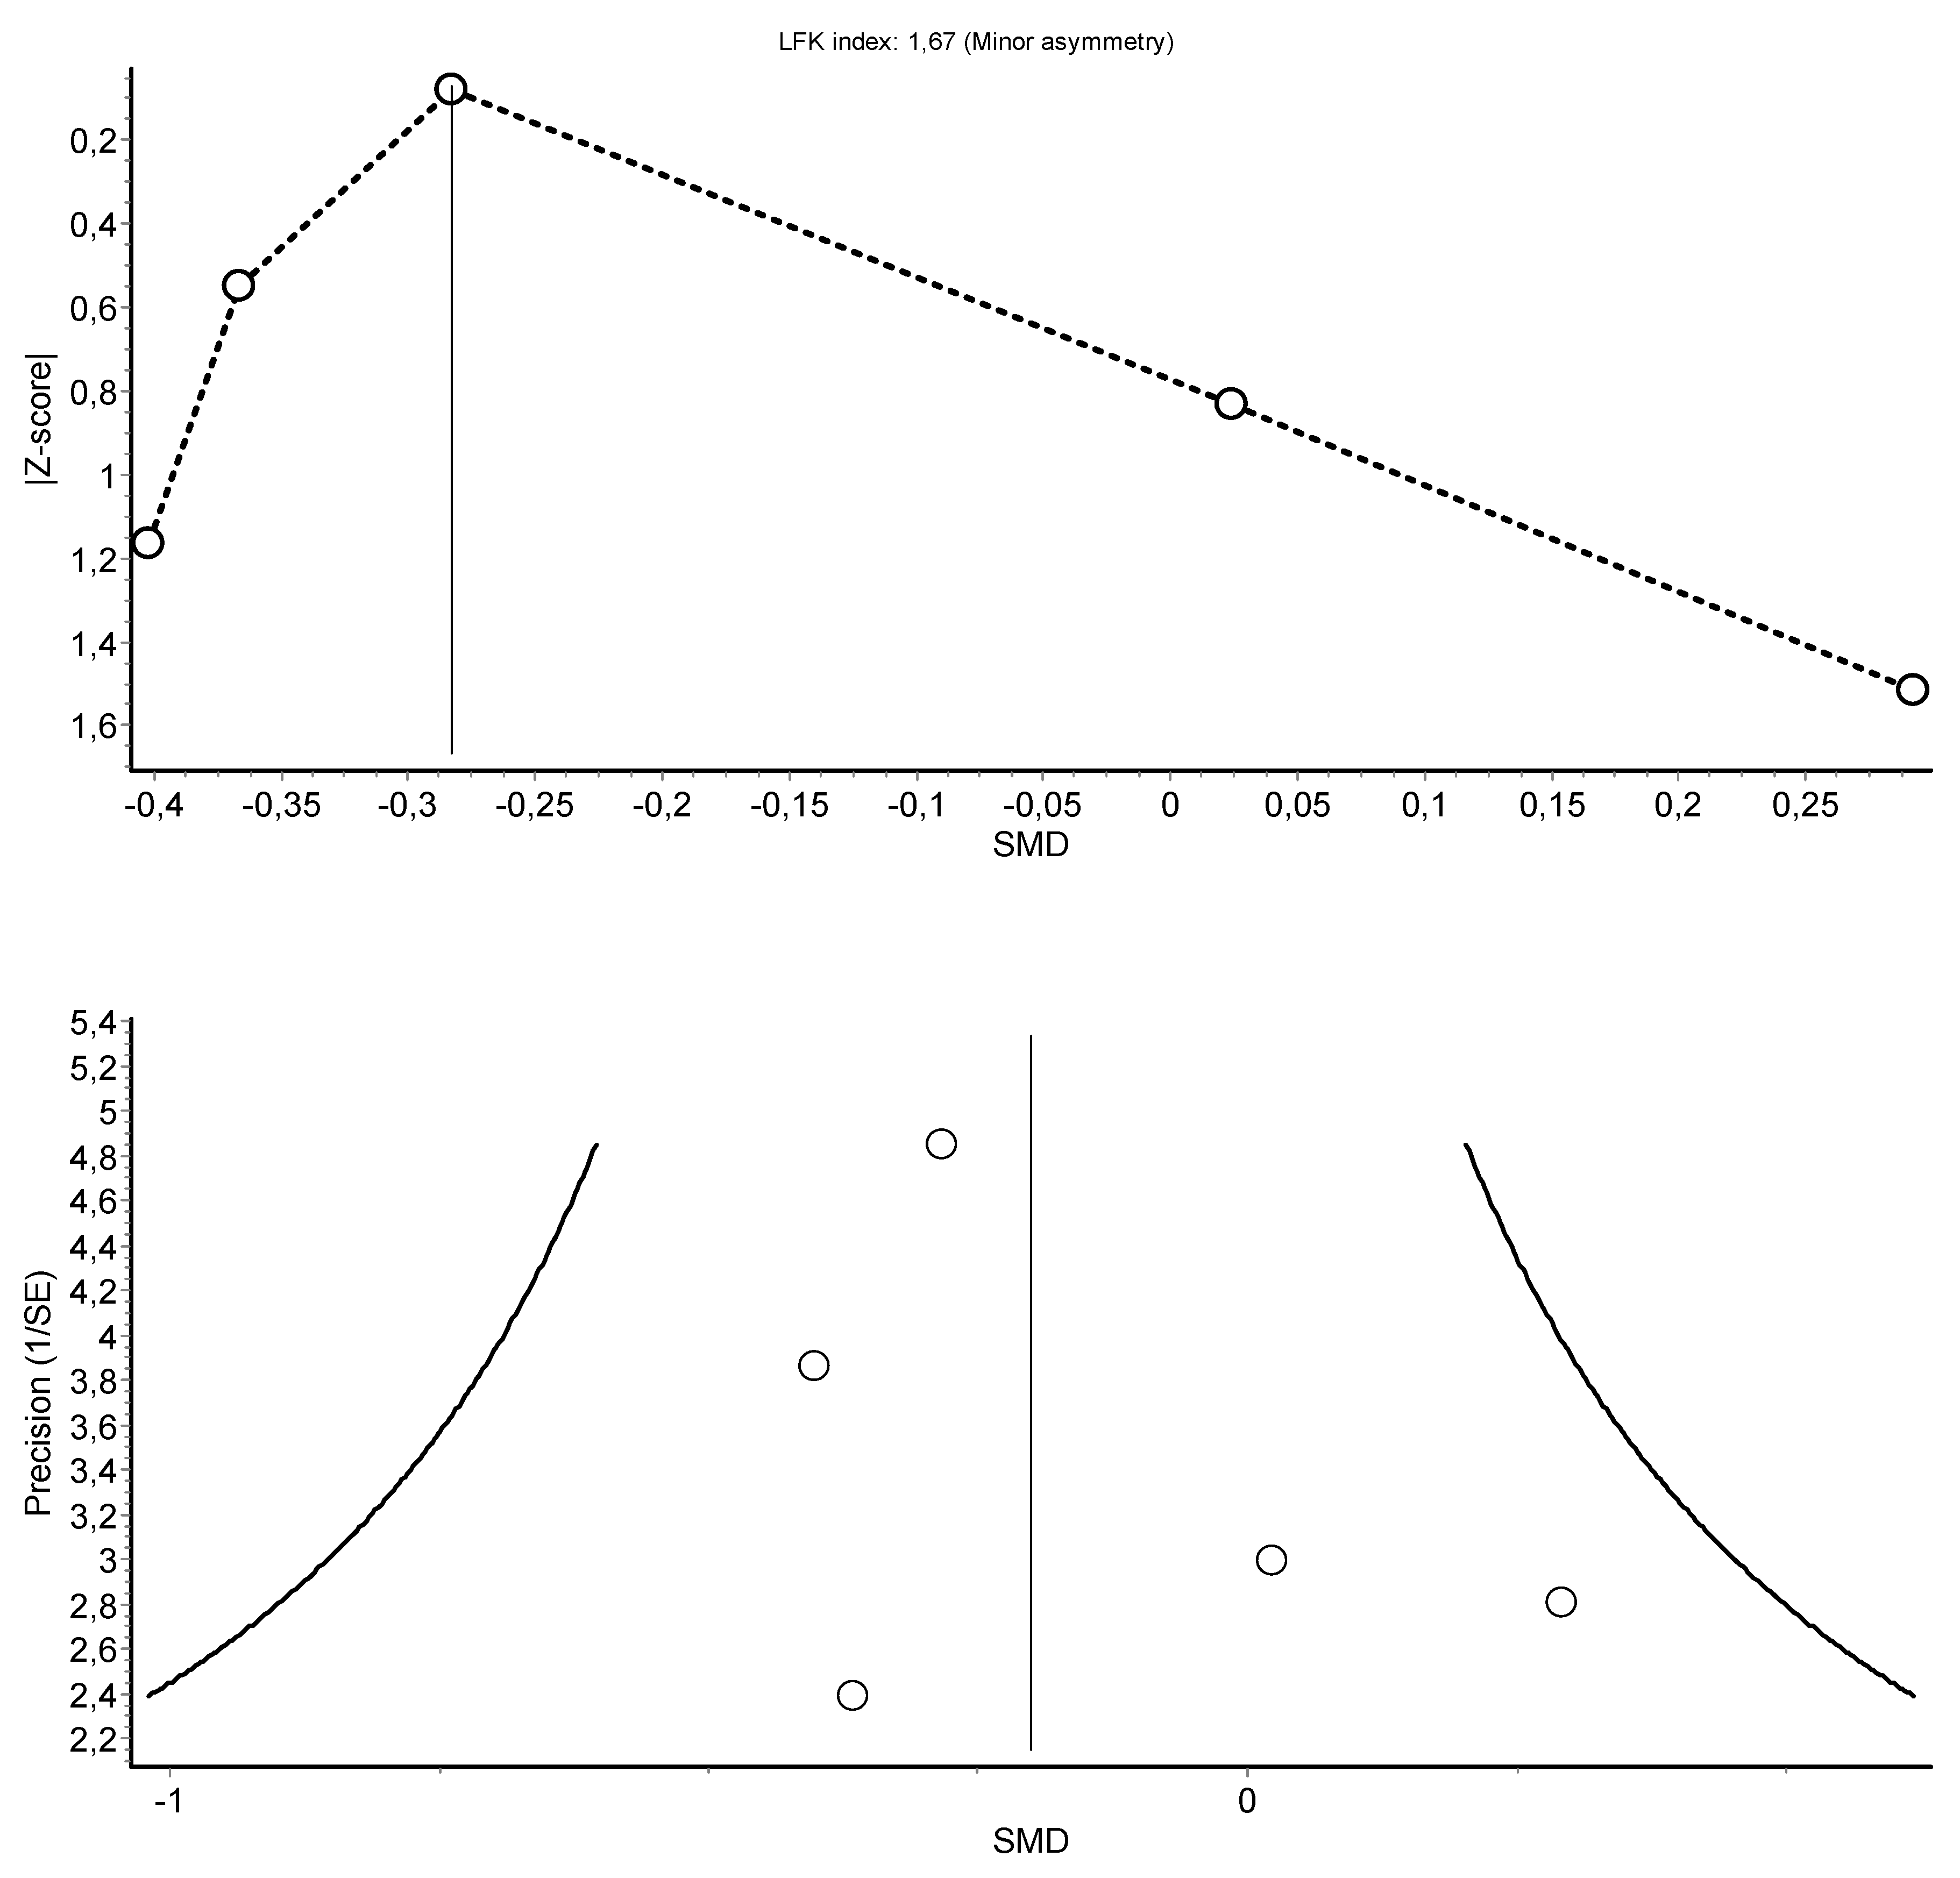
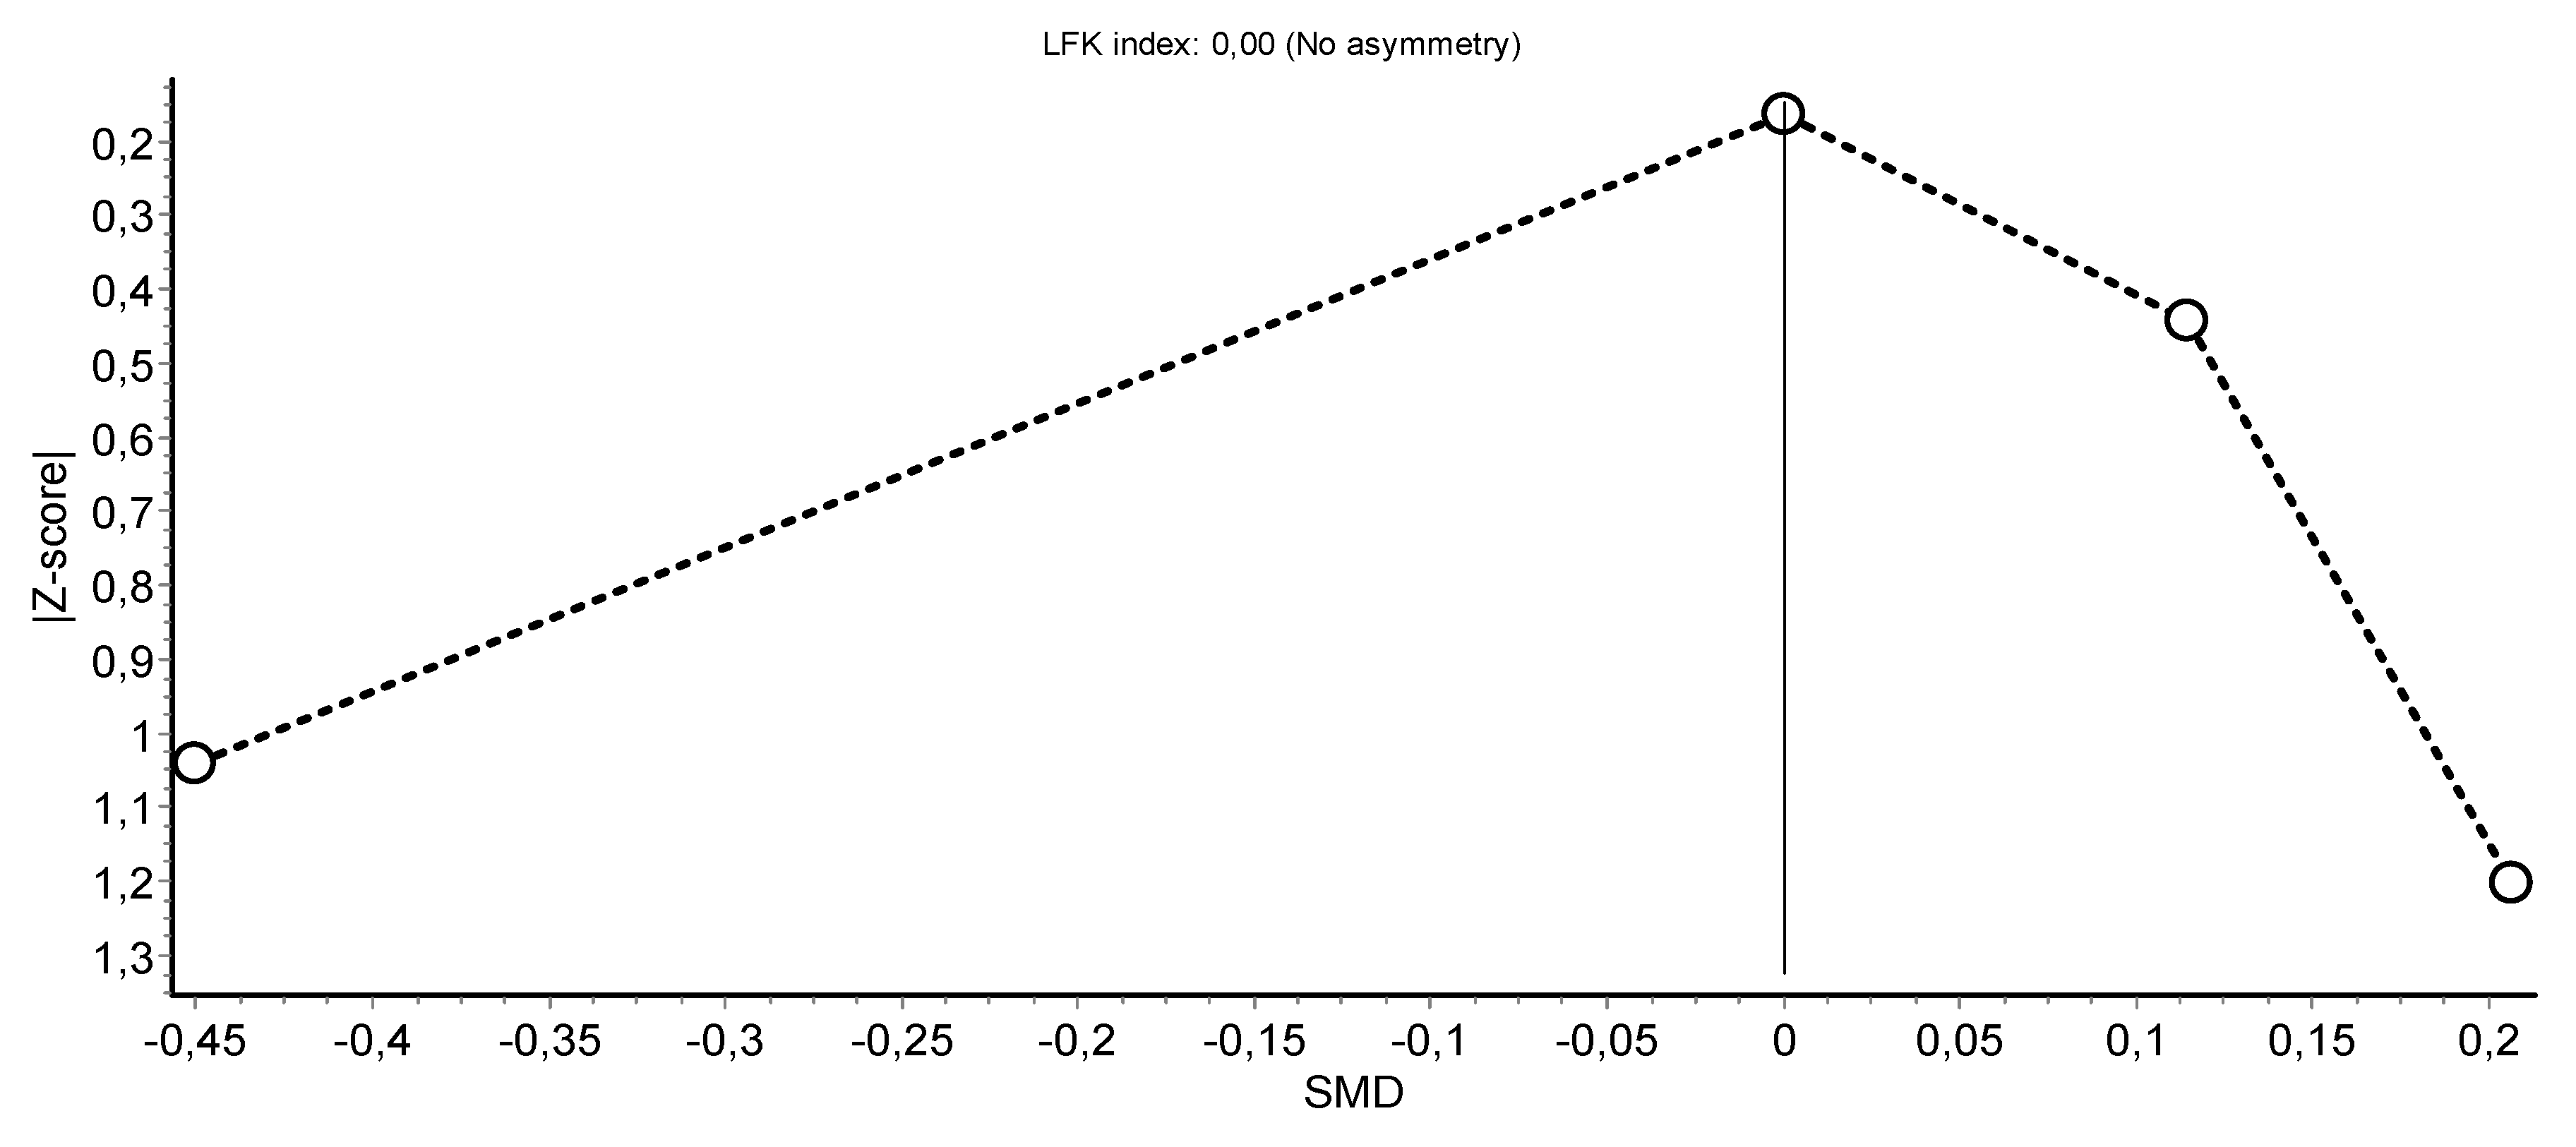
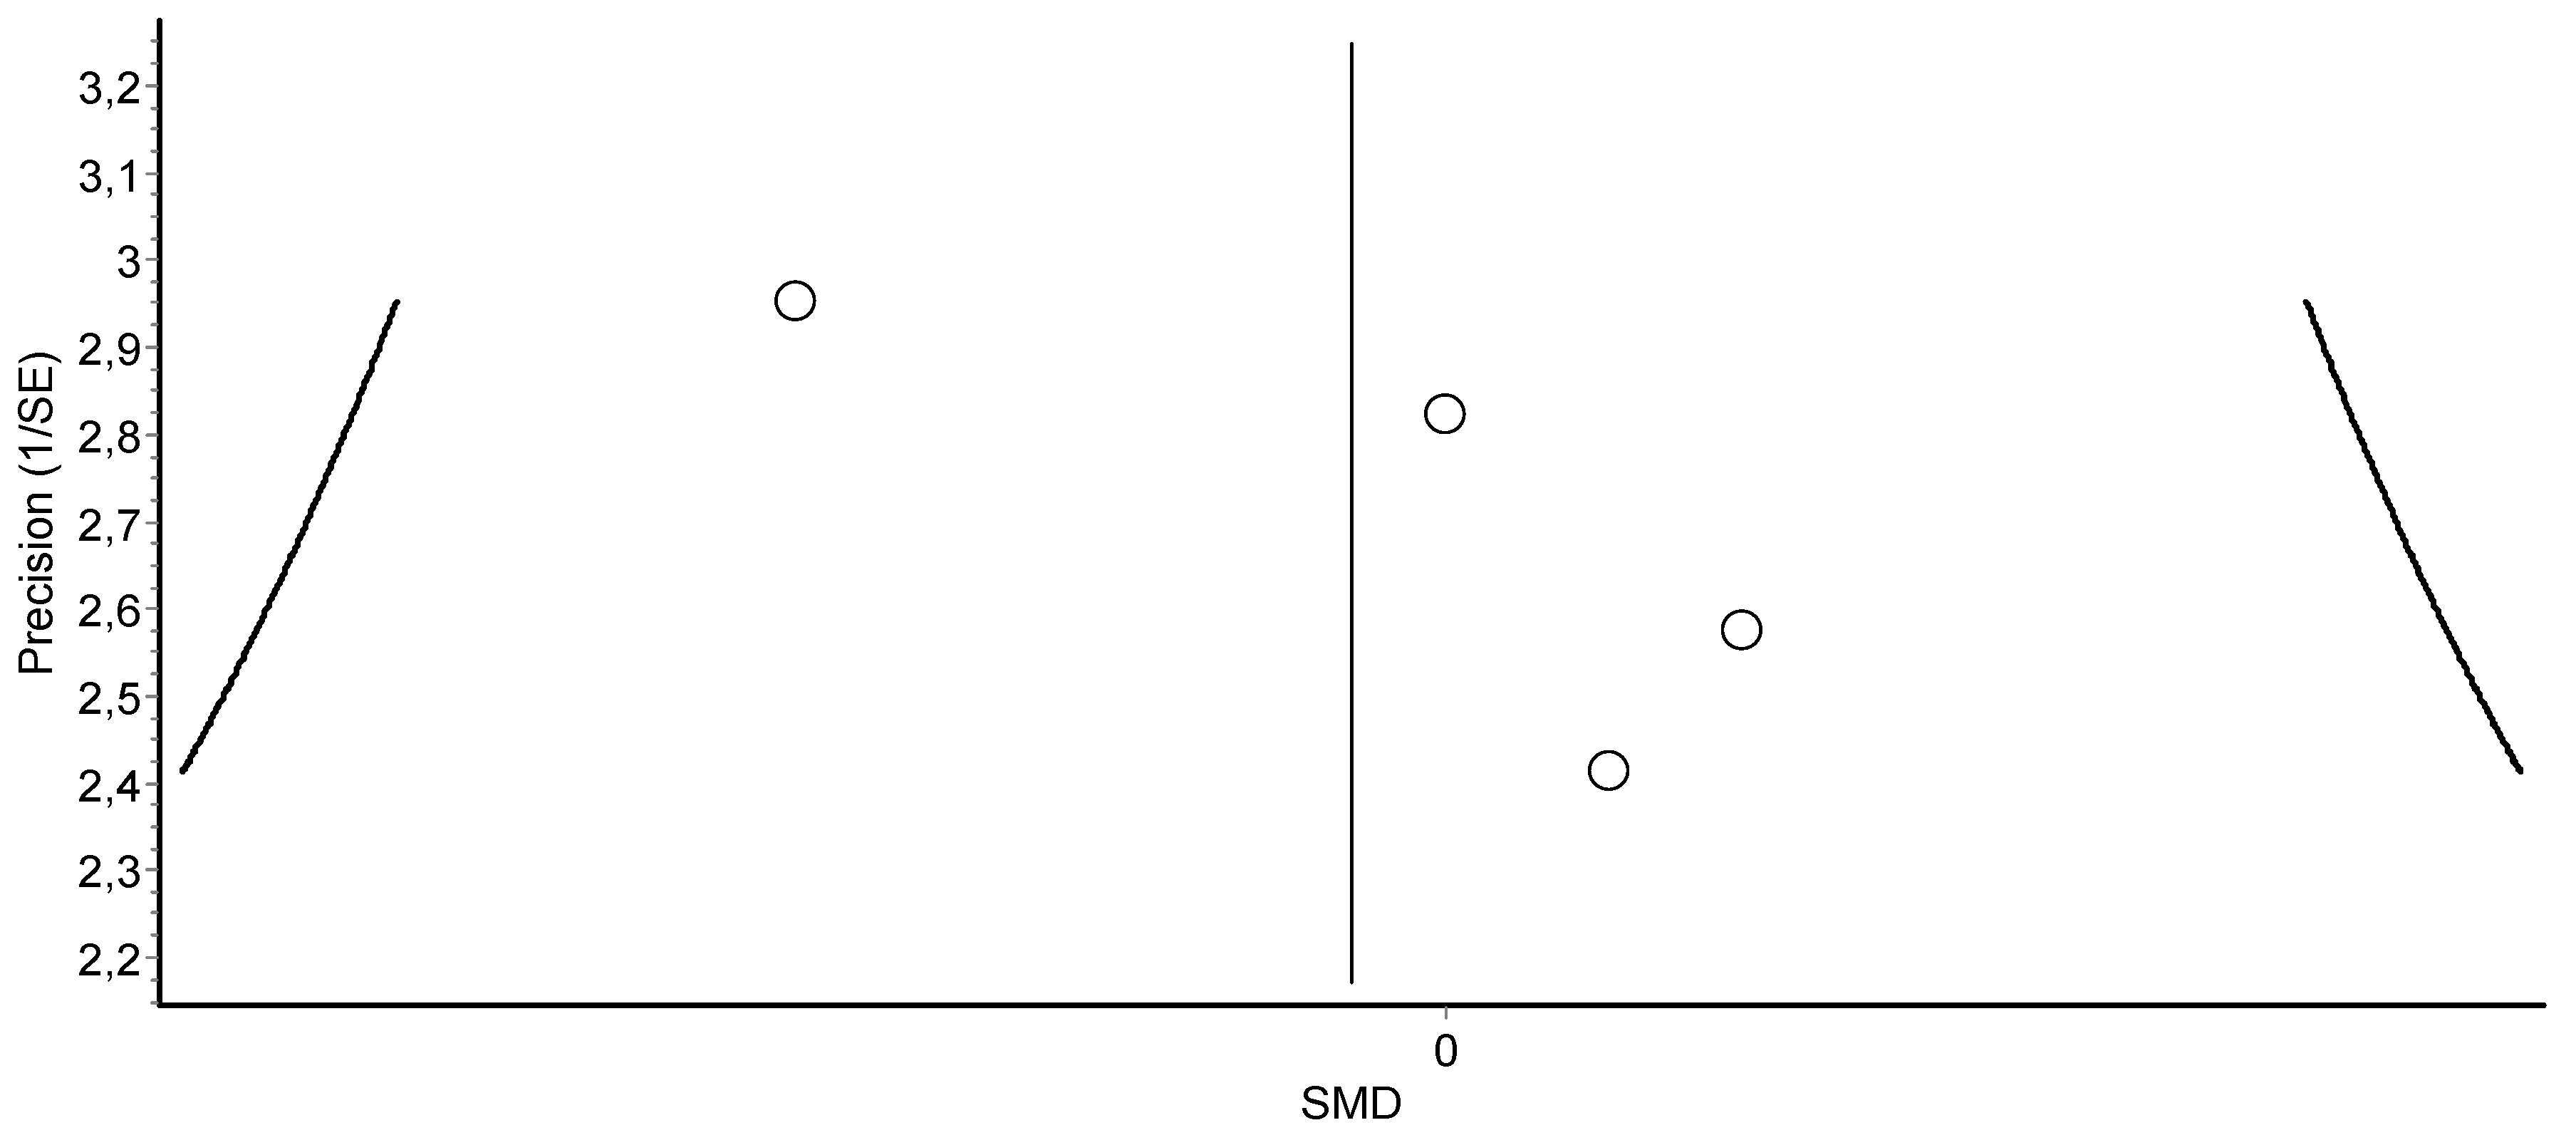
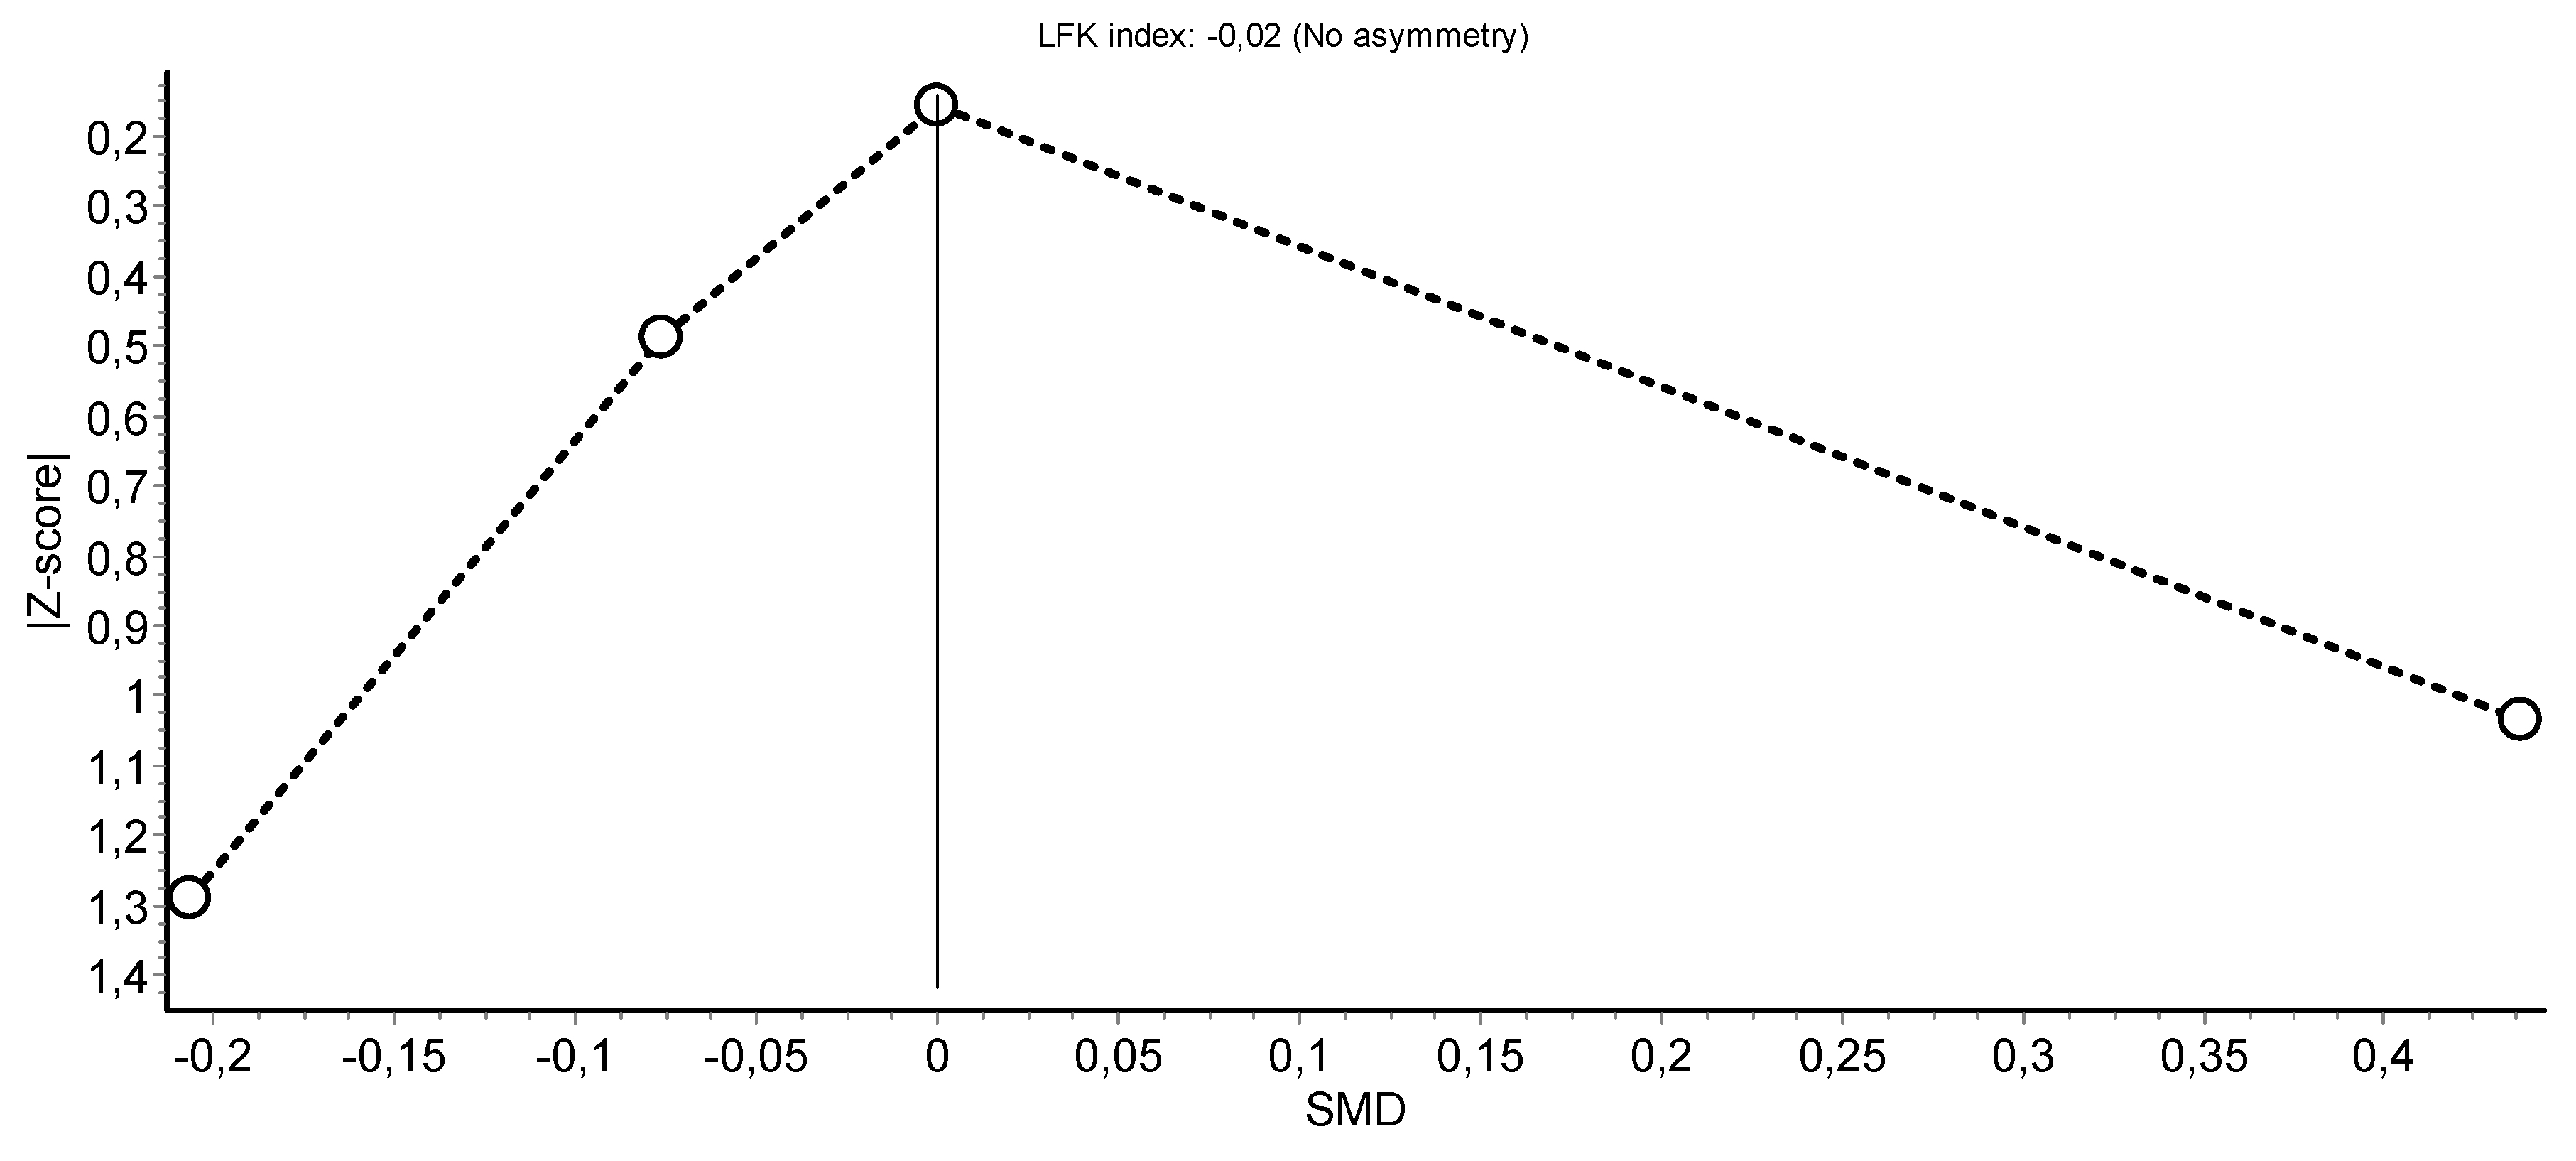
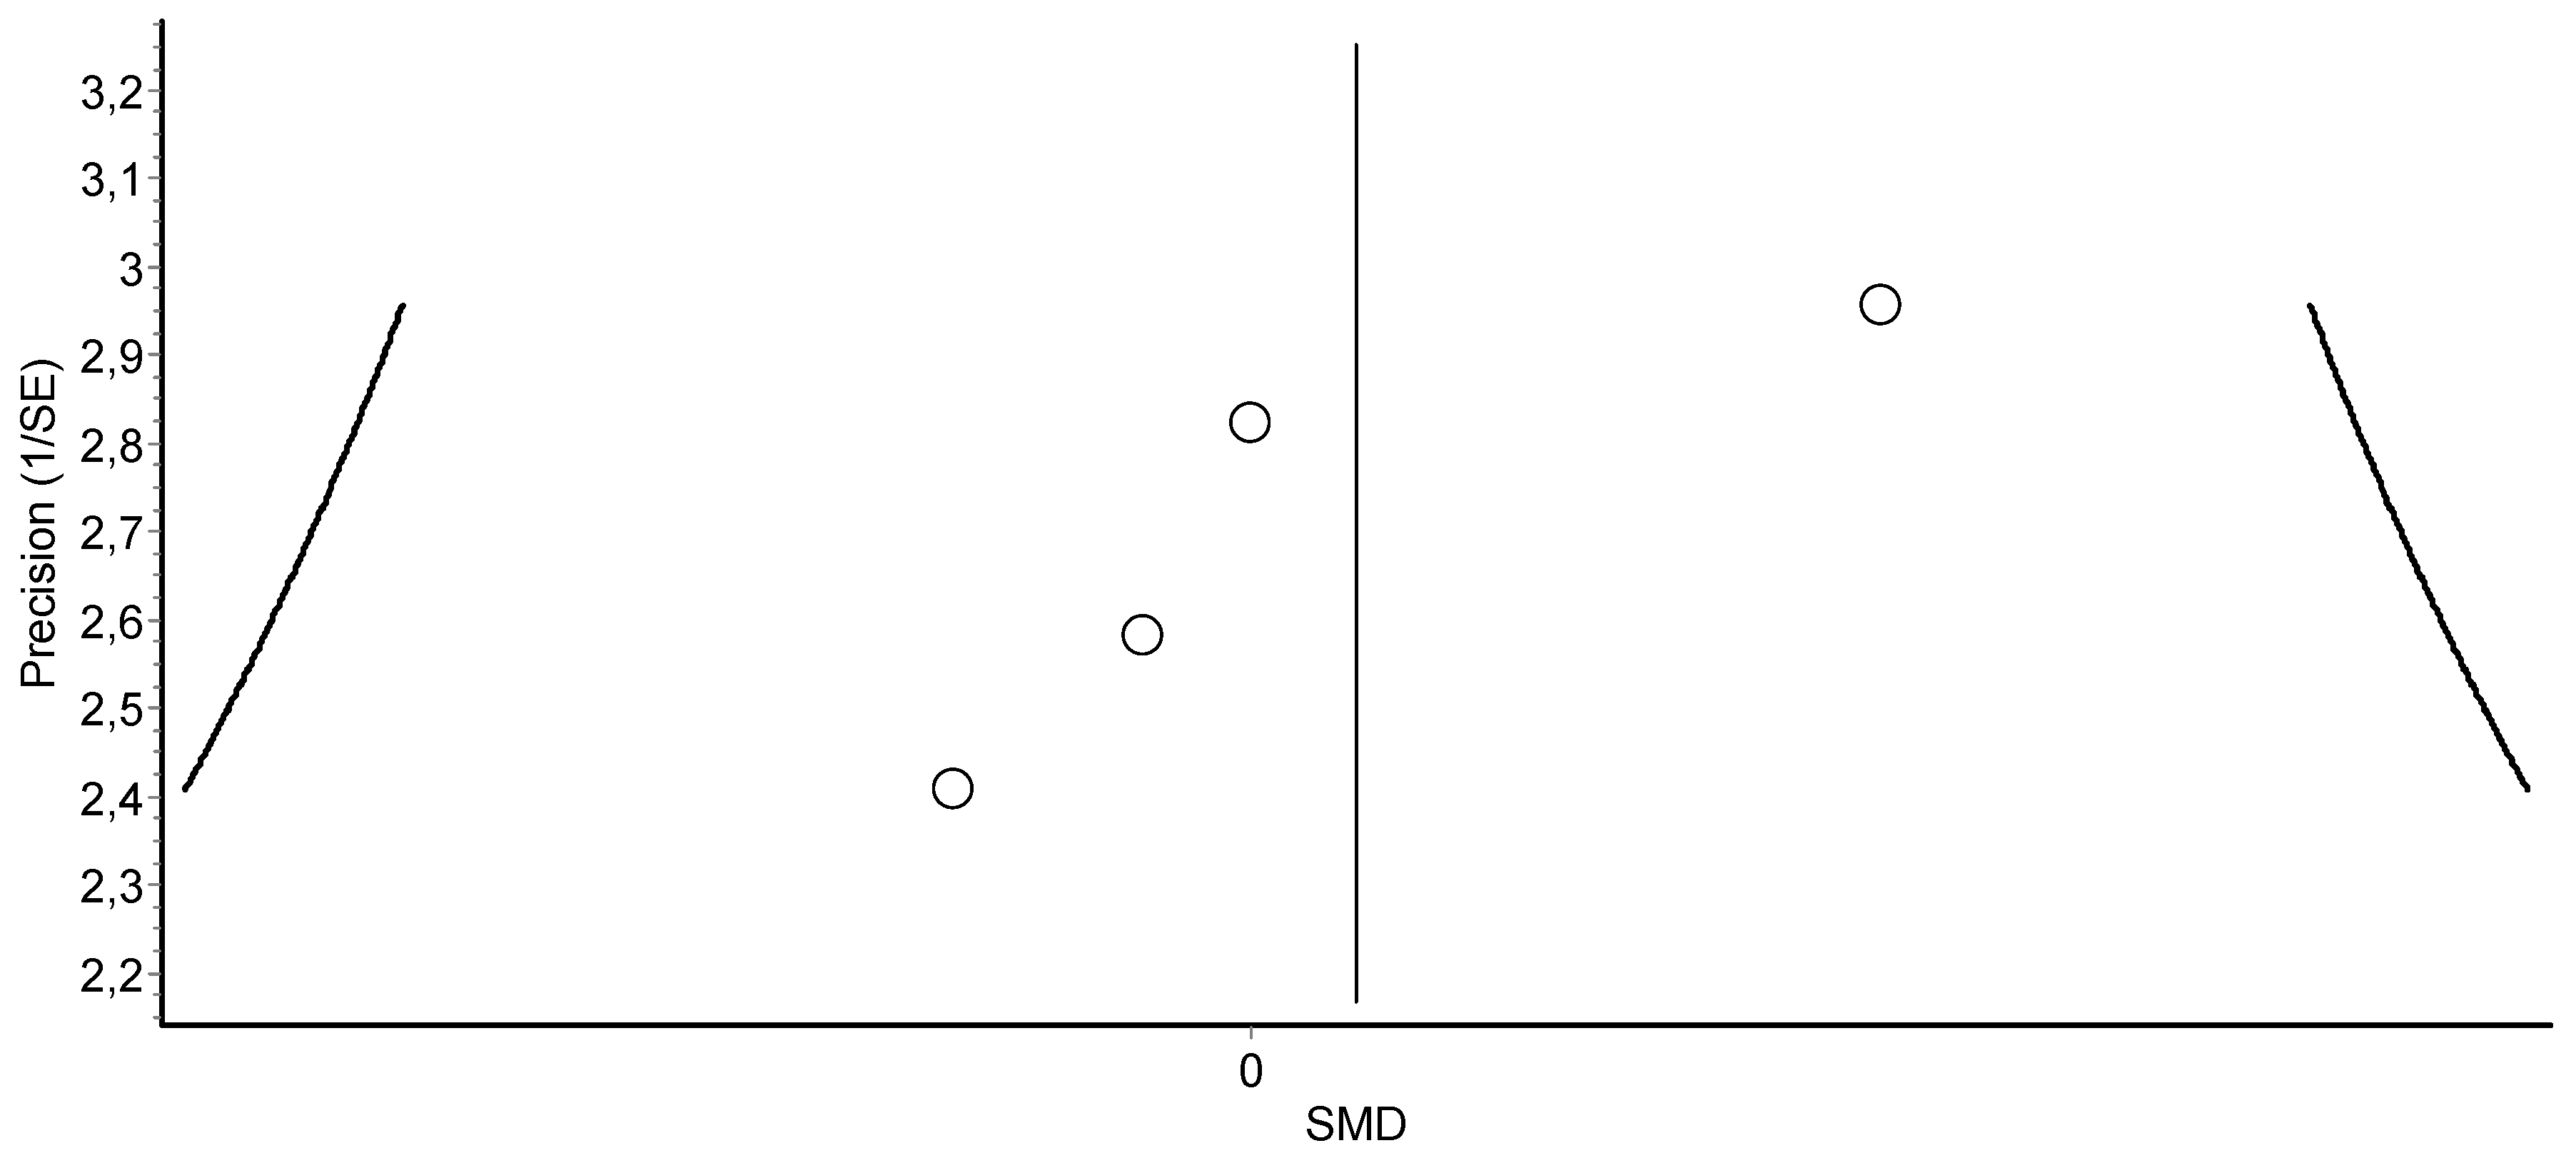
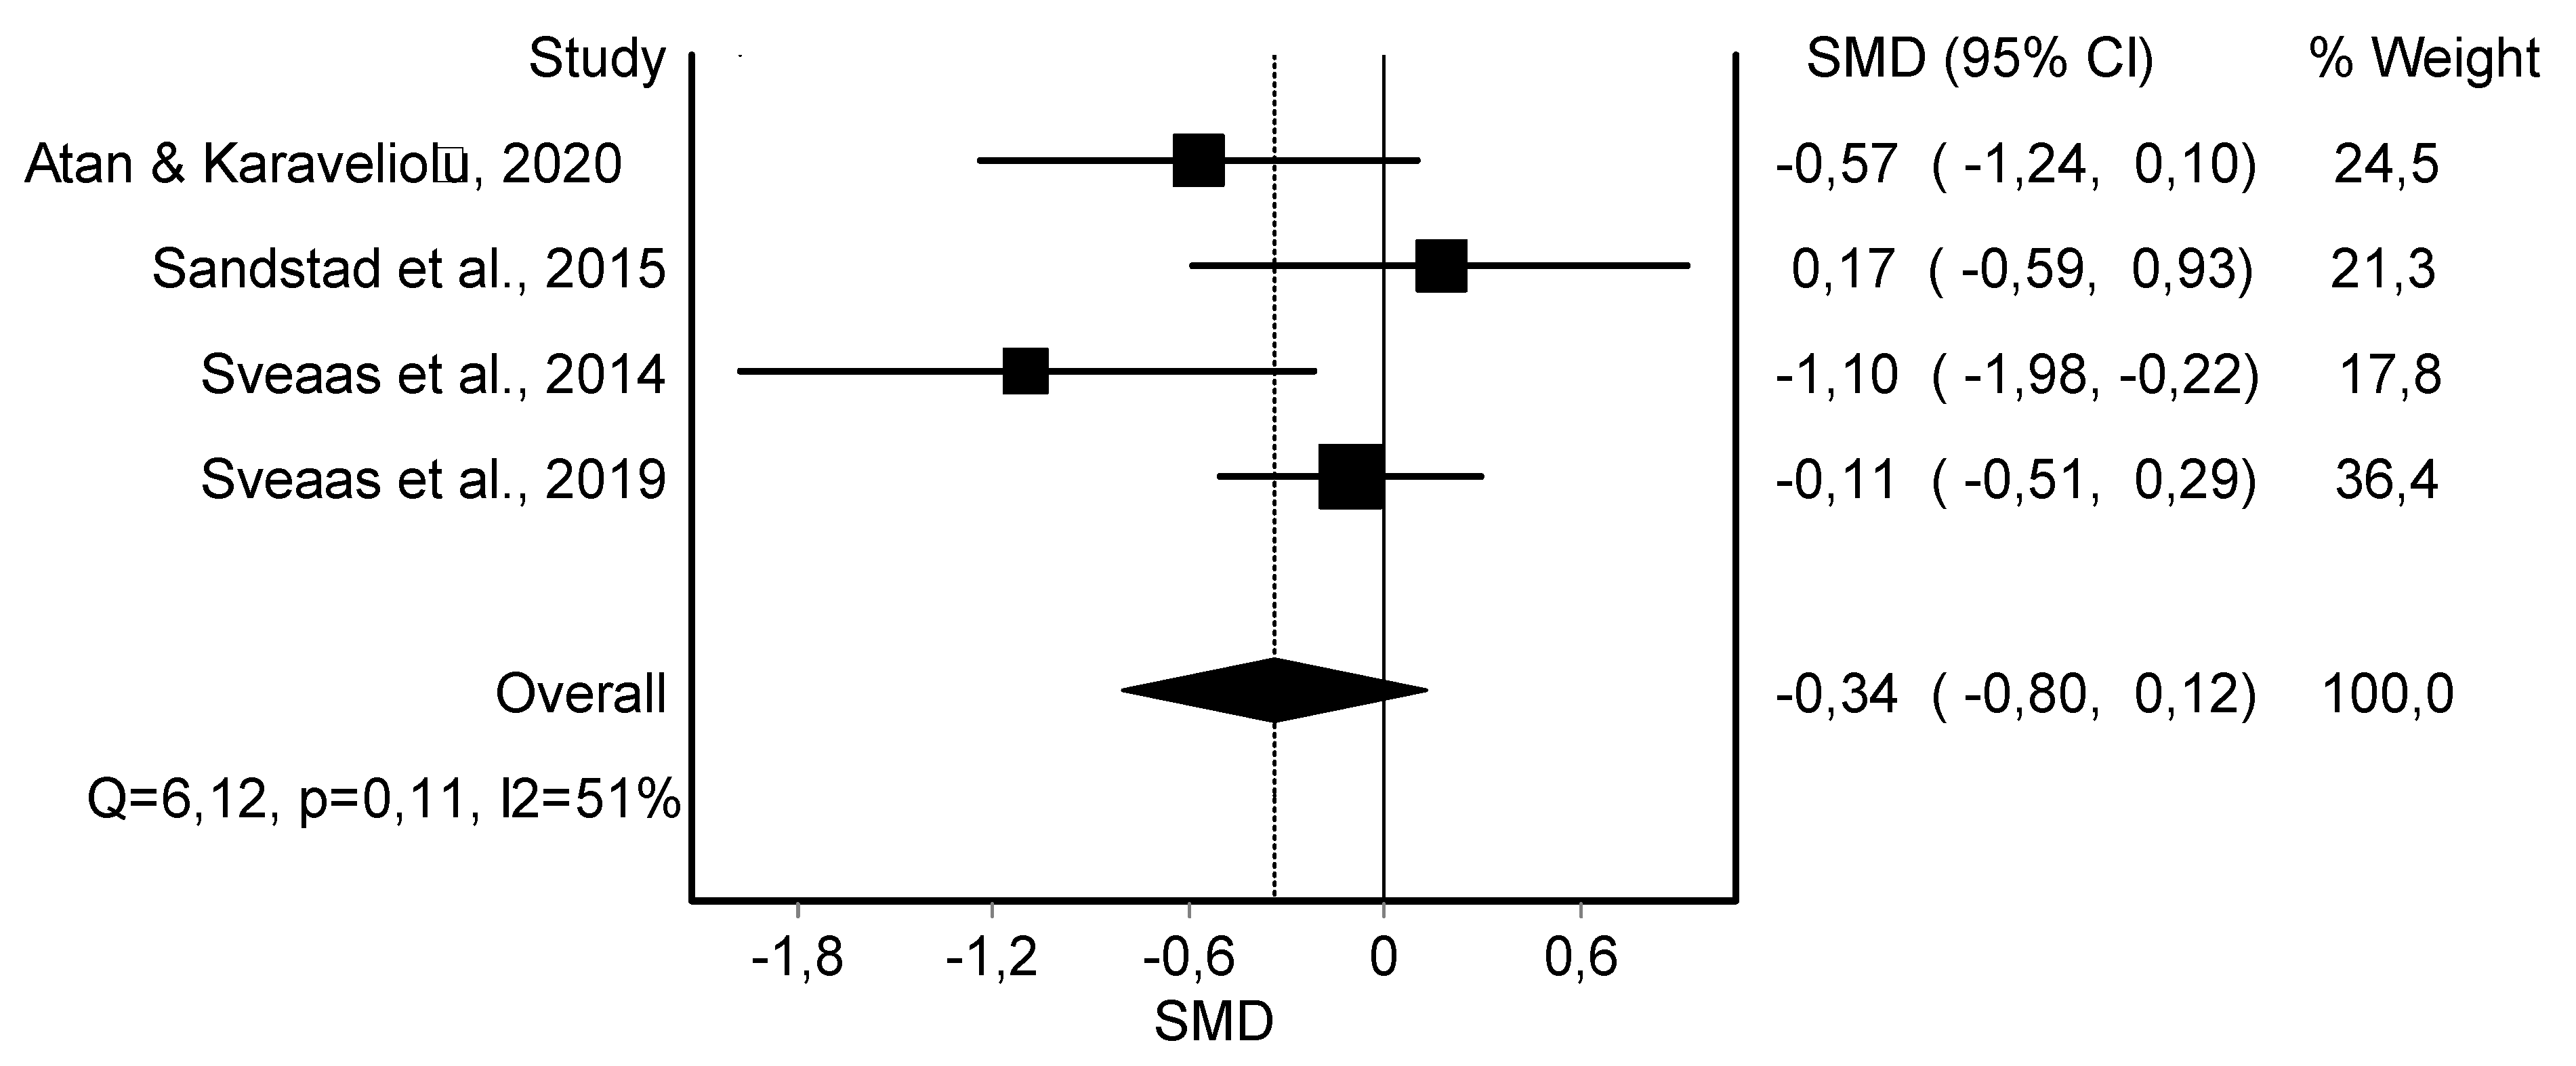
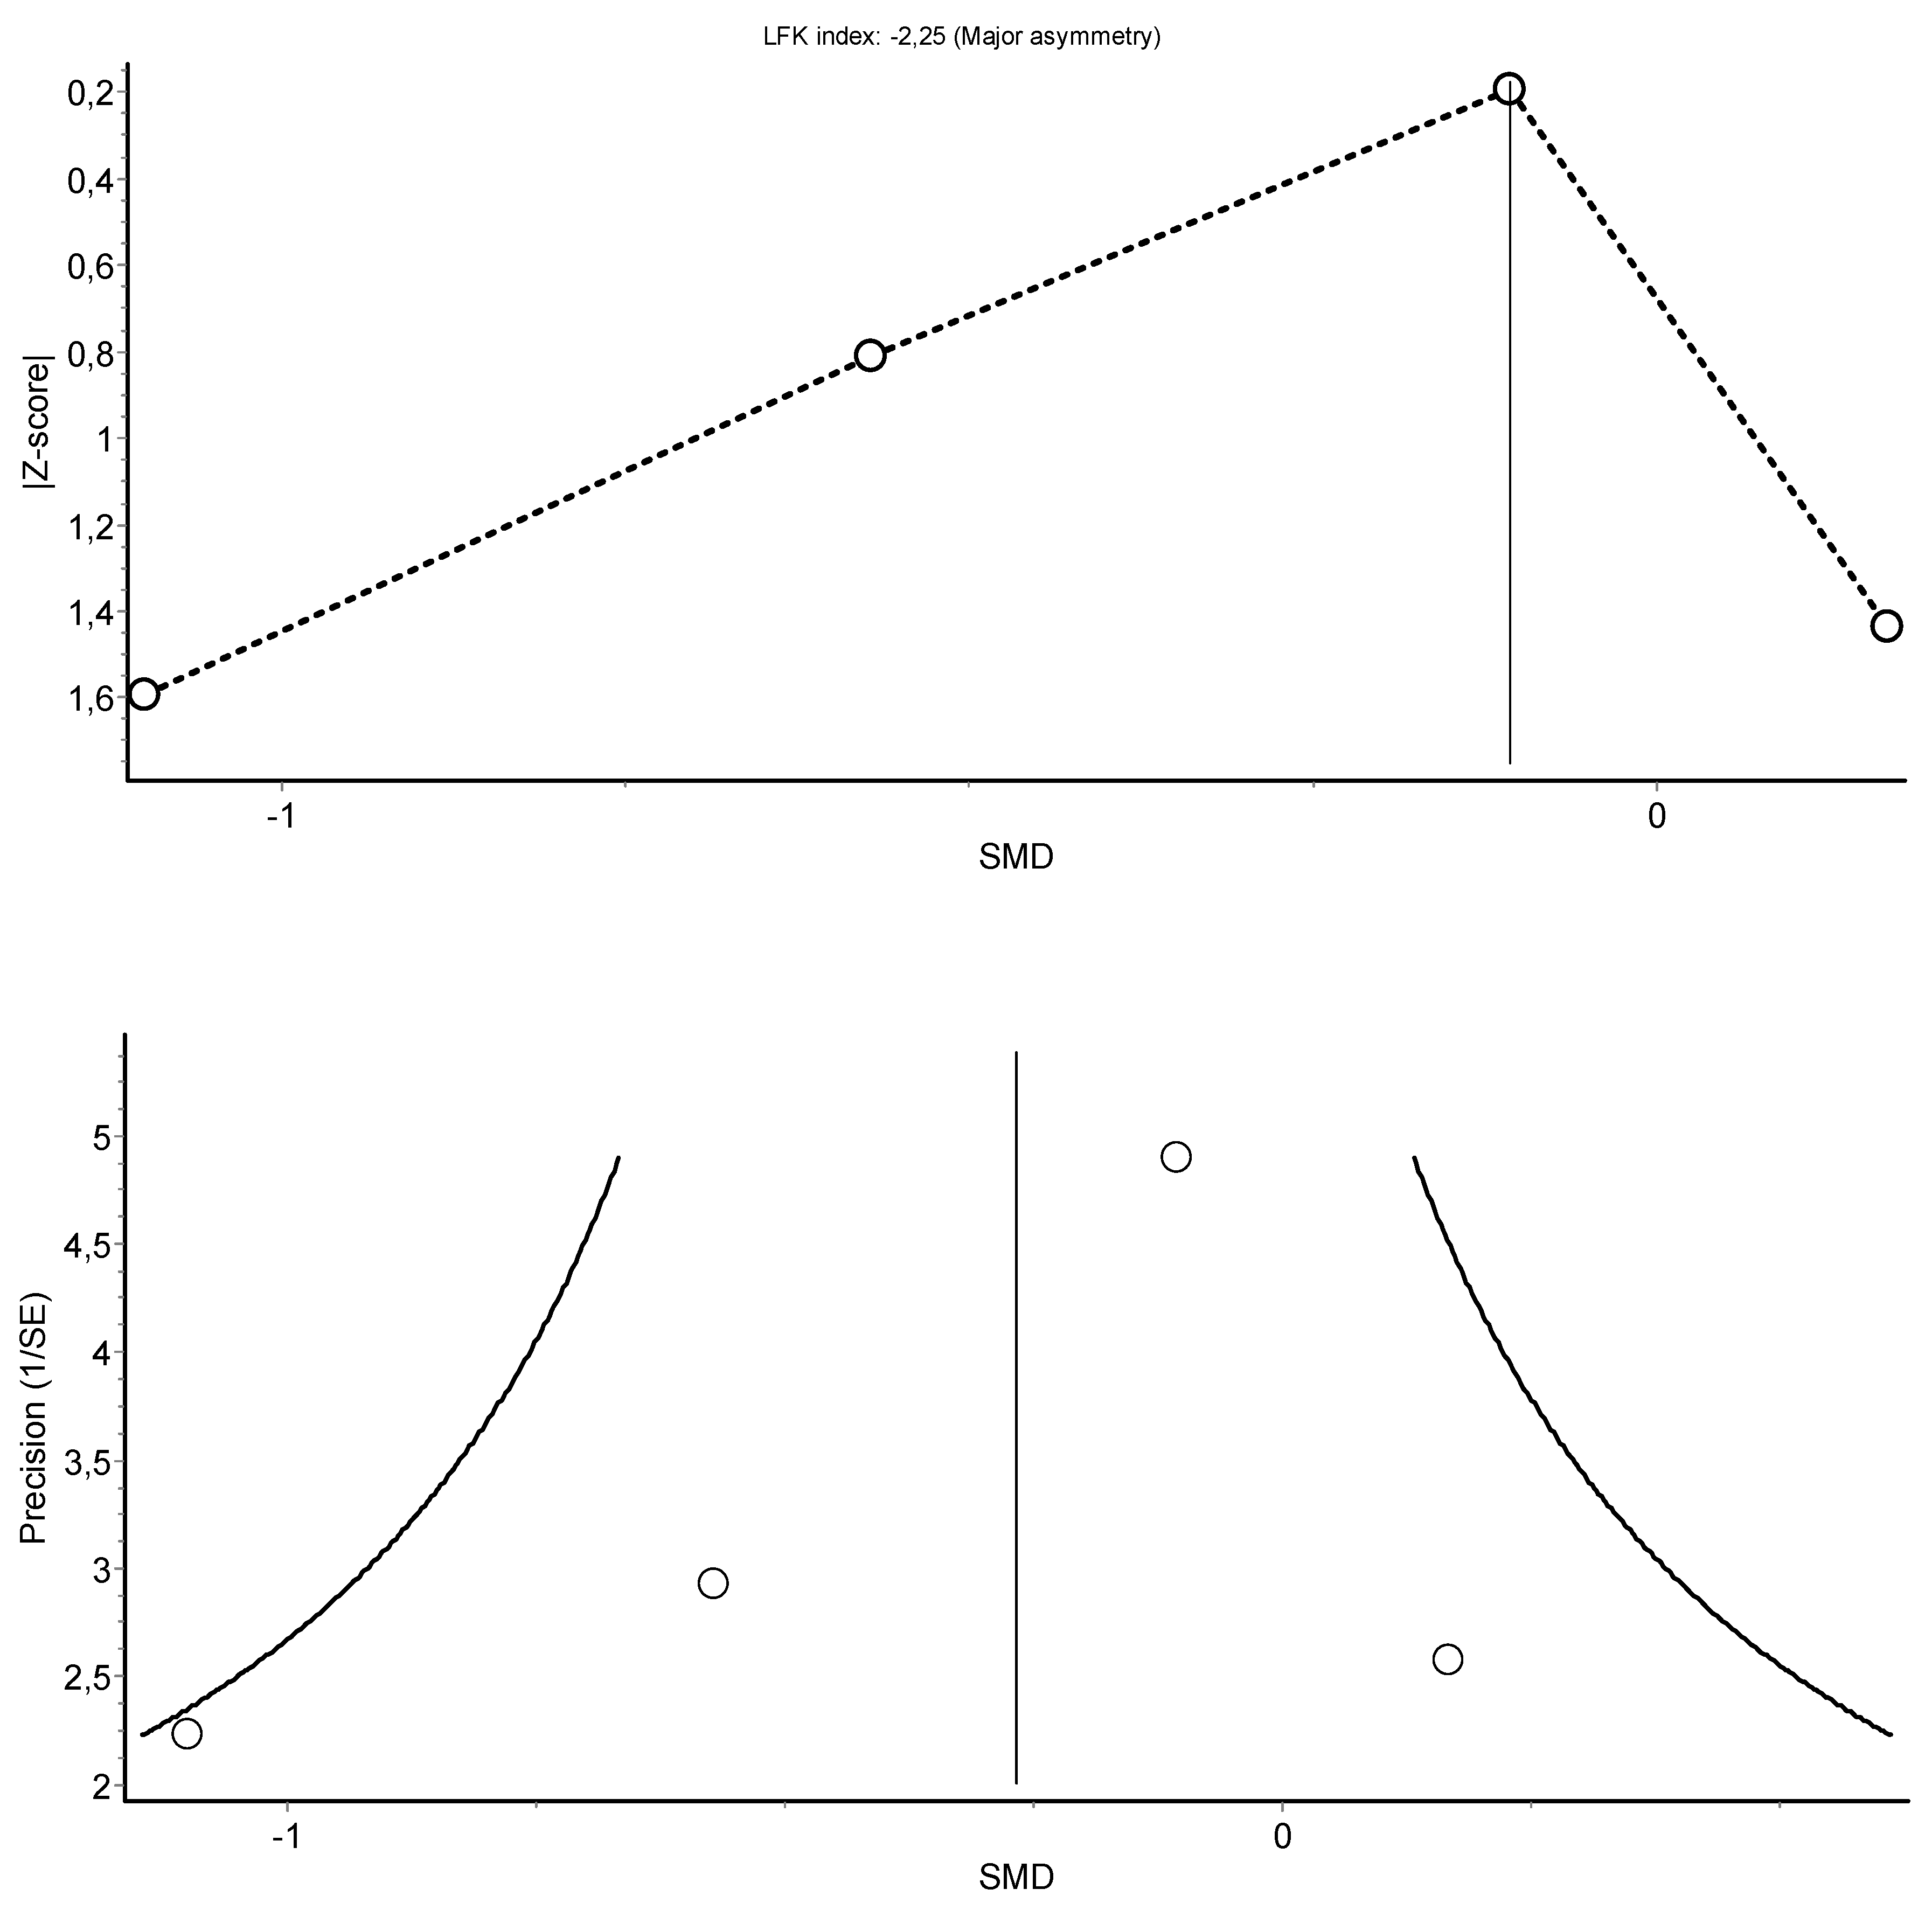
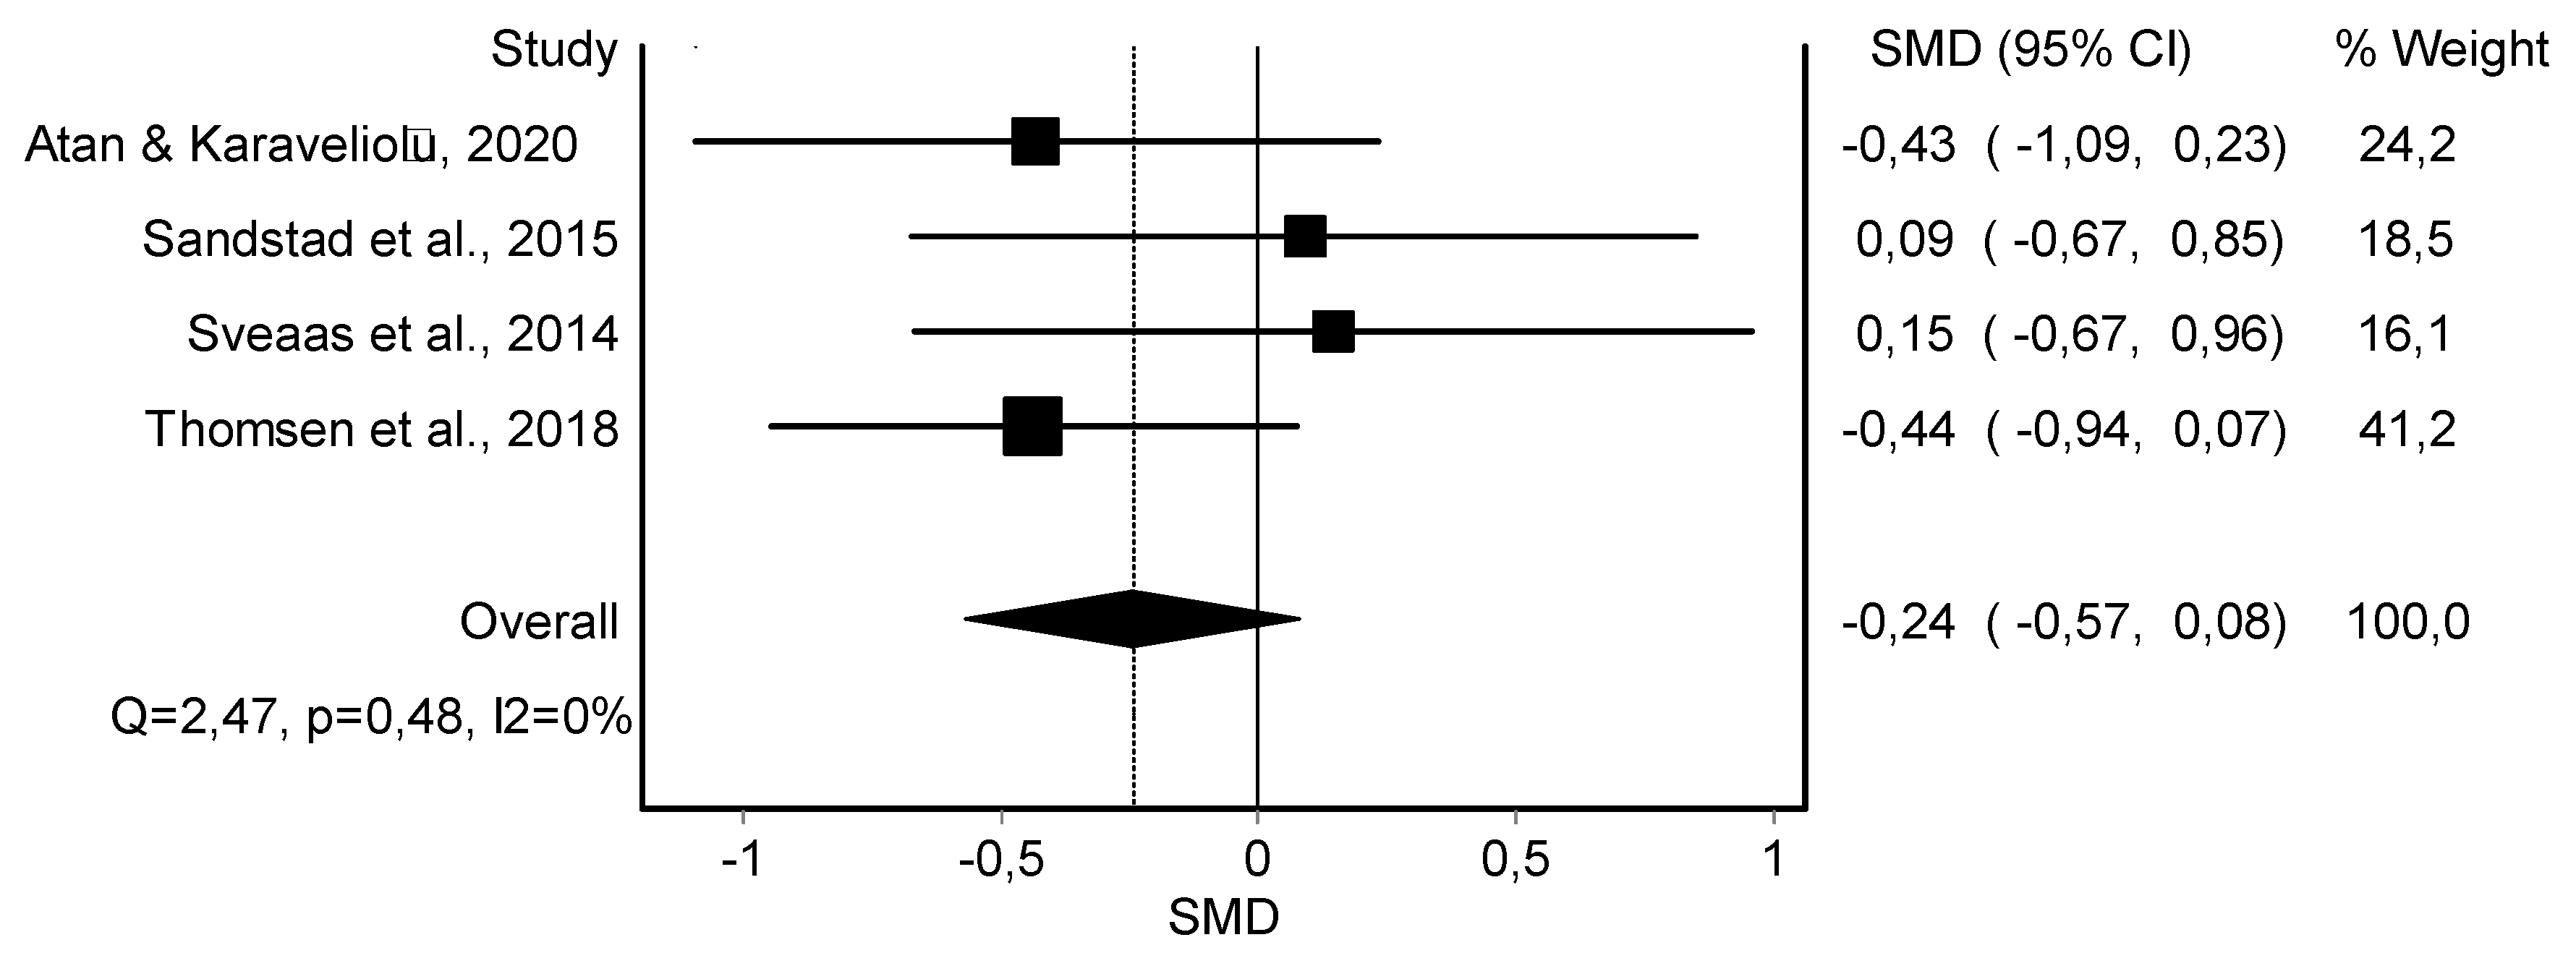
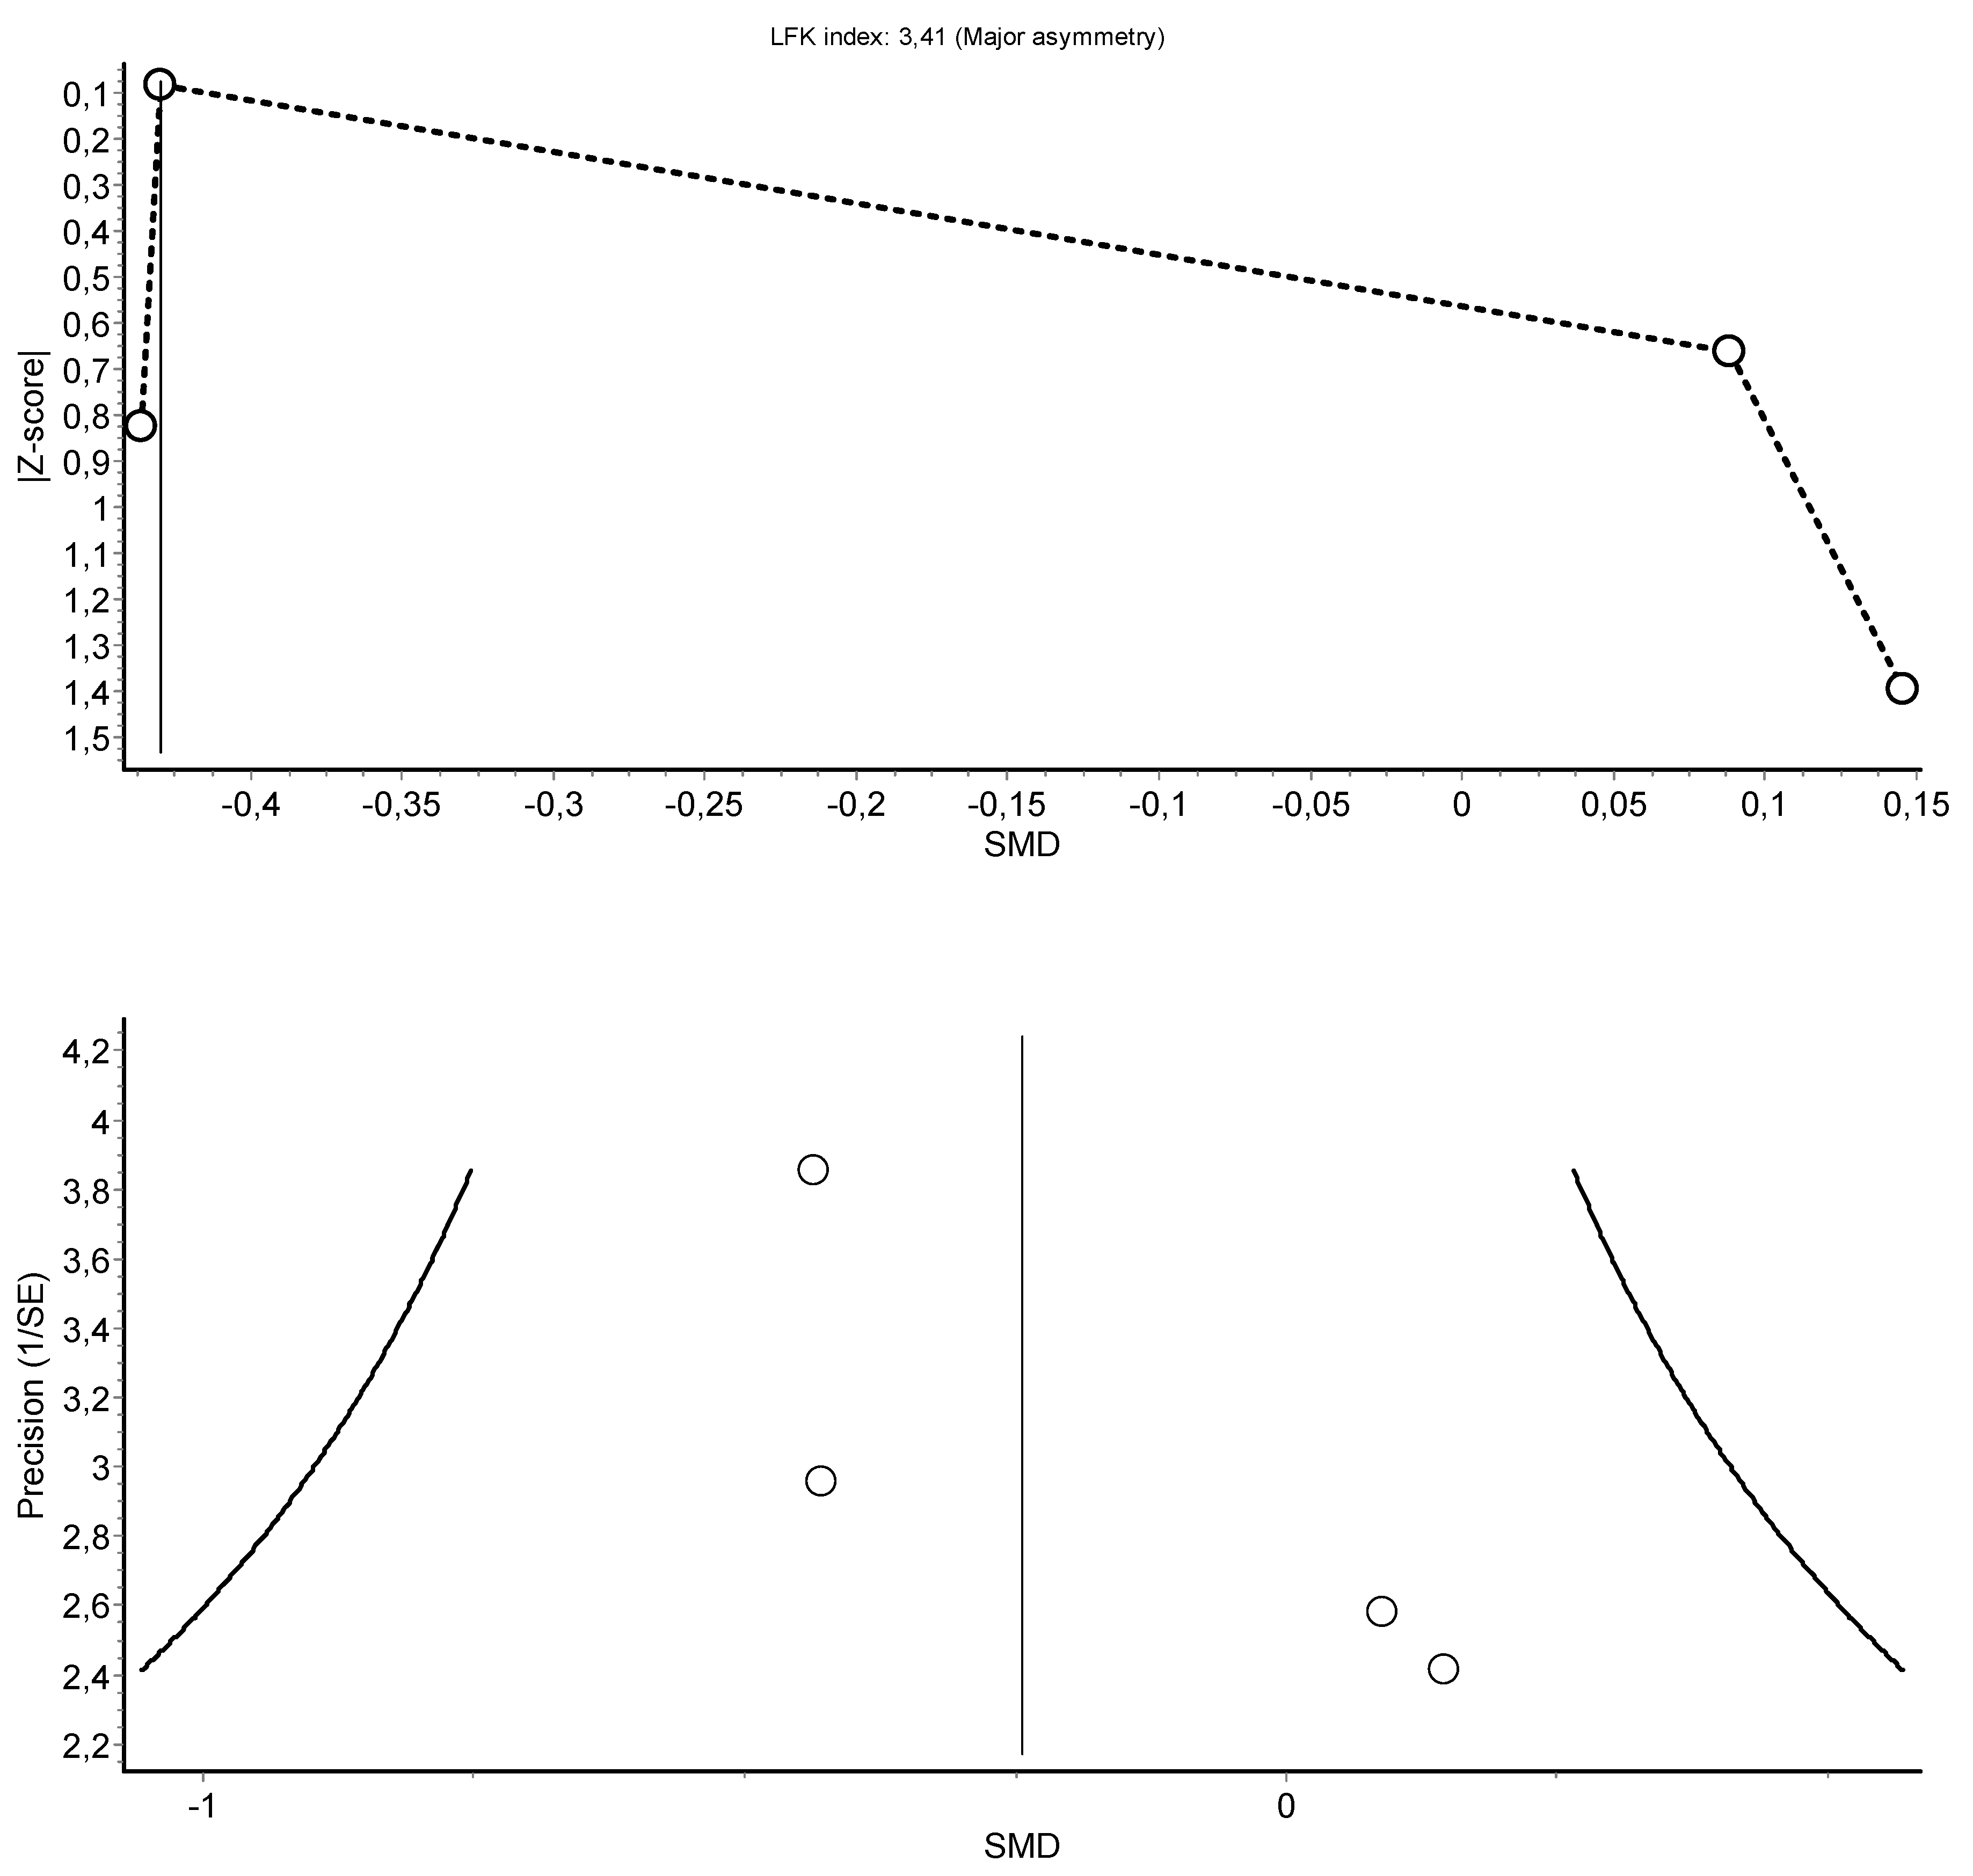
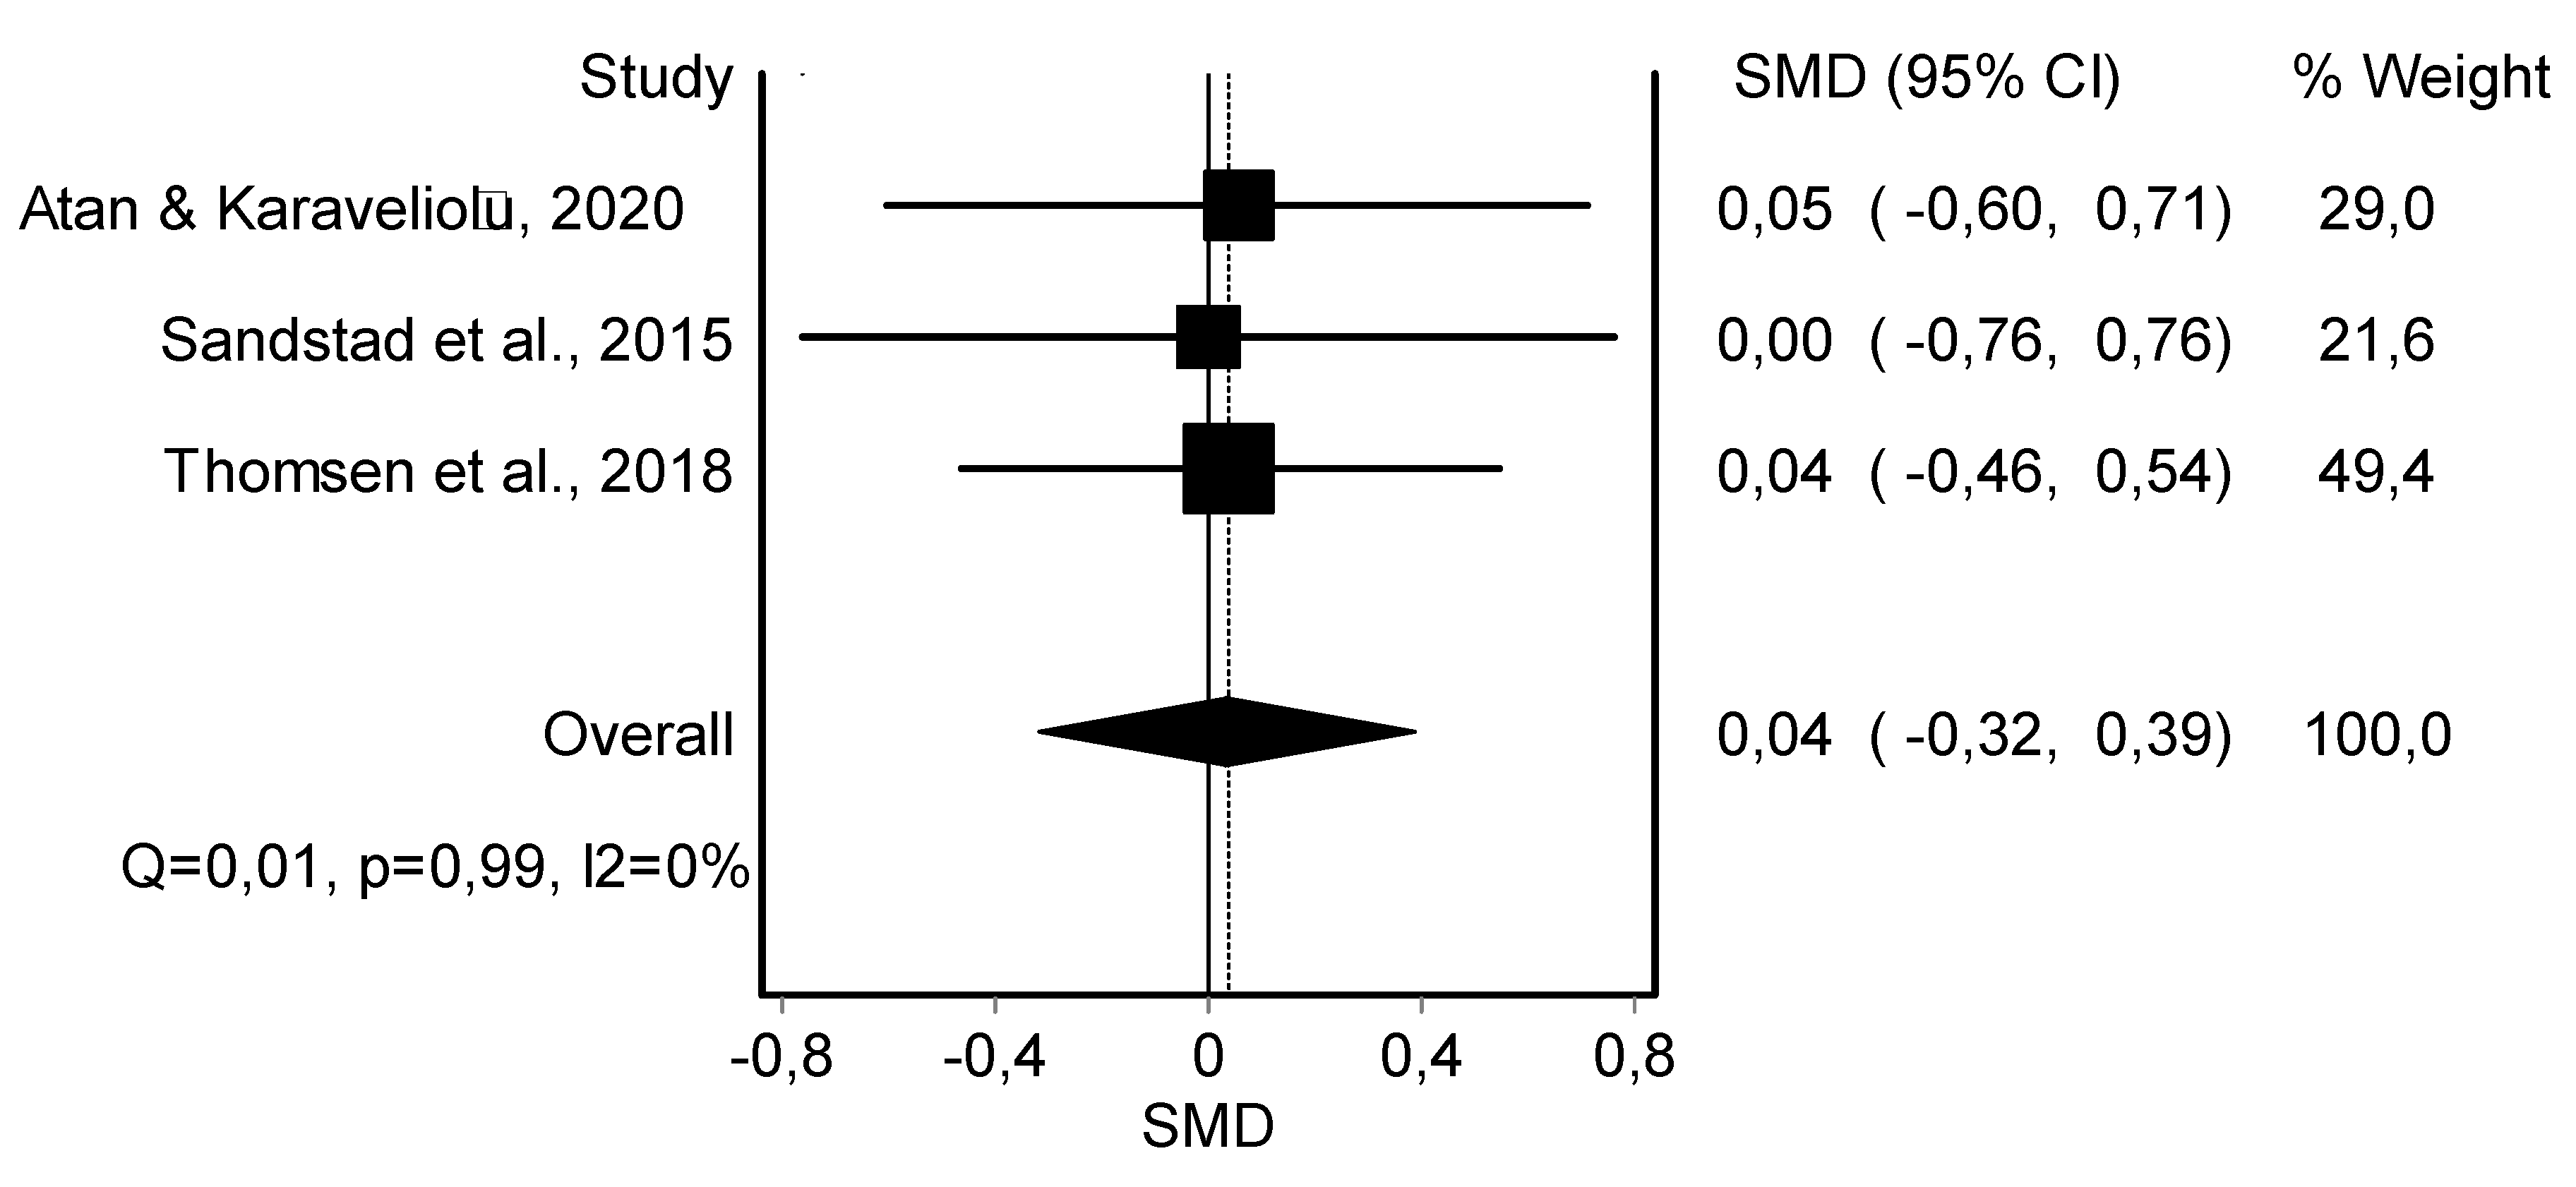
3.4. Meta-Analysis Results
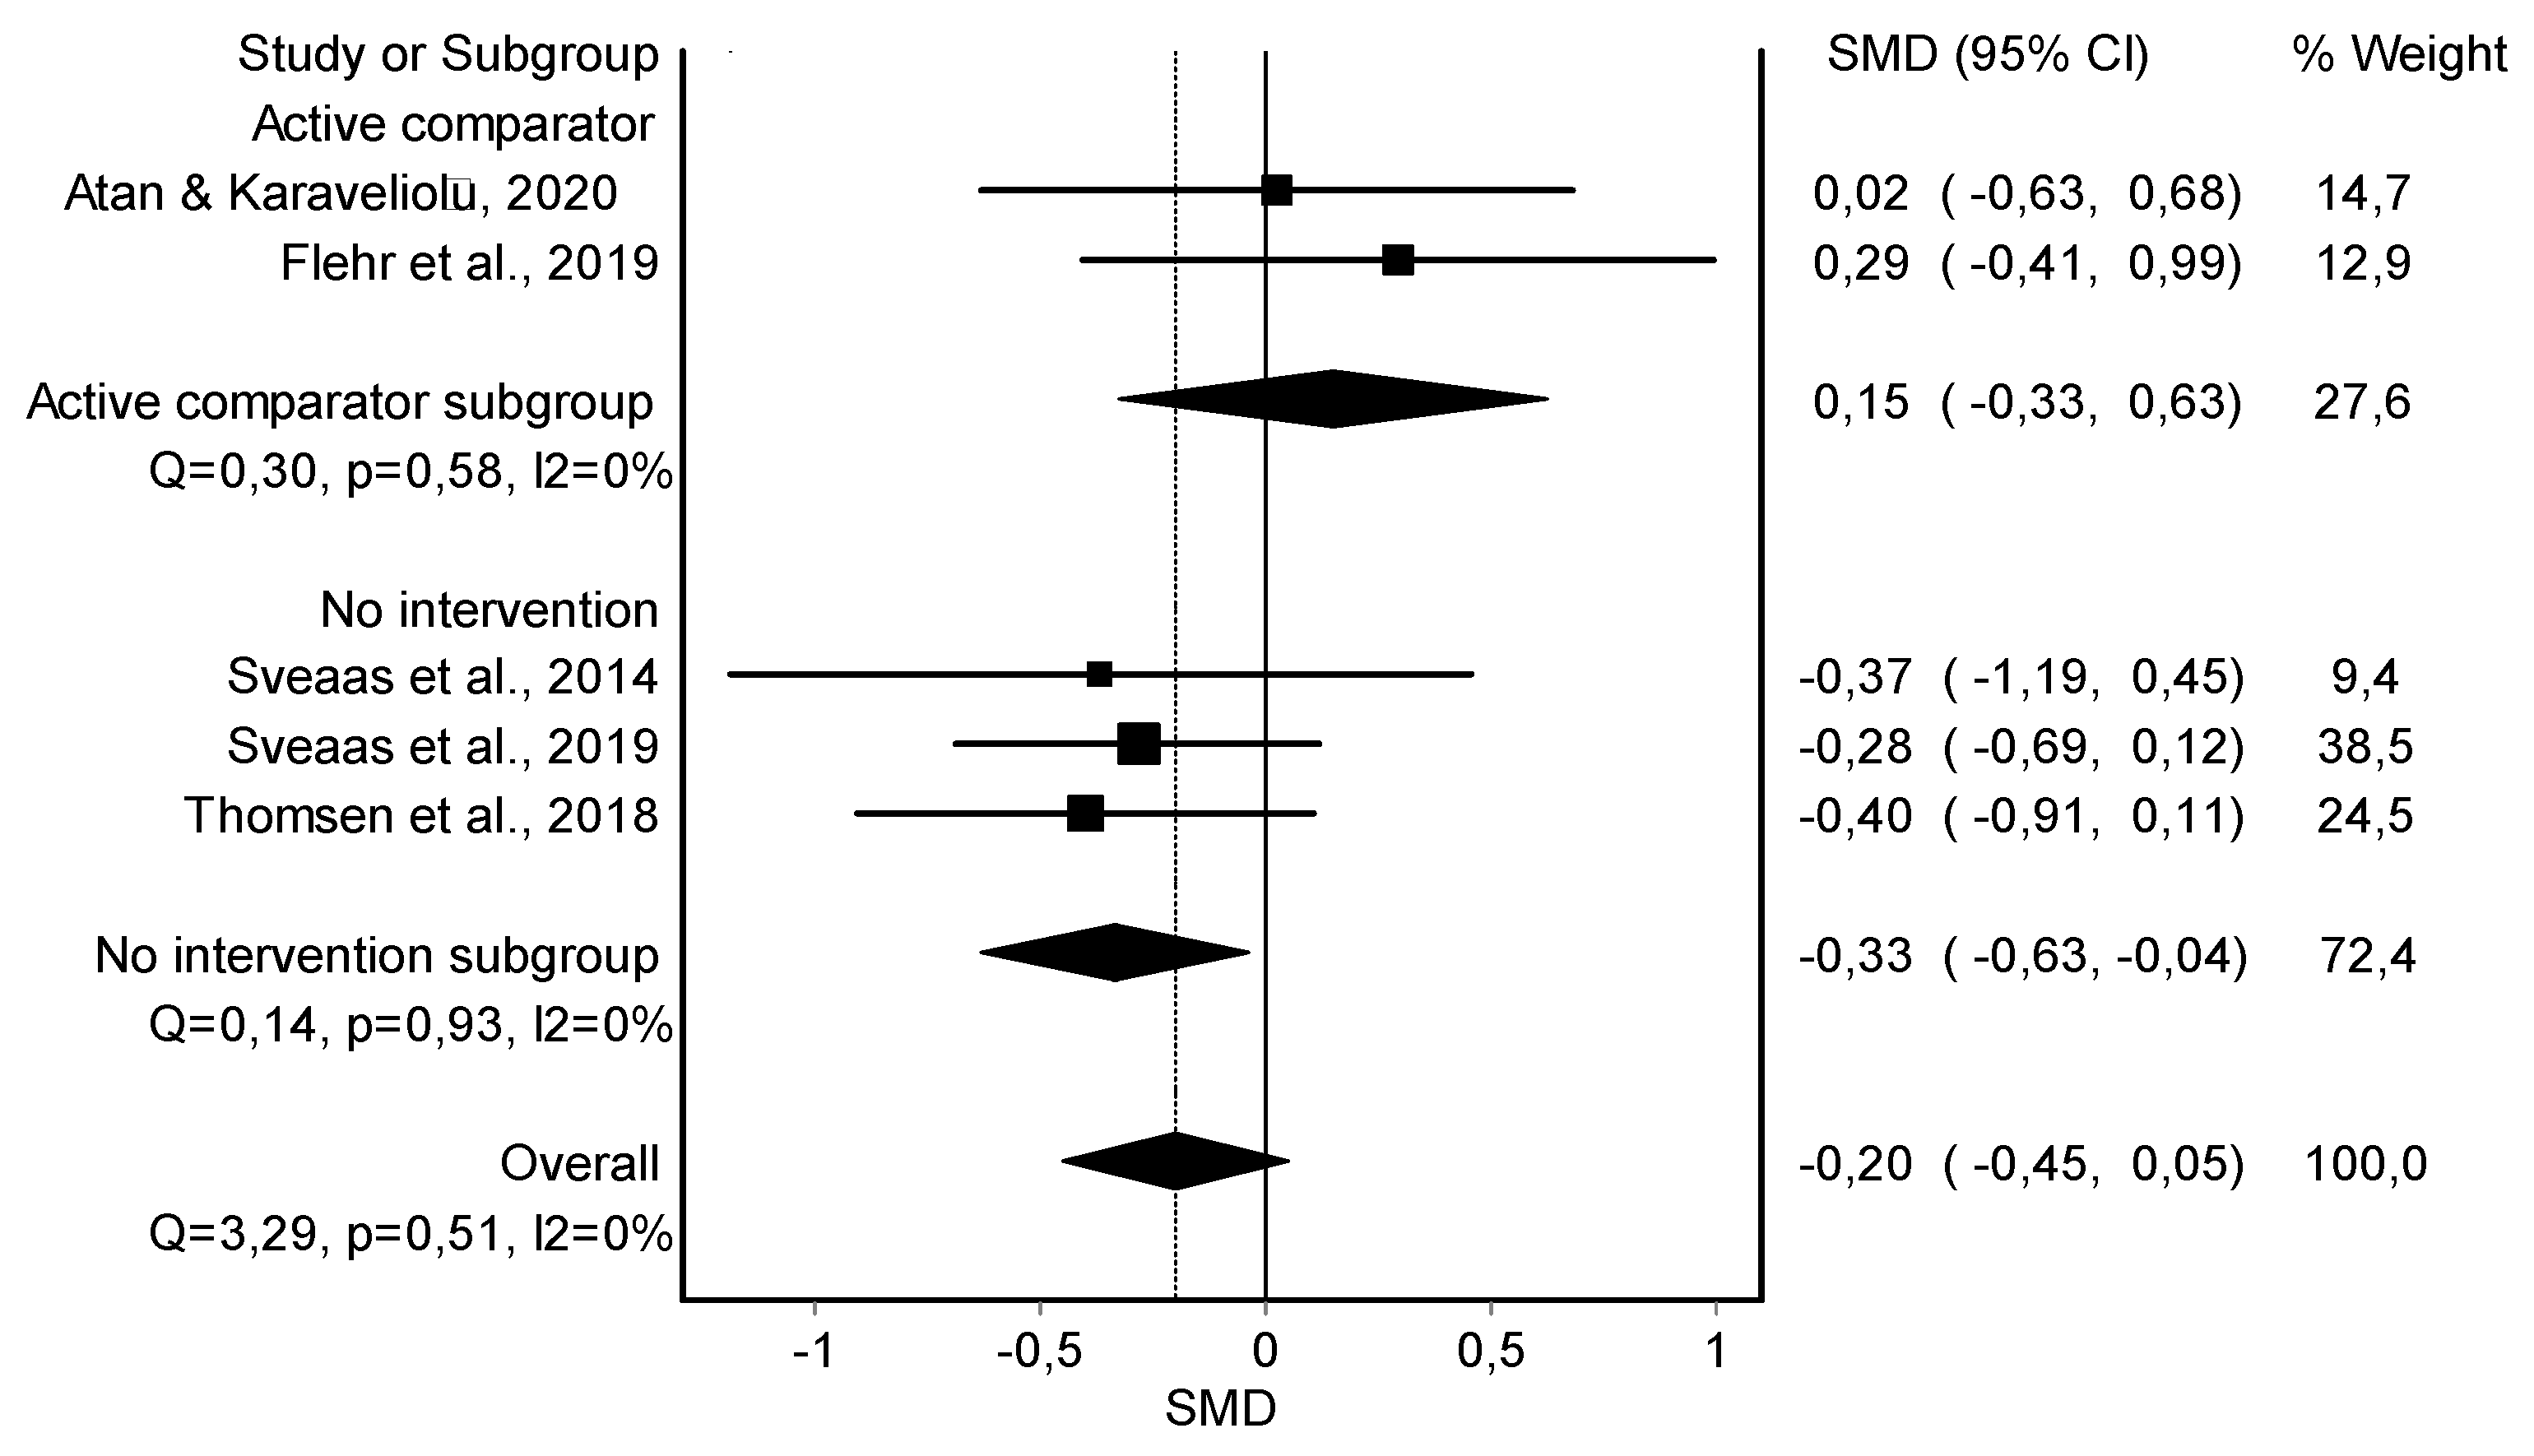
HIIT Training against No Intervention, Minimal Intervention, or Usual Care
4. Discussion
5. Conclusions
Author Contributions
Funding
Institutional Review Board Statement
Informed Consent Statement
Data Availability Statement
Conflicts of Interest
Appendix A. Search Strategy in the Different Electronic Databases
- PubMed (MEDLINE)—72 trials
- Cochrane Central Register of Controlled Trials (CENTRAL)—135 trials
| ID | Search Strategy |
| #1 | MeSH descriptor: [High-Intensity Interval Training] explode all trees |
| #2 | (high intensity interval training) OR (HIIT) OR (High-intensity interval training) |
| #3 | #1 OR #2 |
| #4 | MeSH descriptor: [Musculoskeletal Pain] explode all trees |
| #5 | MeSH descriptor: [Chronic Pain] explode all trees |
| #6 | (Pain) OR (musculoskeletal pain) OR (musculoskeletal disorder) OR (chronic pain) |
| #7 | #4 OR #5 OR #6 |
| #8 | MeSH descriptor: [C-Reactive Protein] explode all trees |
| #9 | MeSH descriptor: [Body Composition] explode all trees |
| #10 | MeSH descriptor: [Heart Rate] explode all trees |
| #11 | MeSH descriptor: [Blood Pressure] explode all trees |
| #12 | (inflammatory marker) OR (pain) OR (inflammatory markers) OR (c-reactive protein) OR (body composition) OR (body weight) OR (body fat) OR (muscle mass) OR (heart rate) OR (blood pressure) |
| #13 | #8 OR #9 OR #10 OR #11 OR #12 |
| #14 | #3 AND #7 AND #13 |
- Web of Science—82 trials
- Cumulative Index to Nursing and Allied Health Literature (CINAHL)—55 trials
- SPORTDiscus—42 trials
- Scopus—43 trials
- Google Scholar


| Author, Year Study Design Country | Population Disease (n) Age (Years) Gender (%) Diagnostic Criteria Disease Duration (Years) | Duration Intervention(s) and Control Group (n) | Outcome Measured (Units) | Results |
|---|---|---|---|---|
| Atan and Karavelioğlu, 2020 [38] Pilot RCT Turkey | Fibromyalgia (n = 55) Age: 48.7 ± 9.1 yrs 100% F American College of Rheumatology 2016 diagnostic criteria Duration: 2.5 ± 1.6 yrs | 6 weeks Intervention -HIIT (n = 19) -MICT (n = 19) Control Usual care (n = 17) | Resting SBP (mmHg) Resting DBP (mmHg) Resting HR (bpm) Body Fat % Body Weight (kg) Muscle Mass (kg) | Statistically significant decrease in the MICT group of body weight (p = 0.006), resting SBP (p = 0.018), resting HR (p = 0.018), and BMI (p = 0.008). Statistically significant decrease in the HIIT group of resting SBP (p = 0.049) and resting HR (p = 0.024). |
| Flehr et al., 2019 [39] RCT Australia | Persistent pain condition (n = 32) Age: 30.2 ± 8 yrs 100% F N/R Duration: more than 12 months | 8 weeks Intervention HIIT (n = 15) Control Bikram Yoga (n = 17) | Resting SBP (mmHg) Resting HBP (mmHg) Resting HR (bpm) | No statistically significant differences in any variables. |
| Keogh et al., 2018 [40] Pilot RCT Australia | Knee OA (n = 17) Age: 62.4 ± 8.3 yrs 76% F/24% M Diagnostic by an orthopaedic surgeon Duration: 4.7 ± 4.6 yrs | 8 weeks Intervention HIIT (n = 9) Control MICT (n = 8) | Body Fat % Body Weight (kg) Muscle Mass (kg) | No statistically significant differences in any variables. |
| Sandstad et al., 2015 [45] rCOT Norway | RA and JIA (n = 27) Age: 33.0 ± 8.1 yrs 100% F Diagnosis by a rheumatologist Duration: N/R | 10 weeks Intervention HIIT (n = 12) Control No intervention (n = 15) | Resting SBP (mmHg) Resting DBP (mmHg) Body Fat % Body Weight (kg) BMI (kg/m2) Waist Circumference (cm) Muscle Mass (%) hsCRP (mg/L) | Statistically significant differences in the HIIT group in BMI (p = 0.04), body fat (p = 0.04), muscle mass (p = 0.03), and waist circumference (p = 0.004). There was a trend toward decrease in hsCRP (p = 0.08). No statistically significant differences in blood pressure. |
| Sveaas et al., 2014 [42] Pilot RCT Norway | axSpA (n = 24) Age: 48.5 ± 12.0 yrs 50% F/50% M Spondyloarthritis international society criteria Duration: 24.9 ± 15.8 yrs | 12 weeks Intervention HIIT (n = 10) Control Usual care (n = 14) | Resting SBP (mmHg) Resting DBP (mmHg) Resting HR (bpm) Body Fat % Body Weight (kg) Waist Circumference (cm) CRP (mg/L) | Statistically significant differences in resting HR (p = 0.02), waist circumference (p = 0.02), and body fat (p < 0.001). No statistically significant differences in body weight, BMI, CRP, and blood pressure. |
| Sveaas et al., 2019 [41] RCT Norway | axSpA (n = 97) Age: 46.2 ± N/R yrs 53% F/47% M Spondyloarthritis international society criteria Duration: N/R | 12 weeks Intervention HIIT (n = 48) Control No intervention (n = 49) | Resting HR (bpm) Body Weight (kg) BMI (kg/m2) Waist Circumference (cm) CRP (mg/L) | Statistically significant decrease in CRP (p = 0.041). No statistically significant differences in resting HR, body weight, BMI, and waist circumference. |
| Thomsen et al., 2018 [44] RCT Norway | PsA (n = 61) Age: 47.7 ± 11.9 yrs 67% F/33% M Classification of psoriatic arthritis study group criteria Duration: 6.2 ± 7.4 yrs | 11 weeks Intervention HIIT (n = 30) Control No intervention (n = 31) | Body Fat (%) Resting HR (bpm) Lean Muscle Mass (g) | Participants in the HIIT group had a statistically significant decrease in their resting heart rate (p = 0.004) and body fat (p = 0.001), however, there were no statistically significant differences with control group. |
| Thomsen et al., 2019 [43] RCT Norway | PsA (n = 67) Age: 48.0 ± 11.5 yrs 64% F/36% M Classification of psoriatic arthritis study group criteria Duration: N/R | 11 weeks Intervention HIIT (n = 32) Control No intervention (n = 35) | hsCRP (mg/L) | No statistically significant differences in hsCRP. |
| Trial | Group | Exercise Protocol (Distribution and Exercise Type) | Intensity (Pain Control during Training) | Frequency and Duration | Exercise Testing |
|---|---|---|---|---|---|
| Atan and Karavelioğlu, 2020 [38] | HIIT + StrT + Stretching | Total Exercise Duration: 35 min Warm-up and Cool-Down: 5-min stationary cycling. HIIT Protocol: 4 × 4 min of high-intensity stationary cycling alternating with 3-min cycling recovery periods. Work/Rest Ratio: [1:0.75] Followed by 10-min full body (shoulder, arm, leg, and hip) StrT, using 1–3 kg weights (1 × 8–10 rep), and 5-min stretching (4–5 × 20–30 s for each muscle group). | Measurement:HRmax (Monitorization: N/R) Warm-Up and Cool-Down: 50% HRmax HIIT: Interval: 80–95% HRmax Active Rest: 70% HRmax StrT: N/R Pain:N/R | 5×/week 6 weeks | Maximal cardiopulmonary test on a cyclo-ergometer at baseline and follow-up. HRmax, VO2max, BP, Workload, MET, and duration-of-test were recorded. |
| MICT + StrT + Stretching | Total Exercise Duration: 55 min Warm-up and Cool-Down: 5-min stationary cycling. MICT Protocol: 45-min continuous stationary cycling. Followed by 10-min full body (shoulder, arm, leg and hip) StrT, using 1–3 kg weights (1 × 8–10 rep), and 5-min stretching (4–5 × 20–30 s for each muscle group). | Measurement: HRmax (Monitorization: N/R) Warm-Up and Cool-Down: 50% HRmax MICT: 65–70% HRMax StrT: N/R Pain: N/R | |||
| Usual Care | Recommendations regarding exercise for fibromyalgia. | N/A | |||
| Flehr et al., 2019 [39] | HIIT | 45-min functional training incorporating running, throwing, standing from a seated position, placing things overhead, and picking things up. Warm-up and Demonstration: 15 min Movement Learning: 15 min HIIT Protocol: 15-min reproduction of the movement at high intensity. Four formats possible: as fast as possible, 8-exercise tabata intervallic training followed by AerT, maximum reps or load in a set time, or as many rounds as possible in 12-min followed by AerT. | N/R Pain: N/R | 3×/week 8 weeks | N/R |
| Yoga | 90-min Bikram yoga class (room at 40 °C and humidity of 40%): deep breathing, 45- to 50-min standing, stretching, and relaxation postures. | Light to moderate (According to ACSM) and sometimes vigorous. Pain: N/R | |||
| Keogh et al., 2018 [40] | HIIT | Warm-up: 7-min stationary cycling progressively increasing intensity. HIIT Protocol: 5 × 45-seg high-cadence stationary cycling alternating with 90-seg low-intensity recovery cycling. Work/Rest Ratio: [1:2] Cool-down: 6–7 min of light to moderate cycling. | HIIT: Interval: 110 rpm with a resistance similar or slightly higher than rest. “An intensity at which you felt it was quite difficult to complete sentences during the exercise.” Rest: ∼70 rpm To avoid pain, progressive increase in initial sessions. | 4×/week 8 weeks | N/R |
| MICT (AerT) | Warm-up and Cool-down: Light intensity cycling during 3 min and 2 min, respectively. MCIT Protocol: 20-min continuous cycling. | MCIT: 60–80 rpm “An intensity in which you are able to speak in complete sentences during the exercise” To avoid pain, progressive increase in initial sessions | |||
| Sandstad et al., 2015 [45] | HIIT | Warm-up: 10-min stationary cycling at moderate intensity HIIT Protocol: 4 × 4-min high-intensity stationary cycling alternating with 3-min cycling recovery periods. The speed and workload were adjusted continuously. | Measurement: HRmax (HR checked using HR monitor) Warm-up: ~70% Interval: 85–95% of HRmax Rest: ~70% of HRmax Pain: N/R | 2×/week 10 weeks | Maximal cardiopulmonary test on a bike. VO2max and HRmax (defined as the highest HR during the test more 5 bpm). |
| Maintain daily life activities | N/A | N/A | |||
| Sveas et al., 2014 and 2019 [41,42] | HIIT + StrT + MICT (AerT) | Twice a week, supervised HIIT and StrT: -HIIT Protocol: 4 × 4-min walking/running on a treadmill alternating with 3-min of active resting. -StrT protocol: 20 min with external load (2–3 × 8–10 rep): Bench press or chest press machine, weighted squat or leg press machine, rowing with weight, triceps and biceps machine, and abdominal bridge. One time per week, individual interval training or MICT: 40 min of either an interval training or an MICT. | Measurement: HRmax (HR checked using HR monitor) HIIT: Interval: 90–95% HRmax Rest: 70% HRmax MICT intensity: >70% HRmax Pain: Exercises were adapted if pain reached ≥ 5/10. | 3×/week 12 weeks | Cardiopulmonary test on a walking treadmill (Modified Balke protocol). VO2max and HRmax were recorded. |
| Asked to not start exercise | N/A | N/A | |||
| Thomsen et al., 2018 and 2019 [43,44] | HIIT | Warm-up: 10 min. HIIT Protocol: 4 × 4-min high-intensity stationary cycling alternating with a 3-min cycling recovery period. Work/Rest Ratio: [1:0.75] Supervised twice a week and individual once a week. Participants were instructed in using the HIIT concept by, e.g., running, bicycling, or walking uphill. | Measurement: HRmax (HR checked using HR monitor) Interval: 85–95% HRmax Rest: 70% HRmax Pain: N/R | 2×/week 11 weeks | Maximal cardiopulmonary test on a bike. VO2max and HRmax (defined as the highest HR during the test more 5 bpm) were recorded. |
| Maintain daily physical activity | N/A | N/A |
| Ítems | ||||||||||||
|---|---|---|---|---|---|---|---|---|---|---|---|---|
| 1 | 2 | 3 | 4 | 5 | 6 | 7 | 8 | 9 | 10 | 11 | Total | |
| Atan et al., 2020 [38] | 1 | 1 | 1 | 1 | 0 | 0 | 1 | 1 | 1 | 1 | 1 | 8 |
| Flehr et al., 2019 [39] | 1 | 1 | 1 | 1 | 0 | 0 | 1 | 1 | 1 | 1 | 1 | 8 |
| Keogh et al., 2018 [40] | 1 | 1 | 1 | 1 | 0 | 0 | 0 | 1 | 1 | 1 | 1 | 7 |
| Sandstad et al., 2015 [45] | 1 | 1 | 1 | 1 | 0 | 0 | 0 | 1 | 1 | 1 | 1 | 7 |
| Sveas et al., 2014 [42] | 1 | 1 | 1 | 1 | 0 | 0 | 1 | 1 | 1 | 1 | 1 | 8 |
| Sveas et al., 2019 [41] | 1 | 1 | 1 | 1 | 0 | 0 | 1 | 1 | 1 | 1 | 1 | 8 |
| Thomsen et al., 2018 [44] | 1 | 1 | 1 | 1 | 0 | 0 | 1 | 1 | 1 | 1 | 1 | 8 |
| Thomsen et al., 2019 [43] | 1 | 1 | 1 | 1 | 0 | 0 | 1 | 1 | 1 | 1 | 1 | 8 |

| Certainty Assessment | No. of Participants | Effect | Certainty | ||||||||
|---|---|---|---|---|---|---|---|---|---|---|---|
| Outcome (No. of Studies) | Study Design | Risk of Bias | Inconsistency | Indirectness | Imprecision | Publication Bias | HIIT | Control | Relative (95% CI) | Absolute (95% CI) | |
| Resting Heart Rate (5) | RCT | Not serious | Serious | Serious | Not serious | 121 | 127 | - | −0.20 (−0.45, 0.05) | ||
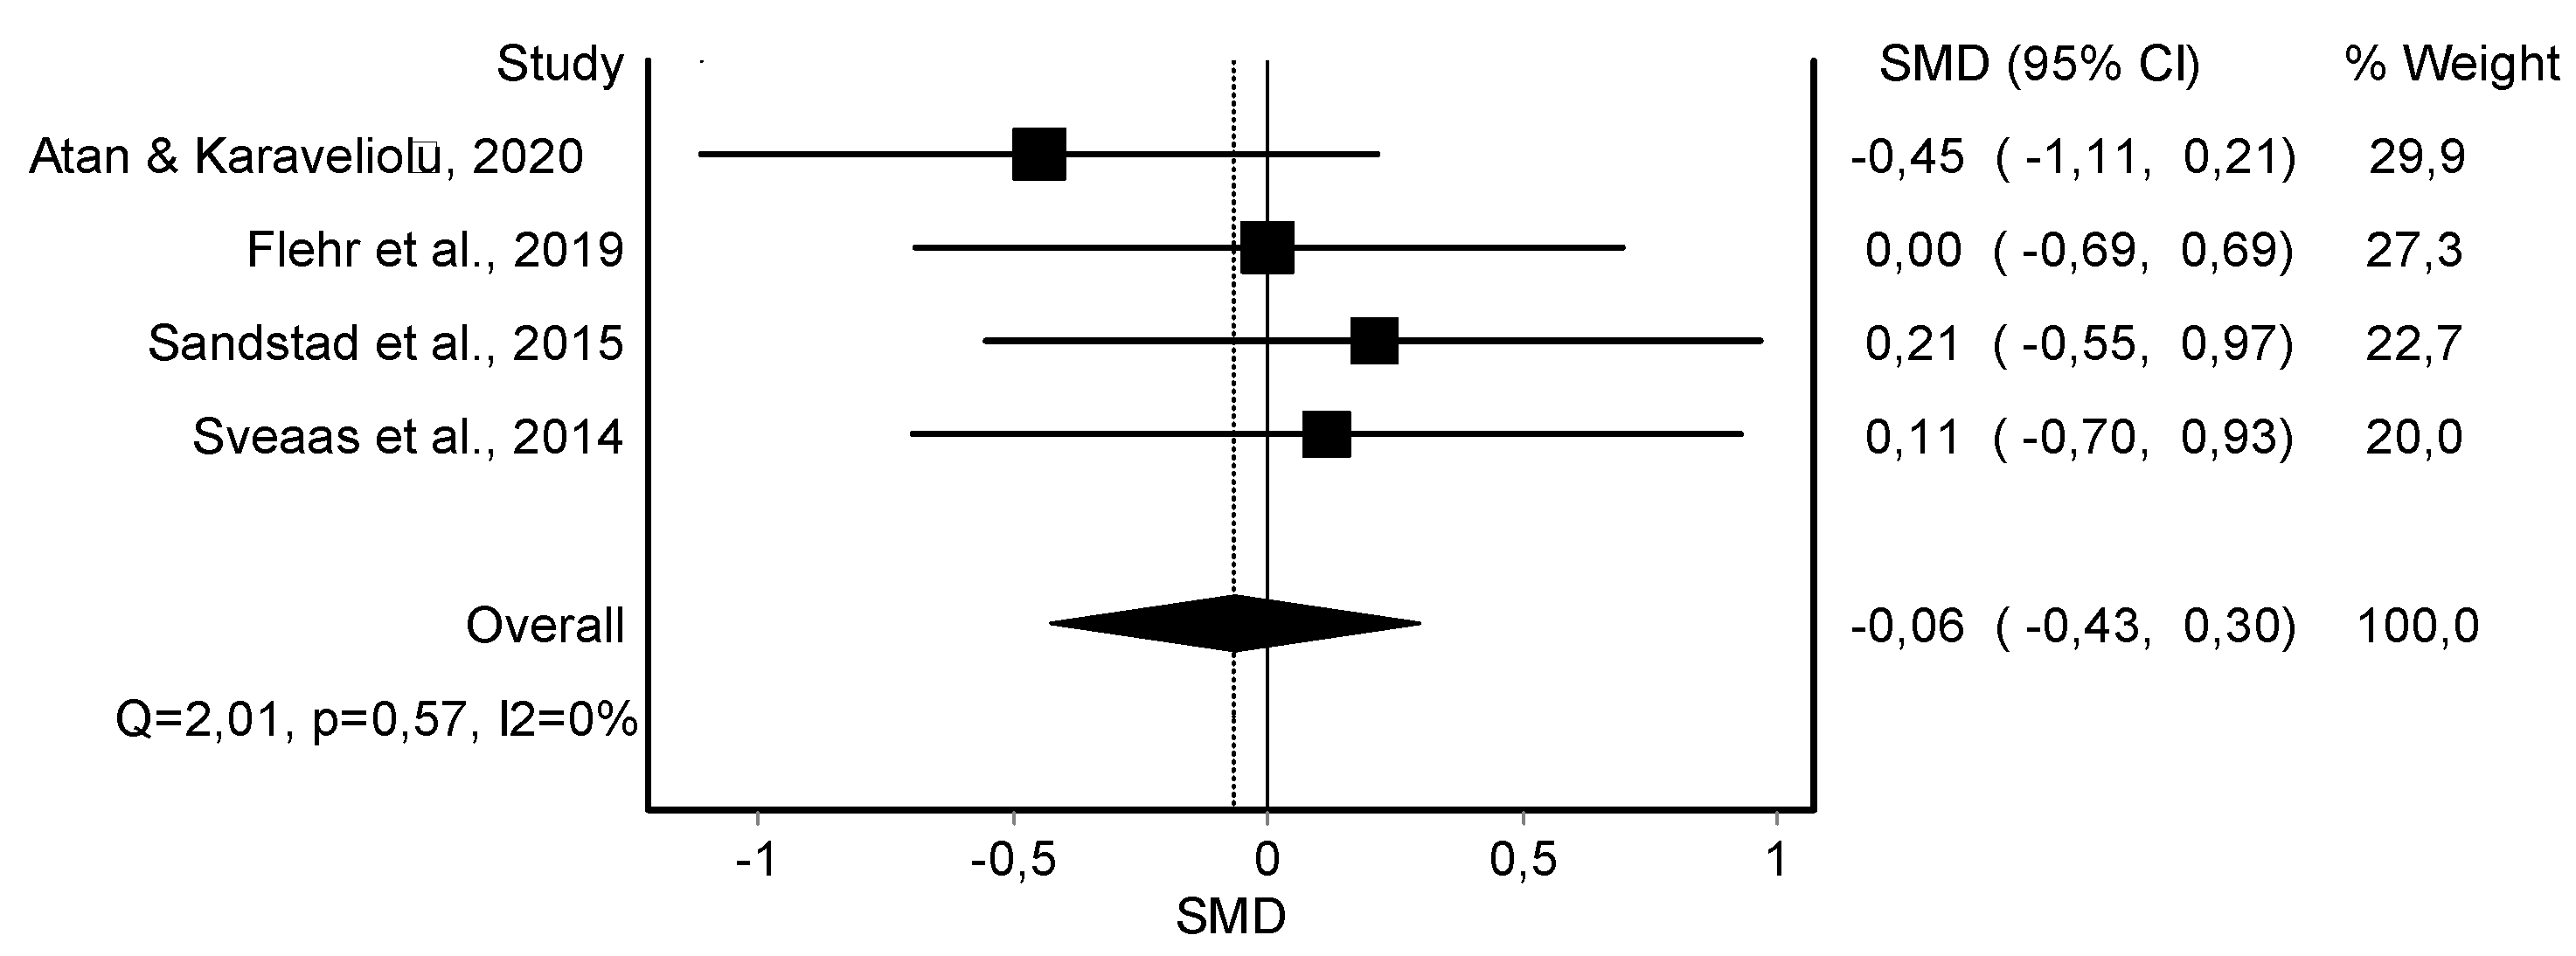
| Resting DBP (4) | RCT and rCOT | Not serious | Serious | Serious | Not serious | 56 | 63 | - | −0.06 (−0.43, 0.30) | ||
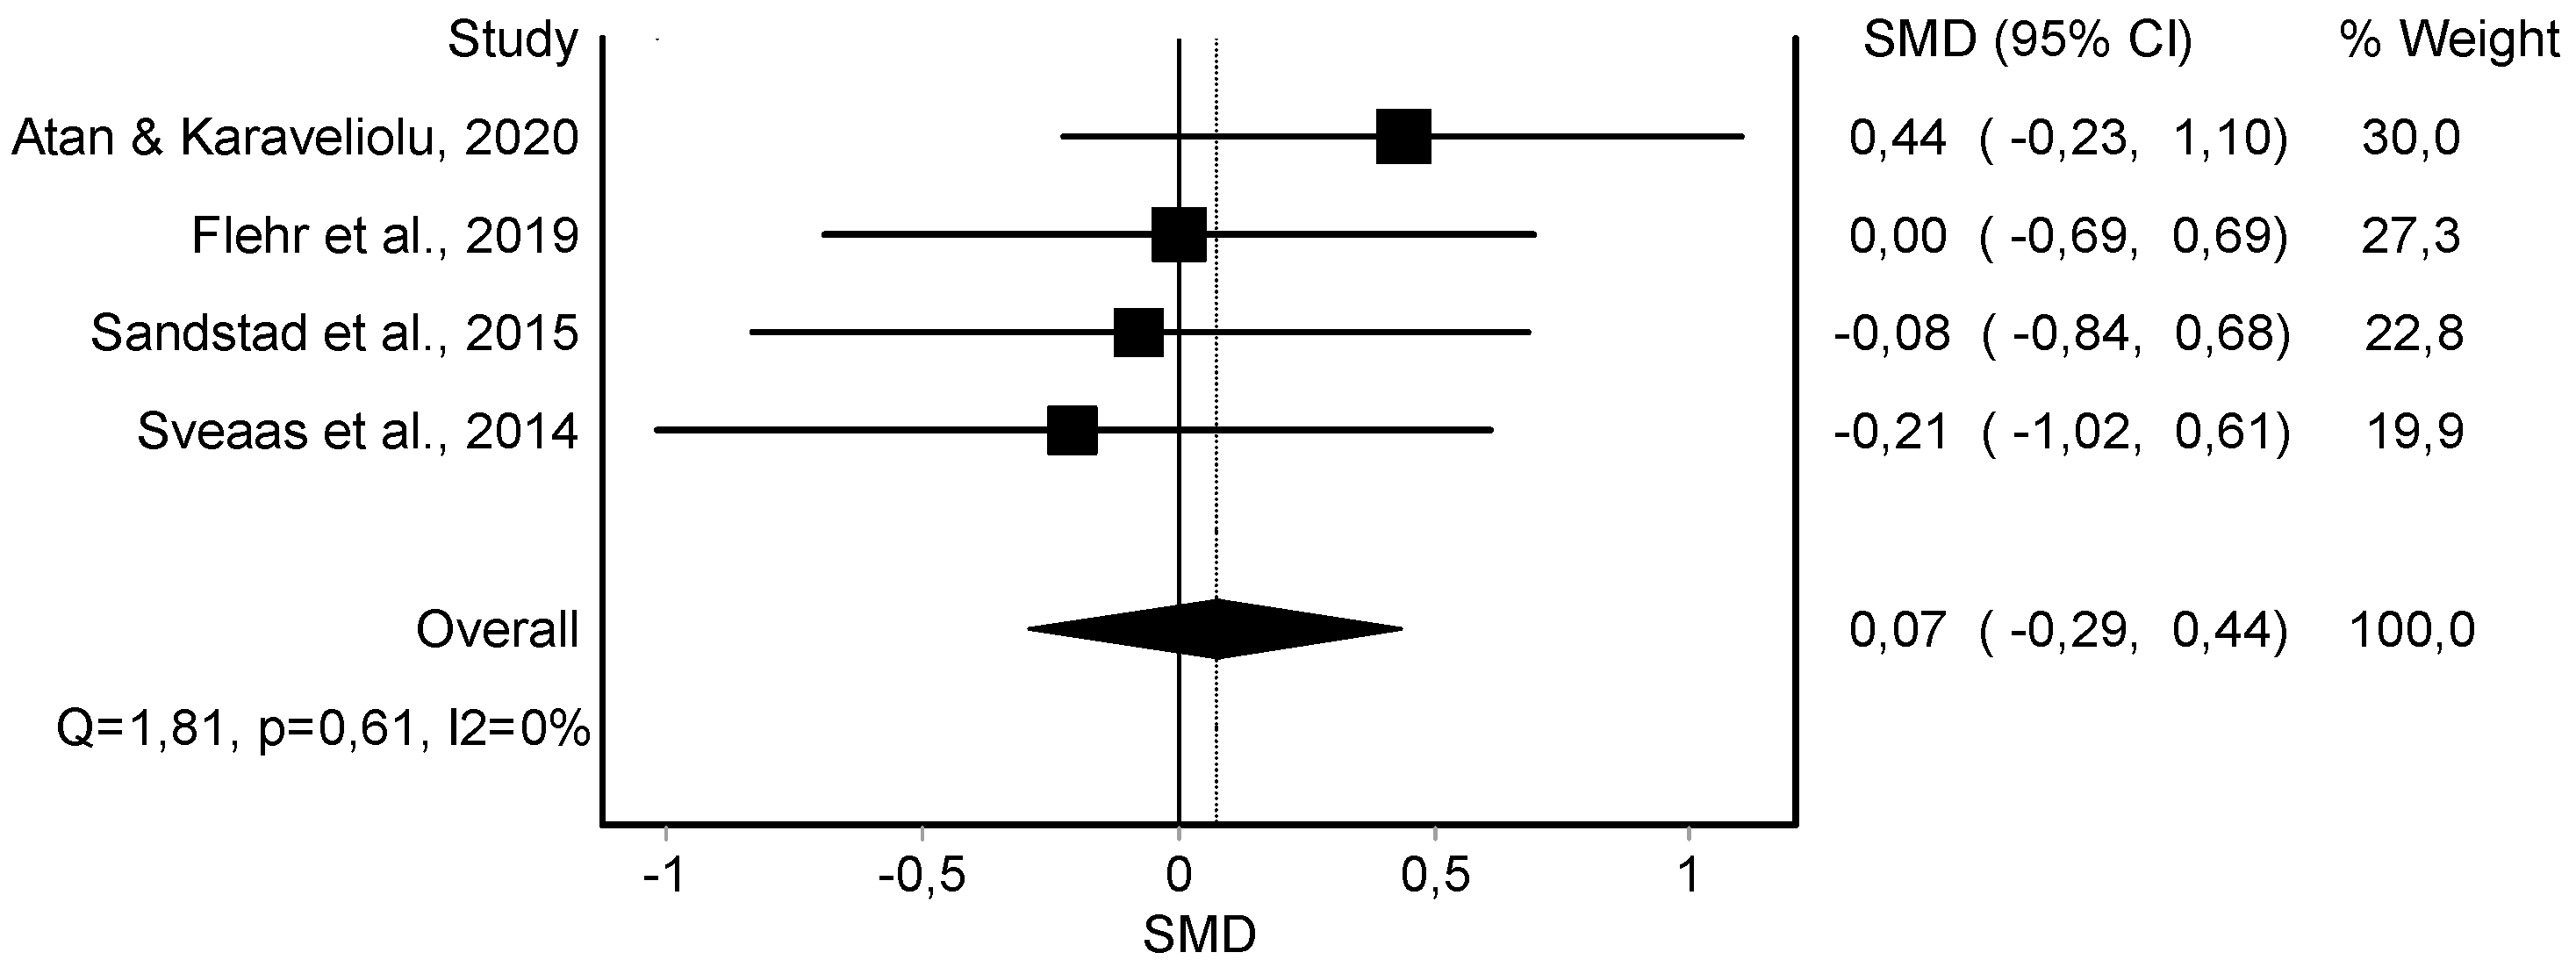
| Resting SBP (4) | RCT and rCOT | Not serious | Serious | Serious | Not serious | 56 | 63 | - | 0.07 (−0.29, 0.44) | ||
| Body Weight (4) | RCT and rCOT | Not serious | Serious | Serious | Serious | 89 | 94 | - | −0.34 (−0.80, 0.12) | ||
| Body Fat (4) | RCT and rCOT | Not serious | Serious | Serious | Serious | 71 | 77 | - | −0.24 (−0.57, 0.08) | ||
| Muscle Mass (3) | RCT and rCOT | Not Serious | Serious | Serious | Not serious | 61 | 63 | - | 0.04 (−0.32, 0.39) | ||
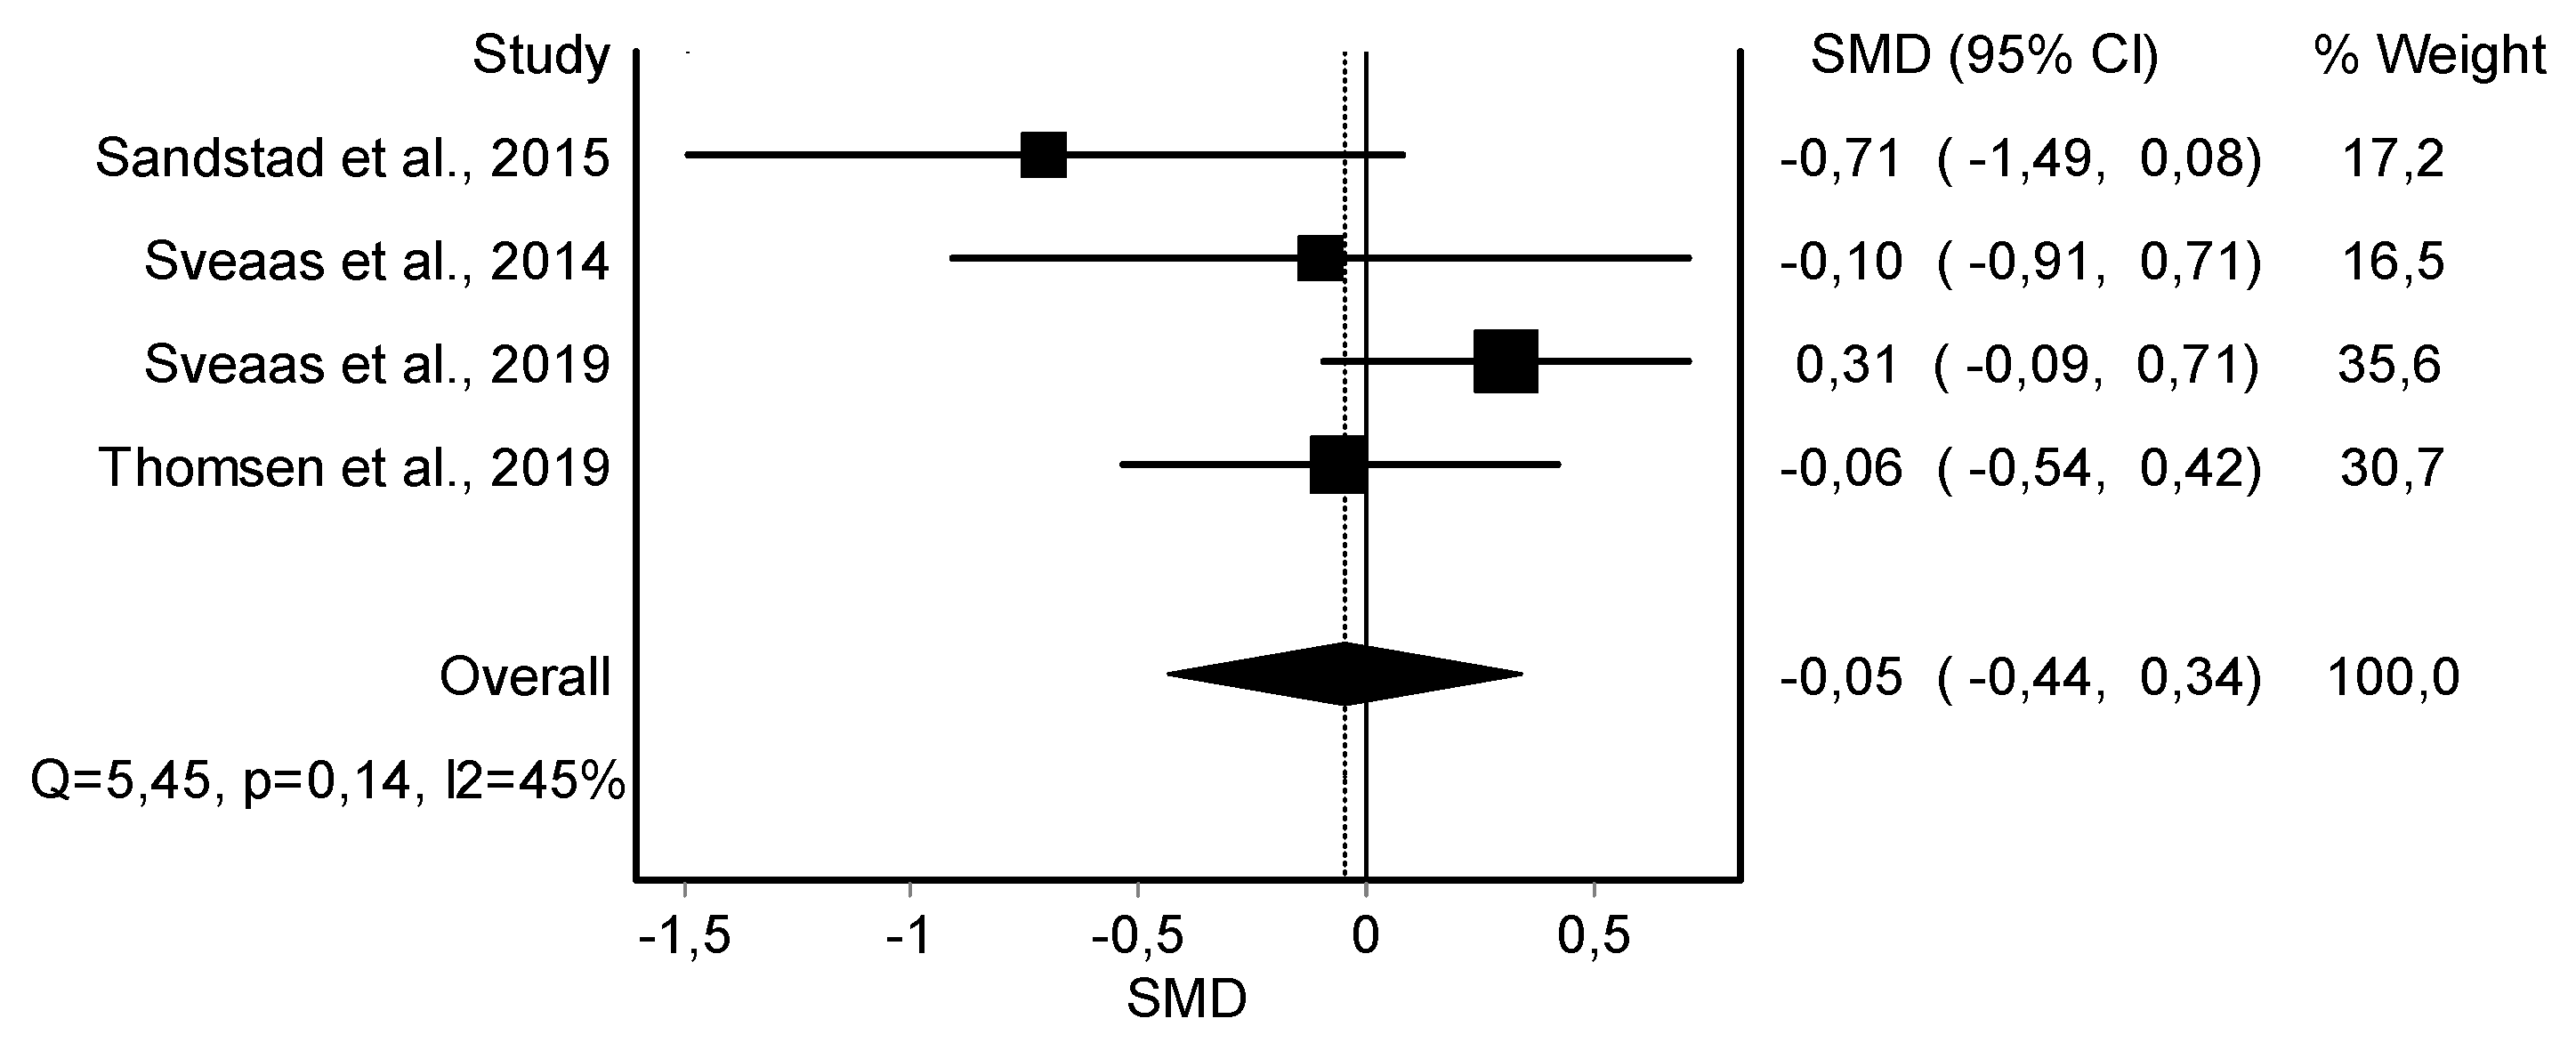
| C-Reactive Protein (4) | RCT and rCOT | Not serious | Serious | Serious | Not serious | 102 | 113 | - | −0.05 (−0.44, 0.34) | ||


References
- Briggs, A.M.; Woolf, A.D.; Dreinhöfer, K.; Homb, N.; Hoy, D.G.; Kopansky-Giles, D.; Åkesson, K.; March, L. Reducing the global burden of musculoskeletal conditions. Bull. World Health Organ. 2018, 96, 366. [Google Scholar] [CrossRef] [PubMed]
- Woolf, A.; Pfleger, B. Burden of major musculoskeletal conditions. Bull. World Health Organ. 2003, 81, 646–656. [Google Scholar]
- Andreato, L.V. High-Intensity Interval Training: Methodological Considerations for Interpreting Results and Conducting Research. Trends Endocrinol. Metab. 2020, 31, 812–817. [Google Scholar] [CrossRef] [PubMed]
- Wang, K.; Zhu, Y.; Wong, S.H.; Chen, Y.; Siu, P.M.; Baker, J.S.; Sun, F. Effects and dose-response relationship of high-intensity interval training on cardiorespiratory fitness in overweight and obese adults: A systematic review and meta-analysis. J. Sports Sci. 2021, 39, 2829–2846. [Google Scholar] [CrossRef]
- Zhu, L.; Liu, J.; Yu, Y.; Tian, Z. Effect of high-intensity interval training on cardiometabolic risk factors in childhood obesity: A meta-analysis. J. Sports Med. Phys. Fit. 2021, 61, 743–752. [Google Scholar] [CrossRef] [PubMed]
- Santos, I.; Nunes, F.; Queiros, V.; Cobucci, R.; Dantas, P.; Soares, G.; Cabral, B.; Maranhão, T.; Dantas, P. Effect of high-intensity interval training on metabolic parameters in women with polycystic ovary syndrome: A systematic review and meta-analysis of randomized controlled trials. PLoS ONE 2021, 16, e0245023. [Google Scholar] [CrossRef]
- Palma, S.; Hasenoehrl, T.; Jordakieva, G.; Ramazanova, D.; Crevenna, R. High-intensity interval training in the prehabilitation of cancer patients—A systematic review and meta-analysis. Support. Care Cancer 2021, 29, 1781–1794. [Google Scholar] [CrossRef] [PubMed]
- Batacan, R.B.; Duncan, M.J.; Dalbo, V.J.; Tucker, P.S.; Fenning, A.S. Effects of high-intensity interval training on cardiometabolic health: A systematic review and meta-analysis of intervention studies. Br. J. Sports Med. 2017, 51, 494–503. [Google Scholar] [CrossRef]
- Mugele, H.; Freitag, N.; Wilhelmi, J.; Yang, Y.; Cheng, S.; Bloch, W.; Schumann, M. High-intensity interval training in the therapy and aftercare of cancer patients: A systematic review with meta-analysis. J. Cancer Surviv. 2019, 13, 205–223. [Google Scholar] [CrossRef]
- Weston, K.S.; Wisløff, U.; Coombes, J.S. High-intensity interval training in patients with lifestyle-induced cardiometabolic disease: A systematic review and meta-analysis. Br. J. Sports Med. 2014, 48, 1227–1234. [Google Scholar] [CrossRef]
- Wu, Z.; Wang, Z.; Gao, H.; Zhou, X.; Li, F. Impact of high-intensity interval training on cardiorespiratory fitness, body composition, physical fitness, and metabolic parameters in older adults: A meta-analysis of randomized controlled trials. Exp. Gerontol. 2021, 150, 111345. [Google Scholar] [CrossRef] [PubMed]
- Page, M.J.; McKenzie, J.E.; Bossuyt, P.M.; Boutron, I.; Hoffmann, T.C.; Mulrow, C.D.; Shamseer, L.; Tetzlaff, J.M.; Akl, E.A.; Brennan, S.E.; et al. The PRISMA 2020 statement: An updated guideline for reporting systematic reviews. BMJ 2021, 372, n71. [Google Scholar] [CrossRef]
- Stone, P.W. Popping the (PICO) question in research and evidence-based practice. Appl. Nurs. Res. 2002, 15, 197–198. [Google Scholar] [CrossRef]
- Terwee, C.B.; Jansma, E.P.; Riphagen, I.I.; de Vet, H.C.W. Development of a methodological PubMed search filter for finding studies on measurement properties of measurement instruments. Qual. Life Res. 2009, 18, 1115–1123. [Google Scholar] [CrossRef] [PubMed] [Green Version]
- Shariff, S.Z.; Bejaimal, S.A.; Sontrop, J.M.; Iansavichus, A.V.; Haynes, R.B.; Weir, M.A.; Garg, A.X. Retrieving clinical evidence: A comparison of PubMed and Google Scholar for quick clinical searches. J. Med. Internet Res. 2013, 15, e164. [Google Scholar] [CrossRef] [PubMed]
- Haddaway, N.R.; Collins, A.M.; Coughlin, D.; Kirk, S. The Role of Google Scholar in Evidence Reviews and Its Applicability to Grey Literature Searching. PLoS ONE 2015, 10, e0138237. [Google Scholar] [CrossRef] [PubMed] [Green Version]
- Moher, D.; Pham, B.; Jones, A.; Cook, D.J.; Jadad, A.R.; Moher, M.; Tugwell, P.; Klassen, T.P. Does quality of reports of randomised trials affect estimates of intervention efficacy reported in meta-analyses? Lancet 1998, 352, 609–613. [Google Scholar] [CrossRef]
- Ouzzani, M.; Hammady, H.; Fedorowicz, Z.; Elmagarmid, A. Rayyan—A web and mobile app for systematic reviews. Syst. Rev. 2016, 5, 210. [Google Scholar] [CrossRef] [PubMed] [Green Version]
- Furlan, A.D.; Pennick, V.; Bombardier, C.; van Tulder, M. 2009 updated method guidelines for systematic reviews in the Cochrane Back Review Group. Spine 2009, 34, 1929–1941. [Google Scholar] [CrossRef]
- Higgins, J.; Green, S. Cochrane Handbook for Systematic Reviews of Interventions Version 5.1.0[M]; Wiley-Blackwell: Hoboken, NJ, USA, 2008. [Google Scholar]
- Sterne, J.A.C.; Savović, J.; Page, M.J.; Elbers, R.G.; Blencowe, N.S.; Boutron, I.; Cates, C.J.; Cheng, H.-Y.; Corbett, M.S.; Eldridge, S.M.; et al. RoB 2: A revised tool for assessing risk of bias in randomised trials. BMJ 2019, 366, l4898. [Google Scholar] [CrossRef] [Green Version]
- Higgins, J.P.; Li, T.; Sterne, J. Revised Cochrane Risk of Bias Tool for Randomized Trials (RoB 2): Additional Considerations for Crossover Trials. Cochrane Methods. 2021. Available online: https://researchportal.port.ac.uk/en/publications/revised-cochrane-risk-of-bias-tool-for-randomized-trials-rob-20-a (accessed on 26 October 2022).
- Landis, J.R.; Koch, G.G. An Application of Hierarchical Kappa-type Statistics in the Assessment of Majority Agreement among Multiple Observers. Biometrics 1977, 33, 363. [Google Scholar] [CrossRef] [PubMed]
- de Morton, N.A. The PEDro scale is a valid measure of the methodological quality of clinical trials: A demographic study. Aust. J. Physiother. 2009, 55, 129–133. [Google Scholar] [CrossRef] [PubMed] [Green Version]
- Hariohm, K.; Prakash, V.; Saravankumar, J. Quantity and quality of randomized controlled trials published by Indian physiotherapists. Perspect. Clin. Res. 2015, 6, 91. [Google Scholar] [CrossRef] [PubMed]
- Guyatt, G.H.; Oxman, A.D.; Vist, G.E.; Kunz, R.; Falck-Ytter, Y.; Alonso-Coello, P.; Schünemann, H.J. GRADE: An emerging consensus on rating quality of evidence and strength of recommendations. BMJ 2008, 336, 924–926. [Google Scholar] [CrossRef] [Green Version]
- Andrews, J.; Guyatt, G.; Oxman, A.D.; Alderson, P.; Dahm, P.; Falck-Ytter, Y.; Nasser, M.; Meerpohl, J.; Post, P.N.; Kunz, R.; et al. GRADE guidelines: 14. Going from evidence to recommendations: The significance and presentation of recommendations. J. Clin. Epidemiol. 2013, 66, 719–725. [Google Scholar] [CrossRef] [PubMed]
- Balshem, H.; Helfand, M.; Schünemann, H.J.; Oxman, A.D.; Kunz, R.; Brozek, J.; Vist, G.E.; Falck-Ytter, Y.; Meerpohl, J.; Norris, S.; et al. GRADE guidelines: 3. Rating the quality of evidence. J. Clin. Epidemiol. 2011, 64, 401–406. [Google Scholar] [CrossRef]
- Sanabria, A.J.; Rigau, D.; Rotaeche, R.; Selva, A.; Marzo-Castillejo, M.; Alonso-Coello, P. GRADE: Methodology for formulating and grading recommendations in clinical practice. Aten. Primaria 2015, 47, 48–55. [Google Scholar] [CrossRef] [PubMed] [Green Version]
- Barendregt, J.J.; Doi, S.A. MetaXL User Guide Version 5.3; EpiGear International Pty Ltd.: Brisbane, Australia, 2016. [Google Scholar]
- Hedges, L. Estimation of effect size from a series of independent experiments. Psychol. Bull. 1982, 92, 490. [Google Scholar] [CrossRef]
- Wan, X.; Wang, W.; Liu, J.; Tong, T. Estimating the sample mean and standard deviation from the sample size, median, range and/or interquartile range. BMC Med. Res. Methodol. 2014, 14, 135. [Google Scholar] [CrossRef] [PubMed] [Green Version]
- Higgins, J.P.; Li, T.; Deeks, J.J. 6.5. 2.3: Obtaining standard deviations from standard errors, confidence intervals, t statistics and p values for differences in means. In Cochrane Handbook for Systematic Reviews of Interventions; John Wiley & Sons, Ltd.: Hoboken, NJ, USA, 2008. [Google Scholar]
- Hopkins, W.G.; Marshall, S.W.; Batterham, A.M.; Hanin, J. Progressive statistics for studies in sports medicine and exercise science. Med. Sci. Sports Exerc. 2009, 41, 3–13. [Google Scholar] [CrossRef] [Green Version]
- Huedo-Medina, T.B.; Sánchez-Meca, J.; Marín-Martínez, F.; Botella, J. Assessing heterogeneity in meta-analysis: Q statistic or I2 index? Psychol. Methods 2006, 11, 193–206. [Google Scholar] [CrossRef] [PubMed]
- Doi, S.A. Rendering the Doi plot properly in meta-analysis. Int. J. Evid. Based. Healthc. 2018, 16, 242–243. [Google Scholar] [CrossRef]
- Furuya-Kanamori, L.; Barendregt, J.J.; Doi, S.A.R. A new improved graphical and quantitative method for detecting bias in meta-analysis. Int. J. Evid. Based. Healthc. 2018, 16, 195–203. [Google Scholar] [CrossRef]
- Atan, T.; Karavelioğlu, Y. Effectiveness of High-Intensity Interval Training vs Moderate-Intensity Continuous Training in Patients with Fibromyalgia: A Pilot Randomized Controlled Trial. Arch. Phys. Med. Rehabil. 2020, 101, 1865–1876. [Google Scholar] [CrossRef] [PubMed]
- Flehr, A.; Barton, C.; Coles, J.; Gibson, S.J.; Lambert, G.W.; Lambert, E.A.; Dhar, A.K.; Dixon, J.B. #MindinBody—Feasibility of vigorous exercise (Bikram yoga versus high intensity interval training) to improve persistent pain in women with a history of trauma: A pilot randomized control trial. BMC Complement. Altern. Med. 2019, 19, 234. [Google Scholar]
- Keogh, J.W.; Grigg, J.; Vertullo, C.J. Is high-intensity interval cycling feasible and more beneficial than continuous cycling for knee osteoarthritic patients? Results of a randomised control feasibility trial. PeerJ 2018, 6, e4738. [Google Scholar] [CrossRef] [PubMed] [Green Version]
- Sveaas, S.H.; Bilberg, A.; Berg, I.J.; Provan, S.A.; Rollefstad, S.; Semb, A.G.; Hagen, K.B.; Johansen, M.W.; Pedersen, E.; Dagfinrud, H. High intensity exercise for 3 months reduces disease activity in axial spondyloarthritis (axSpA): A multicentre randomised trial of 100 patients. Br. J. Sports Med. 2019, 54, 292–297. [Google Scholar] [CrossRef]
- Sveaas, S.H.; Berg, I.J.; Provan, S.A.; Semb, A.G.; Hagen, K.B.; Vøllestad, N.; Fongen, C.; Olsen, I.C.; Michelsen, A.; Ueland, T.; et al. Efficacy of high intensity exercise on disease activity and cardiovascular risk in active axial spondyloarthritis: A randomized controlled pilot study. PLoS ONE 2014, 9, e108688. [Google Scholar] [CrossRef] [Green Version]
- Thomsen, R.S.; Nilsen, T.I.L.; Haugeberg, G.; Bye, A.; Kavanaugh, A.; Hoff, M. Impact of High-Intensity Interval Training on Disease Activity and Disease in Patients with Psoriatic Arthritis: A Randomized Controlled Trial. Arthritis Care Res. 2019, 71, 530–537. [Google Scholar] [CrossRef]
- Thomsen, R.S.; Nilsen, T.I.L.; Haugeberg, G.; Bye, A.; Kavanaugh, A.; Hoff, M. Effect of high-intensity interval training on cardiovascular disease risk factors and body composition in psoriatic arthritis: A randomised controlled trial. RMD Open 2018, 4, e000729. [Google Scholar] [CrossRef] [Green Version]
- Sandstad, J.; Stensvold, D.; Hoff, M.; Nes, B.M.; Arbo, I.; Bye, A. The effects of high intensity interval training in women with rheumatic disease: A pilot study. Eur. J. Appl. Physiol. 2015, 115, 2081–2089. [Google Scholar] [CrossRef] [PubMed]
- Campbell, W.W.; Kraus, W.E.; Powell, K.E.; Haskell, W.L.; Janz, K.F.; Jakicic, J.M.; Troiano, R.P.; Sprow, K.; Torres, A.; Piercy, K.L.; et al. High-Intensity Interval Training for Cardiometabolic Disease Prevention. Med. Sci. Sports Exerc. 2019, 51, 1220. [Google Scholar] [CrossRef] [PubMed]
- Crozier, J.; Roig, M.; Eng, J.J.; MacKay-Lyons, M.; Fung, J.; Ploughman, M.; Bailey, D.M.; Sweet, S.N.; Giacomantonio, N.; Thiel, A.; et al. High-Intensity Interval Training After Stroke: An Opportunity to Promote Functional Recovery, Cardiovascular Health, and Neuroplasticity. Neurorehabilit. Neural Repair 2018, 32, 543–556. [Google Scholar] [CrossRef] [PubMed] [Green Version]
- Dun, Y.; Thomas, R.J.; Medina-Inojosa, J.R.; Squires, R.W.; Huang, H.; Smith, J.R.; Liu, S.; Olson, T.P. High-Intensity Interval Training in Cardiac Rehabilitation: Impact on Fat Mass in Patients with Myocardial Infarction. Mayo Clin. Proc. 2019, 94, 1718–1730. [Google Scholar] [CrossRef] [PubMed]
- Wewege, M.; van den Berg, R.; Ward, R.E.; Keech, A. The effects of high-intensity interval training vs. moderate-intensity continuous training on body composition in overweight and obese adults: A systematic review and meta-analysis. Obes. Rev. 2017, 18, 635–646. [Google Scholar] [CrossRef] [PubMed]
- Cuenca-Martínez, F.; Sempere-Rubio, N.; Varangot-Reille, C.; Fernández-Carnero, J.; Suso-Martí, L.; Alba-Quesada, P.; Touche, R. La Effects of High-Intensity Interval Training (HIIT) on Patients with Musculoskeletal Disorders: A Systematic Review and Meta-Analysis with a Meta-Regression and Mapping Report. Diagnostics 2022, 12, 2532. [Google Scholar] [CrossRef] [PubMed]
- Saxena, A.; Minton, D.; Lee, D.; Sui, X.; Fayad, R.; Lavie, C.J.; Blair, S.N. Protective role of resting heart rate on all-cause and cardiovascular disease mortality. Mayo Clin. Proc. 2013, 88, 1420–1426. [Google Scholar] [CrossRef] [PubMed] [Green Version]
- Gordan, R.; Gwathmey, J.K.; Xie, L.-H. Autonomic and endocrine control of cardiovascular function. World J. Cardiol. 2015, 7, 204. [Google Scholar] [CrossRef] [PubMed]
- Walsh, T.P.; Arnold, J.B.; Evans, A.M.; Yaxley, A.; Damarell, R.A.; Shanahan, E.M. The association between body fat and musculoskeletal pain: A systematic review and meta-analysis. BMC Musculoskelet. Disord. 2018, 19, 233. [Google Scholar] [CrossRef] [PubMed] [Green Version]
- Geneen, L.J.; Moore, R.A.; Clarke, C.; Martin, D.; Colvin, L.A.; Smith, B.H. Physical activity and exercise for chronic pain in adults: An overview of Cochrane Reviews. In Cochrane Database of Systematic Reviews; Geneen, L.J., Ed.; John Wiley & Sons, Ltd.: Chichester, UK, 2017; Volume 4, p. CD011279. [Google Scholar]
- Gurd, B.J.; Giles, M.D.; Bonafiglia, J.T.; Raleigh, J.P.; Boyd, J.C.; Ma, J.K.; Zelt, J.G.; Scribbans, T.D. Incidence of nonresponse and individual patterns of response following sprint interval training. Appl. Physiol. Nutr. Metab. 2016, 41, 229–234. [Google Scholar] [CrossRef] [PubMed]
- Jack, K.; McLean, S.M.; Moffett, J.K.; Gardiner, E. Barriers to treatment adherence in physiotherapy outpatient clinics: A systematic review. Man. Ther. 2010, 15, 220–228. [Google Scholar] [CrossRef] [PubMed]
- McPhail, S.M.; Schippers, M.; Marshall, A.L.; Waite, M.; Kuipers, P. Perceived barriers and facilitators to increasing physical activity among people with musculoskeletal disorders: A qualitative investigation to inform intervention development. Clin. Interv. Aging 2014, 9, 2113–2122. [Google Scholar] [CrossRef]
- Loew, L.; Brosseau, L.; Kenny, G.P.; Durand-Bush, N.; Poitras, S.; De Angelis, G.; Wells, G.A. An evidence-based walking program among older people with knee osteoarthritis: The PEP (participant exercise preference) pilot randomized controlled trial. Clin. Rheumatol. 2017, 36, 1607–1616. [Google Scholar] [CrossRef] [PubMed]
- Wellsandt, E.; Golightly, Y. Exercise in the management of knee and hip osteoarthritis. Curr. Opin. Rheumatol. 2018, 30, 151–159. [Google Scholar] [CrossRef] [PubMed]


Publisher’s Note: MDPI stays neutral with regard to jurisdictional claims in published maps and institutional affiliations. |
© 2022 by the authors. Licensee MDPI, Basel, Switzerland. This article is an open access article distributed under the terms and conditions of the Creative Commons Attribution (CC BY) license (https://creativecommons.org/licenses/by/4.0/).
Share and Cite
Casaña, J.; Varangot-Reille, C.; Calatayud, J.; Suso-Martí, L.; Sanchís-Sánchez, E.; Aiguadé, R.; López-Bueno, R.; Gargallo, P.; Cuenca-Martínez, F.; Blanco-Díaz, M. High-Intensity Interval Training (HIIT) on Biological and Body Composition Variables in Patients with Musculoskeletal Disorders: A Systematic Review and Meta-Analysis. J. Clin. Med. 2022, 11, 6937. https://doi.org/10.3390/jcm11236937
Casaña J, Varangot-Reille C, Calatayud J, Suso-Martí L, Sanchís-Sánchez E, Aiguadé R, López-Bueno R, Gargallo P, Cuenca-Martínez F, Blanco-Díaz M. High-Intensity Interval Training (HIIT) on Biological and Body Composition Variables in Patients with Musculoskeletal Disorders: A Systematic Review and Meta-Analysis. Journal of Clinical Medicine. 2022; 11(23):6937. https://doi.org/10.3390/jcm11236937
Chicago/Turabian StyleCasaña, José, Clovis Varangot-Reille, Joaquín Calatayud, Luis Suso-Martí, Enrique Sanchís-Sánchez, Ramón Aiguadé, Rubén López-Bueno, Pedro Gargallo, Ferran Cuenca-Martínez, and María Blanco-Díaz. 2022. "High-Intensity Interval Training (HIIT) on Biological and Body Composition Variables in Patients with Musculoskeletal Disorders: A Systematic Review and Meta-Analysis" Journal of Clinical Medicine 11, no. 23: 6937. https://doi.org/10.3390/jcm11236937