
Diagnostic Accuracy of Rapid Antigen Test Kits for Detecting SARS-CoV-2: A Systematic Review and Meta-Analysis of 17,171 Suspected COVID-19 Patients

 , ,
, , 
Abstract
:1. Introduction
2. Methods
2.1. Study Protocol and Guideline
2.2. Eligibility Criteria
2.3. Search Strategies
2.4. Study Selection
2.5. Data Extraction
2.6. Quality Assessment
2.7. Data Analyses
2.8. Subgroup and Sensitivity Analyses
3. Results
3.1. Study Selection
3.2. Characteristics of the Included Studies
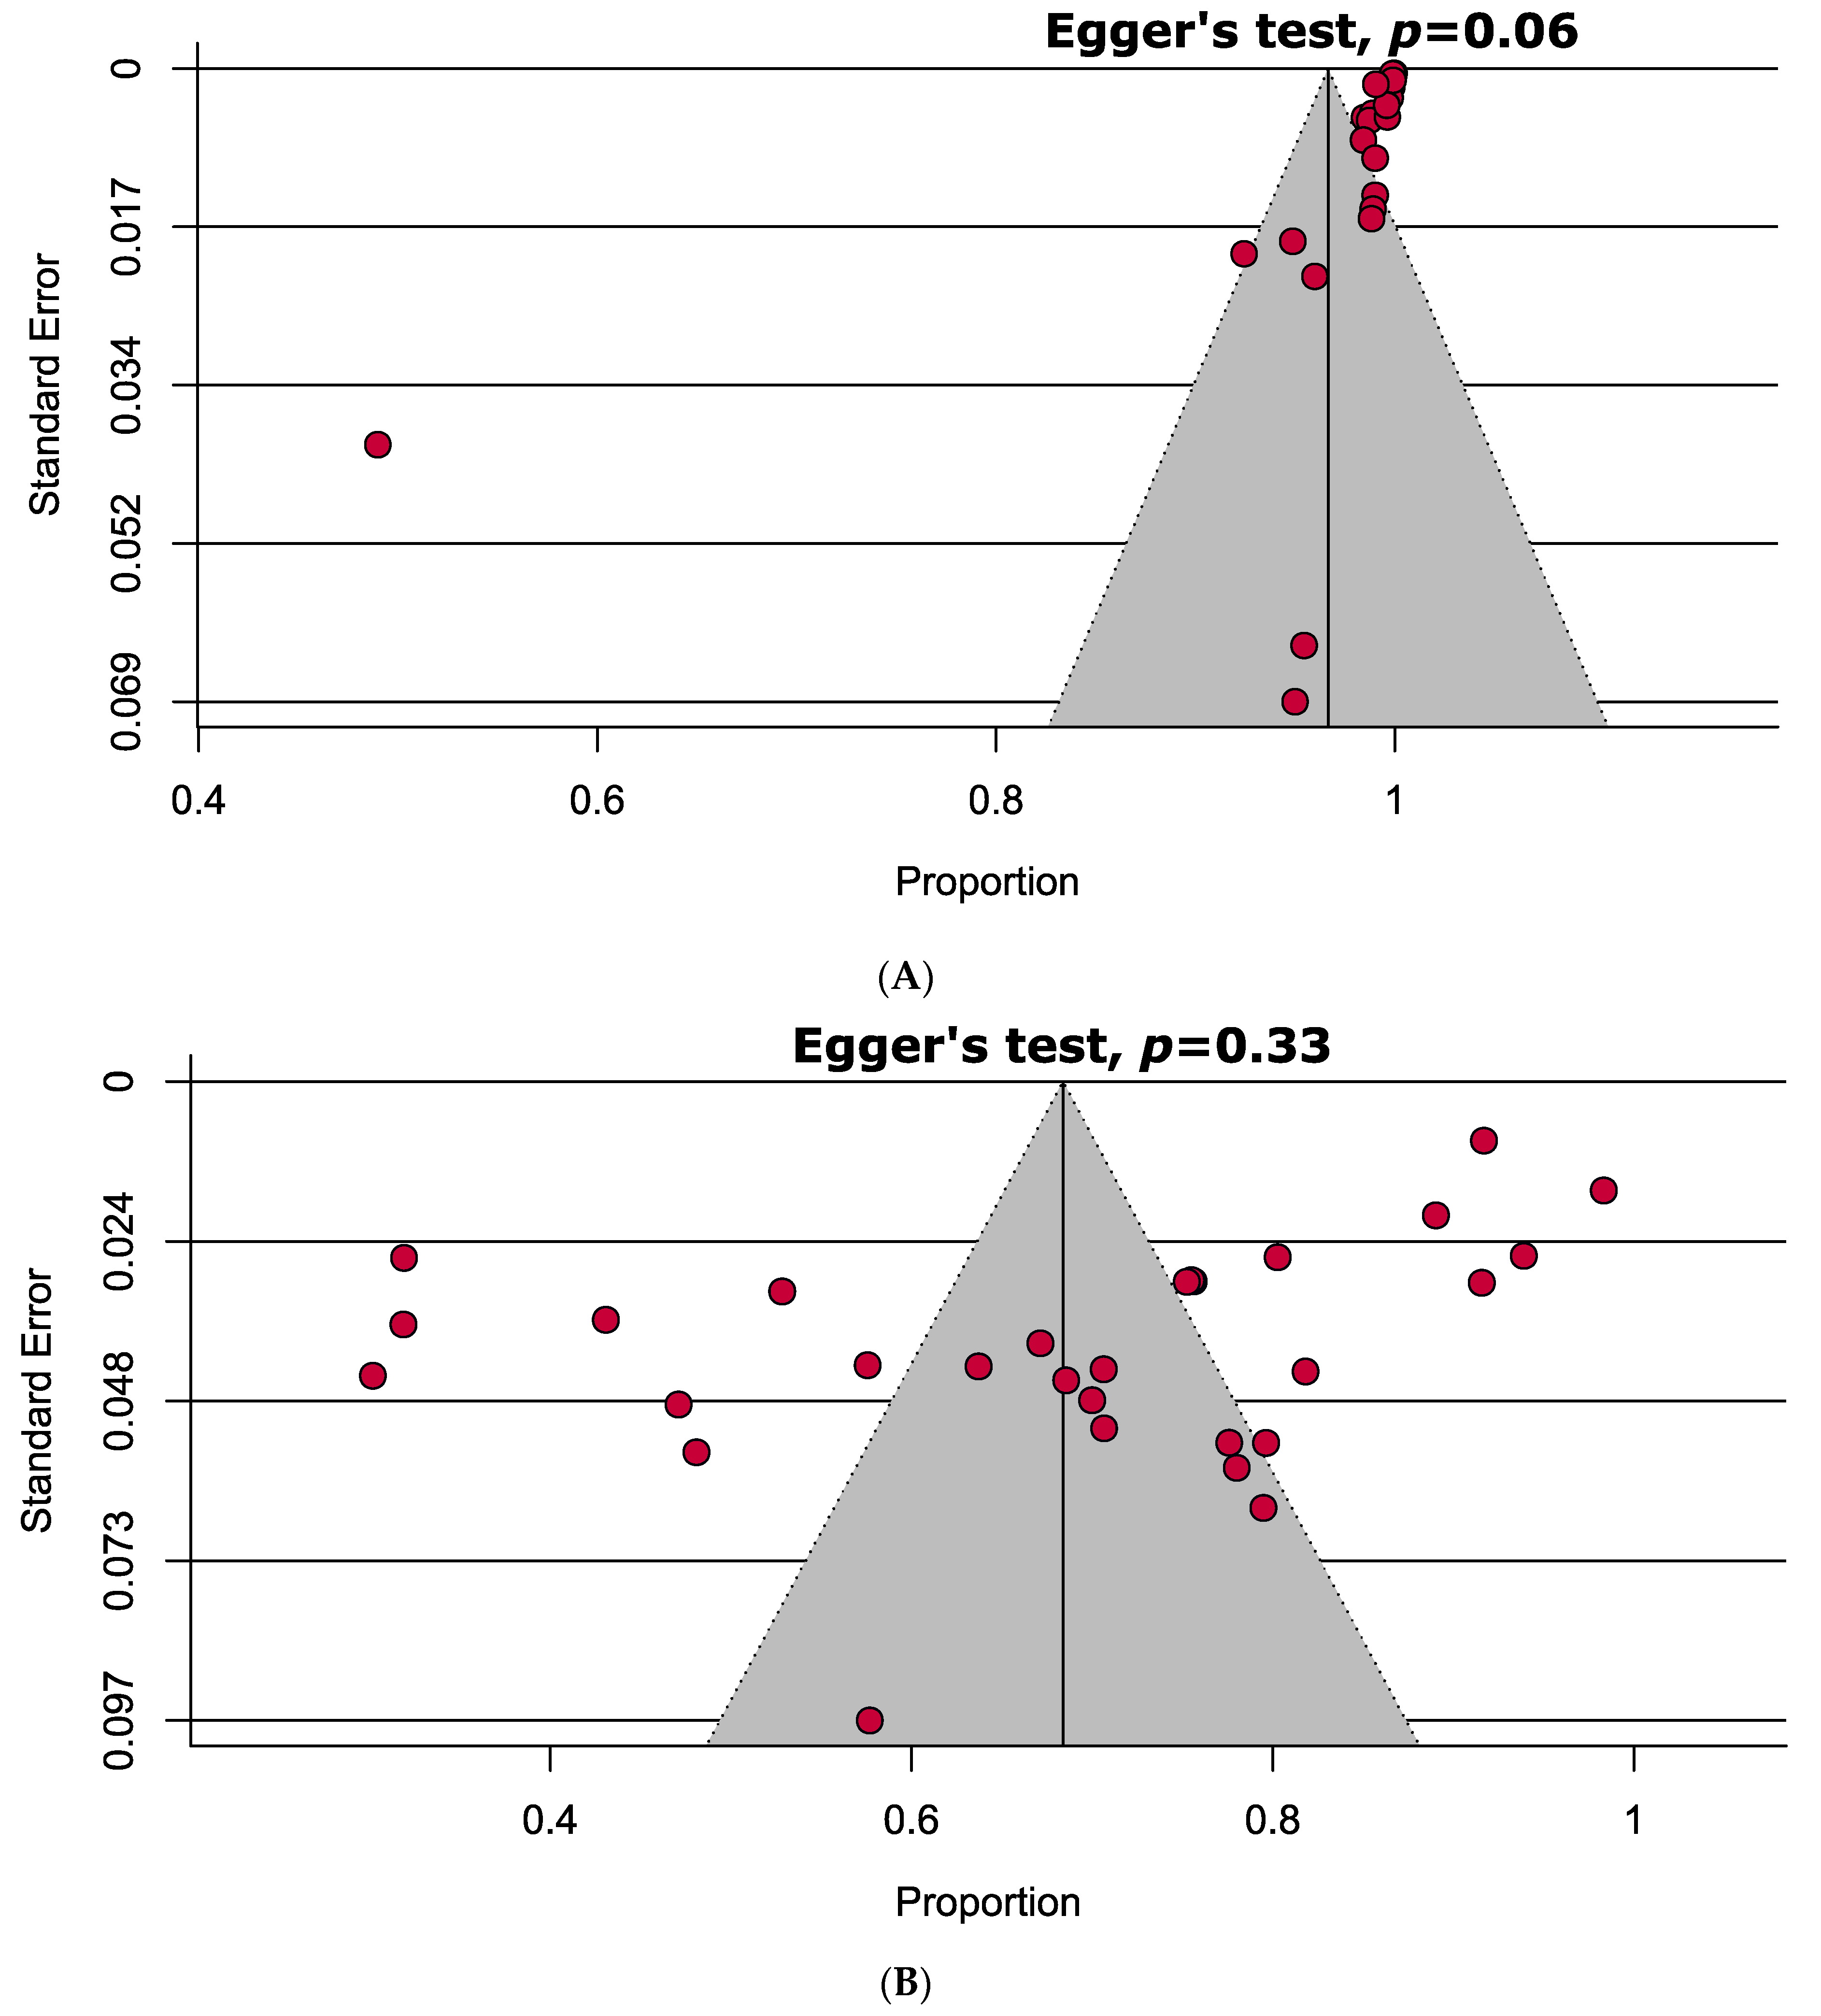
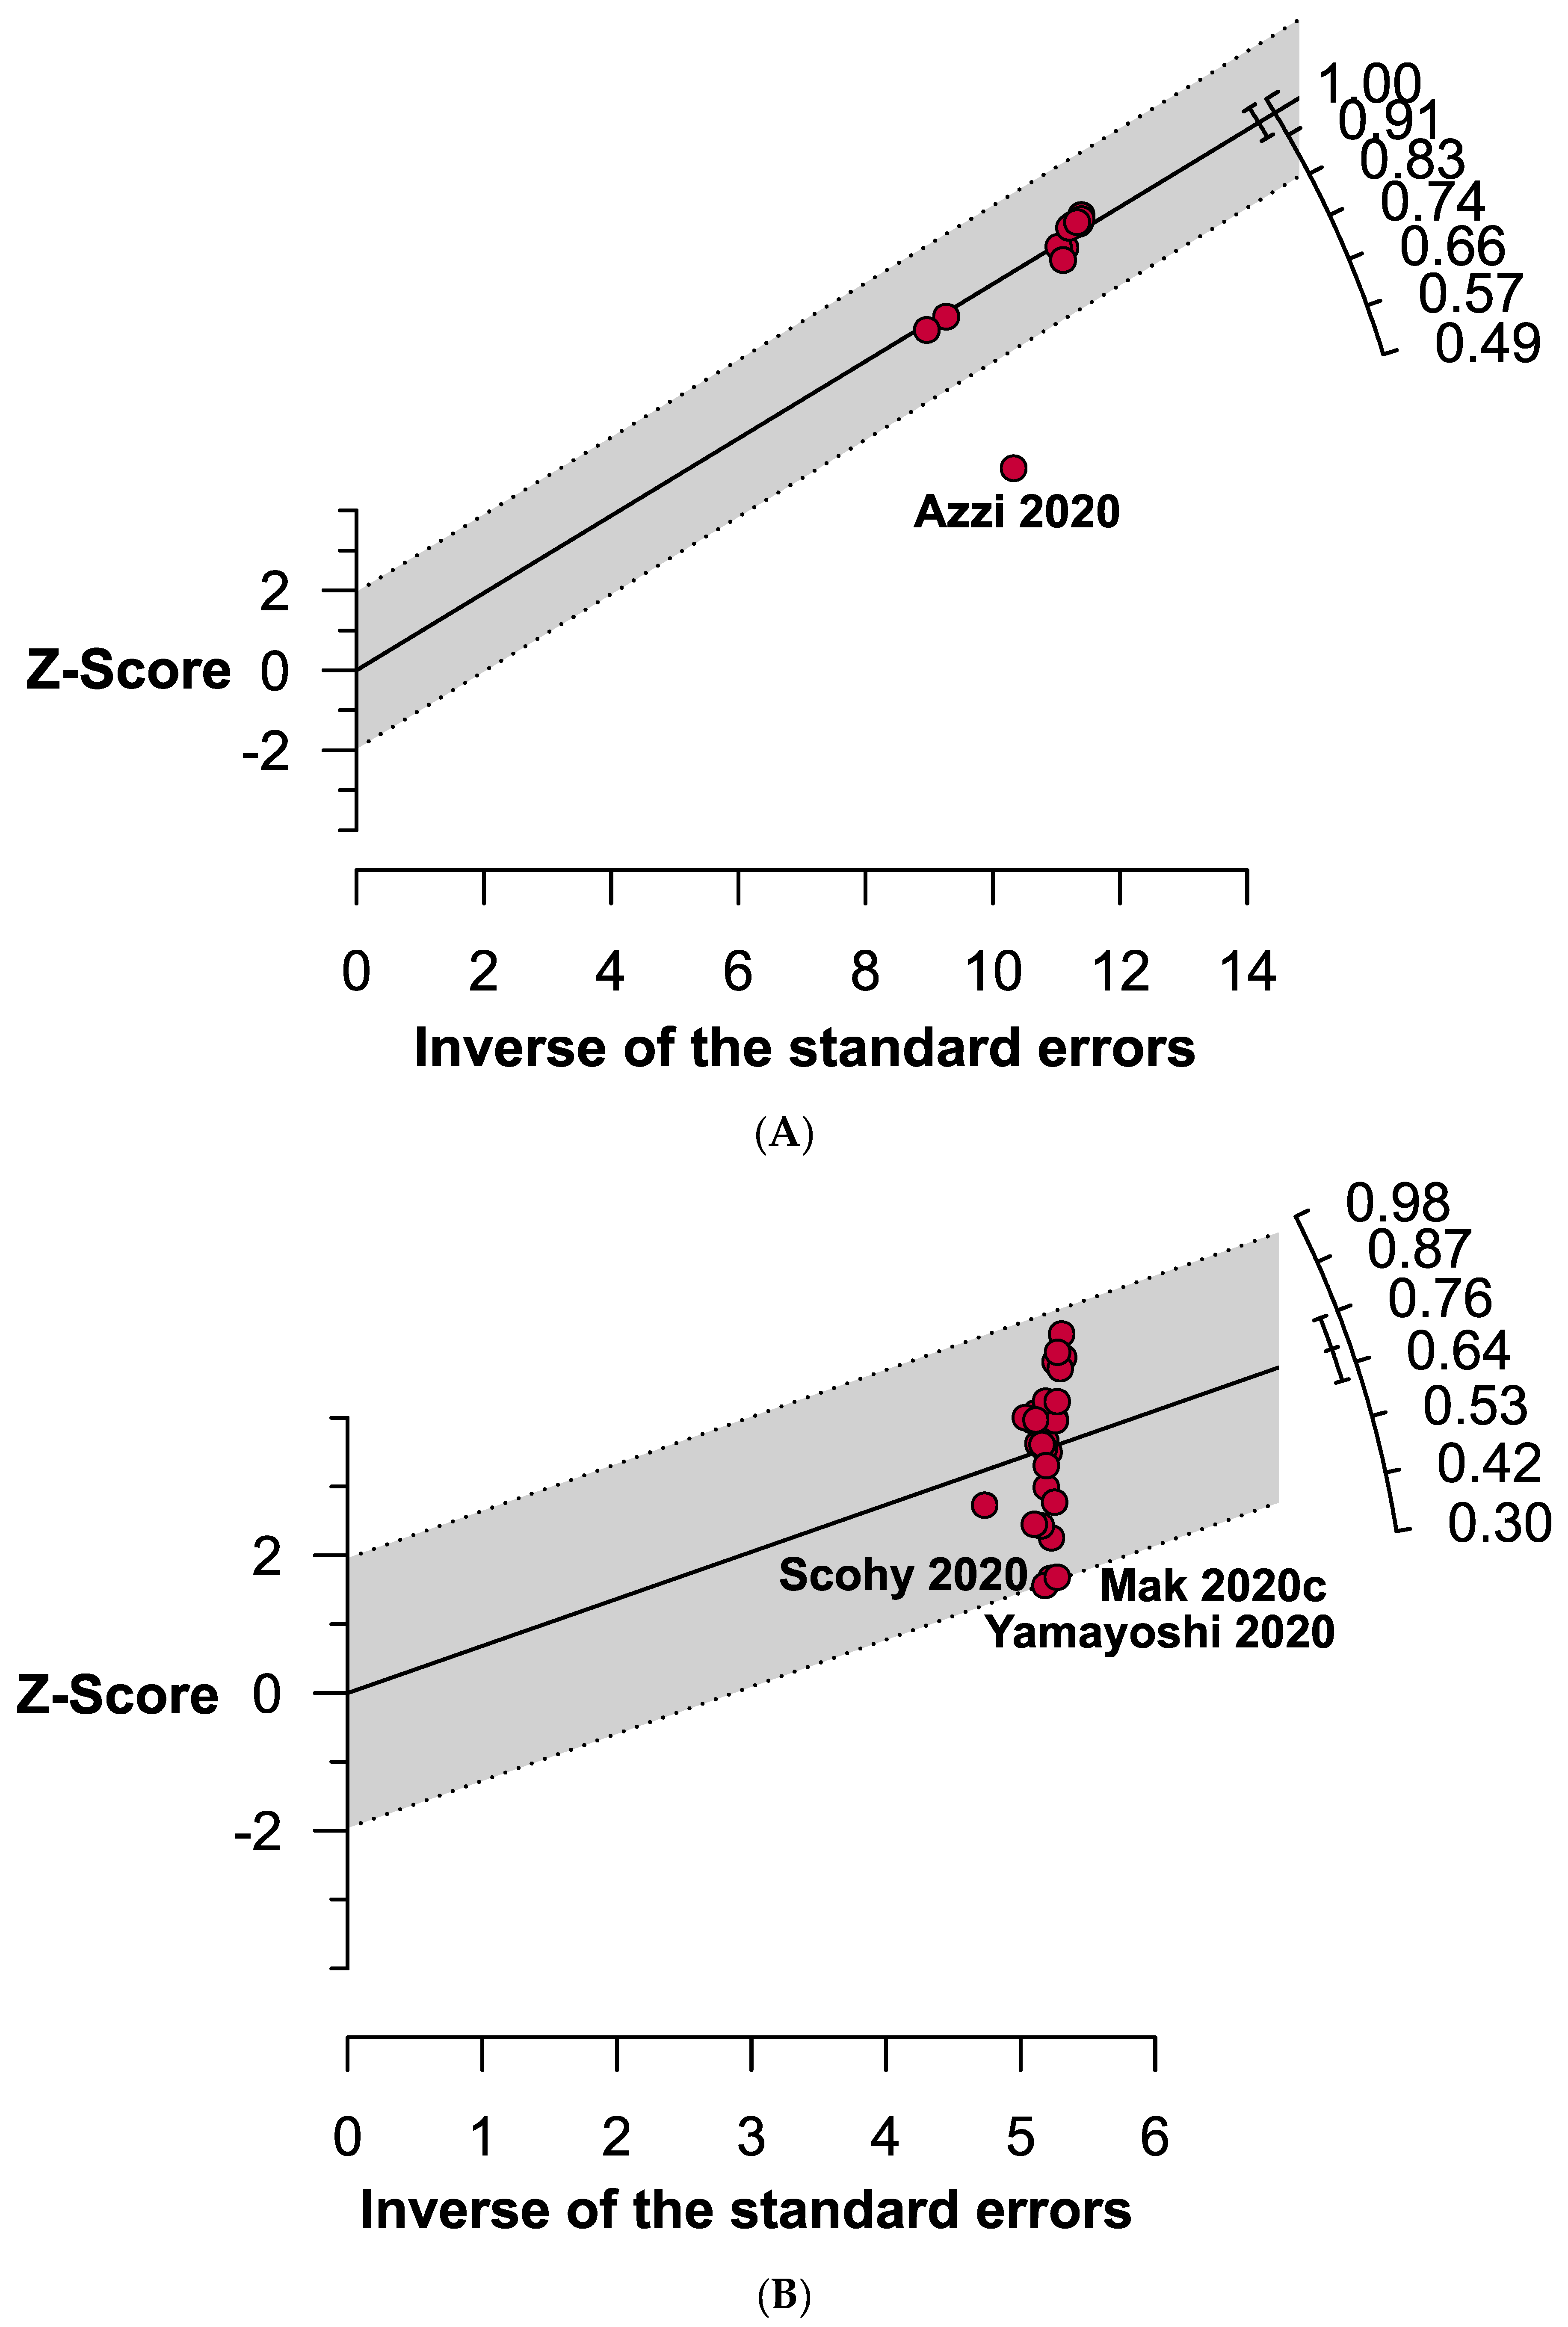
3.3. Quality Assessment and Publication Bias
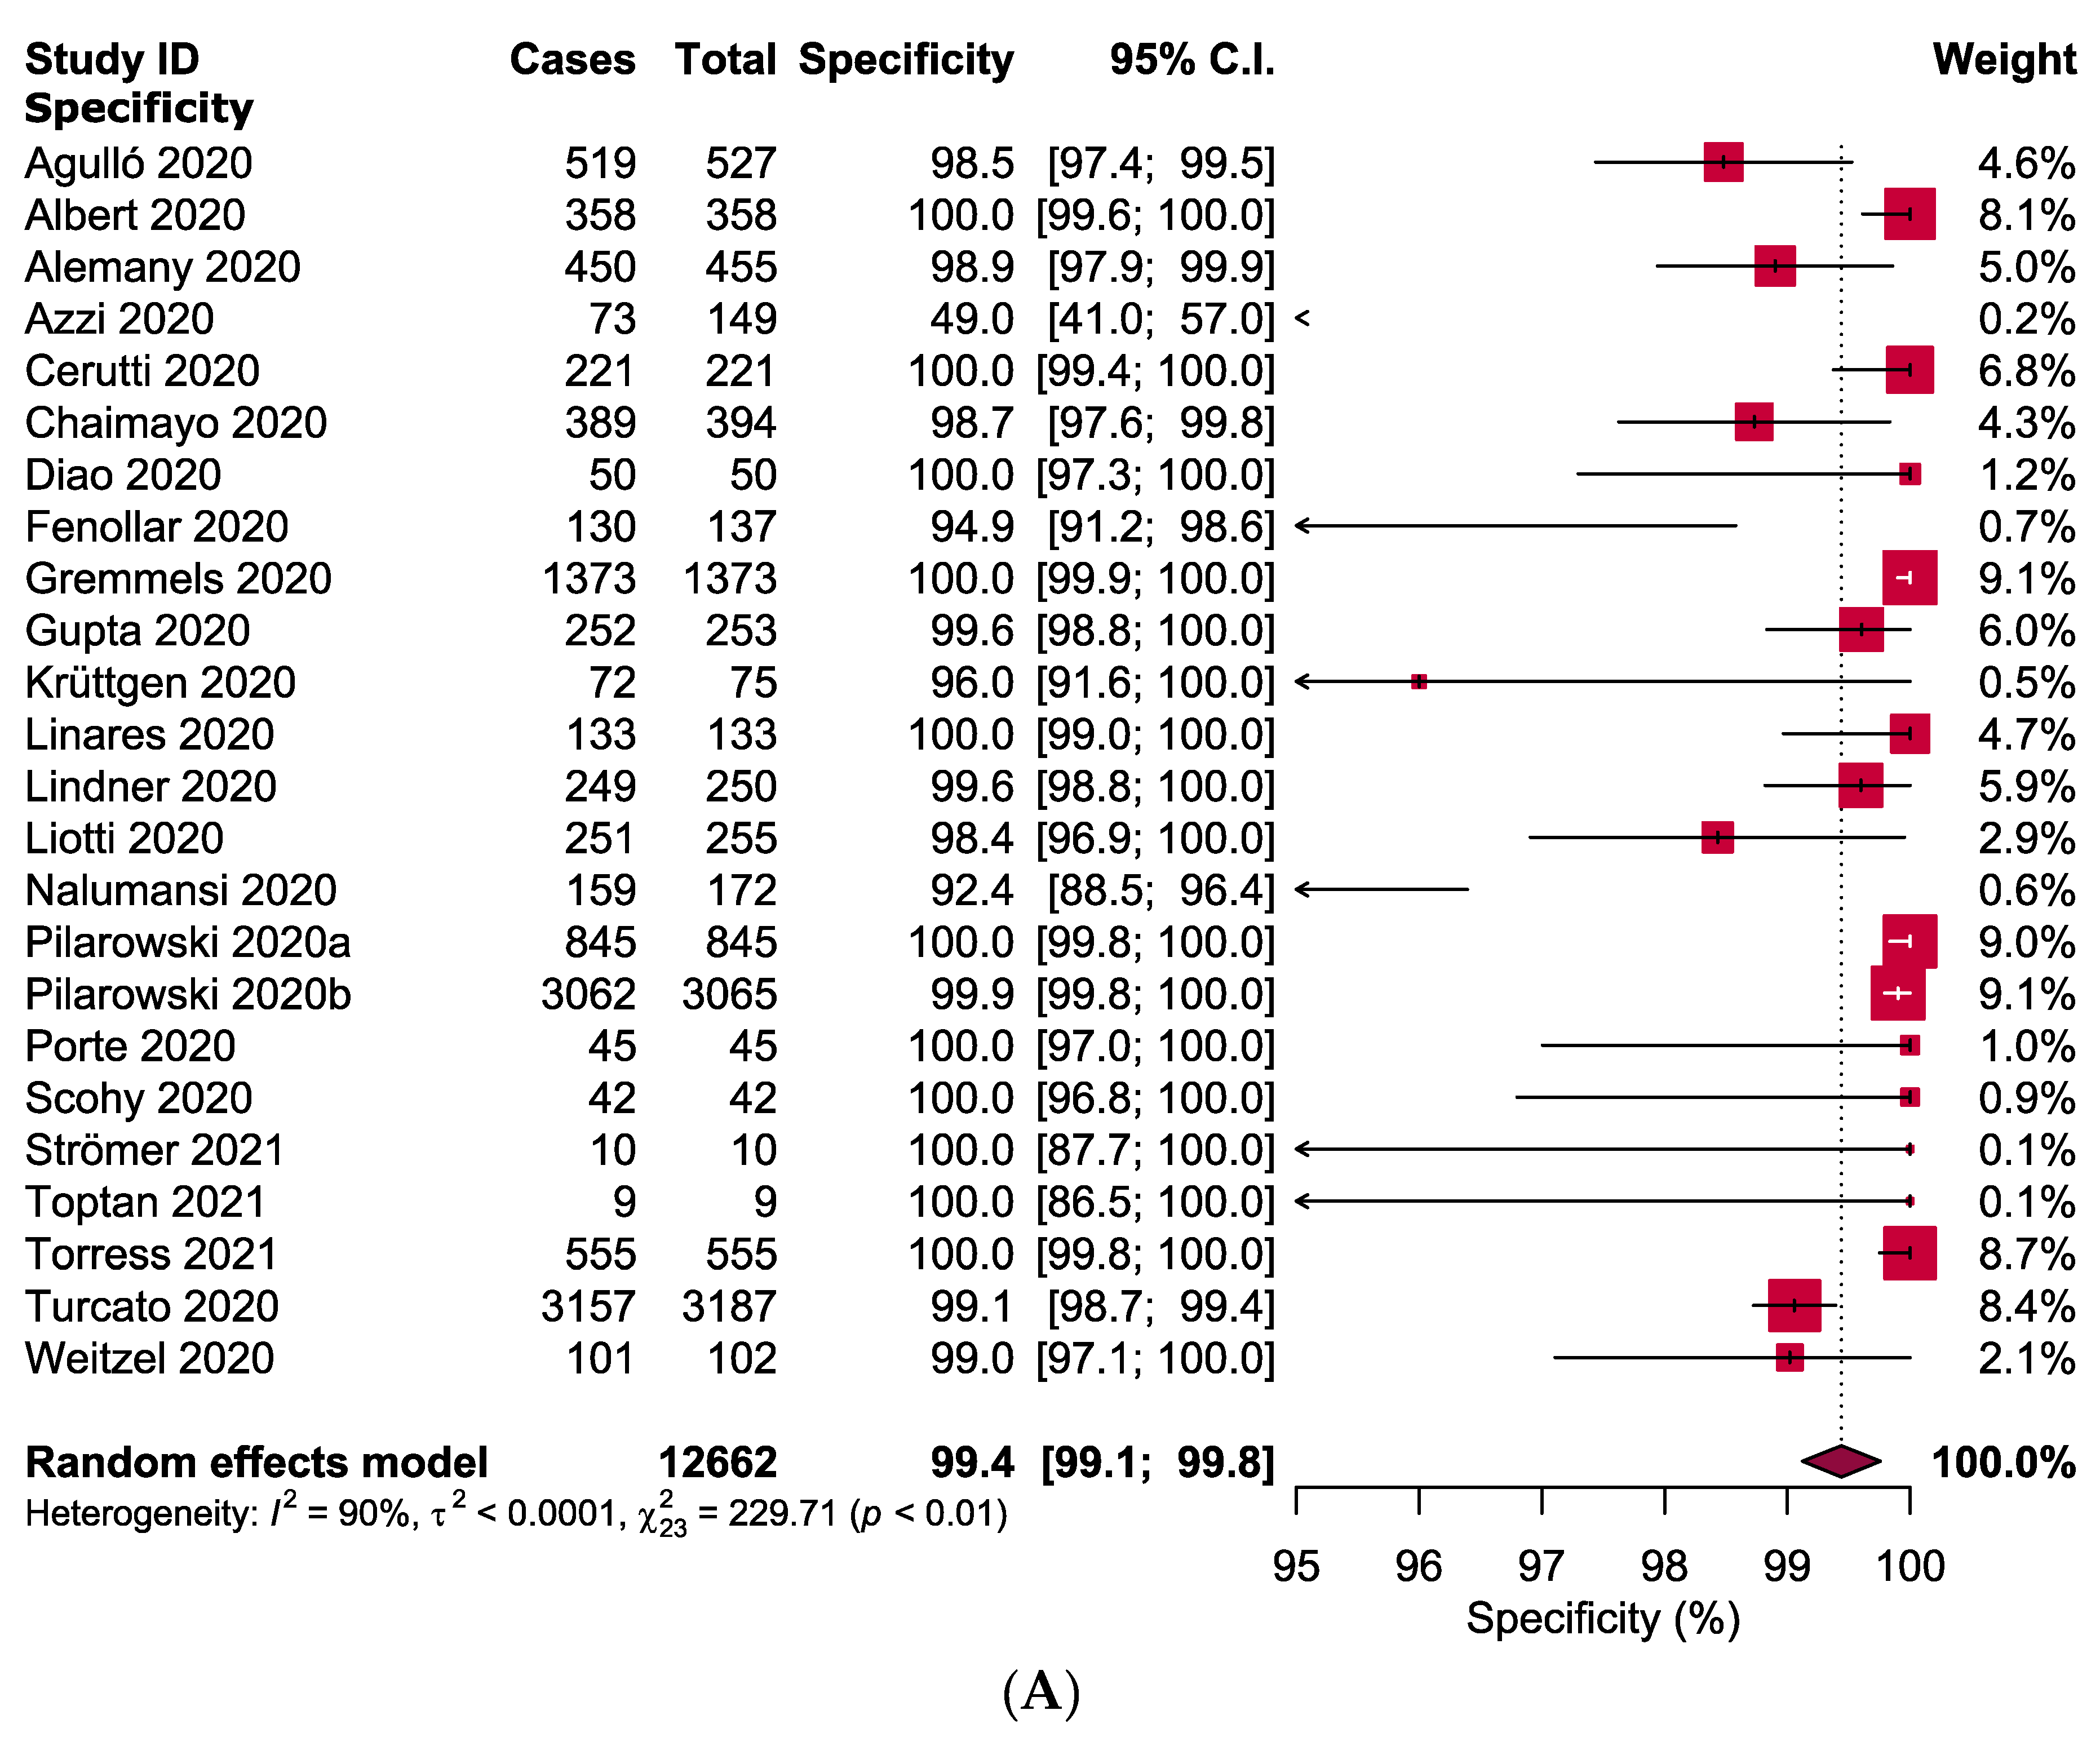
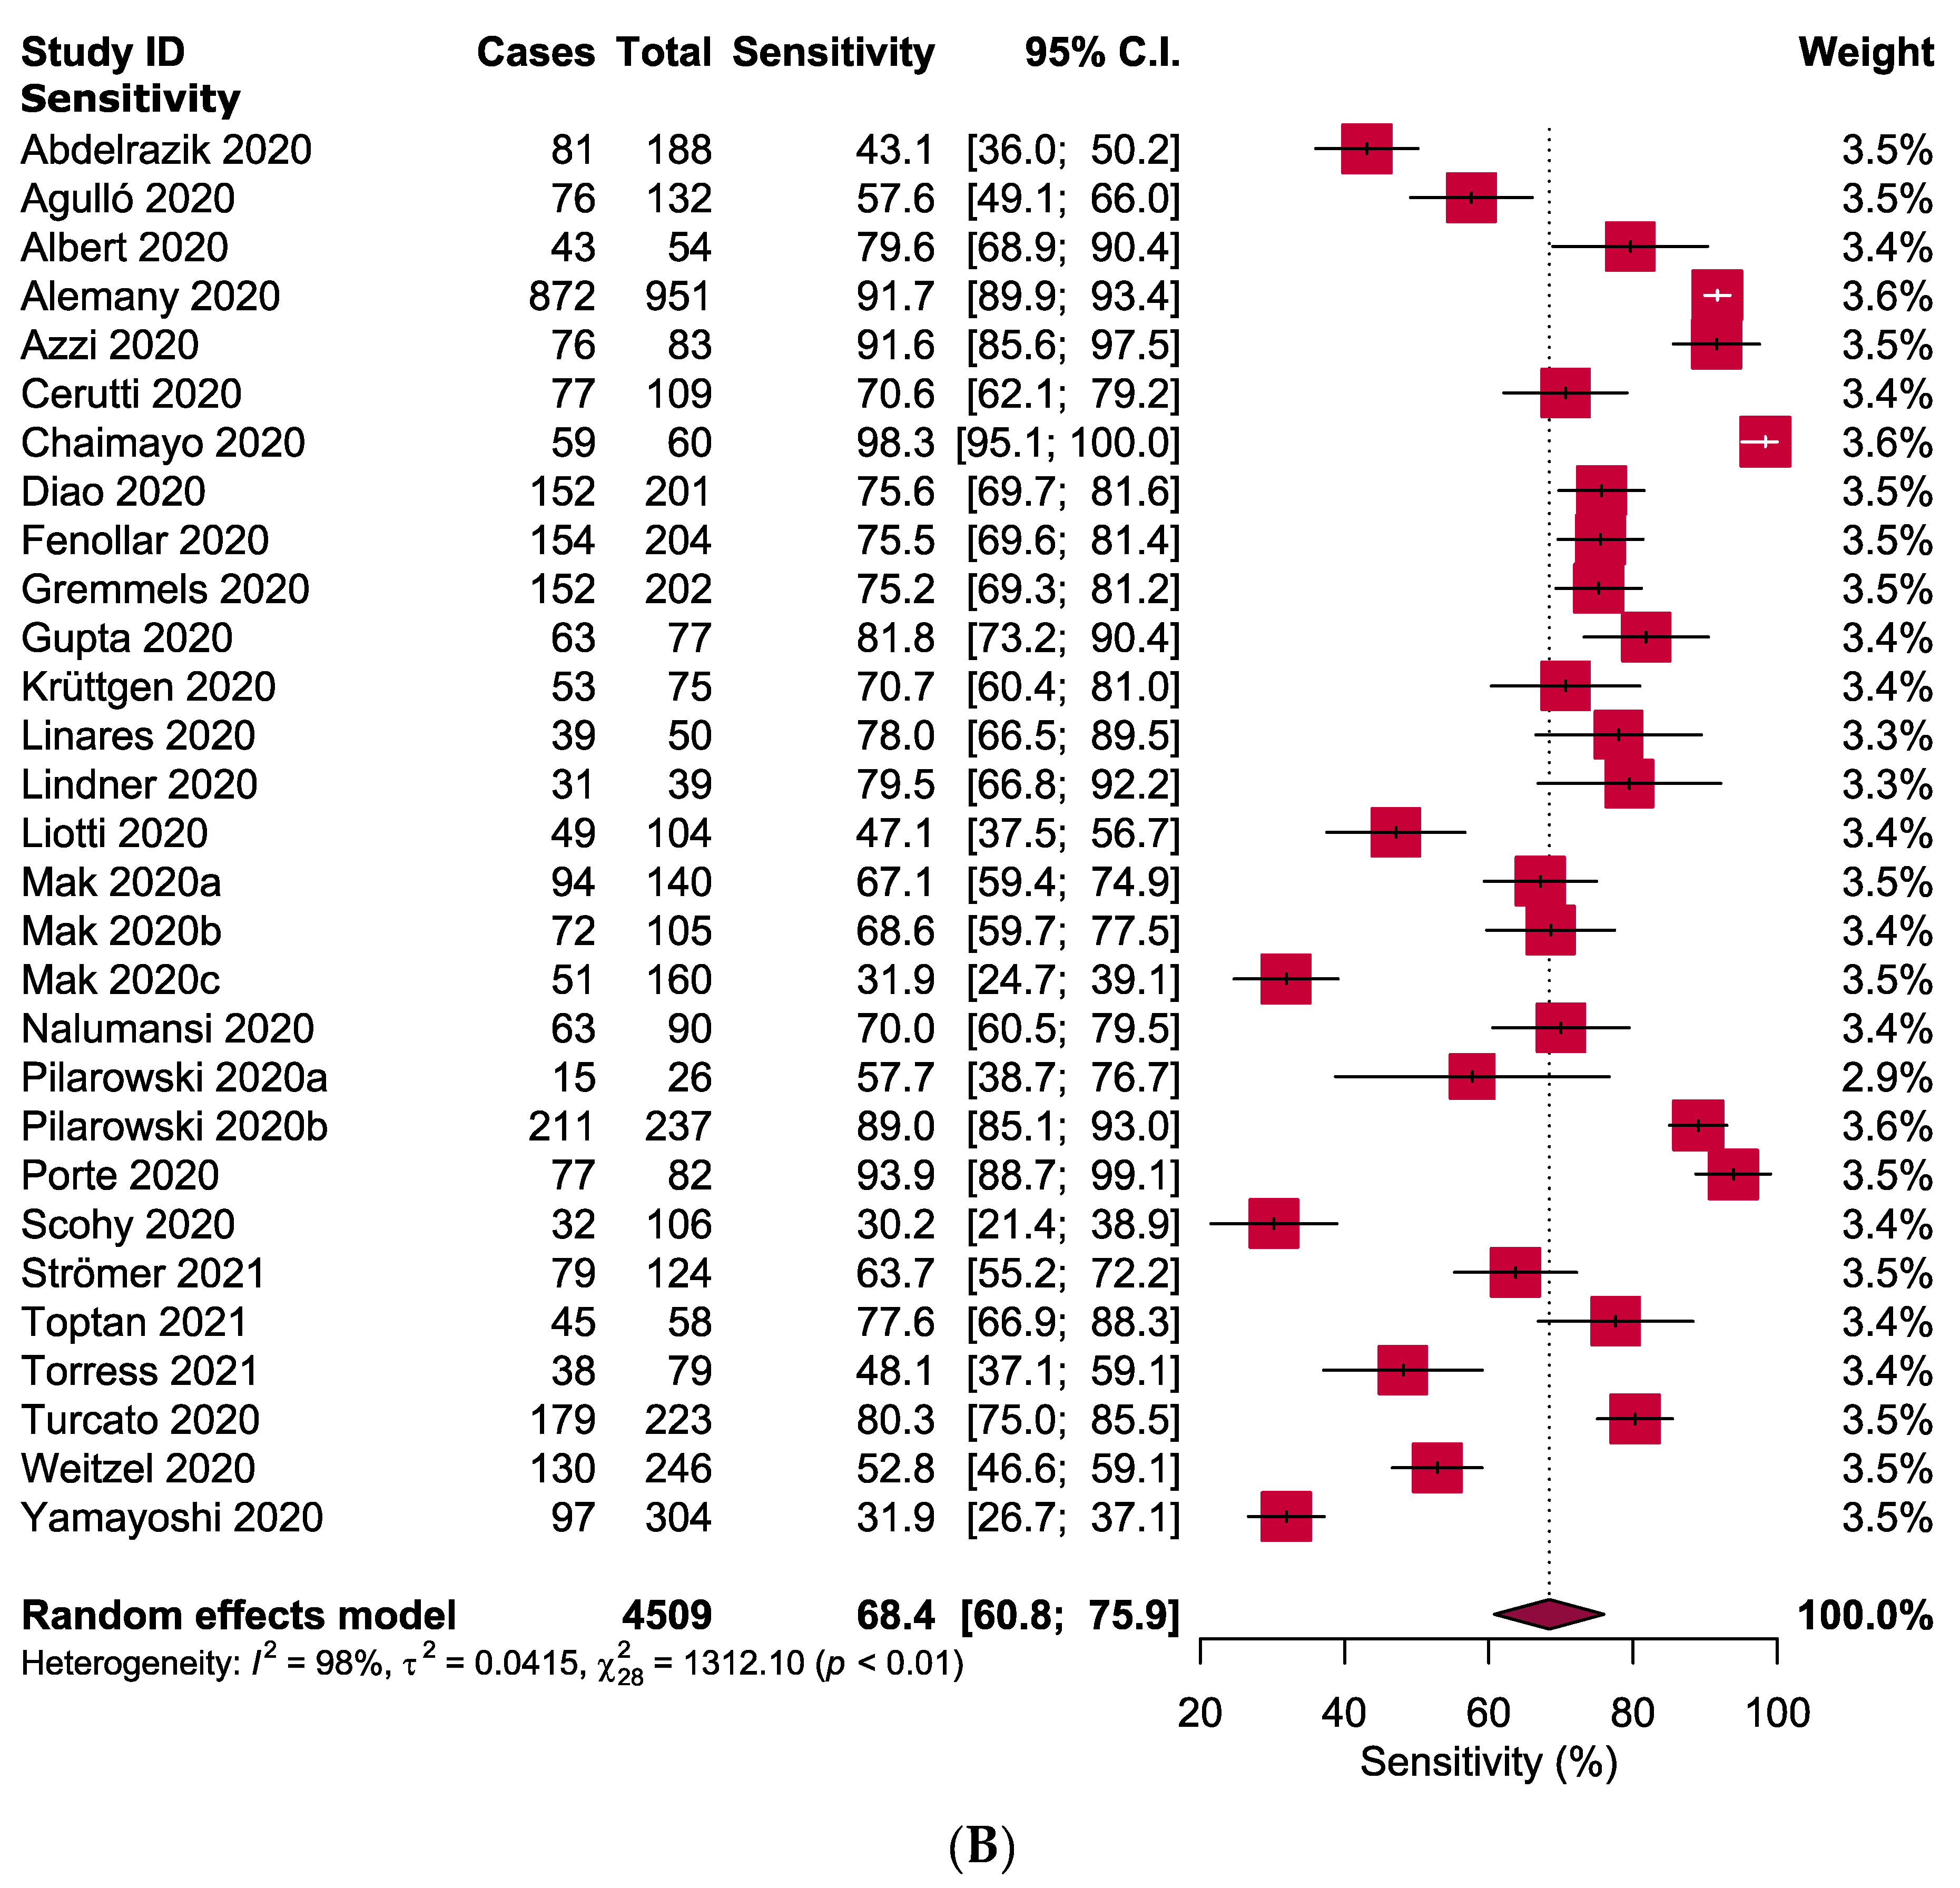
3.4. Meta-Analysis
3.5. Sensitivity Analyses
4. Discussion
5. Conclusions
Supplementary Materials
Author Contributions
Funding
Institutional Review Board Statement
Informed Consent Statement
Data Availability Statement
Conflicts of Interest
References
- Islam, M.A.; Kundu, S.; Alam, S.S.; Hossan, T.; Kamal, M.A.; Hassan, R. Prevalence and characteristics of fever in adult and paediatric patients with coronavirus disease 2019 (COVID-19): A systematic review and meta-analysis of 17515 patients. PLoS ONE 2021, 16, e0249788. [Google Scholar] [CrossRef]
- Saniasiaya, J.; Islam, M.A.; Abdullah, B. Prevalence of Olfactory Dysfunction in Coronavirus Disease 2019 (COVID-19): A Meta-analysis of 27,492 Patients. Laryngoscope 2021, 131, 865–878. [Google Scholar] [CrossRef]
- Saniasiaya, J.; Islam, M.A.; Abdullah, B. Prevalence and Characteristics of Taste Disorders in Cases of COVID-19: A Meta-analysis of 29,349 Patients. Otolaryngol. Head Neck Surg. 2020, 165, 33–42. [Google Scholar] [CrossRef] [PubMed]
- Islam, M.A.; Alam, S.S.; Kundu, S.; Hossan, T.; Kamal, M.A.; Cavestro, C. Prevalence of Headache in Patients With Coronavirus Disease 2019 (COVID-19): A Systematic Review and Meta-Analysis of 14,275 Patients. Front. Neurol. 2020, 11, 562634. [Google Scholar] [CrossRef] [PubMed]
- Guan, W.-J.; Ni, Z.-Y.; Hu, Y.; Liang, W.-H.; Ou, C.-Q.; He, J.-X.; Liu, L.; Shan, H.; Lei, C.-L.; Hui, D.S. Clinical characteristics of coronavirus disease 2019 in China. N. Engl. J. Med. 2020, 382, 1708–1720. [Google Scholar] [CrossRef] [PubMed]
- Pfefferle, S.; Reucher, S.; Nörz, D.; Lütgehetmann, M. Evaluation of a quantitative RT-PCR assay for the detection of the emerging coronavirus SARS-CoV-2 using a high throughput system. Eurosurveillance 2020, 25, 2000152. [Google Scholar] [CrossRef] [PubMed] [Green Version]
- LeBlanc, J.J.; Gubbay, J.B.; Li, Y.; Needle, R.; Arneson, S.R.; Marcino, D.; Charest, H.; Desnoyers, G.; Dust, K.; Fattouh, R. Real-time PCR-based SARS-CoV-2 detection in Canadian laboratories. J. Clin. Virol. 2020, 128, 104433. [Google Scholar] [CrossRef] [PubMed]
- US Food and Drug Administration. In Vitro Diagnostics EUAs. Updated January 14. Available online: https://www.fda.gov/medical-devices/coronavirus-disease-2019-covid-19-emergency-use-authorizations-medical-devices/vitro-diagnostics-euas (accessed on 21 April 2021).
- D’Cruz, R.J.; Currier, A.W.; Sampson, V.B. Laboratory testing methods for novel severe acute respiratory syndrome-coronavirus-2 (SARS-CoV-2). Front. Cell Dev. Biol. 2020, 8, 468. [Google Scholar] [CrossRef] [PubMed]
- Torres, I.; Poujois, S.; Albert, E.; Álvarez, G.; Colomina, J.; Navarro, D. Point-of-care evaluation of a rapid antigen test (CLINITESTⓇ Rapid COVID-19 Antigen Test) for diagnosis of SARS-CoV-2 infection in symptomatic and asymptomatic individuals. J. Infect. 2021, 82, 11–12. [Google Scholar] [CrossRef] [PubMed]
- Peeling, R.W.; Olliaro, P.L.; Boeras, D.I.; Fongwen, N. Scaling up COVID-19 rapid antigen tests: Promises and challenges. Lancet Infect. Dis. 2021. [Google Scholar] [CrossRef]
- Albert, E.; Torres, I.; Bueno, F.; Huntley, D.; Molla, E.; Fernández-Fuentes, M.Á.; Martínez, M.; Poujois, S.; Forqué, L.; Valdivia, A. Field evaluation of a rapid antigen test (Panbio™ COVID-19 Ag Rapid Test Device) for COVID-19 diagnosis in primary healthcare centres. Clin. Microbiol. Infect. 2020, 27, 7–10. [Google Scholar] [CrossRef]
- Mina, M.J.; Parker, R.; Larremore, D.B. Rethinking Covid-19 test sensitivity—A strategy for containment. N. Engl. J. Med. 2020, 383, e120. [Google Scholar] [CrossRef]
- World Health Organization. Antigen-Detection in the Diagnosis of SARS-CoV-2 Infection Using Rapid Immunoassays: Interim Guidance. 11 September 2020. Available online: https://www.who.int/publications/i/item/antigen-detection-in-the-diagnosis-of-sars-cov-2infection-using-rapid-immunoassays (accessed on 28 April 2021).
- Moher, D.; Liberati, A.; Tetzlaff, J.; Altman, D.G.; Group, P. Preferred reporting items for systematic reviews and meta-analyses: The PRISMA statement. PLoS Med. 2009, 6, e1000097. [Google Scholar] [CrossRef] [Green Version]
- Chia, Y.C.; Islam, M.A.; Hider, P.; Woon, P.Y.; Johan, M.F.; Hassan, R.; Ramli, M. The Prevalence of TET2 Gene Mutations in Patients with BCR-ABL-Negative Myeloproliferative Neoplasms (MPN): A Systematic Review and Meta-Analysis. Cancers 2021, 13, 3078. [Google Scholar] [CrossRef]
- Abdelrazik, A.M.; Elshafie, S.M.; Abdelaziz, H.M. Potential Use of Antigen-Based Rapid Test for SARS-CoV-2 in Respiratory Specimens in Low-Resource Settings in Egypt for Symptomatic Patients and High-Risk Contacts. Lab. Med. 2020, 52, 46–49. [Google Scholar] [CrossRef] [PubMed]
- Agulló, V.; Fernández-González, M.; de la Tabla, V.O.; Gonzalo-Jiménez, N.; García, J.A.; Masiá, M.; Gutiérrez, F. Evaluation of the rapid antigen test Panbio COVID-19 in saliva and nasal swabs in a population-based point-of-care study. J. Infect. 2020, 82, 186–230. [Google Scholar] [CrossRef] [PubMed]
- Alemany, A.; Baro, B.; Ouchi, D.; Rodó, P.; Ubals, M.; Corbacho-Monné, M.; Vergara-Alert, J.; Rodon, J.; Segalés, J.; Esteban, C. Analytical and clinical performance of the panbio COVID-19 antigen-detecting rapid diagnostic test. J. Infect. 2020, 82, 186–230. [Google Scholar] [CrossRef] [PubMed]
- Azzi, L.; Baj, A.; Alberio, T.; Lualdi, M.; Veronesi, G.; Carcano, G.; Ageno, W.; Gambarini, C.; Maffioli, L.; Di Saverio, S. Rapid Salivary Test suitable for a mass screening program to detect SARS-CoV-2: A diagnostic accuracy study. J. Infect. 2020, 81, 75–78. [Google Scholar] [CrossRef] [PubMed]
- Cerutti, F.; Burdino, E.; Milia, M.G.; Allice, T.; Gregori, G.; Bruzzone, B.; Ghisetti, V. Urgent need of rapid tests for SARS CoV-2 antigen detection: Evaluation of the SD-Biosensor antigen test for SARS-CoV-2. J. Clin. Virol. 2020, 132, 104654. [Google Scholar] [CrossRef] [PubMed]
- Chaimayo, C.; Kaewnaphan, B.; Tanlieng, N.; Athipanyasilp, N.; Sirijatuphat, R.; Chayakulkeeree, M.; Angkasekwinai, N.; Sutthent, R.; Puangpunngam, N.; Tharmviboonsri, T. Rapid SARS-CoV-2 antigen detection assay in comparison with real-time RT-PCR assay for laboratory diagnosis of COVID-19 in Thailand. Virol. J. 2020, 17, 177. [Google Scholar] [CrossRef]
- Diao, B.; Wen, K.; Zhang, J.; Chen, J.; Han, C.; Chen, Y.; Wang, S.; Deng, G.; Zhou, H.; Wu, Y. Accuracy of a nucleocapsid protein antigen rapid test in the diagnosis of SARS-CoV-2 infection. Clin. Microbiol. Infect. 2020, 27, 289.e1–289.e4. [Google Scholar] [CrossRef] [PubMed]
- Fenollar, F.; Bouam, A.; Ballouche, M.; Fuster, L.; Prudent, E.; Colson, P.; Tissot-Dupont, H.; Million, M.; Drancourt, M.; Raoult, D. Evaluation of the Panbio Covid-19 rapid antigen detection test device for the screening of patients with COVID-19. J. Clin. Microbiol. 2020, 59, e02589-20. [Google Scholar] [CrossRef]
- Gremmels, H.; Winkel, B.M.; Schuurman, R.; Rosingh, A.; Rigter, N.A.; Rodriguez, O.; Ubijaan, J.; Wensing, A.M.; Bonten, M.J.; Hofstra, L.M. Real-life validation of the Panbio™ COVID-19 antigen rapid test (Abbott) in community-dwelling subjects with symptoms of potential SARS-CoV-2 infection. EClinicalMedicine 2021, 31, 100677. [Google Scholar] [CrossRef]
- Gupta, A.; Khurana, S.; Das, R.; Srigyan, D.; Singh, A.; Mittal, A.; Singh, P.; Soneja, M.; Kumar, A.; Singh, A.K. Rapid chromatographic immunoassay-based evaluation of COVID-19: A cross-sectional, diagnostic test accuracy study & its implications for COVID-19 management in India. Indian J. Med. Res. 2020, 153, 126–131. [Google Scholar] [CrossRef]
- Krüttgen, A.; Cornelissen, C.G.; Dreher, M.; Hornef, M.W.; Imöhl, M.; Kleines, M. Comparison of the SARS-CoV-2 Rapid antigen test to the real star Sars-CoV-2 RT PCR kit. J. Virol. Methods 2021, 288, 114024. [Google Scholar] [CrossRef] [PubMed]
- Linares, M.; Pérez-Tanoira, R.; Carrero, A.; Romanyk, J.; Pérez-García, F.; Gómez-Herruz, P.; Arroyo, T.; Cuadros, J. Panbio antigen rapid test is reliable to diagnose SARS-CoV-2 infection in the first 7 days after the onset of symptoms. J. Clin. Virol. 2020, 133, 104659. [Google Scholar] [CrossRef]
- Lindner, A.K.; Nikolai, O.; Kausch, F.; Wintel, M.; Hommes, F.; Gertler, M.; Krüger, L.J.; Gaeddert, M.; Tobian, F.; Lainati, F. Head-to-head comparison of SARS-CoV-2 antigen-detecting rapid test with self-collected anterior nasal swab versus professional-collected nasopharyngeal swab. Eur. Respir. J. 2020, 57, 2003961. [Google Scholar] [CrossRef] [PubMed]
- Liotti, F.M.; Menchinelli, G.; Lalle, E.; Palucci, I.; Marchetti, S.; Colavita, F.; La Sorda, M.; Sberna, G.; Bordi, L.; Sanguinetti, M. Performance of a novel diagnostic assay for rapid SARS-CoV-2 antigen detection in nasopharynx samples. Clin. Microbiol. Infect. 2020, 27, 487–488. [Google Scholar] [CrossRef] [PubMed]
- Mak, G.C.; Lau, S.S.; Wong, K.K.; Chow, N.L.; Lau, C.; Lam, E.T.; Chan, R.C.; Tsang, D.N. Analytical sensitivity and clinical sensitivity of the three rapid antigen detection kits for detection of SARS-CoV-2 virus. J. Clin. Virol. 2020, 133, 104684. [Google Scholar] [CrossRef]
- Mak, G.C.; Lau, S.S.; Wong, K.K.; Chow, N.L.; Lau, C.; Lam, E.T.; Chan, R.C.; Tsang, D.N. Evaluation of rapid antigen detection kit from the WHO Emergency Use List for detecting SARS-CoV-2. J. Clin. Virol. 2021, 134, 104712. [Google Scholar] [CrossRef]
- Mak, G.C.; Cheng, P.K.; Lau, S.S.; Wong, K.K.; Lau, C.; Lam, E.T.; Chan, R.C.; Tsang, D.N. Evaluation of rapid antigen test for detection of SARS-CoV-2 virus. J. Clin. Virol. 2020, 129, 104500. [Google Scholar] [CrossRef] [PubMed]
- Nalumansi, A.; Lutalo, T.; Kayiwa, J.; Watera, C.; Balinandi, S.; Kiconco, J.; Nakaseegu, J.; Olara, D.; Odwilo, E.; Serwanga, J. Field evaluation of the performance of a SARS-CoV-2 antigen rapid diagnostic test in Uganda using nasopharyngeal samples. Int. J. Infect. Dis. 2021, 104, 282–286. [Google Scholar] [CrossRef] [PubMed]
- Pilarowski, G.; Lebel, P.; Sunshine, S.; Liu, J.; Crawford, E.; Marquez, C.; Rubio, L.; Chamie, G.; Martinez, J.; Peng, J. Performance characteristics of a rapid SARS-CoV-2 antigen detection assay at a public plaza testing site in San Francisco. medRxiv 2020. [Google Scholar] [CrossRef]
- Pilarowski, G.; Marquez, C.; Rubio, L.; Peng, J.; Martinez, J.; Black, D.; Chamie, G.; Jones, D.; Jacobo, J.; Tulier-Laiwa, V. Field performance and public health response using the BinaxNOW TM Rapid SARS-CoV-2 antigen detection assay during community-based testing. Clin. Infect. Dis. 2020. [Google Scholar] [CrossRef] [PubMed]
- Porte, L.; Legarraga, P.; Vollrath, V.; Aguilera, X.; Munita, J.M.; Araos, R.; Pizarro, G.; Vial, P.; Iruretagoyena, M.; Dittrich, S. Evaluation of a novel antigen-based rapid detection test for the diagnosis of SARS-CoV-2 in respiratory samples. Int. J. Infect. Dis. 2020, 99, 328–333. [Google Scholar] [CrossRef] [PubMed]
- Scohy, A.; Anantharajah, A.; Bodéus, M.; Kabamba-Mukadi, B.; Verroken, A.; Rodriguez-Villalobos, H. Low performance of rapid antigen detection test as frontline testing for COVID-19 diagnosis. J. Clin. Virol. 2020, 129, 104455. [Google Scholar] [CrossRef] [PubMed]
- Strömer, A.; Rose, R.; Schäfer, M.; Schön, F.; Vollersen, A.; Lorentz, T.; Fickenscher, H.; Krumbholz, A. Performance of a Point-of-Care Test for the Rapid Detection of SARS-CoV-2 Antigen. Microorganisms 2021, 9, 58. [Google Scholar] [CrossRef] [PubMed]
- Toptan, T.; Eckermann, L.; Pfeiffer, A.E.; Hoehl, S.; Ciesek, S.; Drosten, C.; Corman, V.M. Evaluation of a SARS-CoV-2 rapid antigen test: Potential to help reduce community spread? J. Clin. Virol. 2021, 135, 104713. [Google Scholar] [CrossRef]
- Torres, I.; Poujois, S.; Albert, E.; Colomina, J.; Navarro, D. Evaluation of a rapid antigen test (Panbio™ COVID-19 Ag rapid test device) for SARS-CoV-2 detection in asymptomatic close contacts of COVID-19 patients. Clin. Microbiol. Infect. 2021, 27, 636.e1–636.e4. [Google Scholar] [CrossRef]
- Turcato, G.; Zaboli, A.; Pfeifer, N.; Ciccariello, L.; Sibilio, S.; Tezza, G.; Ausserhofer, D. Clinical application of a rapid antigen test for the detection of SARS-CoV-2 infection in symptomatic and asymptomatic patients evaluated in the emergency department: A preliminary report. J. Infect. 2020, 82, 14–16. [Google Scholar] [CrossRef] [PubMed]
- Weitzel, T.; Legarraga, P.; Iruretagoyena, M.; Pizarro, G.; Vollrath, V.; Araos, R.; Munita, J.M.; Porte, L. Comparative evaluation of four rapid SARS-CoV-2 antigen detection tests using universal transport medium. Travel Med. Infect. Dis. 2021, 39, 101942. [Google Scholar] [CrossRef] [PubMed]
- Yamayoshi, S.; Sakai-Tagawa, Y.; Koga, M.; Akasaka, O.; Nakachi, I.; Koh, H.; Maeda, K.; Adachi, E.; Saito, M.; Nagai, H. Comparison of Rapid Antigen Tests for COVID-19. Viruses 2020, 12, 1420. [Google Scholar] [CrossRef] [PubMed]
- Oishee, M.J.; Ali, T.; Jahan, N.; Khandker, S.S.; Haq, M.A.; Khondoker, M.U.; Sil, B.K.; Lugova, H.; Krishnapillai, A.; Abubakar, A.R. COVID-19 pandemic: Review of contemporary and forthcoming detection tools. Infect. Drug Resist. 2021, 14, 1049–1082. [Google Scholar] [CrossRef] [PubMed]
- Rao, S.N.; Manissero, D.; Steele, V.R.; Pareja, J. A narrative systematic review of the clinical utility of cycle threshold values in the context of COVID-19. Infect. Dis. Ther. 2020, 9, 573–586. [Google Scholar] [CrossRef] [PubMed]
- Surkova, E.; Nikolayevskyy, V.; Drobniewski, F. False-positive COVID-19 results: Hidden problems and costs. Lancet Respir. Med. 2020, 8, 1167–1168. [Google Scholar] [CrossRef]
- Kucirka, L.M.; Lauer, S.A.; Laeyendecker, O.; Boon, D.; Lessler, J. Variation in false-negative rate of reverse transcriptase polymerase chain reaction–based SARS-CoV-2 tests by time since exposure. Ann. Intern. Med. 2020, 173, 262–267. [Google Scholar] [CrossRef] [PubMed]
- Ai, T.; Yang, Z.; Hou, H.; Zhan, C.; Chen, C.; Lv, W.; Tao, Q.; Sun, Z.; Xia, L. Correlation of chest CT and RT-PCR testing for coronavirus disease 2019 (COVID-19) in China: A report of 1014 cases. Radiology 2020, 296, 32–40. [Google Scholar] [CrossRef] [PubMed] [Green Version]
- Sil, B.K.; Jahan, N.; Haq, M.A.; Oishee, M.J.; Ali, T.; Khandker, S.S.; Kobatake, E.; Mie, M.; Khondoker, M.U.; Jamiruddin, M.R. Development and performance evaluation of a rapid in-house ELISA for retrospective serosurveillance of SARS-CoV-2. PLoS ONE 2021, 16, e0246346. [Google Scholar] [CrossRef] [PubMed]
- Paek, S.-H.; Lee, S.-H.; Cho, J.-H.; Kim, Y.-S. Development of rapid one-step immunochromatographic assay. Methods 2000, 22, 53–60. [Google Scholar] [CrossRef] [Green Version]
- Odell, I.D.; Cook, D. Immunofluorescence techniques. J. Investig. Dermatol. 2013, 133, e4. [Google Scholar] [CrossRef] [Green Version]
- Sil, B.K.; Jamiruddin, M.R.; Haq, M.A.; Khondoker, M.U.; Jahan, N.; Khandker, S.S.; Ali, T.; Oishee, M.J.; Kaitsuka, T.; Mie, M. AuNP Coupled Rapid Flow-Through Dot-Blot Immuno-Assay for Enhanced Detection of SARS-CoV-2 Specific Nucleocapsid and Receptor Binding Domain IgG. Int. J. Nanomed. 2021, 16, 4739–4753. [Google Scholar] [CrossRef]
- Lanser, L.; Bellmann-Weiler, R.; Öttl, K.-W.; Huber, L.; Griesmacher, A.; Theurl, I.; Weiss, G. Evaluating the clinical utility and sensitivity of SARS-CoV-2 antigen testing in relation to RT-PCR Ct values. Infection 2020, 49, 555–557. [Google Scholar] [CrossRef] [PubMed]
- Centers for Disease Control and Prevention. Interim Guidance on Ending Isolation and Precautions for Adults with COVID-19. 2021. Available online: https://www.cdc.gov/coronavirus/2019-ncov/hcp/duration-isolation.html (accessed on 28 April 2021).
- Jamal, A.J.; Mozafarihashjin, M.; Coomes, E.; Powis, J.; Li, A.X.; Paterson, A.; Anceva-Sami, S.; Barati, S.; Crowl, G.; Faheem, A. Sensitivity of nasopharyngeal swabs and saliva for the detection of severe acute respiratory syndrome coronavirus 2. Clin. Infect. Dis. 2021, 72, 1064–1066. [Google Scholar] [CrossRef]
- Zhao, L.; Li, L.; Liu, G.-q.; Chen, L.; Liu, X.; Zhu, J.; Li, B. Effect of freeze–thaw cycles on the molecular weight and size distribution of gluten. Food Res. Int. 2013, 53, 409–416. [Google Scholar] [CrossRef] [Green Version]
- Adnan, N.; Khondoker, M.U.; Rahman, M.S.; Ahmed, M.F.; Sharmin, S.; Sharif, N.; Azmuda, N.; Akter, S.; Nahar, S.; Mou, T.J. Coding-complete genome sequences and mutation profiles of nine SARS-CoV-2 strains detected from COVID-19 patients in Bangladesh. Microbiol. Resour. Announc. 2021, 10, e00124-21. [Google Scholar] [CrossRef] [PubMed]
- Singh, J.; Samal, J.; Kumar, V.; Sharma, J.; Agrawal, U.; Ehtesham, N.Z.; Sundar, D.; Rahman, S.A.; Hira, S.; Hasnain, S.E. Structure-function analyses of new SARS-CoV-2 variants B. 1.1. 7, B. 1.351 and B. 1.1. 28.1: Clinical, diagnostic, therapeutic and public health implications. Viruses 2021, 13, 439. [Google Scholar] [CrossRef]
- Hanson, K.E.; Altayar, O.; Caliendo, A.M.; Arias, C.A.; Englund, J.A.; Hayden, M.K.; Lee, M.J.; Loeb, M.; Patel, R.; El Alayli, A. The Infectious Diseases Society of America Guidelines on the Diagnosis of COVID-19: Antigen Testing. Clin. Infect. Dis. 2021, 23. Version 1.0.0. Available online: https://www.idsociety.org/practice-guideline/covid-19-guideline-antigen-testing (accessed on 25 July 2021).


| Study ID [References] | Location | Total Subjects (% Female) Mean/Median Age | Type of Participants | Specimen Types | Positive Sample by RT-PCR (%) | Range of Ct Values | Testing Method | Rapid Antigen Test Kit (Manufacturer, Country) |
|---|---|---|---|---|---|---|---|---|
| Abdelrazik 2020 [17] | Egypt | 310 (40.6, 42) | C-19 (n = 160) and HCW + CC (n = 150) | NPS | 60.6 | 15.8–32.3 | ICG | Biocredit COVID-19 Ag Detection Kit (RapiGEN, Korea) |
| Agulló 2020 [18] | Spain | 659 (56.4, 38) | SS (n = 394) and CC (n = 265) | NS, S | 20.0 | 14.0–33.0 (IQR) | ICG | Panbio™ COVID-19 Ag-RTD (Abbott Diagnostics, Germany) |
| Albert 2020 [12] | Spain | 412 (58.0, 31) | SS (n = 412) | NPS | 13.1 | ≤25–≤34 | ICG | Panbio™ COVID-19 Ag-RTD (Abbott Diagnostics, Germany) |
| Alemany 2020 [19] | Spain | 1406 (NR, 40) | SS (n = 446), CC (n = 473) and GS (n = 487) | NPS, NMT | 67.6 | 19.7–27.3 (IQR) | ICG | Panbio™ COVID-19 Ag-RTD (Abbott Diagnostics, Germany) |
| Azzi 2020 † [20] | Italy | 122 (67.2, 54) | C-19, SS and HCW | NPS, S | 23.8 | NR | ICG | In house |
| Cerutti 2020 [21] | Italy | 185 (NR, 45) | SS (n = 185) | NPS | 56.2 | 12.3–38.1 | ICG | Standard™ Q COVID-19 Ag kit (SD Biosensor, Korea) |
| 145 (NR, 36) | T (n = 145) | 3.4 | ||||||
| Chaimayo 2020 [22] | Thailand | 454 (56.2, 58) | CC, SS, T and POS. | NPS, TS, EA | 13.2 | 10.4–35.0 | ICG | Standard™ Q COVID-19 Ag kit (SD Biosensor, Korea) |
| Diao 2020 † [23] | China | 251 (51.4, 40) | SS (n = 251) | NPS | 80.1 | ≤37.0–≤40.0 | FIA | In house |
| Fenollar 2020 [24] | France | 341 (NR, NR) | SS (n = 182) and CC (n = 159) | NPS | 59.8 | 9.0–34.0 | ICG | Panbio™ COVID-19 Ag-RTD (Abbott Diagnostics, Germany) |
| Gremmels 2020 † [25] | The Netherlands | 1367 (61.7, 36) | GS (n = 1367) | NPS, TS | 10.2 | <32.0–≥32.0 | ICG | Panbio™ COVID-19 Ag-RTD (Abbott Diagnostics, USA) |
| Aruba | 208 (NR, NR) | GS (n = 208) | 30.3 | |||||
| Gupta 2020 † [26] | India | 330 (30.0, 34) | SS (n = 204) and CC (n = 126) | NS, TS | 23.3 | 10.0–35.4 | ICG | Standard™ Q COVID-19 Ag kit (SD Biosensor, India) |
| Krüttgen 2020 [27] | Germany | 150 (NR, NR) # | C-19 (n = 75) and non-C-19 (n = 75) | NPS | 50.0 | <25.0–≥35.0 | ICG | SARS-CoV-2 Rapid Antigen Test (Roche, Switzerland) |
| Linares 2020 [28] | Spain | 255 (51.4, 46 *) | SS, CC and AS | NPS | 23.5 | <25.0–<40.0 | ICG | Panbio™ COVID-19 Ag-RTD (Abbott Diagnostics, Germany) |
| Lindner 2020 † [29] | Germany | 287 (42.9, 35) | SS | NS ** | 13.5 | 17.3–≥35.5 | ICG | Standard™ Q COVID-19 Ag kit (SD Biosensor, Korea) |
| Liotti 2020 [30] | Italy | 359 (NR, NR) # | C-19 (n = 104) and non-C-19 (n = 255) | NPS | 29.0 | 15.3–39.7 | FIA | Standard™ F COVID-19 Ag (SD Biosensor, Korea) |
| Mak 2020a [31] | Hong Kong | 280 (NR, NR) # | C-19 (n = 280) | S, NPS, NPA, TS | 100.0 | <18.6–>28.7 | ICG | COVID-19 Ag Respi-Strip (Coris Bioconcept, Belgium) |
| NADAL COVID-19 Ag Test (Nal Von Minden, Germany) | ||||||||
| Standard™ Q COVID-19 Ag kit (SD Biosensor, Korea) | ||||||||
| Mak 2020b [32] | Hong Kong | 105 (NR, NR) # | C-19 (n = 105) | NPS, TS, S | 100.0 | <18.6–>28.7 | ICG | Panbio™ COVID-19 Ag-RTD (Abbott Diagnostics, Germany) |
| Standard™ Q COVID-19 Ag kit (SD Biosensor, Korea) | ||||||||
| Mak 2020c [33] | Hong Kong | 160 (NR, NR) # | C-19 (n = 160) | S, NPS, TS, NPA, SP | 100.0 | <18.6–>28.7 | ICG | Biocredit COVID-19 Ag Detection Kit, (RapiGEN, Korea) |
| Nalumansi 2020 [34] | Uganda | 262 (10.7, 34) | SS (n = 136) and AS (n = 124) | NPS | 34.4 | <29–39 | ICG | Standard™ Q COVID-19 Ag kit (SD Biosensor, Korea) |
| Pilarowski 2020a [35] | USA | 878 (46.0, NR) | GS (n = 878) | NS | 3.0 | 28.8–30.3 | ICG | Abbott BinaxNOW™ COVID-19 Ag (Abbott Diagnostics, USA) |
| Pilarowski 2020b [36] | USA | 3302 (45.4, NR) | GS (n = 3302) | NS | 7.2 | <30.0–<35.0 | ICG | Abbott BinaxNOW™ COVID-19 Ag (Abbott Diagnostics, USA) |
| Porte 2020 † [37] | Chile | 127 (46.5, 38) | SS + T + CC (n = 127) | NPS, OP | 64.6 | 14.2–25.1 (IQR) | FIA | Bioeasy™ 2019-nCoV Ag RTK (Bioeasy Biotechnology, China) |
| Scohy 2020 [38] | Belgium | 148 (56.8, 58) | SS (n = 148) | NPS | 71.6 | 16.0–36.0 | ICG | COVID-19 Ag Respi-Strip (Coris Bioconcept, Belgium) |
| Strömer 2021 ‡ [39] | Germany | 134 (NR, NR) # | C-19 (n = 124) and non-C-19 (n = 10) | NPS | 92.5 | 17.0–37.0 | ICG | NADAL COVID-19 Ag Test (Nal Von Minden, Germany) |
| Panbio™ COVID-19 Ag-RTD (Abbott Diagnostics, Germany) | ||||||||
| Toptan 2021 [40] | Germany | 67 (NR, NR) # | C-19 (n = 58) and Non-C-19 (n = 9) | OP, NS | 86.6 | 18.7–40.0 | ICG | RIDA®QUICK SARS-CoV-2 Ag test (R-Biopharm, Germany) |
| 70 (NR, NR) | GS (n = 70) | NS | 45.7 | 18.0–35.9 | ICG | RIDA®QUICK SARS-CoV-2 Ag test (R-Biopharm, Germany) | ||
| Torress 2021 [41] | Spain | 634 (56.0, 37) | CC (n = 634) | NPS | 12.4 | ≤20.0–>35.0 | ICG | Panbio™ COVID-19 Ag-RTD (Abbott Diagnostics, Germany) |
| Turcato 2020 [42] | Italy | 3410 (NR, NR) | SS (n = 991) and AS (n = 2419) | NR | 6.5 | NR | ICG | Standard™ Q COVID-19 Ag kit (SD Biosensor, Korea) |
| Weitzel 2020 † [43] | Chile | 111 (55.0, 40) | SS (n = 111) | NPS | 72.1 | 10.7–37.7 | ICG | Biocredit COVID-19 Ag Detection Kit (RapiGEN, Korea) |
| ICG | StrongStep COVID-19 Antigen test (Liming Bioproducts, China) | |||||||
| FIA | Huaketai New Coronavirus (Savant Biotechnology, China) | |||||||
| FIA | Bioeasy™ 2019-nCoV Ag RTK (Bioeasy Biotechnology, China) | |||||||
| Yamayoshi 2020 [44] | Japan | 76 (NR, NR) # | C-19 (n = 76) | S, TS, NS, NPS, SP, EA | 100.0 | 18.8–36.0 | ICG | Standard™ Q COVID-19 Ag kit (SD Biosensor, Korea) |
| Espline® SARS-CoV-2 (Fujirebio, Japan) | ||||||||
| QuickNavi™-COVID19 Ag (Denka Seiken, Japan) | ||||||||
| ImmunoAce SARS-CoV-2 (Tauns Laboratories, Japan) |
| Subgroups | Pooled Specificity and Sensitivity (95% Cis) (%) | Number of Studies Analysed | Total Number of Patients | Heterogeneity | ||
|---|---|---|---|---|---|---|
| I2 | p-Value | |||||
| Specificity | ||||||
| Based on presence of symptoms | Symptomatic | 99.1 (97.6–100.0) | 4 | 1823 | 89% | <0.0001 |
| Asymptomatic | 99.5 (98.6–100.0) | 4 | 3280 | 92% | <0.0001 | |
| Based on symptom onset | Onset of symptoms <5 days | 99.3 (98.8–99.8) | 3 | 3537 | 34% | 0.40 |
| Onset of symptoms >5 days | 100.0 (99.0–100.0) | 2 | 138 | 0% | 0.48 | |
| Based on specimen types | Nasopharyngeal Swab | 71.0 (14.1–100.1) | 2 | 611 | 99% | <0.0001 |
| Saliva | 80.7 (41.8–100.0) | 2 | 547 | 97% | <0.0001 | |
| Based on continents | Asia | 99.4 (98.7–100.0) | 3 | 697 | 0% | 0.43 |
| Europe | 99.1 (98.6–99.7) | 16 | 7736 | 93% | <0.0001 | |
| North America | 99.9 (99.8–100.0) | 2 | 3910 | 0% | 0.70 | |
| South America | 99.3 (97.7–100.0) | 2 | 147 | 0% | 0.95 | |
| Based on countries | Chile | 99.3 (97.7–100.0) | 2 | 147 | 0% | 0.95 |
| Germany | 99.5 (98.7–100.0) | 4 | 344 | 0% | 0.34 | |
| Italy | 94.0 (90.8–97.1) | 4 | 3812 | 98% | <0.0001 | |
| Spain | 99.7 (99.2–100.0) | 5 | 2028 | 67% | 0.03 | |
| USA | 99.9 (99.8–100.0) | 2 | 3910 | 0% | 0.70 | |
| Based on kit manufacturers | Abbott BinaxNOW™ | 99.9 (99.8–100.0) | 2 | 3910 | 0% | 0.70 |
| Biocredit | 99.0 (97.1–100.0) | 1 | 102 | NA | NA | |
| Panbio™ | 99.7 (99.4–100.0) | 8 | 3547 | 72% | 0.001 | |
| Standard™ | 99.4 (98.8–100.0) | 7 | 2100 | 74% | 0.001 | |
| Sensitivity | ||||||
| Based on presence of symptoms | Symptomatic | 78.5 (61.2–95.9) | 5 | 720 | 97% | <0.0001 |
| Asymptomatic | 54.5 (24.3–84.7) | 5 | 217 | 96% | <0.0001 | |
| Based on symptom onset | Onset of symptoms <5 days | 82.0 (78.1–86.0) | 4 | 357 | 0% | 0.72 |
| Onset of symptoms >5 days | 75.1 (64.8–85.4) | 3 | 66 | 0% | 0.43 | |
| Based on specimen types | Nasopharyngeal Swab | 70.1 (54.1–86.1) | 5 | 339 | 91% | <0.0001 |
| Saliva | 50.4 (7.9–92.9) | 3 | 284 | 99% | <0.0001 | |
| Throat saliva or swab | 38.4 (13.7–63.1) | 4 | 193 | 93% | <0.0001 | |
| Based on Ct values | Ct value ≤20 | 98.8 (96.1–100.0) | 5 | 108 | 0% | 0.96 |
| Ct value 21–25 | 89.6 (80.1–99.0) | 6 | 242 | 85% | <0.0001 | |
| Ct value 26–30 | 55.4 (24.0–86.7) | 7 | 323 | 98% | <0.0001 | |
| Ct value 31–35 | 15.1 (4.5–25.7) | 7 | 202 | 86% | <0.0001 | |
| Ct value 36–40 | 16.5 (0.0–34.4) | 3 | 17 | 0% | 0.89 | |
| Based on continents | Africa | 56.4 (30.0–82.7) | 2 | 278 | 95% | <0.0001 |
| Asia | 65.0 (42.3–87.8) | 7 | 1047 | 99% | <0.0001 | |
| Europe | 70.0 (61.3–78.6) | 16 | 2593 | 96% | <0.0001 | |
| North America | 74.8 (44.2–100.0) | 2 | 263 | 90% | 0.001 | |
| South America | 73.4 (33.2–100.0) | 2 | 328 | 99% | <0.0001 | |
| Based on countries | Chile | 73.4 (33.2–100.0) | 2 | 328 | 99% | <0.0001 |
| Germany | 72.8 (63.3–82.3) | 8 | 815 | 91% | <0.0001 | |
| Hong Kong | 55.8 (31.3–80.3) | 3 | 405 | 97% | <0.0001 | |
| Italy | 72.8 (56.7–88.8) | 4 | 519 | 95% | <0.0001 | |
| Spain | 71.2 (52.6–89.8) | 5 | 1266 | 97% | <0.0001 | |
| USA | 74.8 (44.2–100.0) | 2 | 263 | 90% | 0.001 | |
| Based on kit manufacturers | Abbott BinaxNOW™ | 74.8 (44.2–100.0) | 2 | 263 | 90% | 0.001 |
| Biocredit | 42.7 (30.7–54.7) | 3 | 594 | 89% | <0.0001 | |
| Panbio™ | 75.1 (64.9–85.3) | 9 | 1789 | 96% | <0.0001 | |
| Standard™ | 66.4 (48.5–84.2) | 8 | 634 | 97% | <0.0001 | |
| Strategies of Sensitivity Analyses | Pooled Specificity and Sensitivity (95% Cis) (%) | Difference of Results | Number of Studies Analysed | Total Number of Subjects | Heterogeneity | |
|---|---|---|---|---|---|---|
| I2 | p-Value | |||||
| Specificity | ||||||
| Excluding small studies (<100) | 99.4 (99.1–99.8) | No change | 18 | 12,431 | 93% | <0.0001 |
| Excluding low- or moderate-quality studies | 99.6 (99.1–100.0) | 0.2% higher | 6 | 2556 | 74% | <0.001 |
| Using a fixed-effects model | 99.9 (99.8–100.0) | 0.5% higher | 24 | 12,662 | 90% | <0.001 |
| Excluding outlier studies | 99.7 (99.5–99.9) | 0.03% higher | 23 | 12,513 | 71% | <0.001 |
| Sensitivity | ||||||
| Excluding small studies (<100) | 62.0 (51.1–72.9) | 6.4% lower | 17 | 3736 | 99% | <0.0001 |
| Excluding low- or moderate-quality studies | 69.8 (56.7–82.9) | 1.4% higher | 8 | 937 | 96% | <0.0001 |
| Using a fixed-effects model | 79.9 (60.8–75.9) | 11.5% higher | 29 | 4509 | 98% | <0.0001 |
| Excluding outlier studies | 71.2 (64.8–77.6) | 2.8% higher | 27 | 4045 | 97% | <0.0001 |
Publisher’s Note: MDPI stays neutral with regard to jurisdictional claims in published maps and institutional affiliations. |
© 2021 by the authors. Licensee MDPI, Basel, Switzerland. This article is an open access article distributed under the terms and conditions of the Creative Commons Attribution (CC BY) license (https://creativecommons.org/licenses/by/4.0/).
Share and Cite
Khandker, S.S.; Nik Hashim, N.H.H.; Deris, Z.Z.; Shueb, R.H.; Islam, M.A. Diagnostic Accuracy of Rapid Antigen Test Kits for Detecting SARS-CoV-2: A Systematic Review and Meta-Analysis of 17,171 Suspected COVID-19 Patients. J. Clin. Med. 2021, 10, 3493. https://doi.org/10.3390/jcm10163493
Khandker SS, Nik Hashim NHH, Deris ZZ, Shueb RH, Islam MA. Diagnostic Accuracy of Rapid Antigen Test Kits for Detecting SARS-CoV-2: A Systematic Review and Meta-Analysis of 17,171 Suspected COVID-19 Patients. Journal of Clinical Medicine. 2021; 10(16):3493. https://doi.org/10.3390/jcm10163493
Chicago/Turabian StyleKhandker, Shahad Saif, Nik Haszroel Hysham Nik Hashim, Zakuan Zainy Deris, Rafidah Hanim Shueb, and Md Asiful Islam. 2021. "Diagnostic Accuracy of Rapid Antigen Test Kits for Detecting SARS-CoV-2: A Systematic Review and Meta-Analysis of 17,171 Suspected COVID-19 Patients" Journal of Clinical Medicine 10, no. 16: 3493. https://doi.org/10.3390/jcm10163493