
Endoplasmin Is a Hypoxia-Inducible Endoplasmic Reticulum-Derived Cargo of Extracellular Vesicles Released by Cardiac Cell Lines
 , and
, and 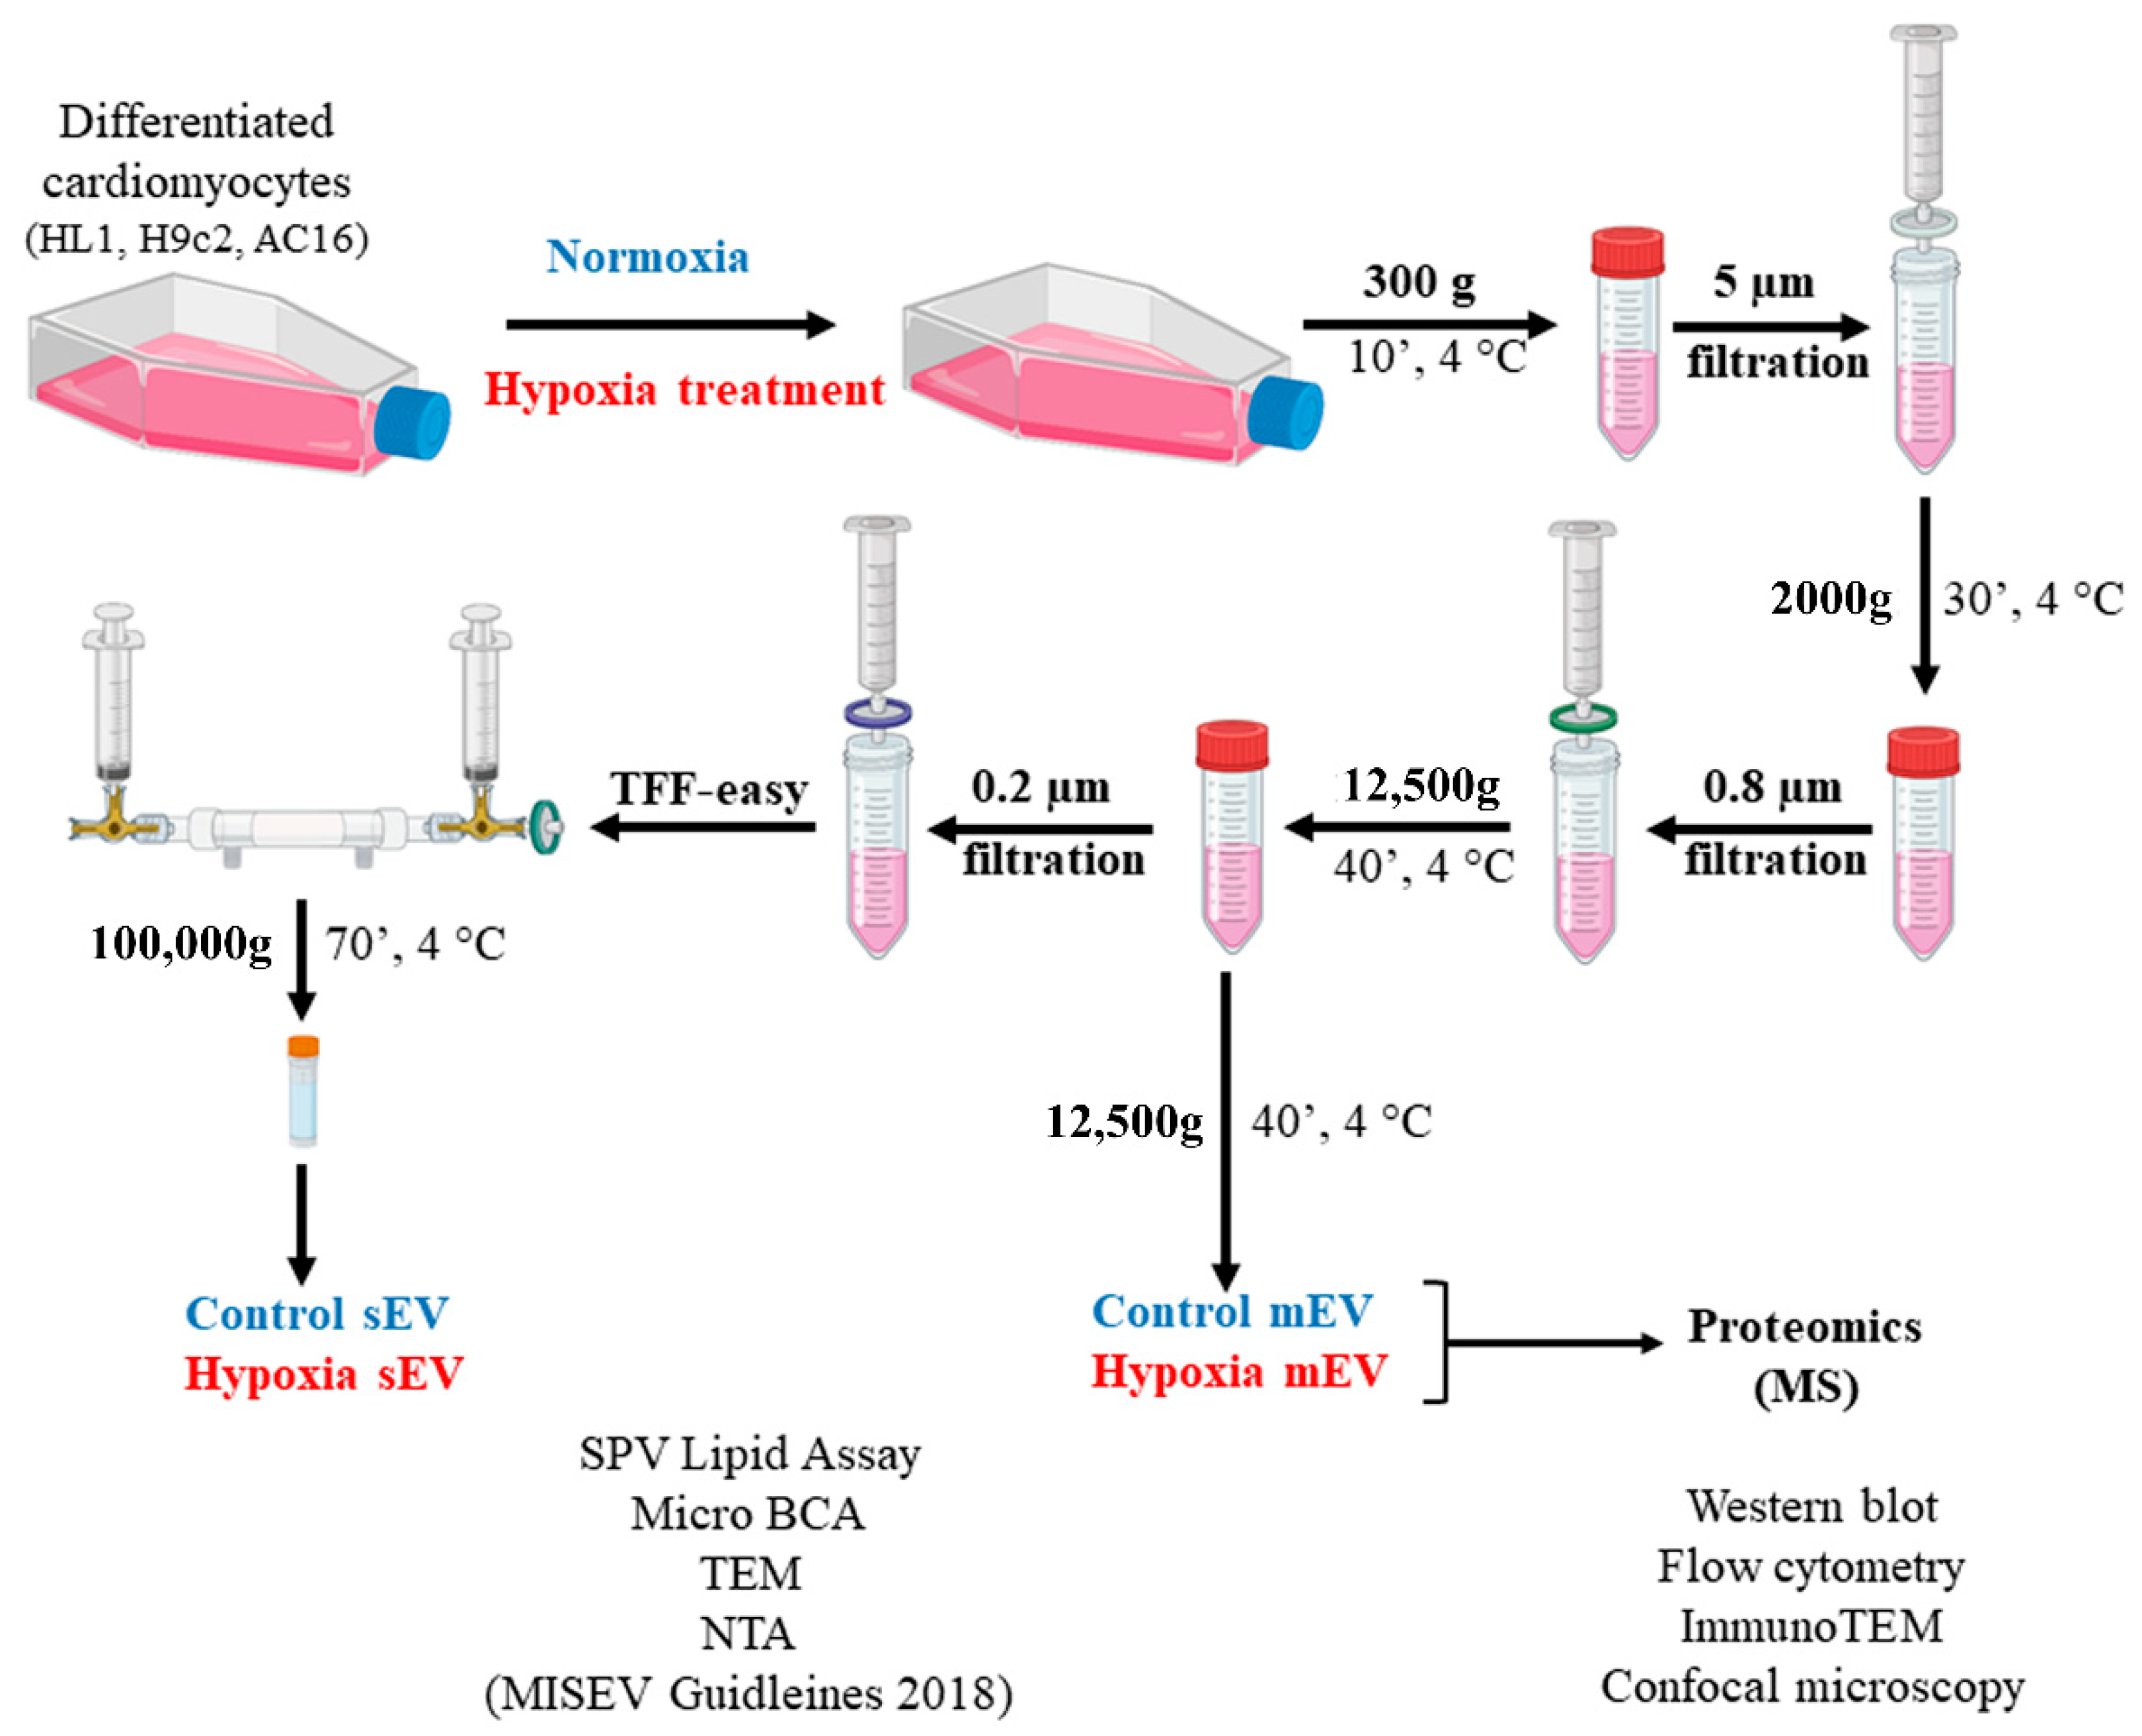
Abstract
:1. Introduction
2. Materials and Methods
2.1. Cell Culture
2.2. EV Separation from Conditioned Cell Culture Medium
2.3. Determination of Protein and Lipid Contents of EVs
2.4. Nanoparticle Tracking Analysis (NTA)
2.5. Mass Spectrometry (MS)
2.6. Detection of EVs by Transmission Electron Microscopy (TEM)
2.7. Flow Cytometry
2.8. Western Blotting
2.9. GFP-ENPL Fusion Protein Expression
Generation of pMAXGFP-ENPL Plasmid
2.10. Transfection of H9c2 and HL1 Cells with pMAXGFP-ENPL Plasmid
2.11. Detection of ENPL by Microscopy
2.11.1. Membrane Staining
2.11.2. Immunocytochemical Detection
2.12. Software and Statistical Analysis
3. Results
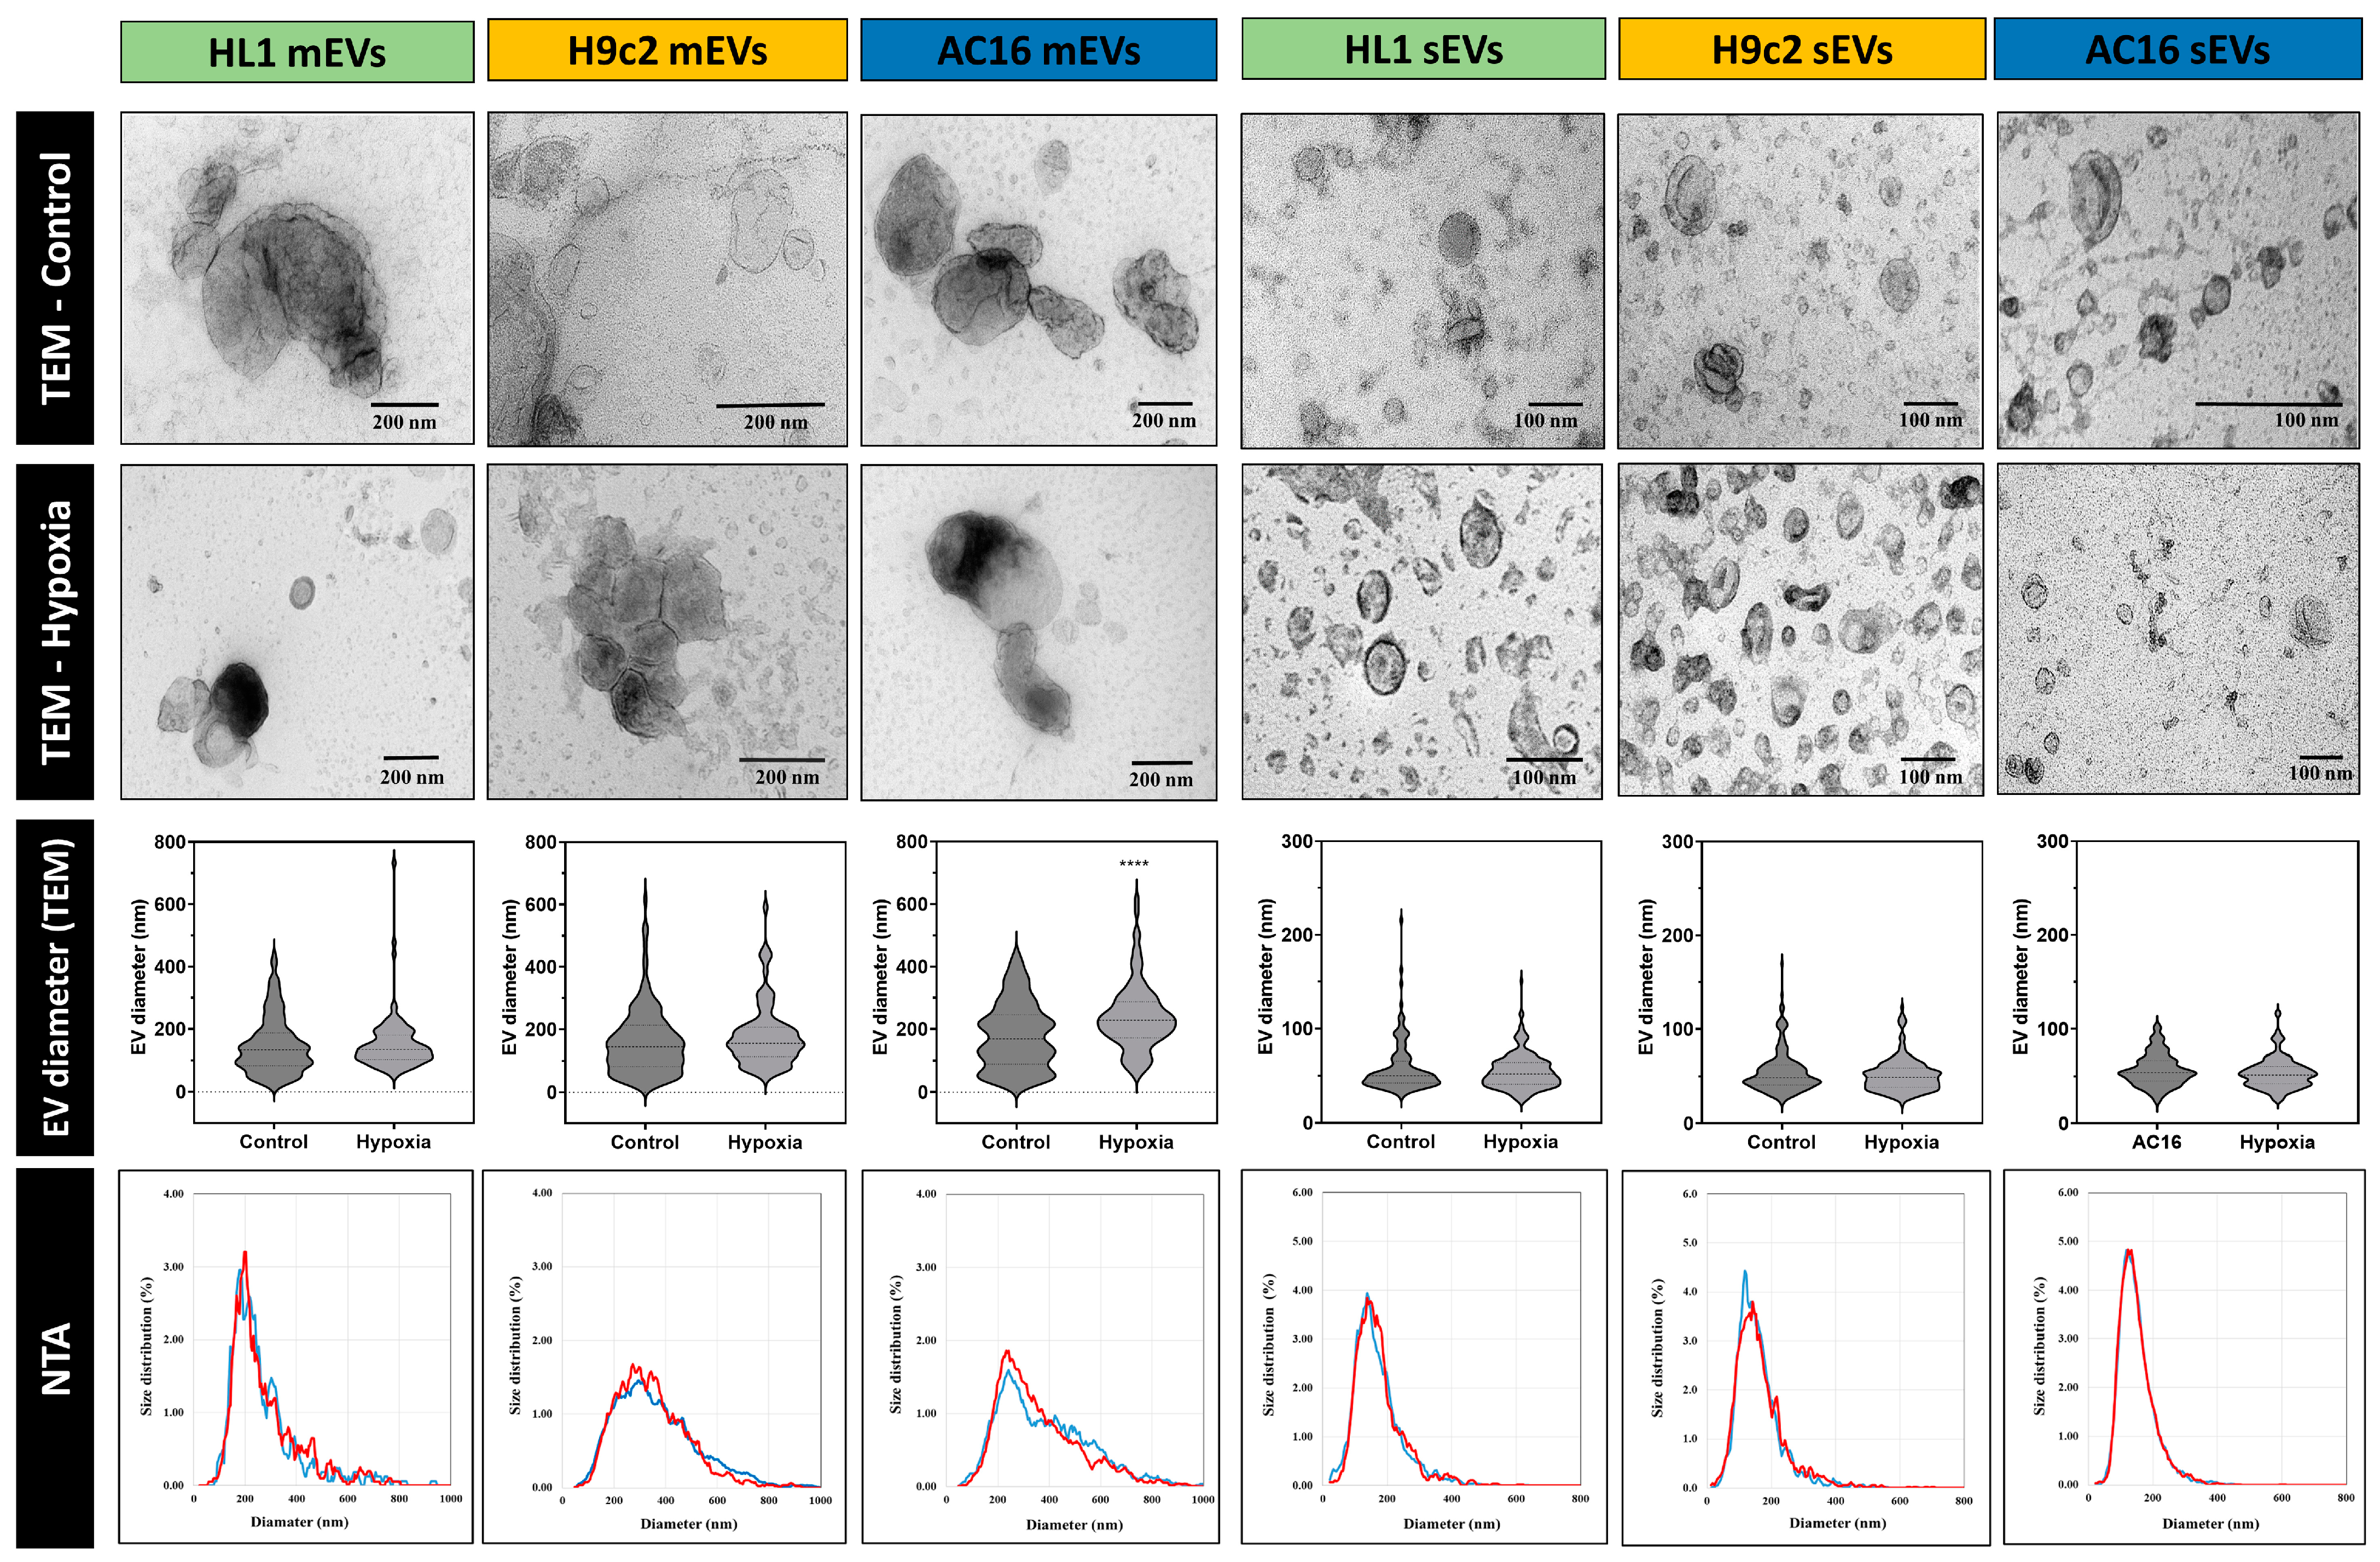
3.1. Characterisation of Small- and Medium-Sized Cardiomyocyte-Derived EVs under Normoxic and Hypoxic Conditions
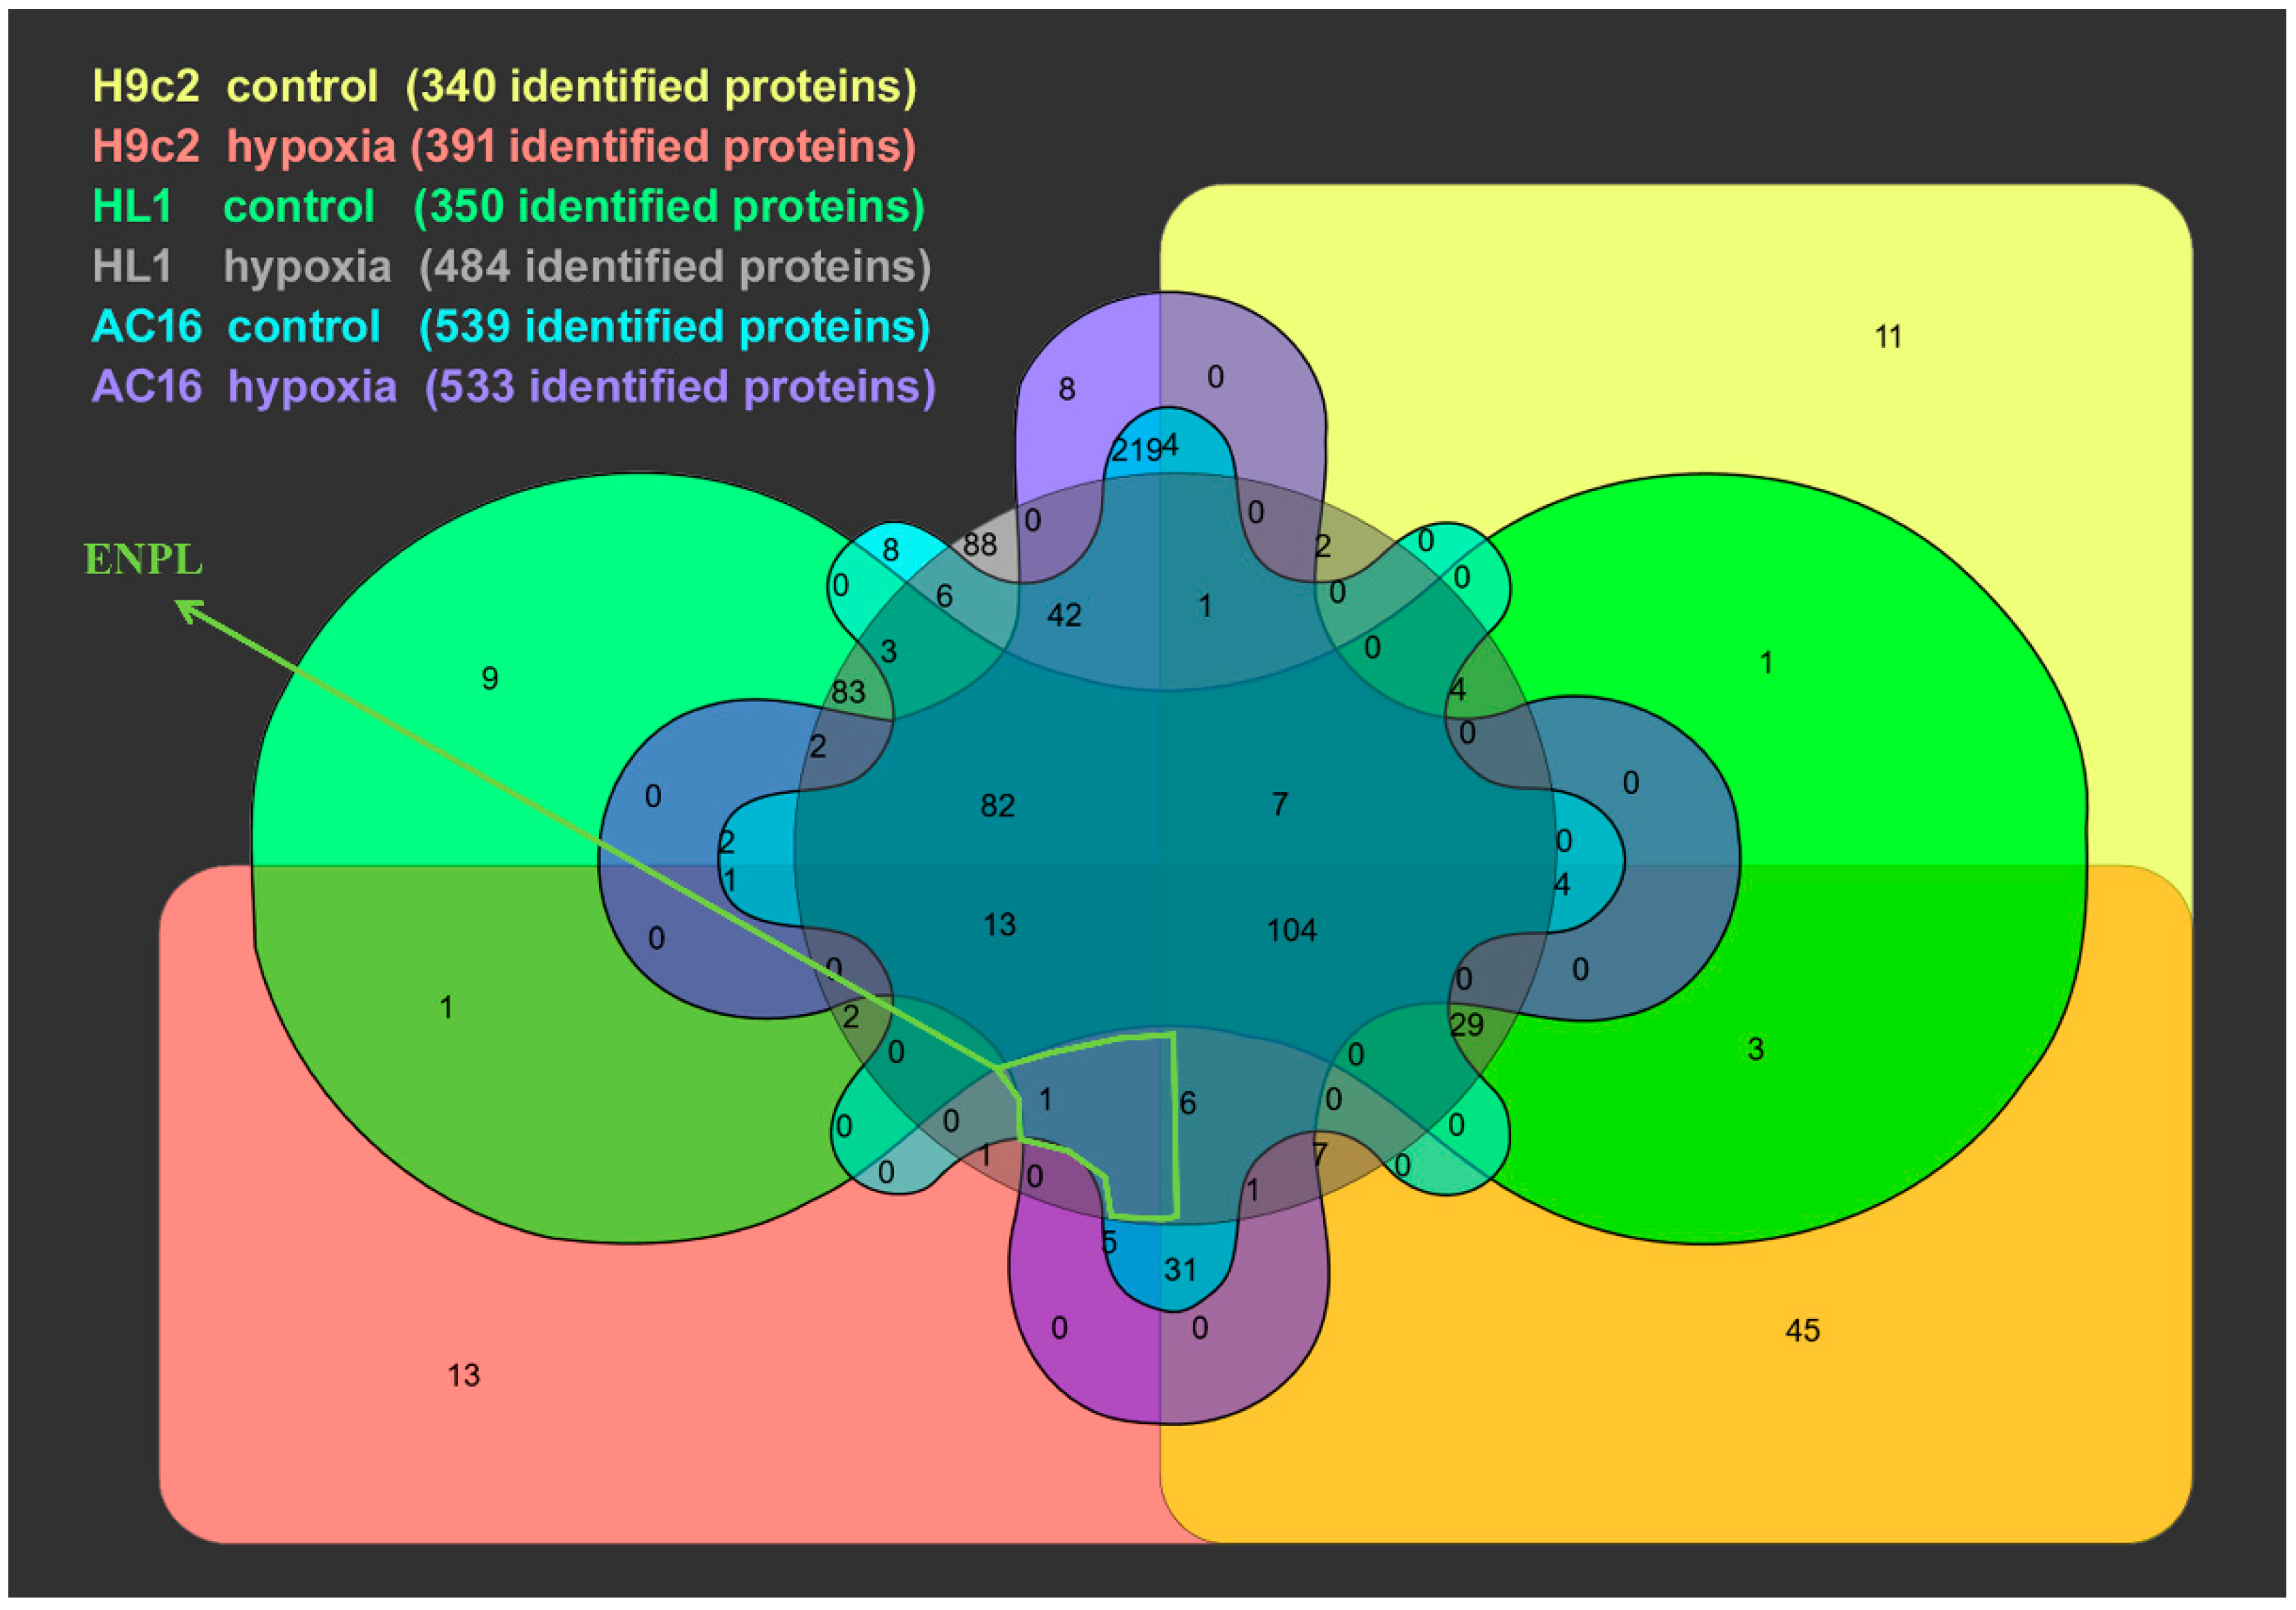
3.2. Proteomic Analysis of Cardiomycyte-Derived Extracellular Vesicle Populations
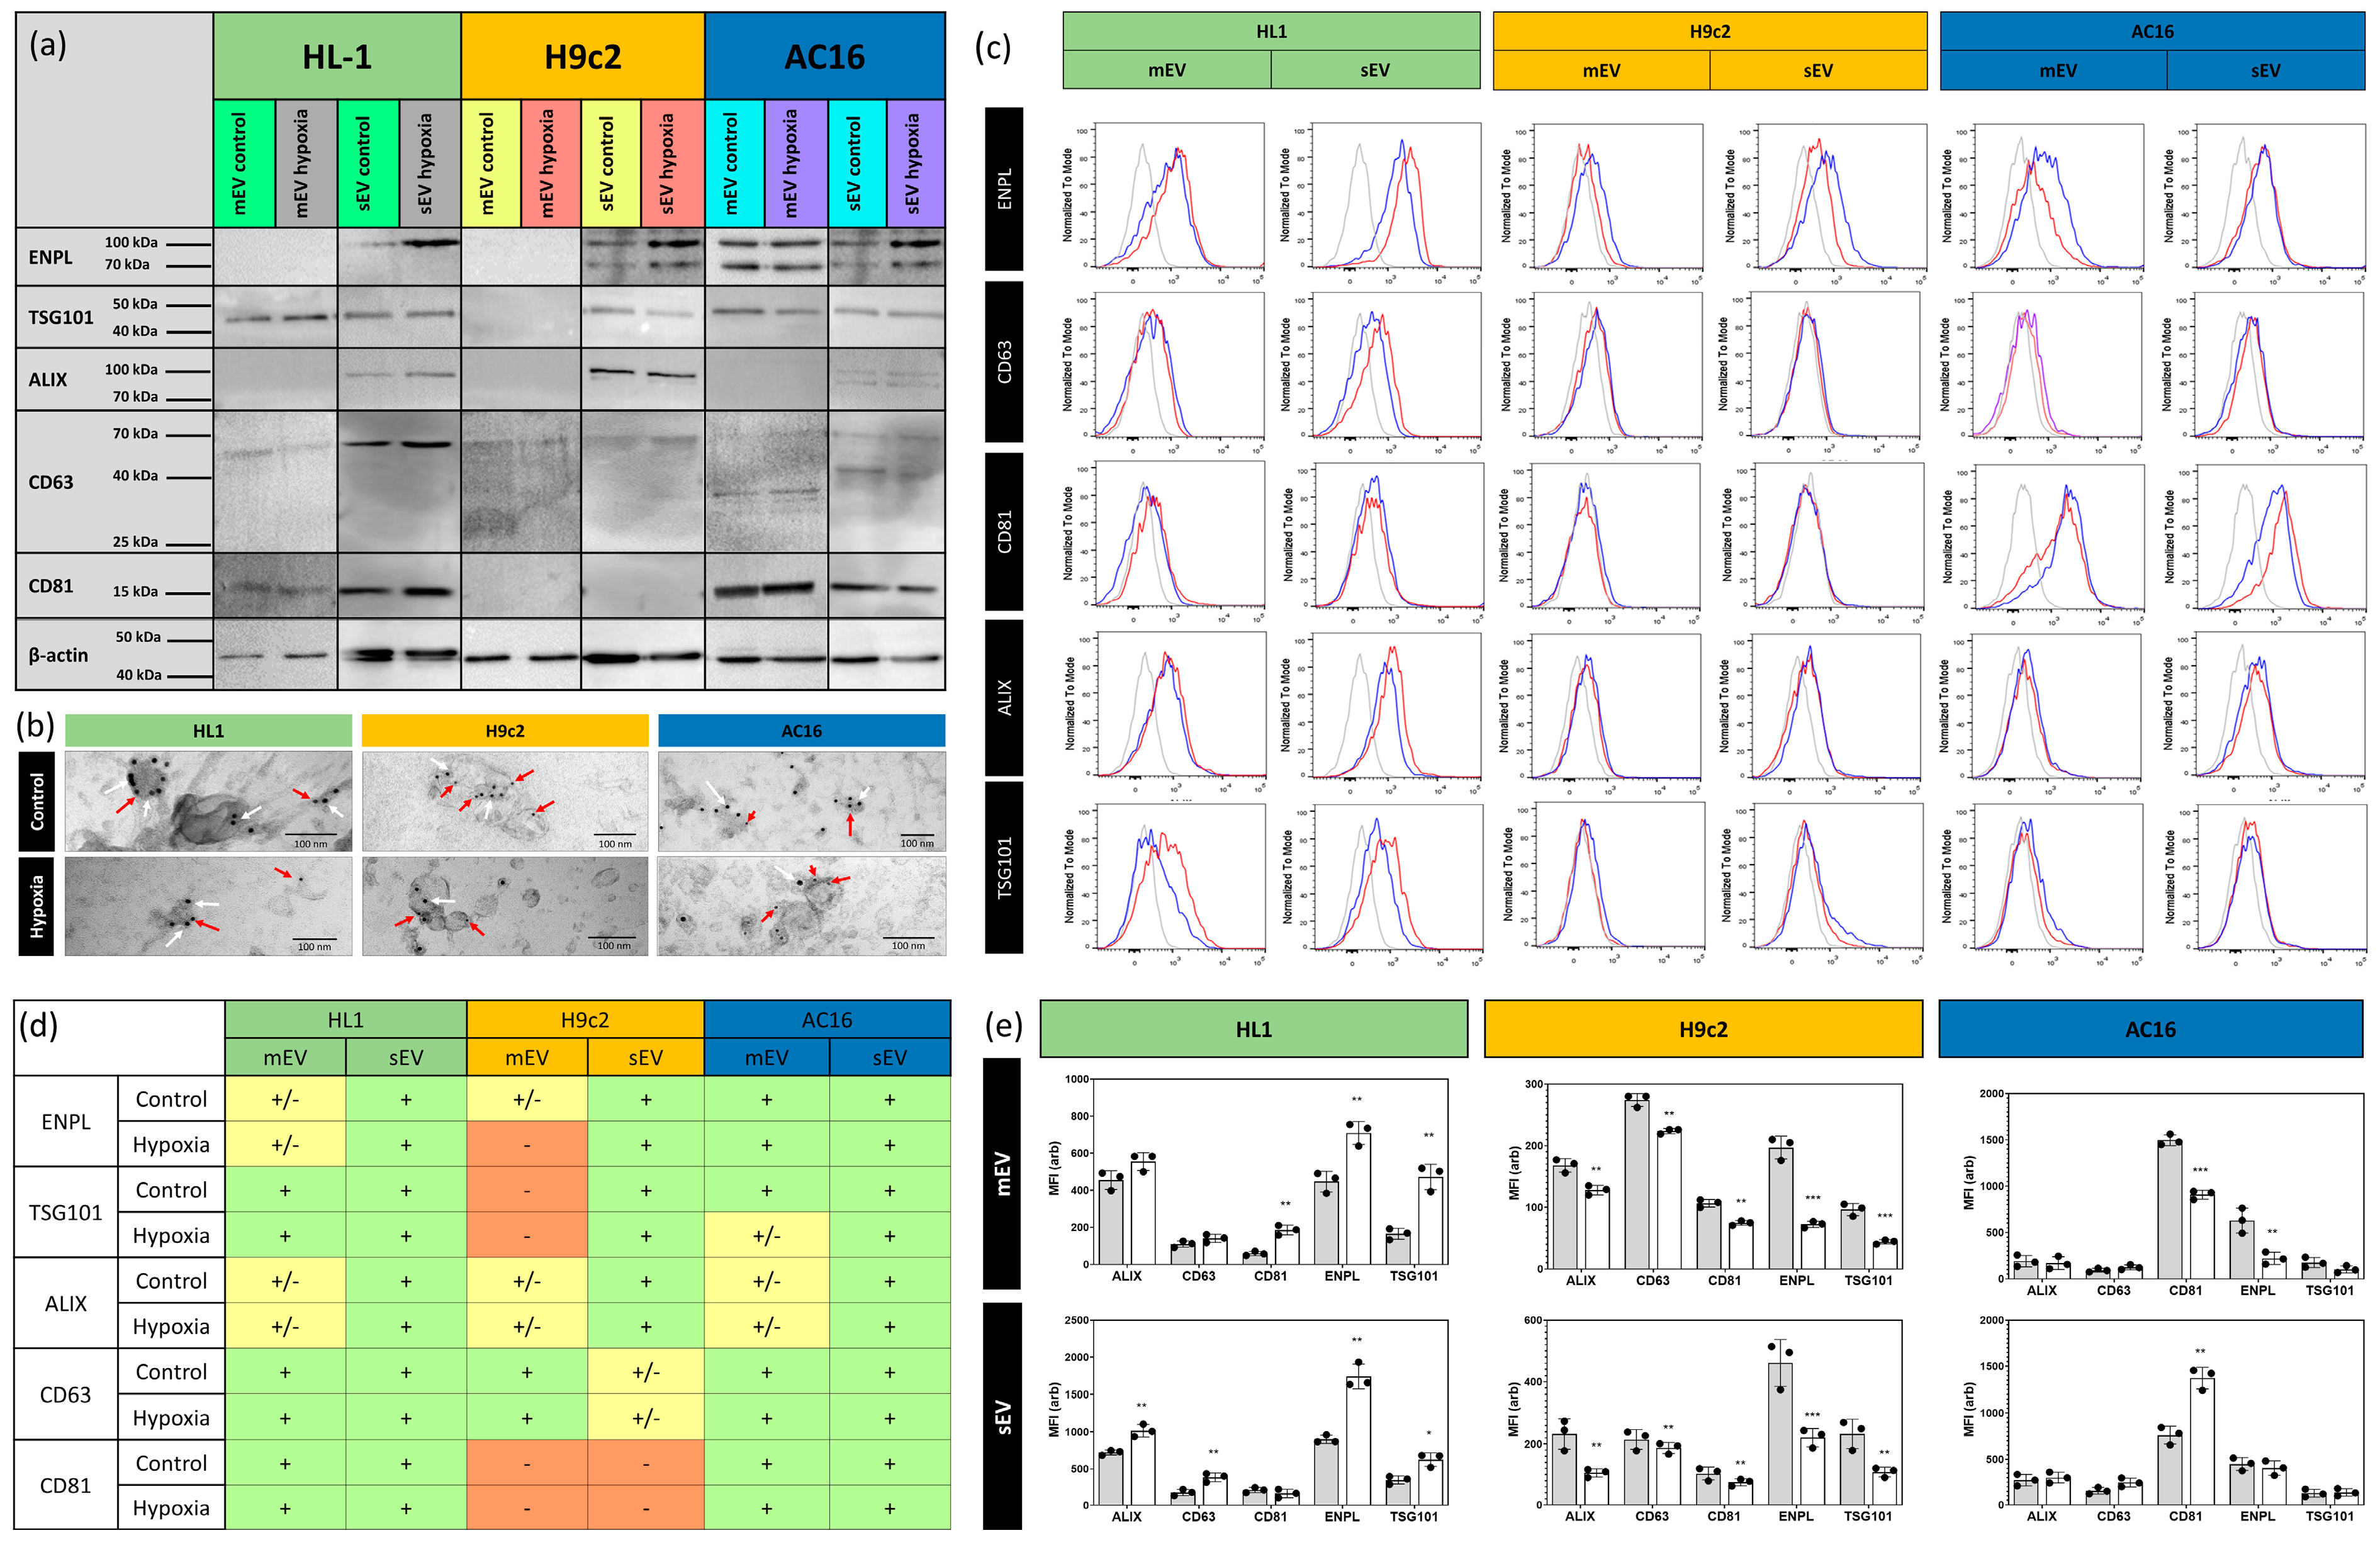
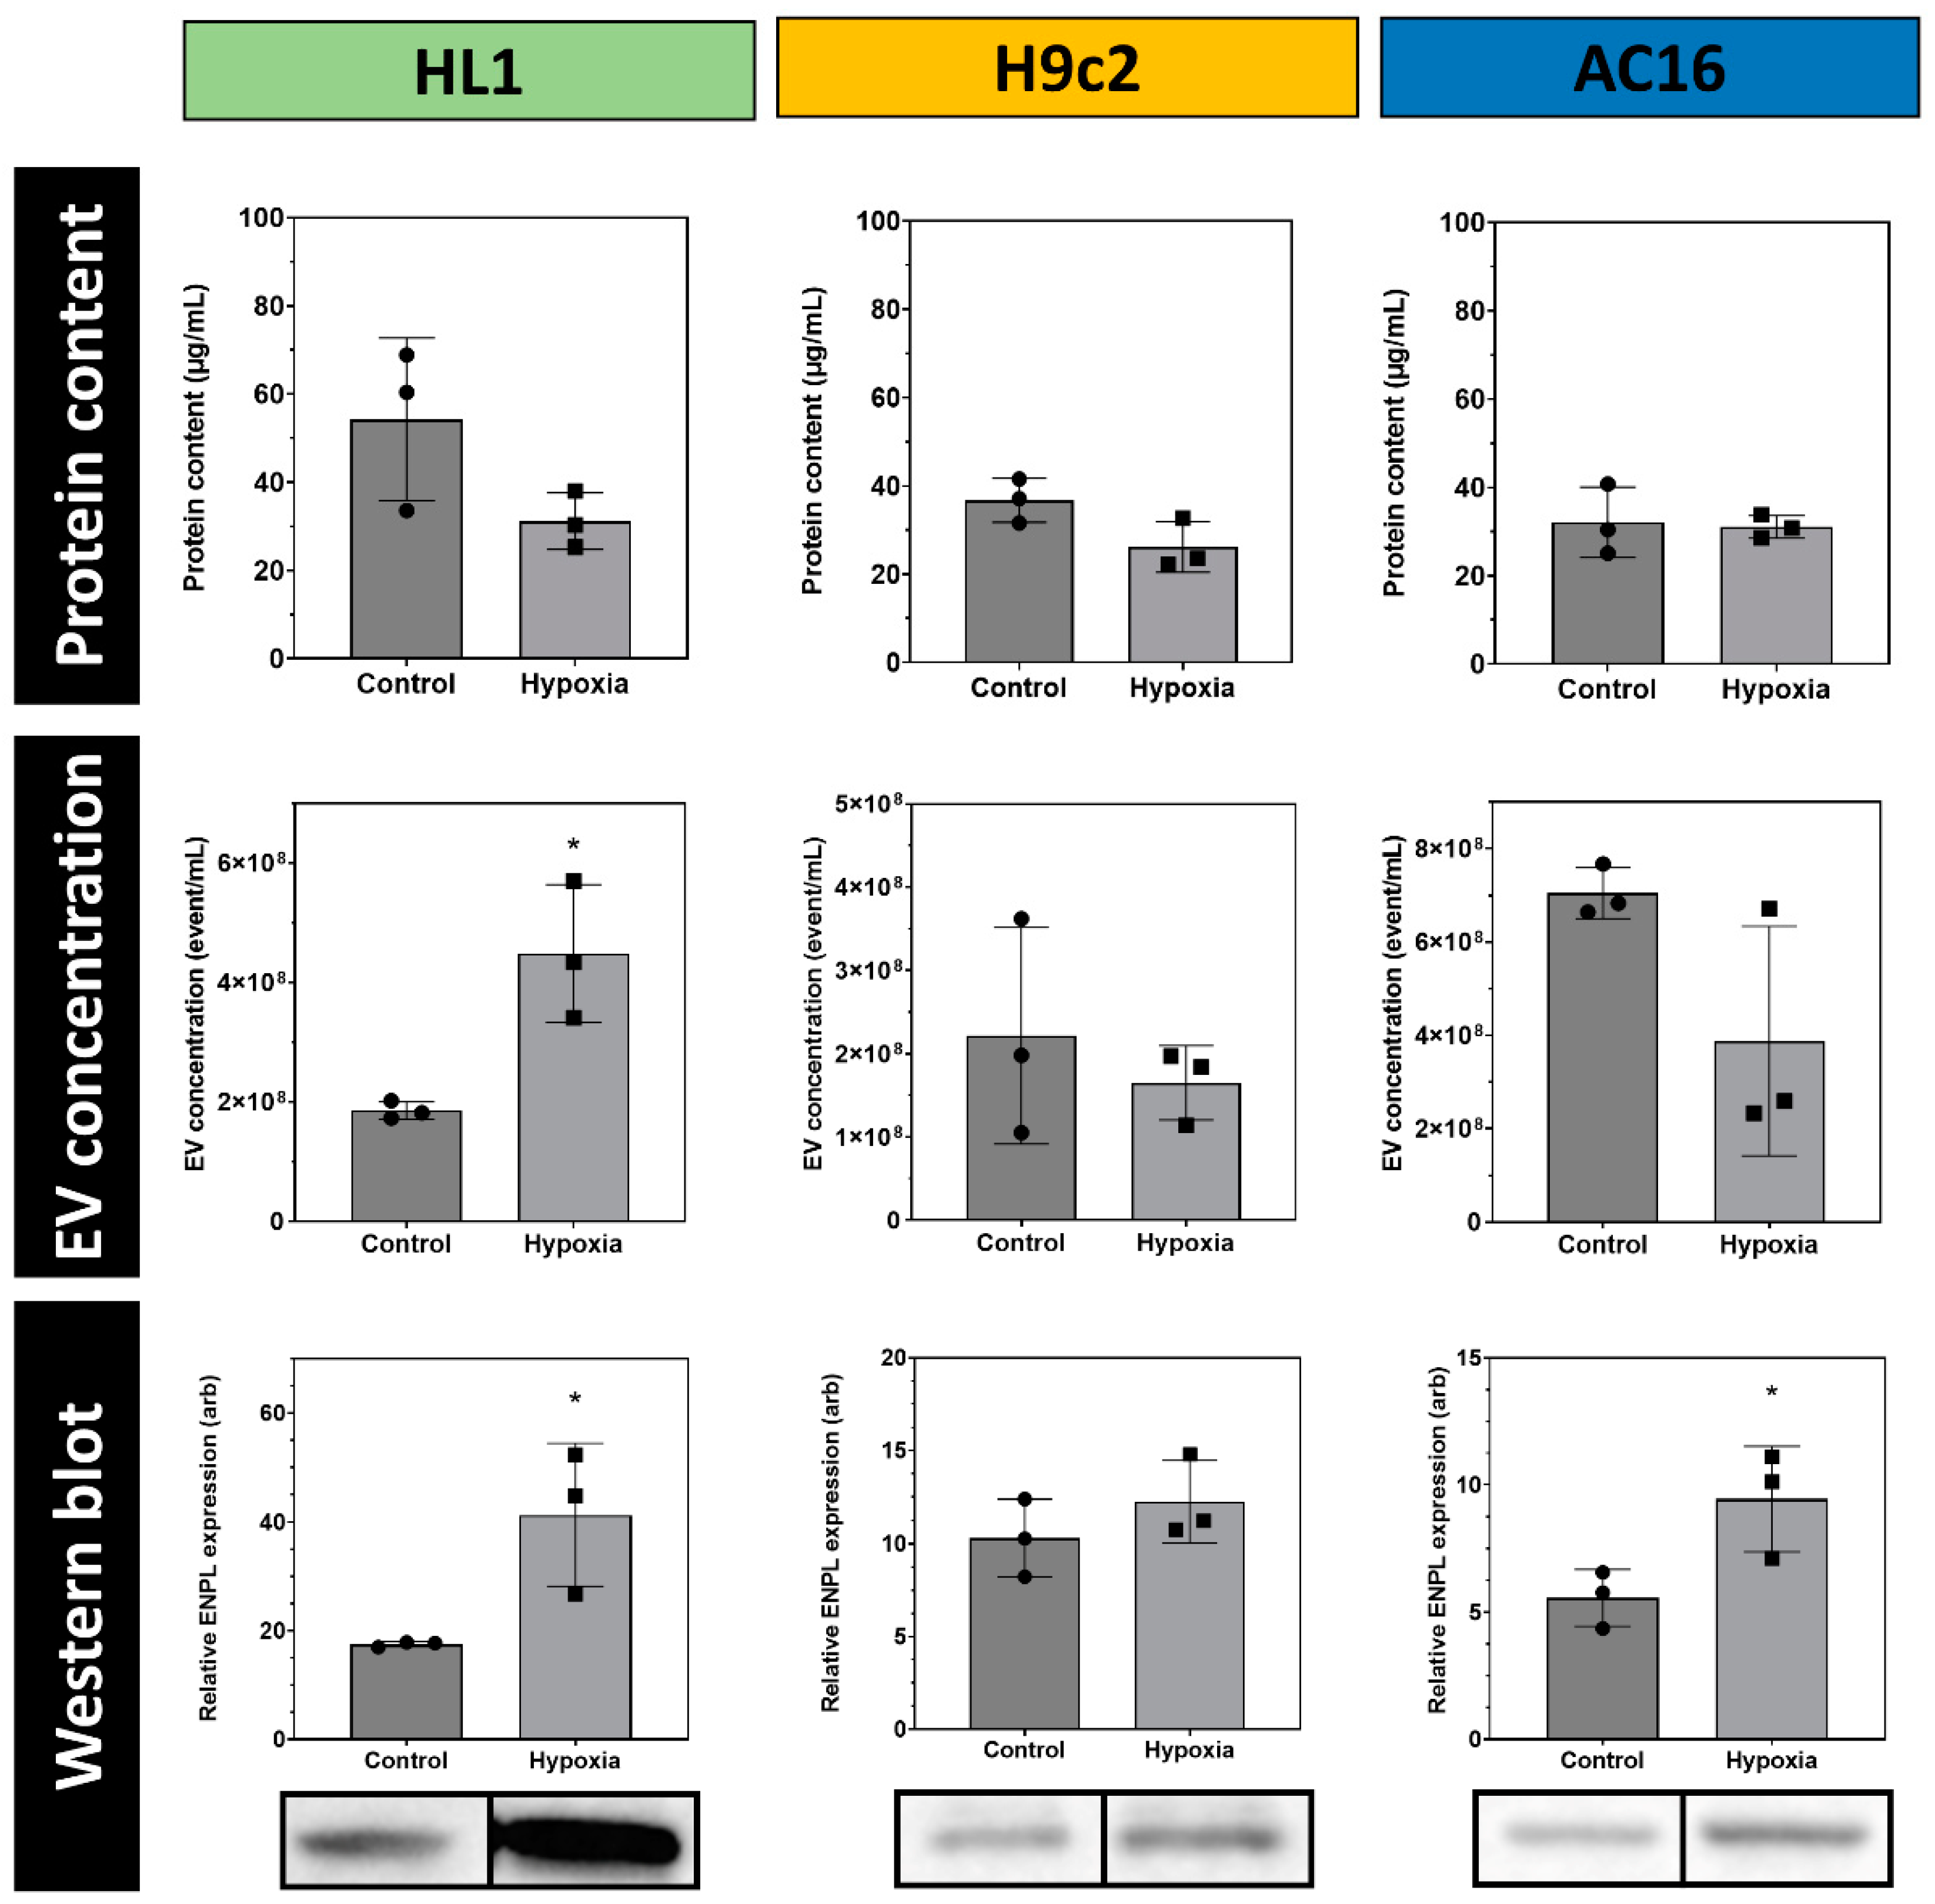
3.3. Quantitative Analysis of Cardiomycyte-Derived Extracellular Vesicles
3.4. Analysis of EV Release in Transfected HL1 Cardiomyocytes
4. Discussion
5. Conclusions
Supplementary Materials
Author Contributions
Funding
Institutional Review Board Statement
Data Availability Statement
Acknowledgments
Conflicts of Interest
References
- Hegyesi, H.; Pallinger, É.; Mecsei, S.; Hornyák, B.; Kovácsházi, C.; Brenner, G.B.; Giricz, Z.; Pálóczi, K.; Kittel, Á.; Tóvári, J.; et al. Circulating cardiomyocyte-derived extracellular vesicles reflect cardiac injury during systemic inflammatory response syndrome in mice. Cell. Mol. Life Sci. 2022, 79, 84. [Google Scholar] [CrossRef]
- Buzás, E.I.; György, B.; Nagy, G.; Falus, A.; Gay, S. Emerging role of extracellular vesicles in inflammatory diseases. Nat. Rev. Rheumatol. 2014, 10, 356–364. [Google Scholar] [CrossRef] [PubMed]
- György, B.; Szabó, T.G.; Pásztói, M.; Pál, Z.; Misják, P.; Aradi, B.; László, V.; Pállinger, É.; Pap, E.; Kittel, Á.; et al. Membrane vesicles, current state-of-the-art: Emerging role of extracellular vesicles. Cell. Mol. Life Sci. 2011, 68, 2667–2688. [Google Scholar] [CrossRef] [PubMed] [Green Version]
- Lötvall, J.; Hill, A.F.; Hochberg, F.; Buzás, E.I.; Di Vizio, D.; Gardiner, C.; Gho, Y.S.; Kurochkin, I.V.; Mathivanan, S.; Quesenberry, P.; et al. Minimal experimental requirements for definition of extracellular vesicles and their functions: A position statement from the International Society for Extracellular Vesicles. J. Extracell. Vesicles 2014, 3, 26913. [Google Scholar] [CrossRef]
- Théry, C.; Witwer, K.W.; Aikawa, E.; Alcaraz, M.J.; Anderson, J.D.; Andriantsitohaina, R.; Antoniou, A.; Arab, T.; Archer, F.; Atkin-Smith, G.K.; et al. Minimal information for studies of extracellular vesicles 2018 (MISEV2018): A position statement of the International Society for Extracellular Vesicles and update of the MISEV2014 guidelines. J. Extracell. Vesicles 2018, 7, 1535750. [Google Scholar] [CrossRef] [PubMed] [Green Version]
- Tkach, M.; Kowal, J.; Théry, C. Why the need and how to approach the functional diversity of extracellular vesicles. Philos. Trans. R. Soc. B Biol. Sci. 2018, 373, 20160479. [Google Scholar] [CrossRef]
- Visnovitz, T.; Osteikoetxea, X.; Sodar, B.W.; Mihaly, J.; Lorincz, P.; Vukman, K.V.; Toth, E.A.; Koncz, A.; Szekacs, I.; Horvath, R.; et al. An improved 96 well plate format lipid quantification assay for standardisation of experiments with extracellular vesicles. J. Extracell. Vesicles 2019, 8, 1565263. [Google Scholar] [CrossRef] [Green Version]
- Verweij, F.J.; Balaj, L.; Boulanger, C.M.; Carter, D.R.F.; Compeer, E.B.; D’Angelo, G.; El Andaloussi, S.; Goetz, J.G.; Gross, J.C.; Hyenne, V.; et al. The power of imaging to understand extracellular vesicle biology in vivo. Nat. Methods 2021, 18, 1013–1026. [Google Scholar] [CrossRef] [PubMed]
- Buzas, E.I. The roles of extracellular vesicles in the immune system. Nat. Rev. Immunol. 2022, 23, 236–250. [Google Scholar] [CrossRef] [PubMed]
- Mathieu, M.; Névo, N.; Jouve, M.; Valenzuela, J.I.; Maurin, M.; Verweij, F.J.; Palmulli, R.; Lankar, D.; Dingli, F.; Loew, D.; et al. Specificities of exosome versus small ectosome secretion revealed by live intracellular tracking of CD63 and CD9. Nat. Commun. 2021, 12, 4389. [Google Scholar] [CrossRef]
- Valcz, G.; Buzás, E.I.; Kittel, Á.; Krenács, T.; Visnovitz, T.; Spisák, S.; Török, G.; Homolya, L.; Zsigrai, S.; Kiszler, G.; et al. En bloc release of MVB-like small extracellular vesicle clusters by colorectal carcinoma cells. J. Extracell. Vesicles 2019, 8, 1596668. [Google Scholar] [CrossRef] [PubMed] [Green Version]
- Zhu, G.; Lee, A.S. Role of the unfolded protein response, GRP78 and GRP94 in organ homeostasis. J. Cell Physiol. 2015, 230, 1413–1420. [Google Scholar] [CrossRef] [Green Version]
- Argon, Y.; Simen, B.B. GRP94, an ER chaperone with protein and peptide binding properties. Semin. Cell Dev. Biol. 1999, 10, 495–505. [Google Scholar] [CrossRef] [PubMed]
- Liu, W.; Chen, M.; Li, X.; Zhao, B.; Hou, J.; Zheng, H.; Qiu, L.; Li, Z.; Meng, S. Interaction of Toll-Like Receptors with the Molecular Chaperone Gp96 Is Essential for Its Activation of Cytotoxic T Lymphocyte Response. PLoS ONE 2016, 11, e0155202. [Google Scholar] [CrossRef] [PubMed] [Green Version]
- Eletto, D.; Dersh, D.; Argon, Y. GRP94 in ER quality control and stress responses. Semin. Cell Dev. Biol. 2010, 21, 479–485. [Google Scholar] [CrossRef] [PubMed] [Green Version]
- Wanderling, S.; Simen, B.B.; Ostrovsky, O.; Ahmed, N.T.; Vogen, S.M.; Gidalevitz, T.; Argon, Y. GRP94 is essential for mesoderm induction and muscle development because it regulates insulin-like growth factor secretion. Mol. Biol. Cell 2007, 18, 3764–3775. [Google Scholar] [CrossRef] [PubMed]
- Vitadello, M.; Ausma, J.; Borgers, M.; Gambino, A.; Casarotto, D.C.; Gorza, L. Increased myocardial GRP94 amounts during sustained atrial fibrillation: A protective response? Circulation 2001, 103, 2201–2206. [Google Scholar] [CrossRef] [Green Version]
- Blackwood, E.A.; Thuerauf, D.J.; Stastna, M.; Stephens, H.; Sand, Z.; Pentoney, A.; Azizi, K.; Jakobi, T.; Van Eyk, J.E.; Katus, H.A.; et al. Proteomic analysis of the cardiac myocyte secretome reveals extracellular protective functions for the ER stress response. J. Mol. Cell. Cardiol. 2020, 143, 132–144. [Google Scholar] [CrossRef] [PubMed]
- Ma, J.-L.; Guo, W.-L.; Chen, X.-M. Overexpressing microRNA-150 attenuates hypoxia-induced human cardiomyocyte cell apoptosis by targeting glucose-regulated protein-94. Mol. Med. Rep. 2018, 17, 4181–4186. [Google Scholar] [CrossRef]
- Vitadello, M.; Penzo, D.; Petronilli, V.; Michieli, G.; Gomirato, S.; Menabo, R.; Di Lisa, F.; Gorza, L. Overexpression of the stress protein Grp94 reduces cardiomyocyte necrosis due to calcium overload and simulated ischemia. FASEB J. 2003, 17, 923–925. [Google Scholar] [CrossRef] [Green Version]
- Jiang, H.; Zhao, H.; Zhang, M.; He, Y.; Li, X.; Xu, Y.; Liu, X. Hypoxia Induced Changes of Exosome Cargo and Subsequent Biological Effects. Front. Immunol. 2022, 13, 824188. [Google Scholar] [CrossRef]
- Sluijter, J.P.G.; Davidson, S.M.; Boulanger, C.M.; Buzás, E.I.; de Kleijn, D.P.V.; Engel, F.B.; Giricz, Z.; Hausenloy, D.J.; Kishore, R.; Lecour, S.; et al. Extracellular vesicles in diagnostics and therapy of the ischaemic heart: Position Paper from the Working Group on Cellular Biology of the Heart of the European Society of Cardiology. Cardiovasc. Res. 2018, 114, 19–34. [Google Scholar] [CrossRef] [PubMed] [Green Version]
- Gupta, S.; Knowlton, A.A. HSP60 trafficking in adult cardiac myocytes: Role of the exosomal pathway. Am. J. Physiol.-Heart Circ. Physiol. 2007, 292, H3052–H3056. [Google Scholar] [CrossRef] [PubMed] [Green Version]
- Onódi, Z.; Visnovitz, T.; Kiss, B.; Hambalkó, S.; Koncz, A.; Ágg, B.; Váradi, B.; Tóth, V.É.; Nagy, R.N.; Gergely, T.G.; et al. Systematic transcriptomic and phenotypic characterization of human and murine cardiac myocyte cell lines and primary cardiomyocytes reveals serious limitations and low resemblances to adult cardiac phenotype. J. Mol. Cell. Cardiol. 2022, 165, 19–30. [Google Scholar] [CrossRef] [PubMed]
- Davidson, M.M.; Nesti, C.; Palenzuela, L.; Walker, W.F.; Hernandez, E.; Protas, L.; Hirano, M.; Isaac, N.D. Novel cell lines derived from adult human ventricular cardiomyocytes. J. Mol. Cell. Cardiol. 2005, 39, 133–147. [Google Scholar] [CrossRef]
- Ménard, C.; Pupier, S.; Mornet, D.; Kitzmann, M.; Nargeot, J.; Lory, P. Modulation of L-type Calcium Channel Expression during Retinoic Acid-induced Differentiation of H9C2 Cardiac Cells. J. Biol. Chem. 1999, 274, 29063–29070. [Google Scholar] [CrossRef] [Green Version]
- Németh, K.; Varga, Z.; Lenzinger, D.; Visnovitz, T.; Koncz, A.; Hegedűs, N.; Kittel, Á.; Máthé, D.; Szigeti, K.; Lőrincz, P.; et al. Extracellular vesicle release and uptake by the liver under normo- and hyperlipidemia. Cell. Mol. Life Sci. 2021, 78, 7589–7604. [Google Scholar] [CrossRef]
- Osteikoetxea, X.; Balogh, A.; Szabó-Taylor, K.; Németh, A.; Szabó, T.G.; Pálóczi, K.; Sódar, B.; Kittel, Á.; György, B.; Pállinger, É.; et al. Improved Characterization of EV Preparations Based on Protein to Lipid Ratio and Lipid Properties. PLoS ONE 2015, 10, e0121184. [Google Scholar] [CrossRef] [Green Version]
- White, S.M.; Constantin, P.E.; Claycomb, W.C. Cardiac physiology at the cellular level: Use of cultured HL-1 cardiomyocytes for studies of cardiac muscle cell structure and function. Am. J. Physiol.-Heart Circ. Physiol. 2004, 286, H823–H829. [Google Scholar] [CrossRef] [Green Version]
- Tóth, E.Á.; Turiák, L.; Visnovitz, T.; Cserép, C.; Mázló, A.; Sódar, B.W.; Försönits, A.I.; Petővári, G.; Sebestyén, A.; Komlósi, Z.; et al. Formation of a protein corona on the surface of extracellular vesicles in blood plasma. J. Extracell. Vesicles 2021, 10, e12140. [Google Scholar] [CrossRef]
- Buzas, E.I. Opportunities and challenges in studying the extracellular vesicle corona. Nat. Cell Biol. 2022, 24, 1322–1325. [Google Scholar] [CrossRef] [PubMed]
- Kelemen, A.; Carmi, I.; Oszvald, Á.; Lőrincz, P.; Petővári, G.; Tölgyes, T.; Dede, K.; Bursics, A.; Buzás, E.I.; Wiener, Z. IFITM1 expression determines extracellular vesicle uptake in colorectal cancer. Cell. Mol. Life Sci. 2021, 78, 7009–7024. [Google Scholar] [CrossRef] [PubMed]
- Turiák, L.; Misják, P.; Szabó, T.G.; Aradi, B.; Pálóczi, K.; Ozohanics, O.; Drahos, L.; Kittel, A.; Falus, A.; Buzás, E.I.; et al. Proteomic characterization of thymocyte-derived microvesicles and apoptotic bodies in BALB/c mice. J. Proteom. 2011, 74, 2025–2033. [Google Scholar] [CrossRef]
- Thery, C.; Amigorena, S.; Raposo, G.; Clayton, A. Isolation and characterization of exosomes from cell culture supernatants and biological fluids. Curr. Protoc. Cell Biol. 2006, 3, cb0322s30. [Google Scholar] [CrossRef] [PubMed]
- Jogikalmath, G. Method for Blocking Non-Specific Protein Binding on a Functionalized Surface. U.S. Patent US20080213910A1, 4 September 2008. [Google Scholar]
- Koontz, L. TCA precipitation. Methods Enzym. 2014, 541, 3–10. [Google Scholar] [CrossRef]
- Laemmli, U.K. Cleavage of Structural Proteins during the Assembly of the Head of Bacteriophage T4. Nature 1970, 227, 680–685. [Google Scholar] [CrossRef]
- Visnovitz, T.; Solti, Á.; Csikós, G.; Fricke, W. Plasma membrane H+-ATPase gene expression, protein level and activity in growing and non-growing regions of barley (Hordeum vulgare) leaves. Physiol. Plant. 2012, 144, 382–393. [Google Scholar] [CrossRef]
- Vukman, K.V.; Ferencz, A.; Fehér, D.; Juhos, K.; Lőrincz, P.; Visnovitz, T.; Koncz, A.; Pálóczi, K.; Seregélyes, G.; Försönits, A.; et al. An implanted device enables in vivo monitoring of extracellular vesicle-mediated spread of pro-inflammatory mast cell response in mice. J. Extracell. Vesicles 2020, 10, e12023. [Google Scholar] [CrossRef]
- Samy, A.; Yamano-Adachi, N.; Koga, Y.; Omasa, T. Secretion of a low-molecular-weight species of endogenous GRP94 devoid of the KDEL motif during endoplasmic reticulum stress in Chinese hamster ovary cells. Traffic 2021, 22, 425–438. [Google Scholar] [CrossRef]
- Suárez, H.; Gámez-Valero, A.; Reyes, R.; López-Martín, S.; Rodríguez, M.J.; Carrascosa, J.L.; Cabañas, C.; Borràs, F.E.; Yáñez-Mó, M. A bead-assisted flow cytometry method for the semi-quantitative analysis of Extracellular Vesicles. Sci. Rep. 2017, 7, 11271. [Google Scholar] [CrossRef] [Green Version]
- Couch, Y.; Buzàs, E.I.; Di Vizio, D.; Gho, Y.S.; Harrison, P.; Hill, A.F.; Lötvall, J.; Raposo, G.; Stahl, P.D.; Théry, C.; et al. A brief history of nearly EV-erything—The rise and rise of extracellular vesicles. J. Extracell. Vesicles 2021, 10, e12144. [Google Scholar] [CrossRef] [PubMed]
- Yan, P.; Patel, H.J.; Sharma, S.; Corben, A.; Wang, T.; Panchal, P.; Yang, C.; Sun, W.; Araujo, T.L.; Rodina, A.; et al. Molecular Stressors Engender Protein Connectivity Dysfunction through Aberrant N-Glycosylation of a Chaperone. Cell Rep. 2020, 31, 107840. [Google Scholar] [CrossRef]
- Kozutsumi, Y.; Segal, M.; Normington, K.; Gething, M.J.; Sambrook, J. The presence of malfolded proteins in the endoplasmic reticulum signals the induction of glucose-regulated proteins. Nature 1988, 332, 462–464. [Google Scholar] [CrossRef]
- Furmanik, M.; van Gorp, R.; Whitehead, M.; Ahmad, S.; Bordoloi, J.; Kapustin, A.; Schurgers, L.J.; Shanahan, C.M. Endoplasmic Reticulum Stress Mediates Vascular Smooth Muscle Cell Calcification via Increased Release of Grp78 (Glucose-Regulated Protein, 78 kDa)-Loaded Extracellular Vesicles. Arterioscler. Thromb. Vasc. Biol. 2021, 41, 898–914. [Google Scholar] [CrossRef]
- Barman, B.; Sung, B.H.; Krystofiak, E.; Ping, J.; Ramirez, M.; Millis, B.; Allen, R.; Prasad, N.; Chetyrkin, S.; Calcutt, M.W.; et al. VAP-A and its binding partner CERT drive biogenesis of RNA-containing extracellular vesicles at ER membrane contact sites. Dev. Cell 2022, 57, 974–994.e978. [Google Scholar] [CrossRef]


Disclaimer/Publisher’s Note: The statements, opinions and data contained in all publications are solely those of the individual author(s) and contributor(s) and not of MDPI and/or the editor(s). MDPI and/or the editor(s) disclaim responsibility for any injury to people or property resulting from any ideas, methods, instructions or products referred to in the content. |
© 2023 by the authors. Licensee MDPI, Basel, Switzerland. This article is an open access article distributed under the terms and conditions of the Creative Commons Attribution (CC BY) license (https://creativecommons.org/licenses/by/4.0/).
Share and Cite
Koncz, A.; Turiák, L.; Németh, K.; Lenzinger, D.; Bárkai, T.; Lőrincz, P.; Zelenyánszki, H.; Vukman, K.V.; Buzás, E.I.; Visnovitz, T. Endoplasmin Is a Hypoxia-Inducible Endoplasmic Reticulum-Derived Cargo of Extracellular Vesicles Released by Cardiac Cell Lines. Membranes 2023, 13, 431. https://doi.org/10.3390/membranes13040431
Koncz A, Turiák L, Németh K, Lenzinger D, Bárkai T, Lőrincz P, Zelenyánszki H, Vukman KV, Buzás EI, Visnovitz T. Endoplasmin Is a Hypoxia-Inducible Endoplasmic Reticulum-Derived Cargo of Extracellular Vesicles Released by Cardiac Cell Lines. Membranes. 2023; 13(4):431. https://doi.org/10.3390/membranes13040431
Chicago/Turabian StyleKoncz, Anna, Lilla Turiák, Krisztina Németh, Dorina Lenzinger, Tünde Bárkai, Péter Lőrincz, Helga Zelenyánszki, Krisztina V. Vukman, Edit I. Buzás, and Tamás Visnovitz. 2023. "Endoplasmin Is a Hypoxia-Inducible Endoplasmic Reticulum-Derived Cargo of Extracellular Vesicles Released by Cardiac Cell Lines" Membranes 13, no. 4: 431. https://doi.org/10.3390/membranes13040431