
Improving Structural Homogeneity, Hydraulic Permeability, and Mechanical Performance of Asymmetric Monophasic Cellulose Acetate/Silica Membranes: Spinodal Decomposition Mix


Abstract
:1. Introduction
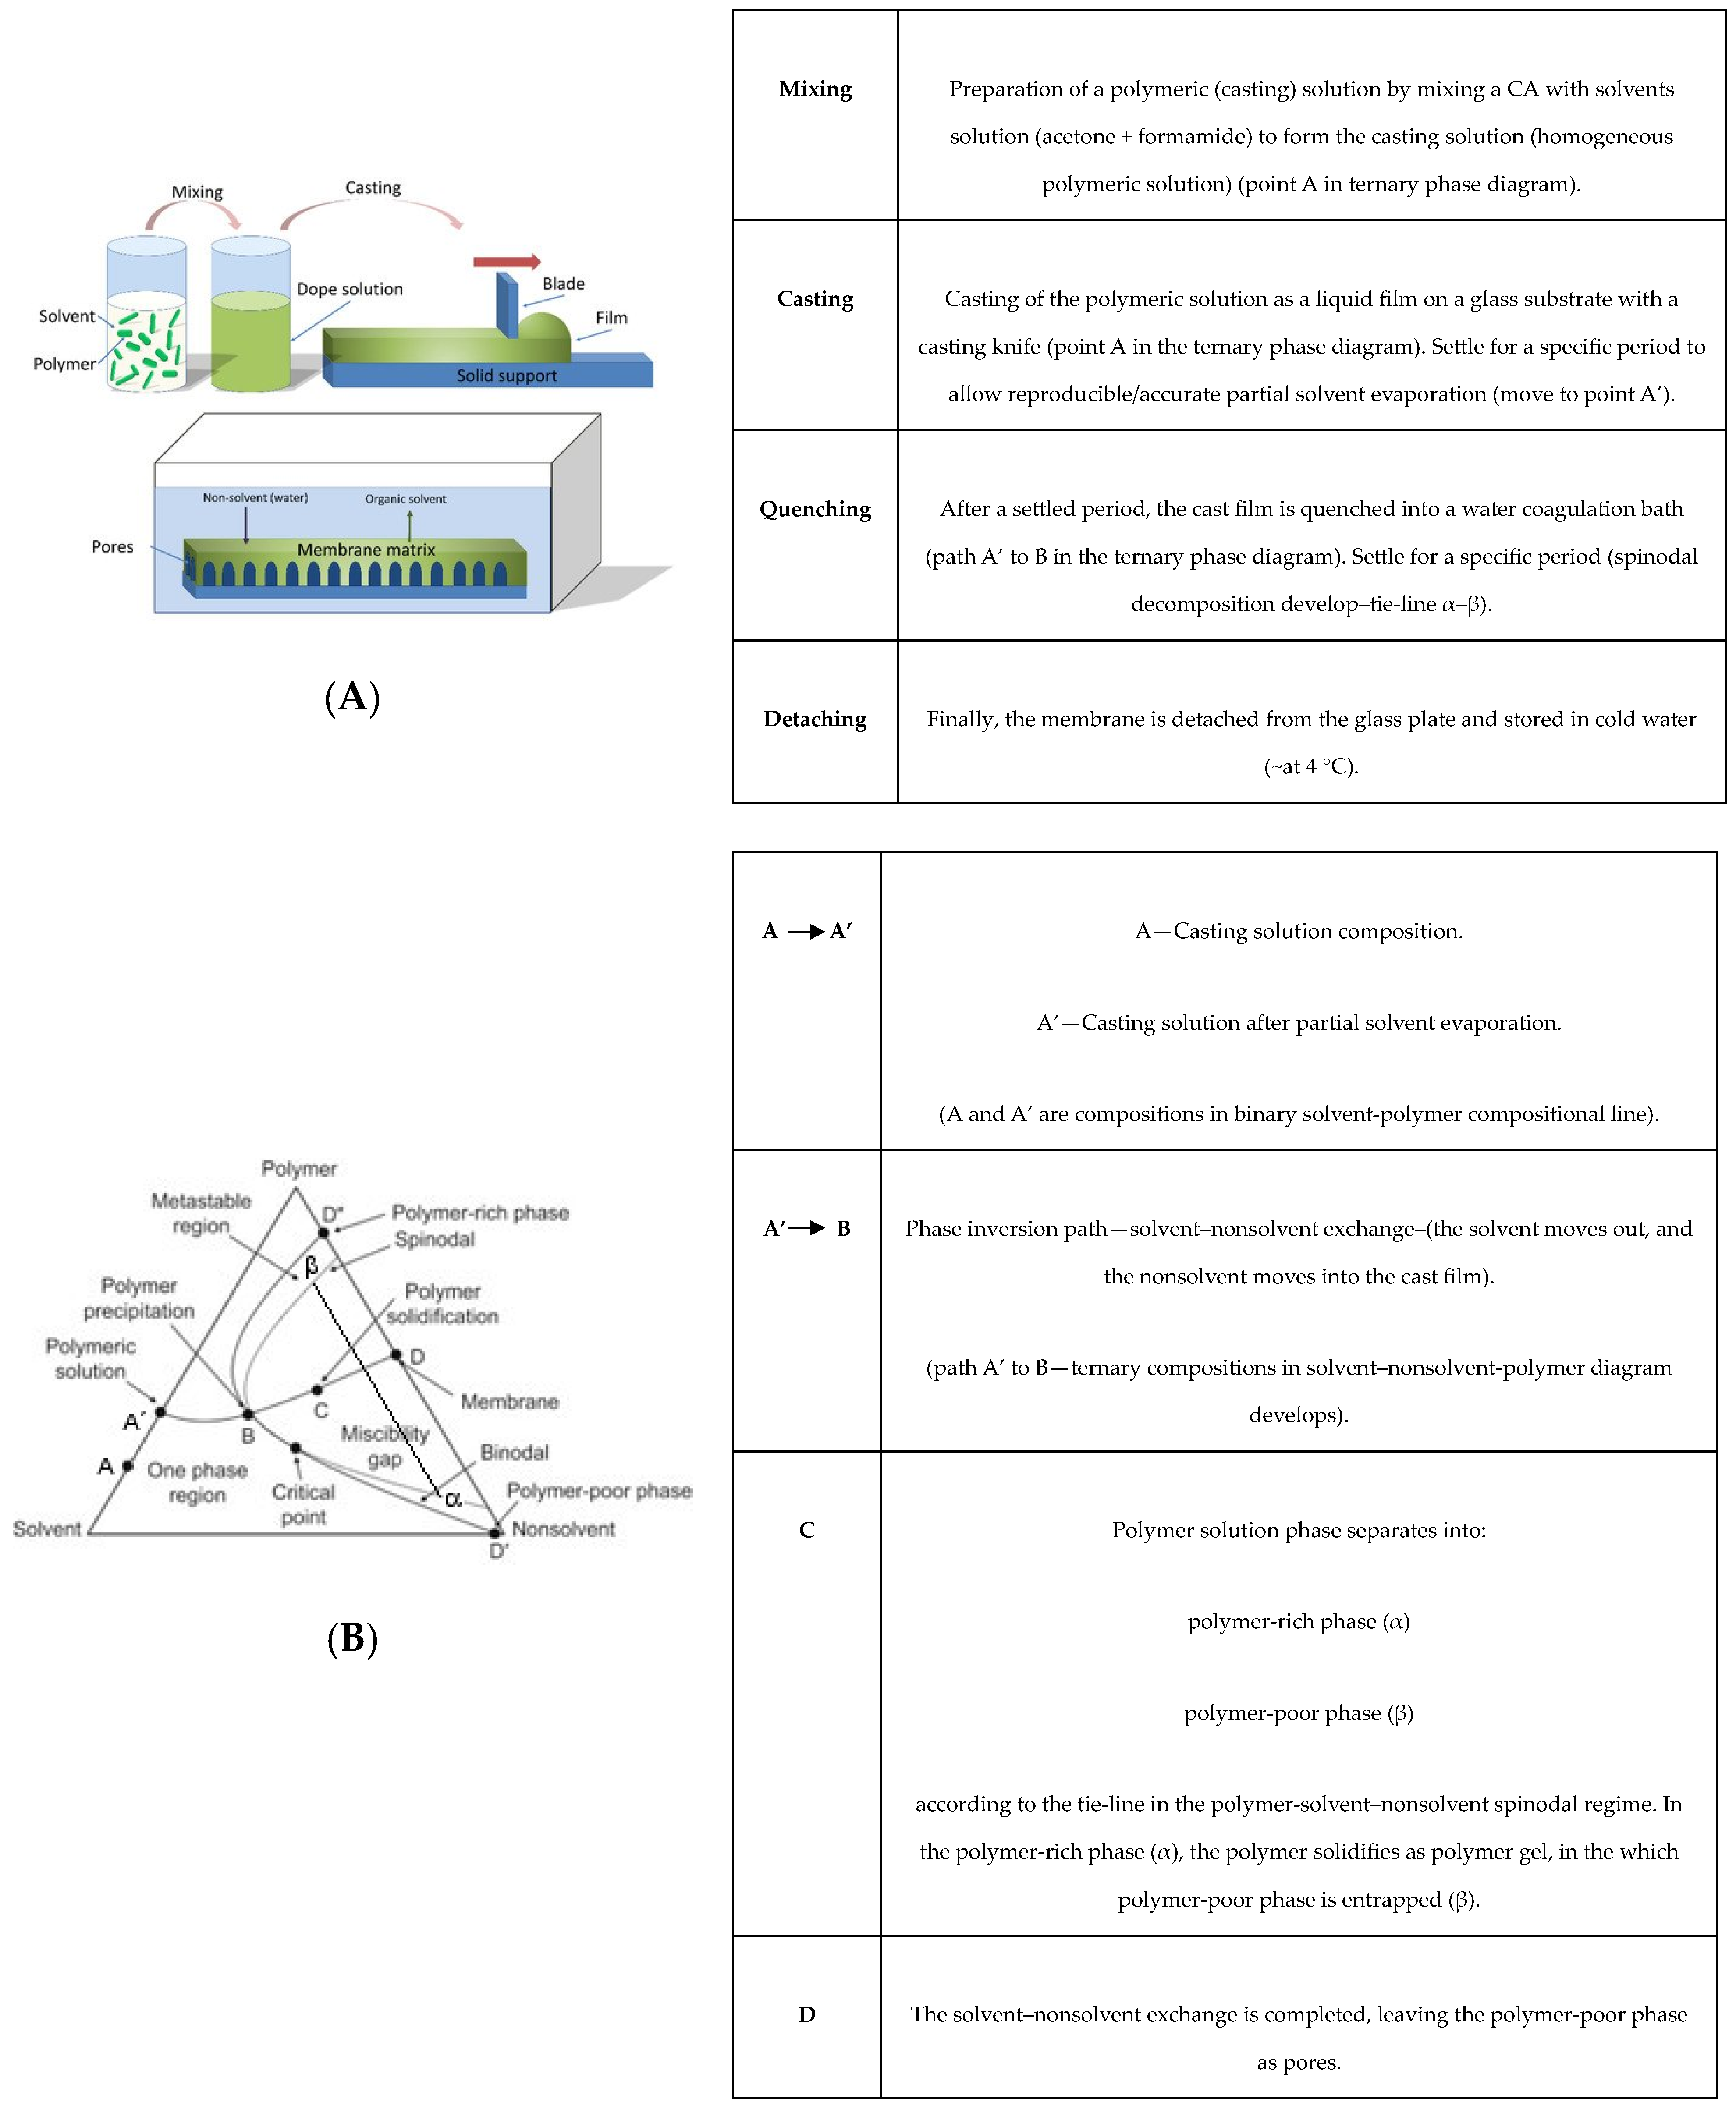
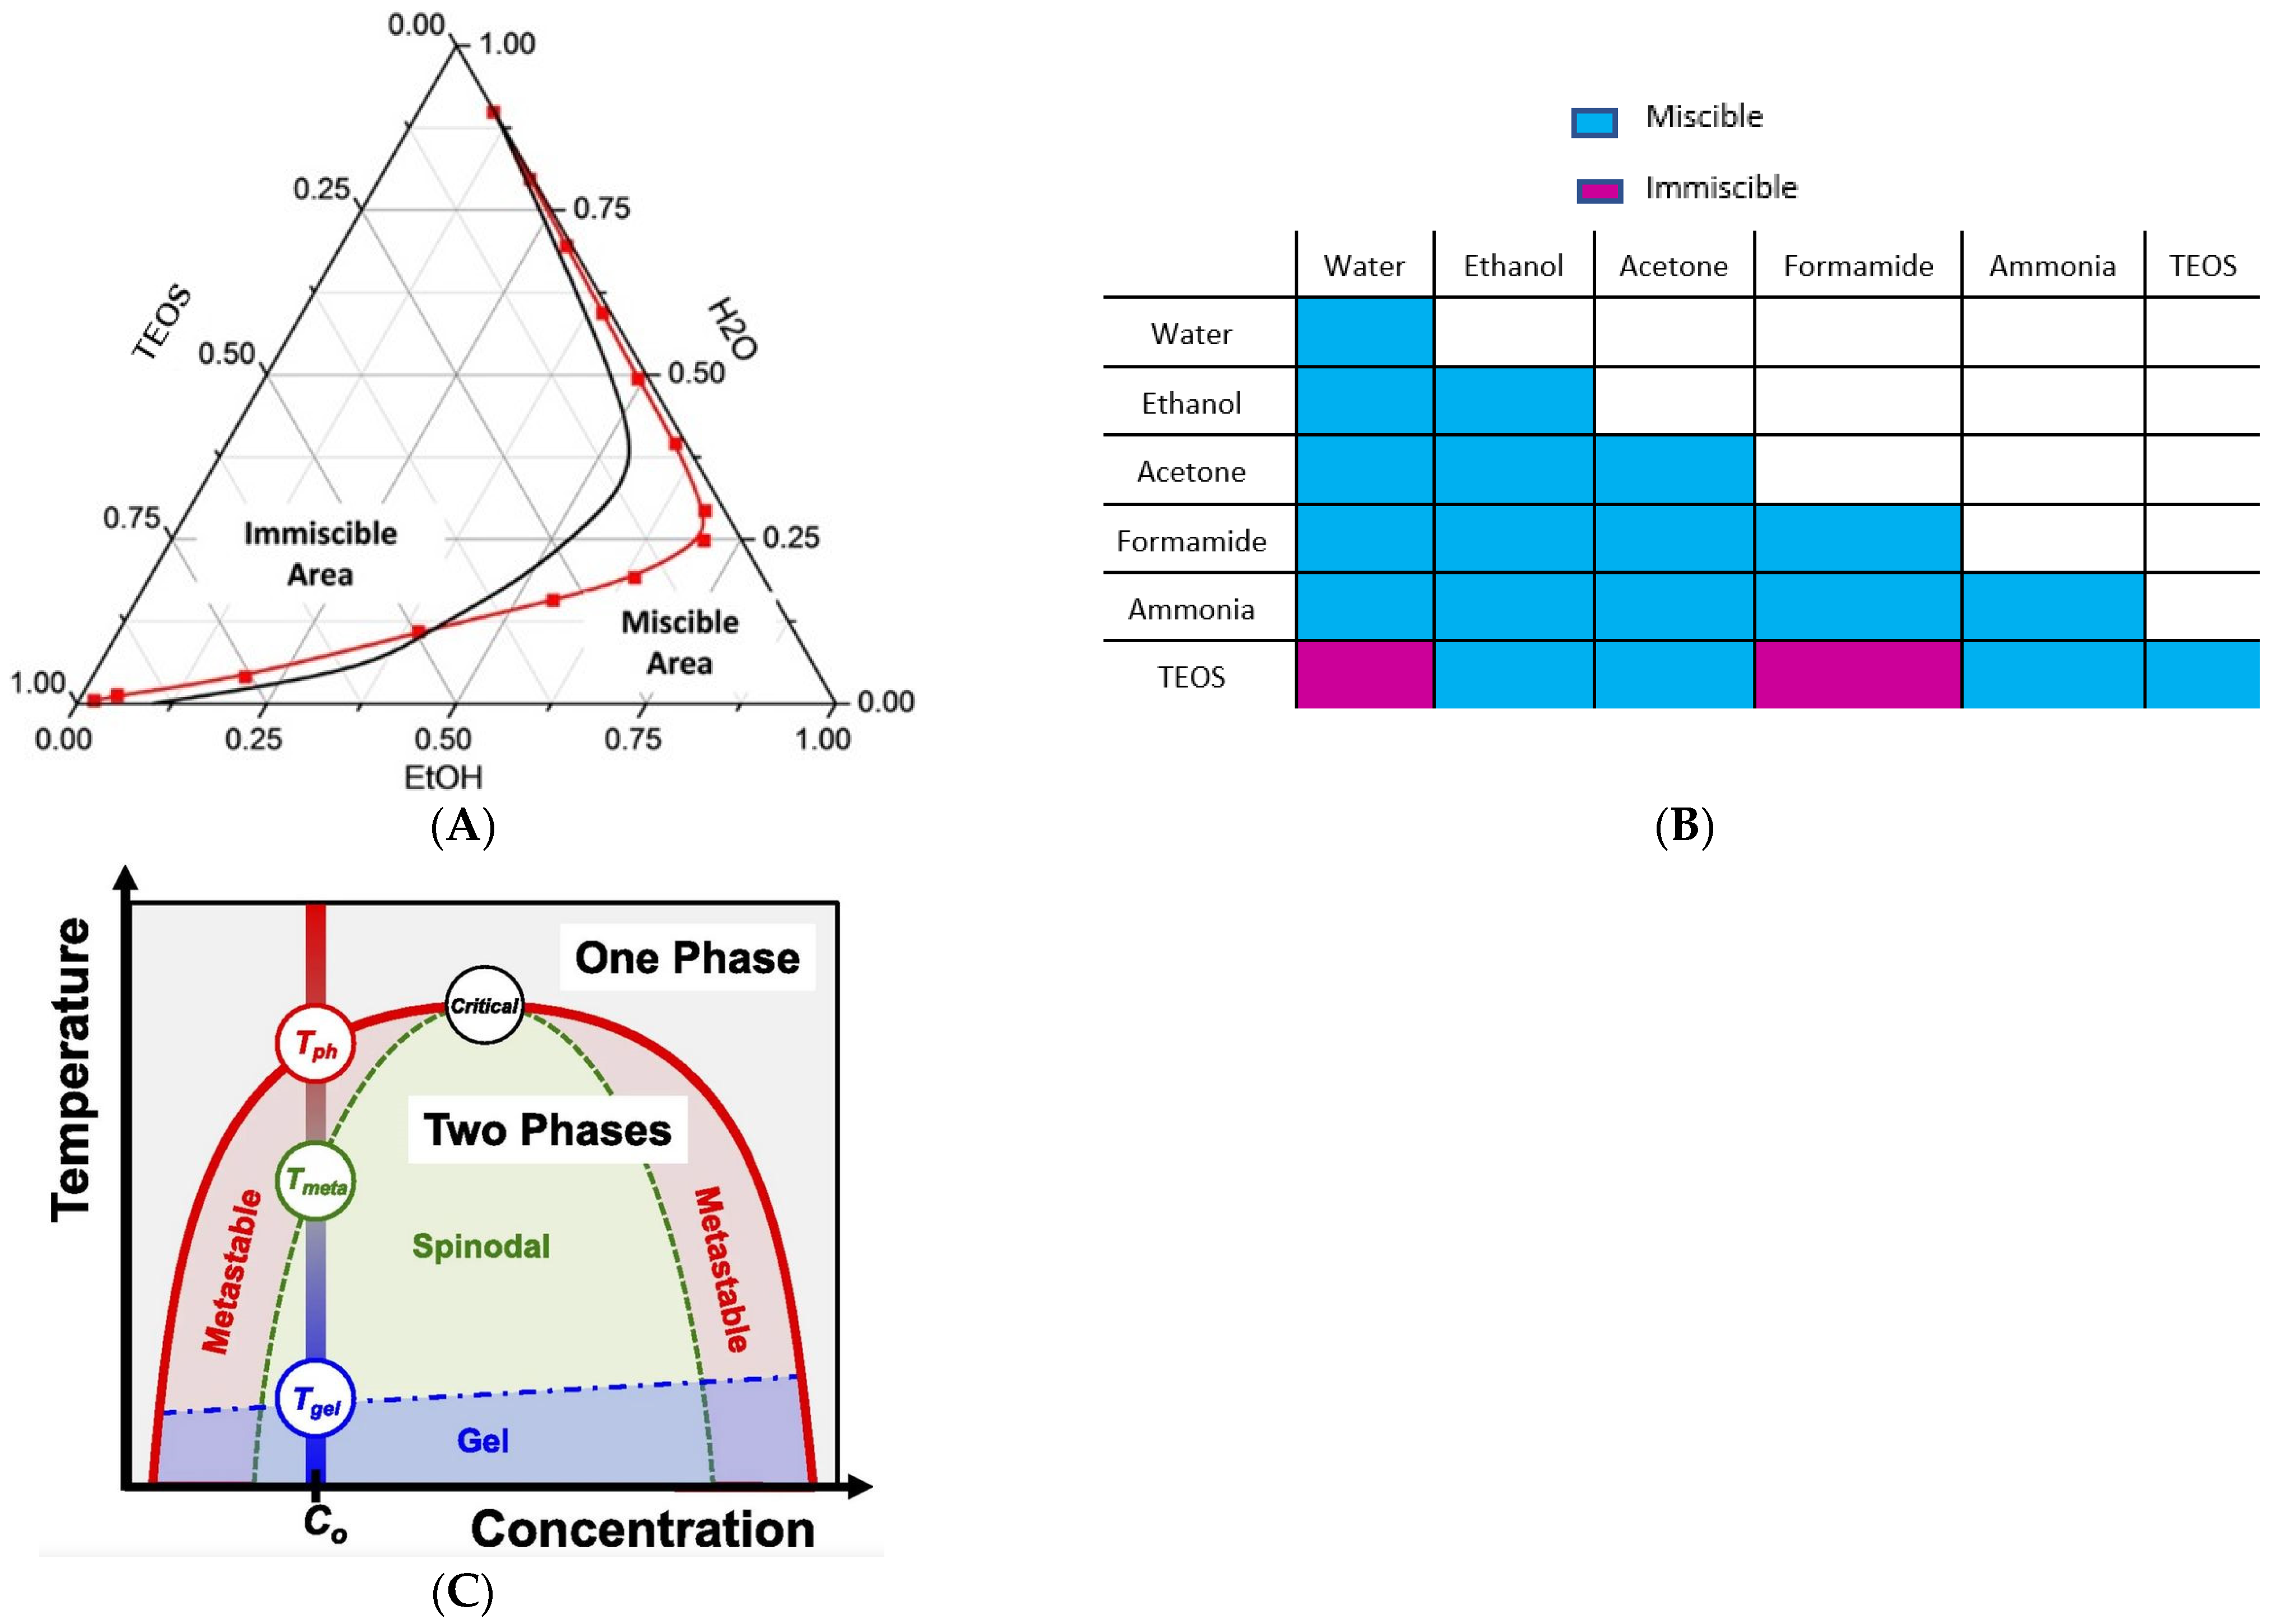
1.1. Polymer-Solvent-Nonsolvent Spinodal Decomposition
1.2. Hybrid Casting Solution Reactional Processes
2. Experimental Procedure
2.1. Materials
2.2. Membranes Synthesis
2.3. Membranes’ Drying
2.4. Membranes Characterization
2.4.1. Morphological Characterization
SEM
FITR-ATR
2.4.2. Ultra-Filtration Performance
2.4.3. Mechanical Performance
2.4.4. Statistical Analysis
3. Result and Discussion
3.1. Morphological Characterization
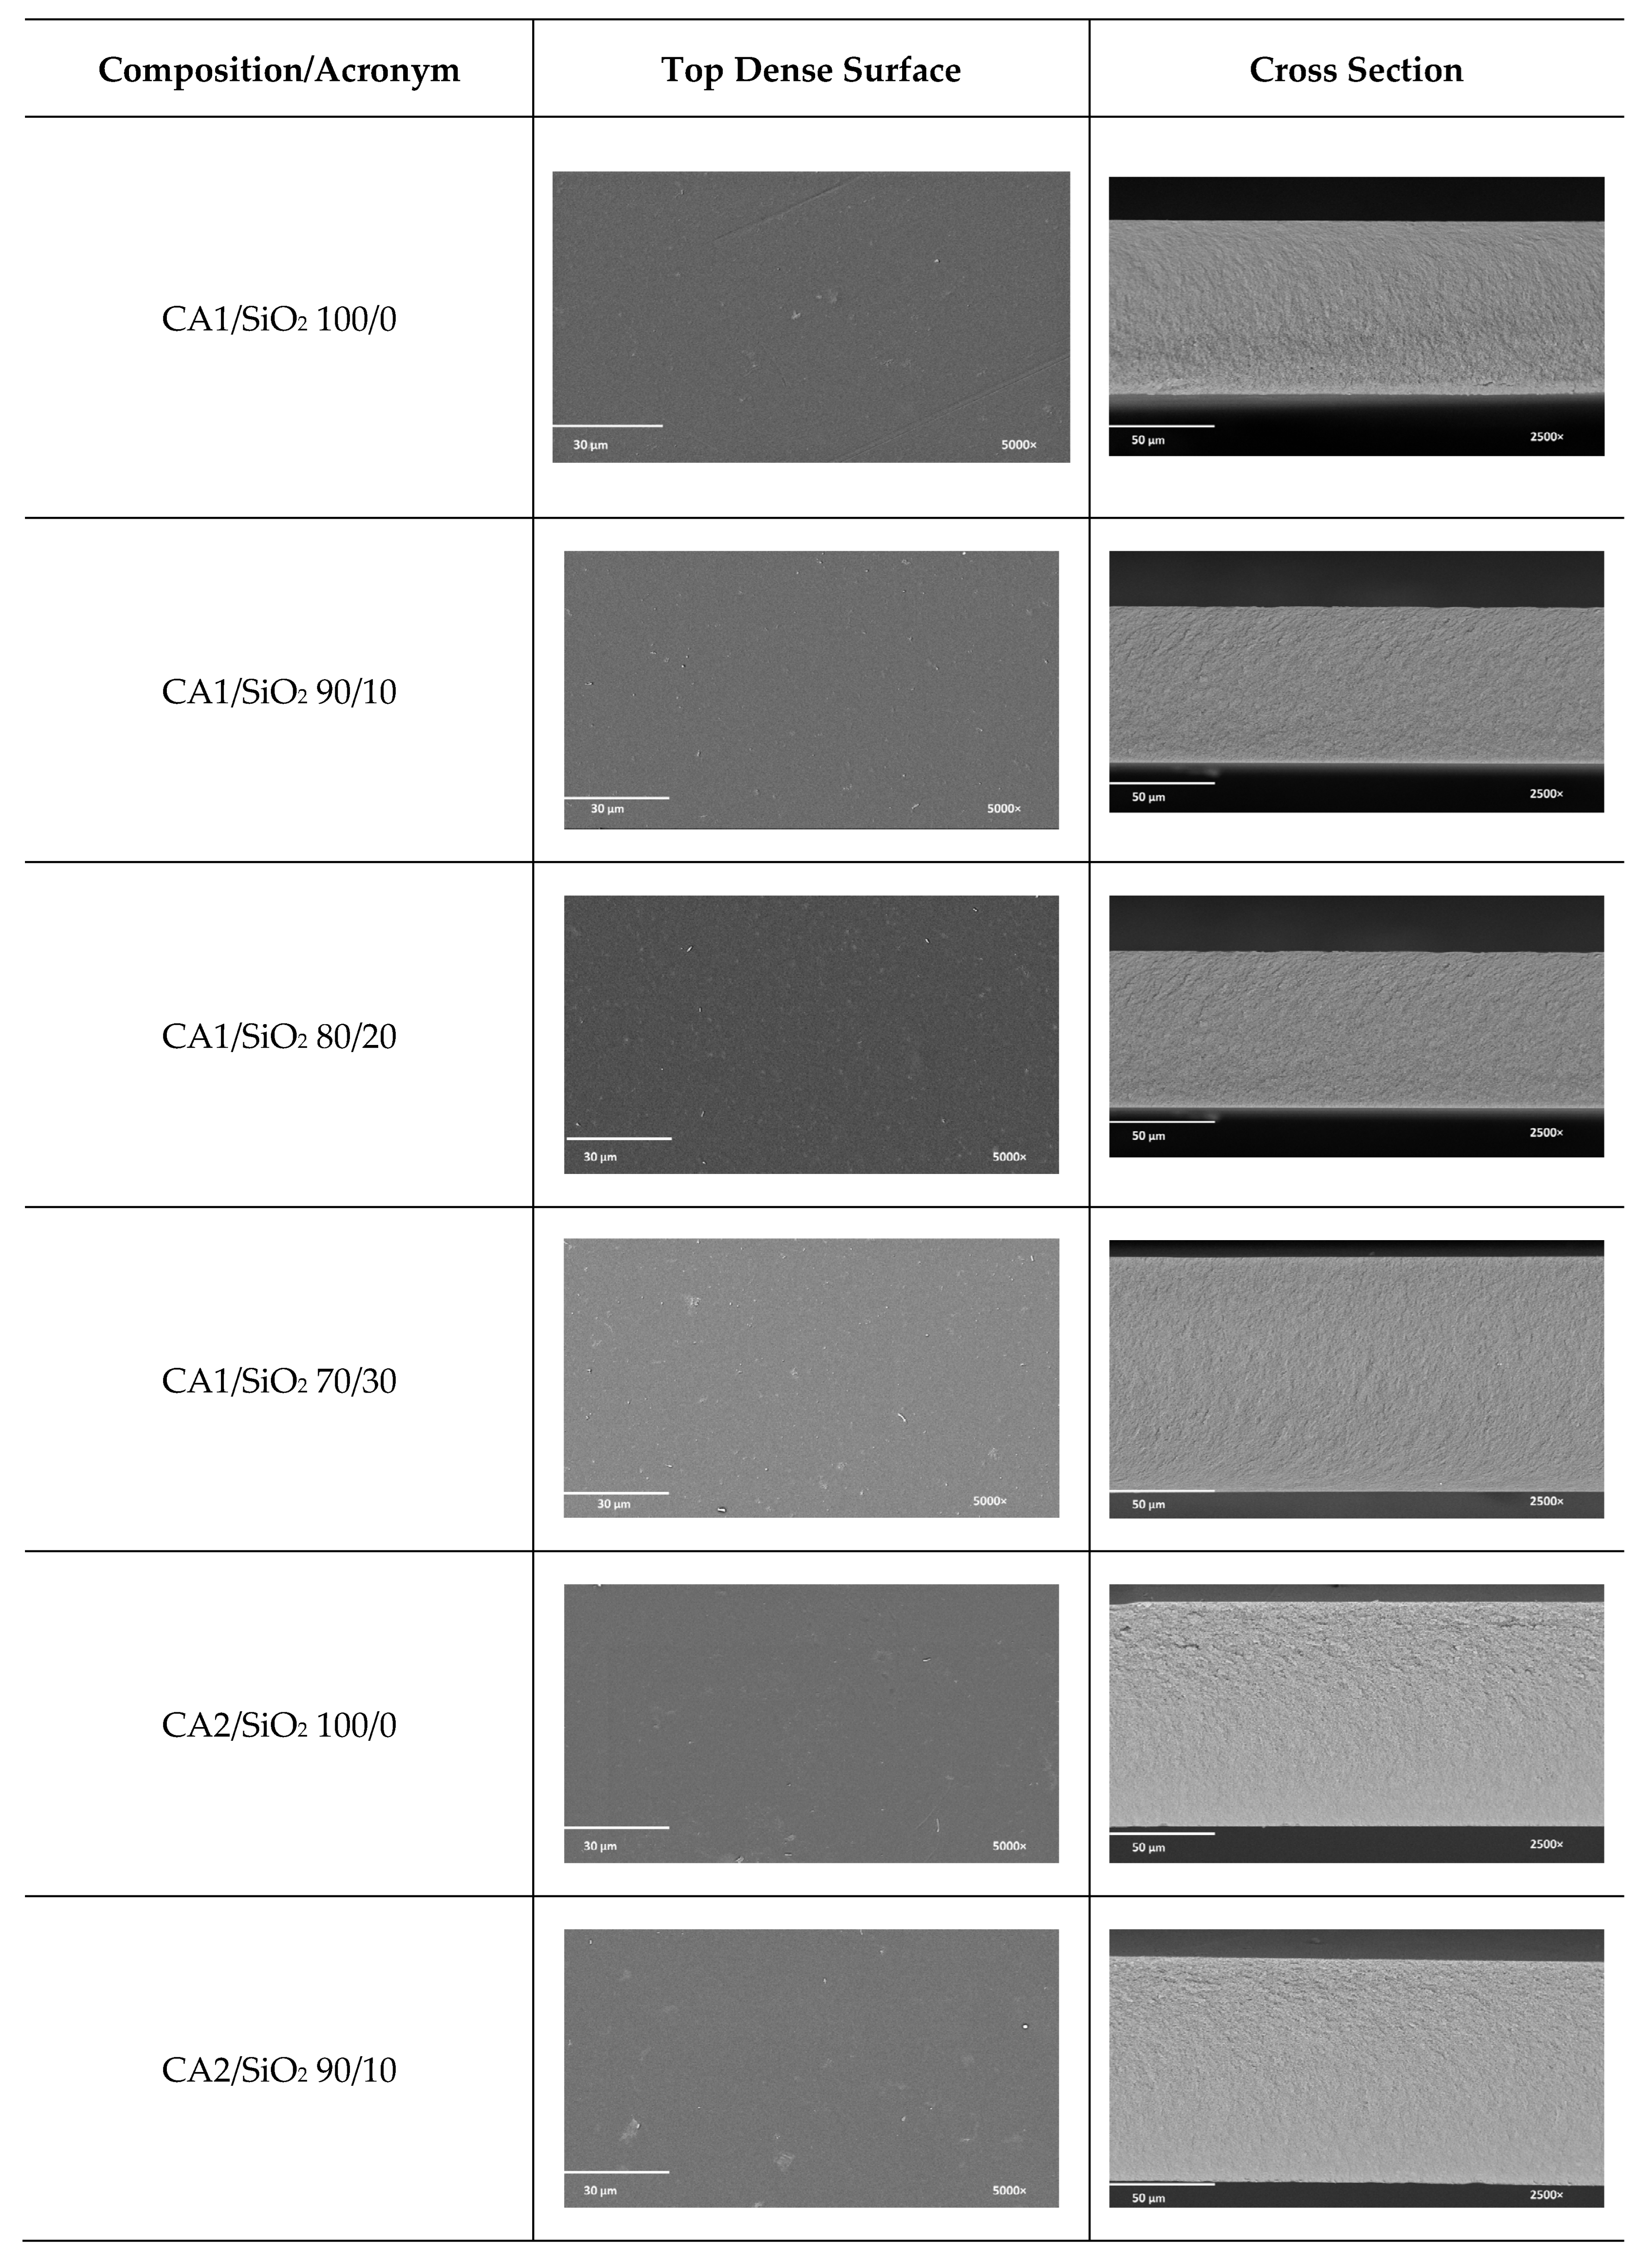
3.1.1. SEM
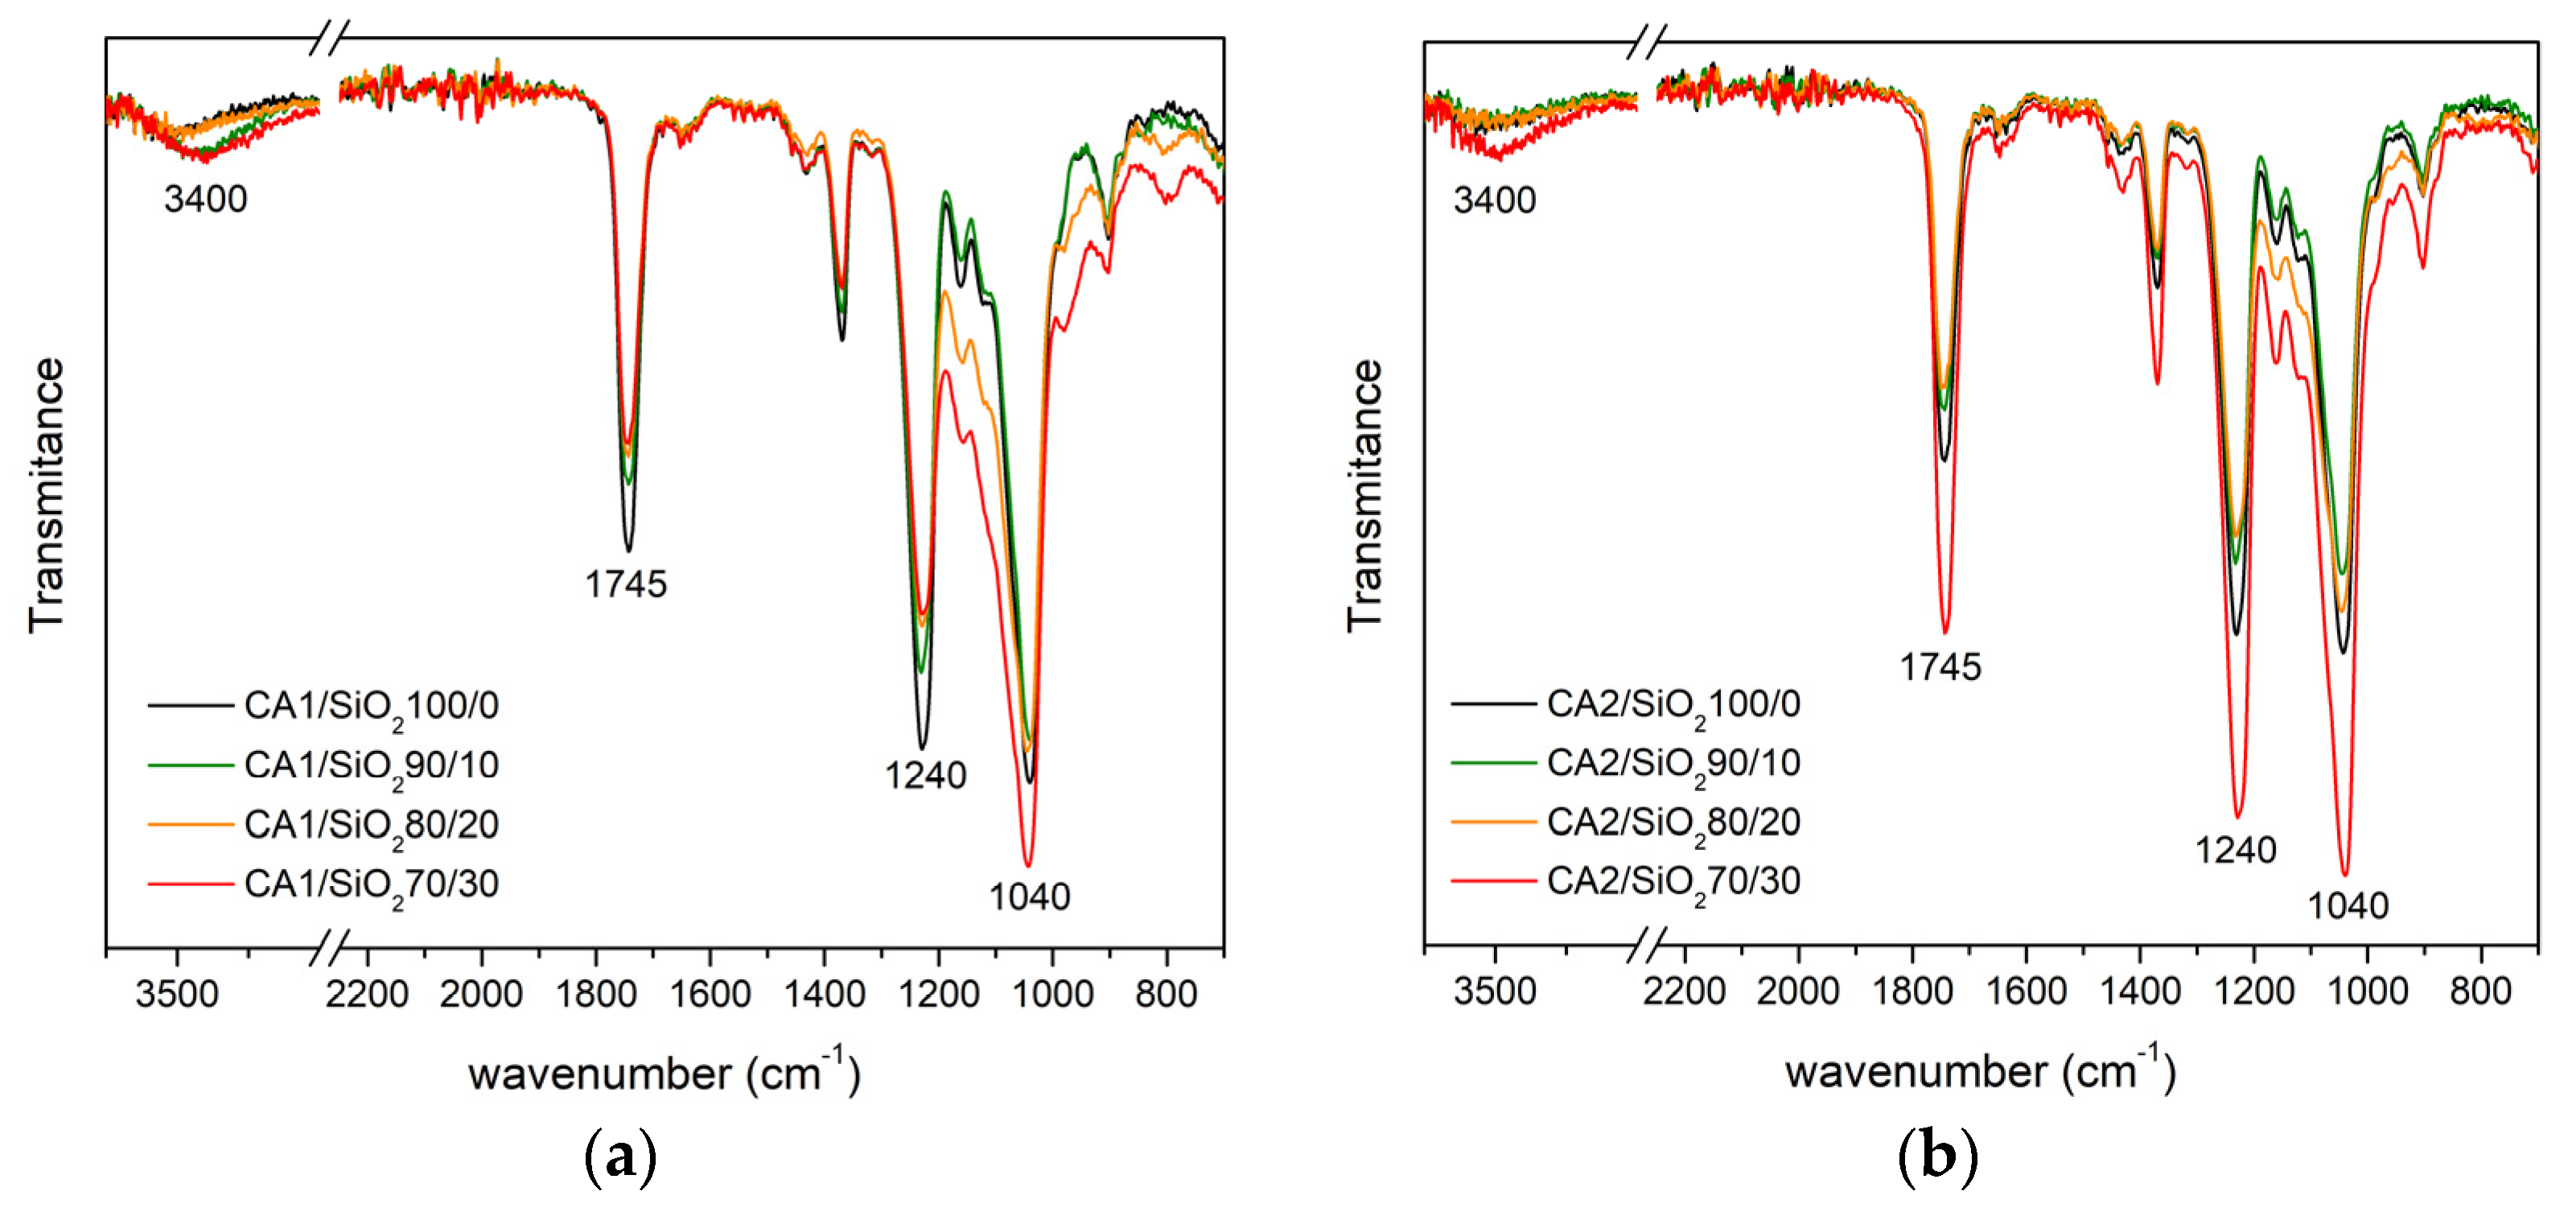
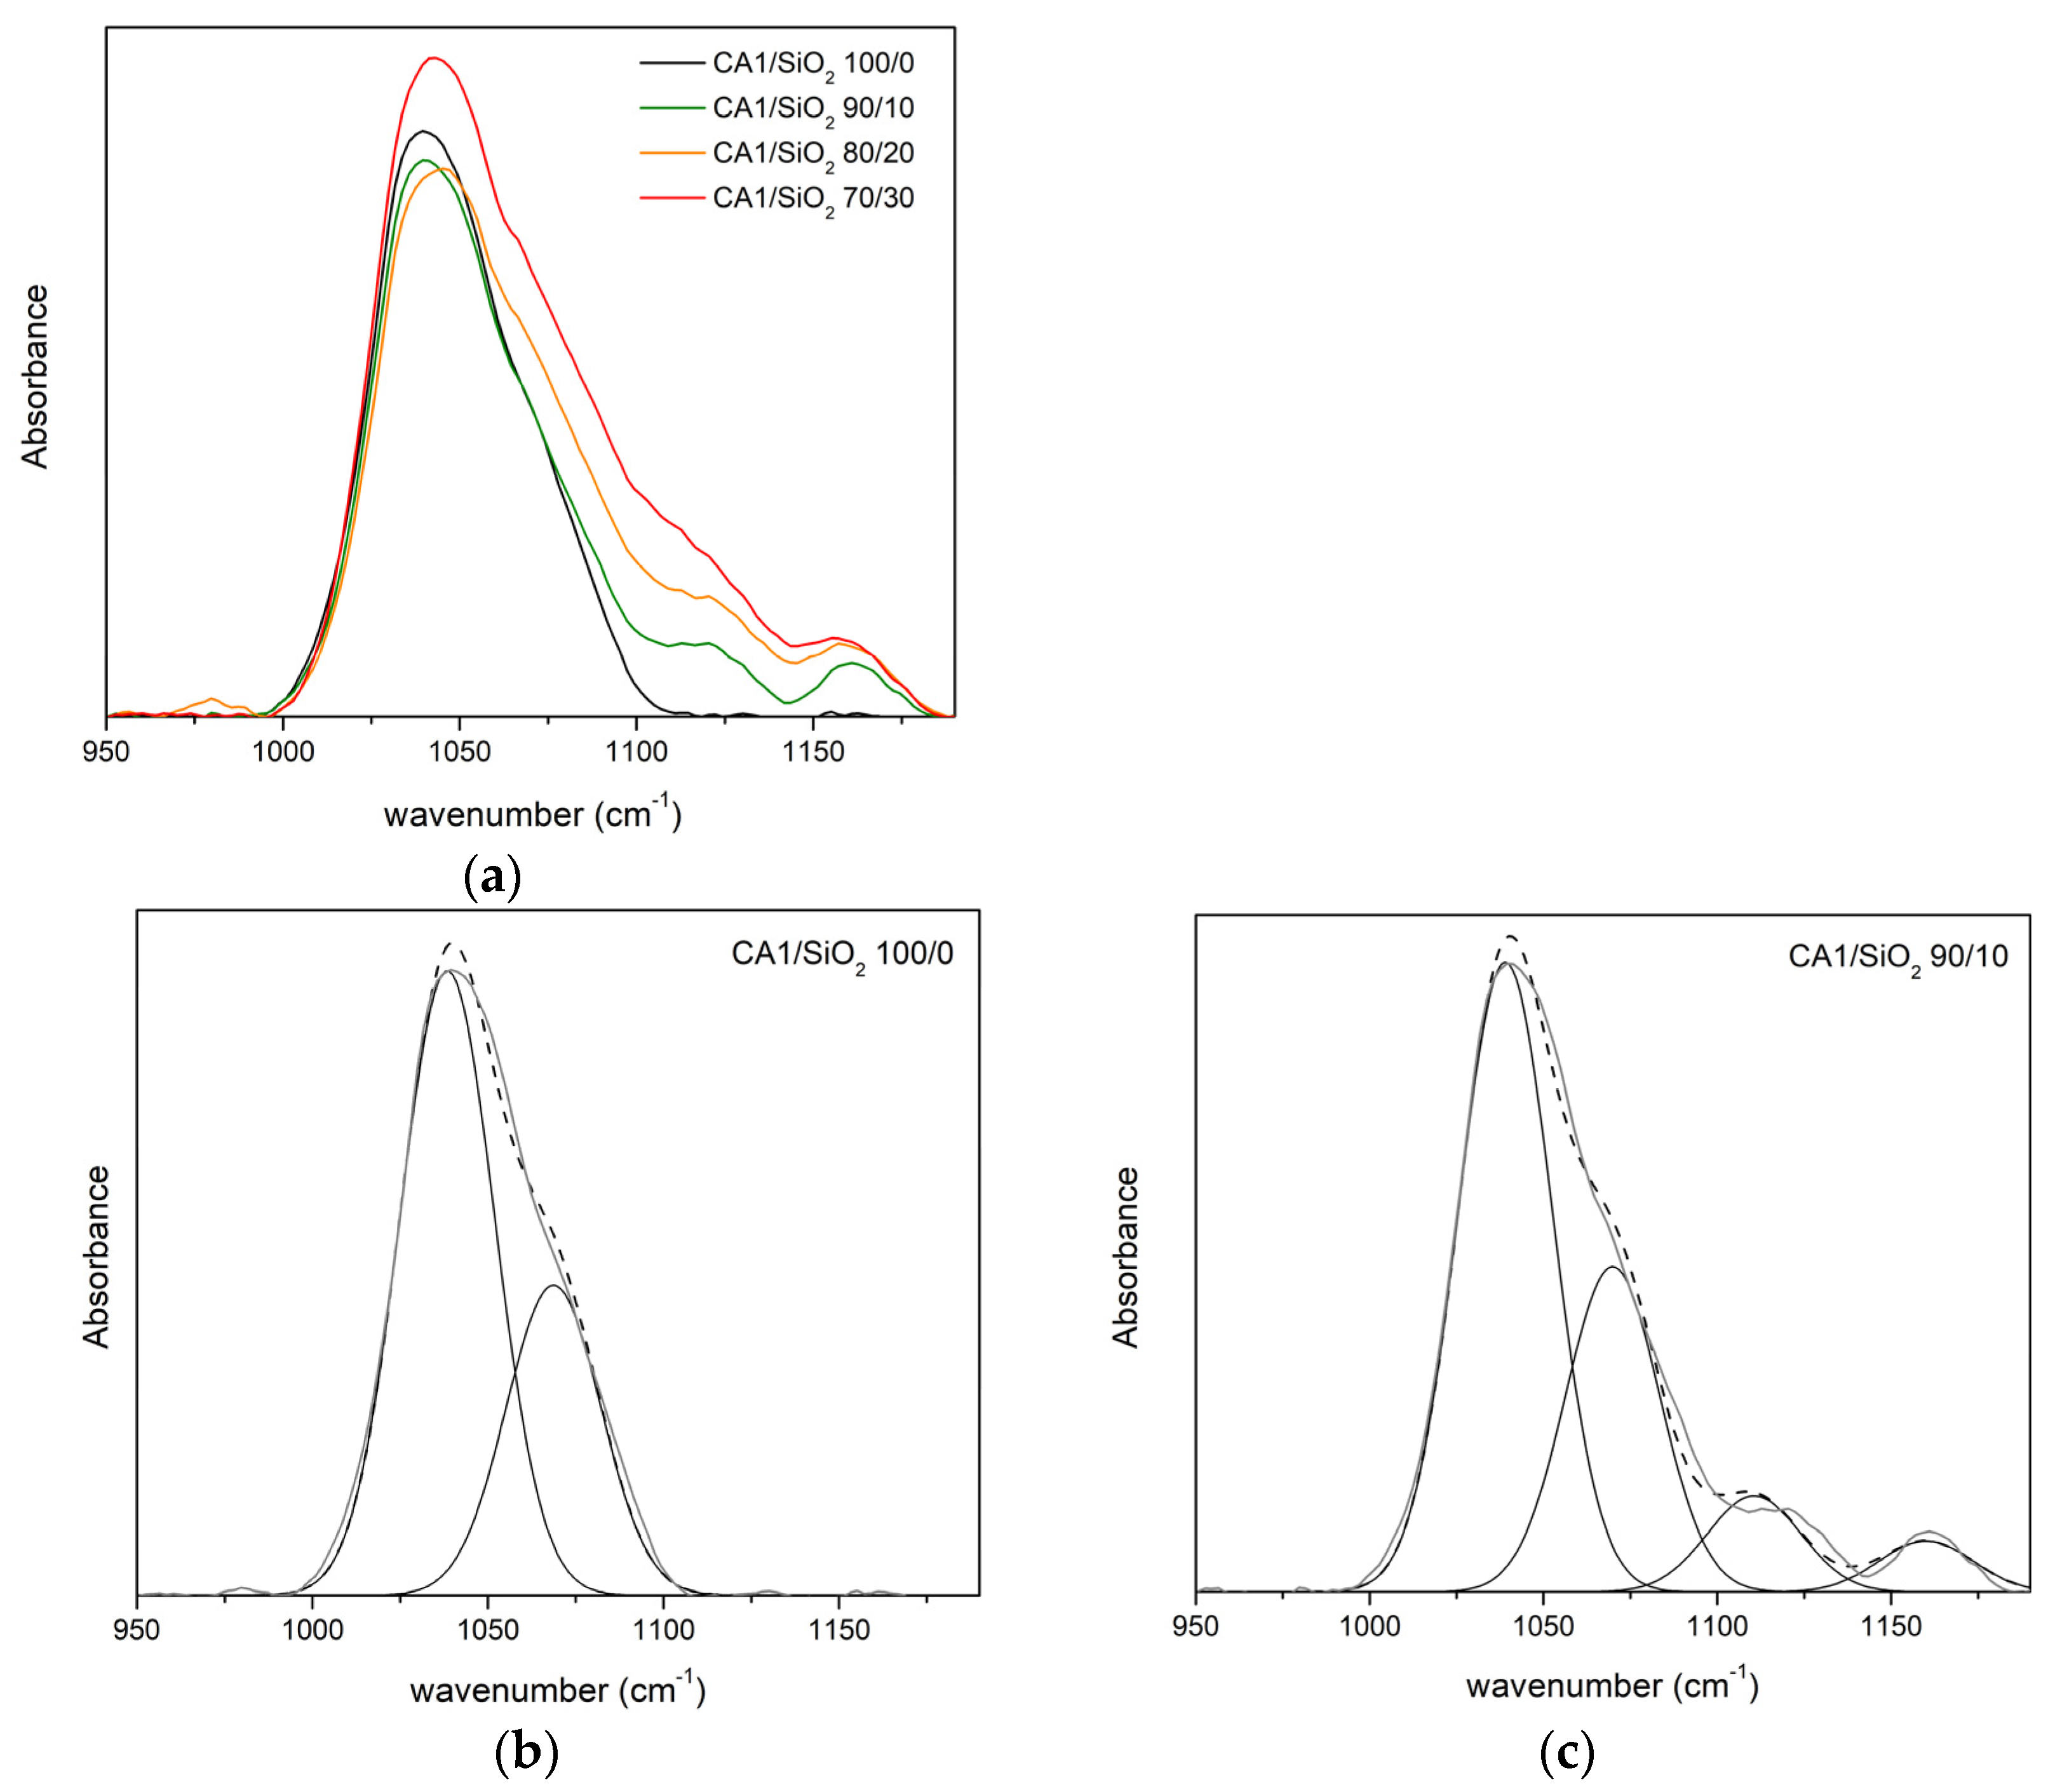
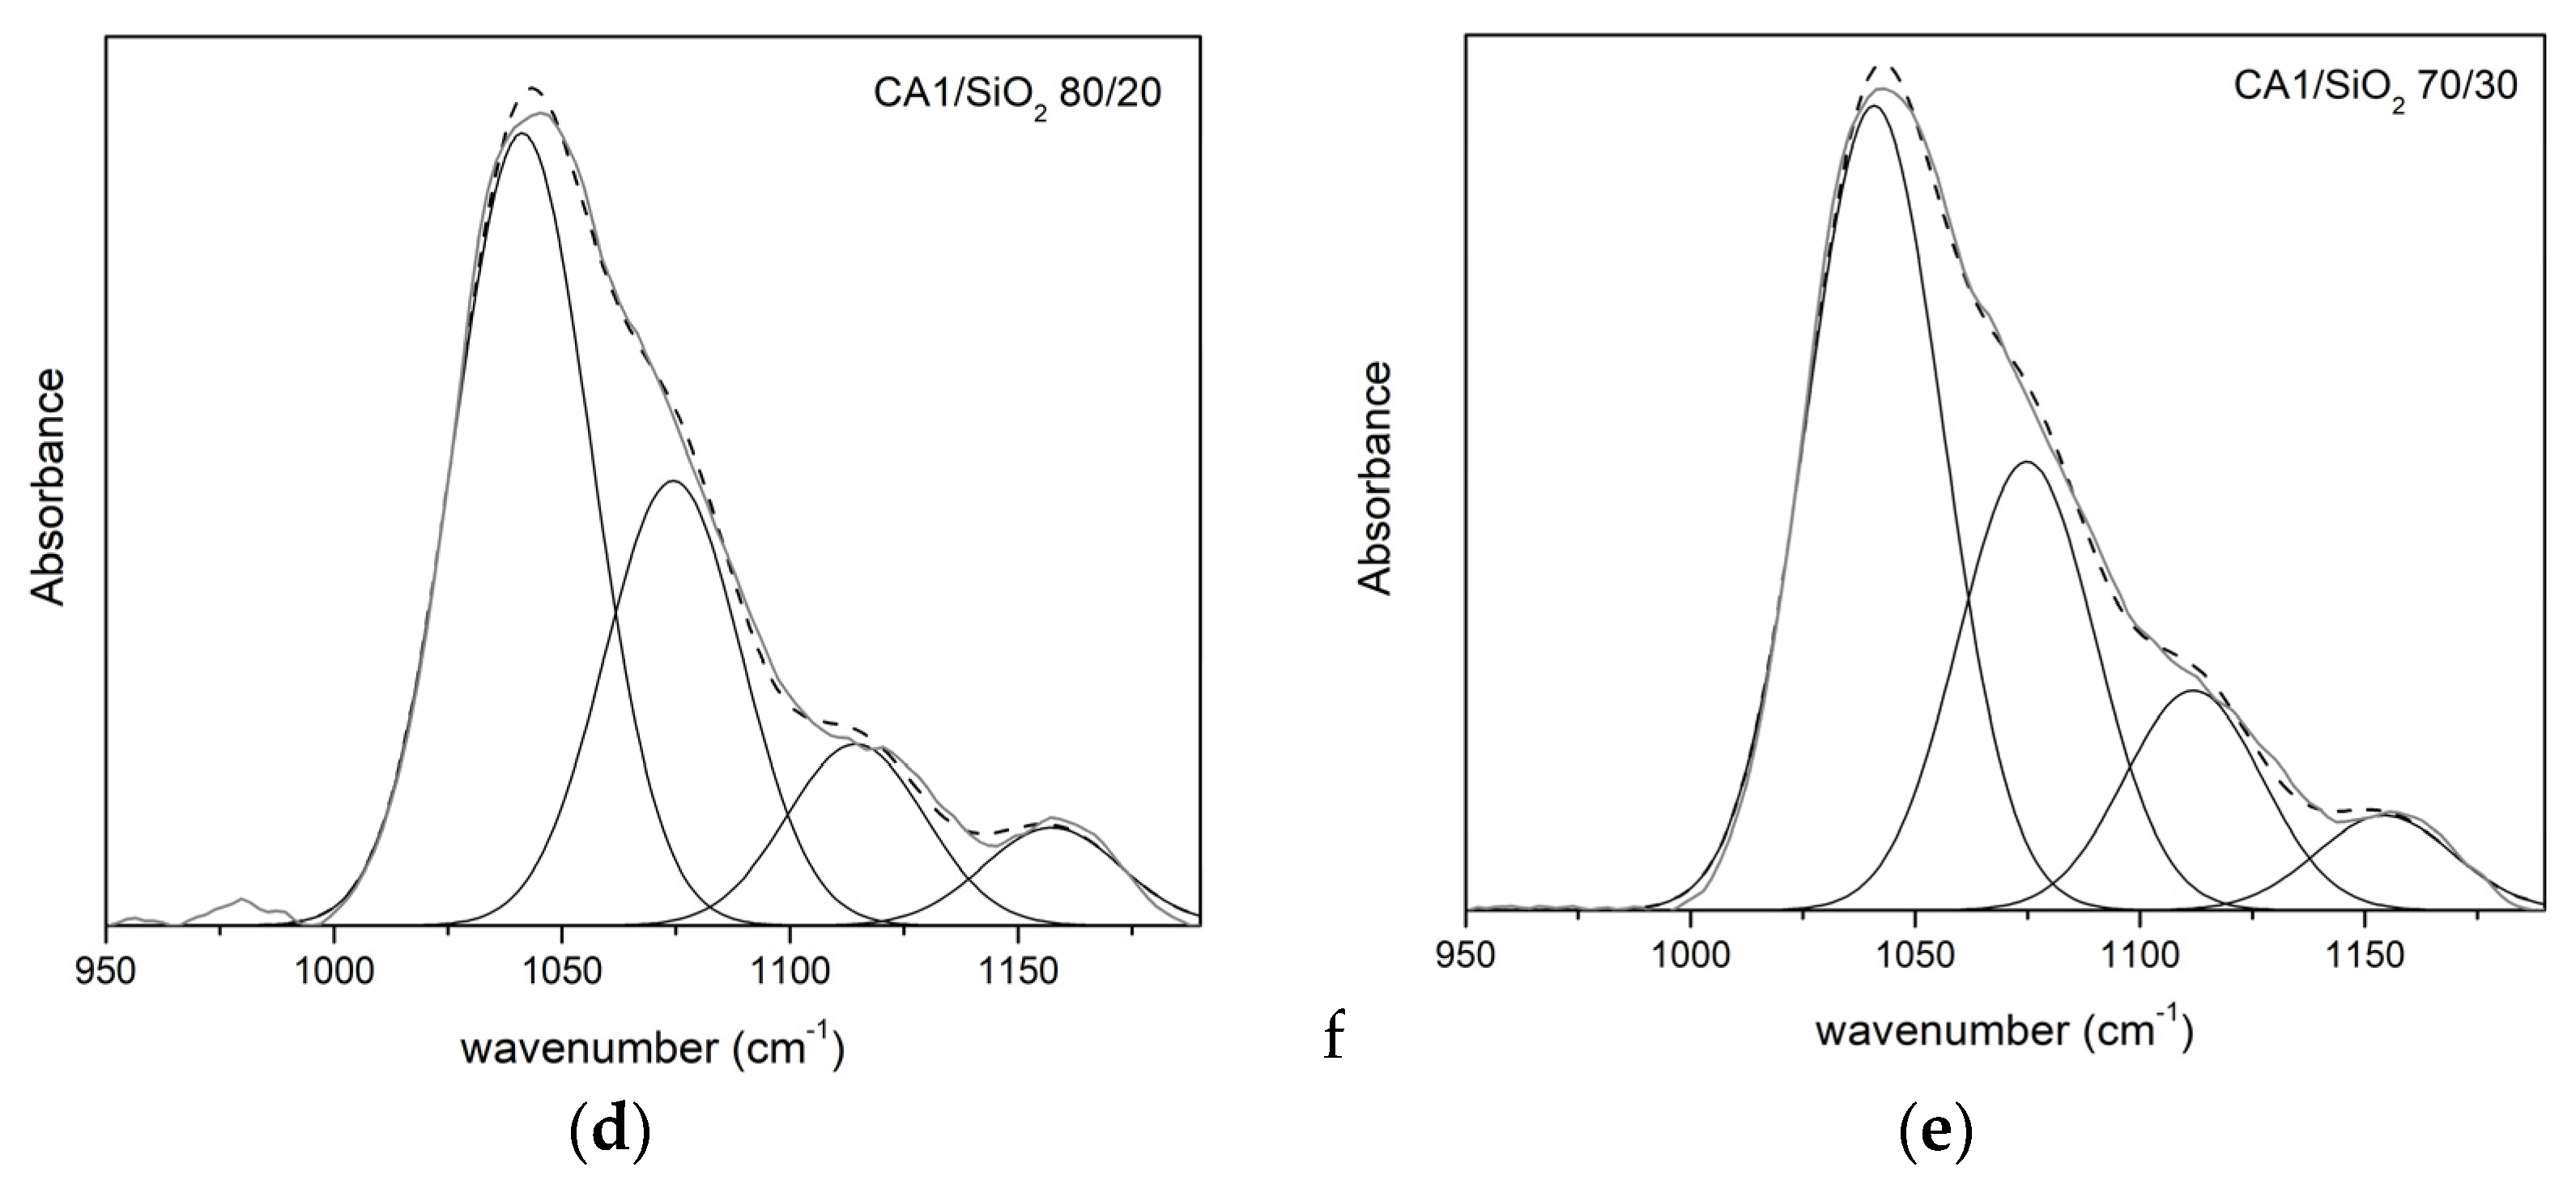
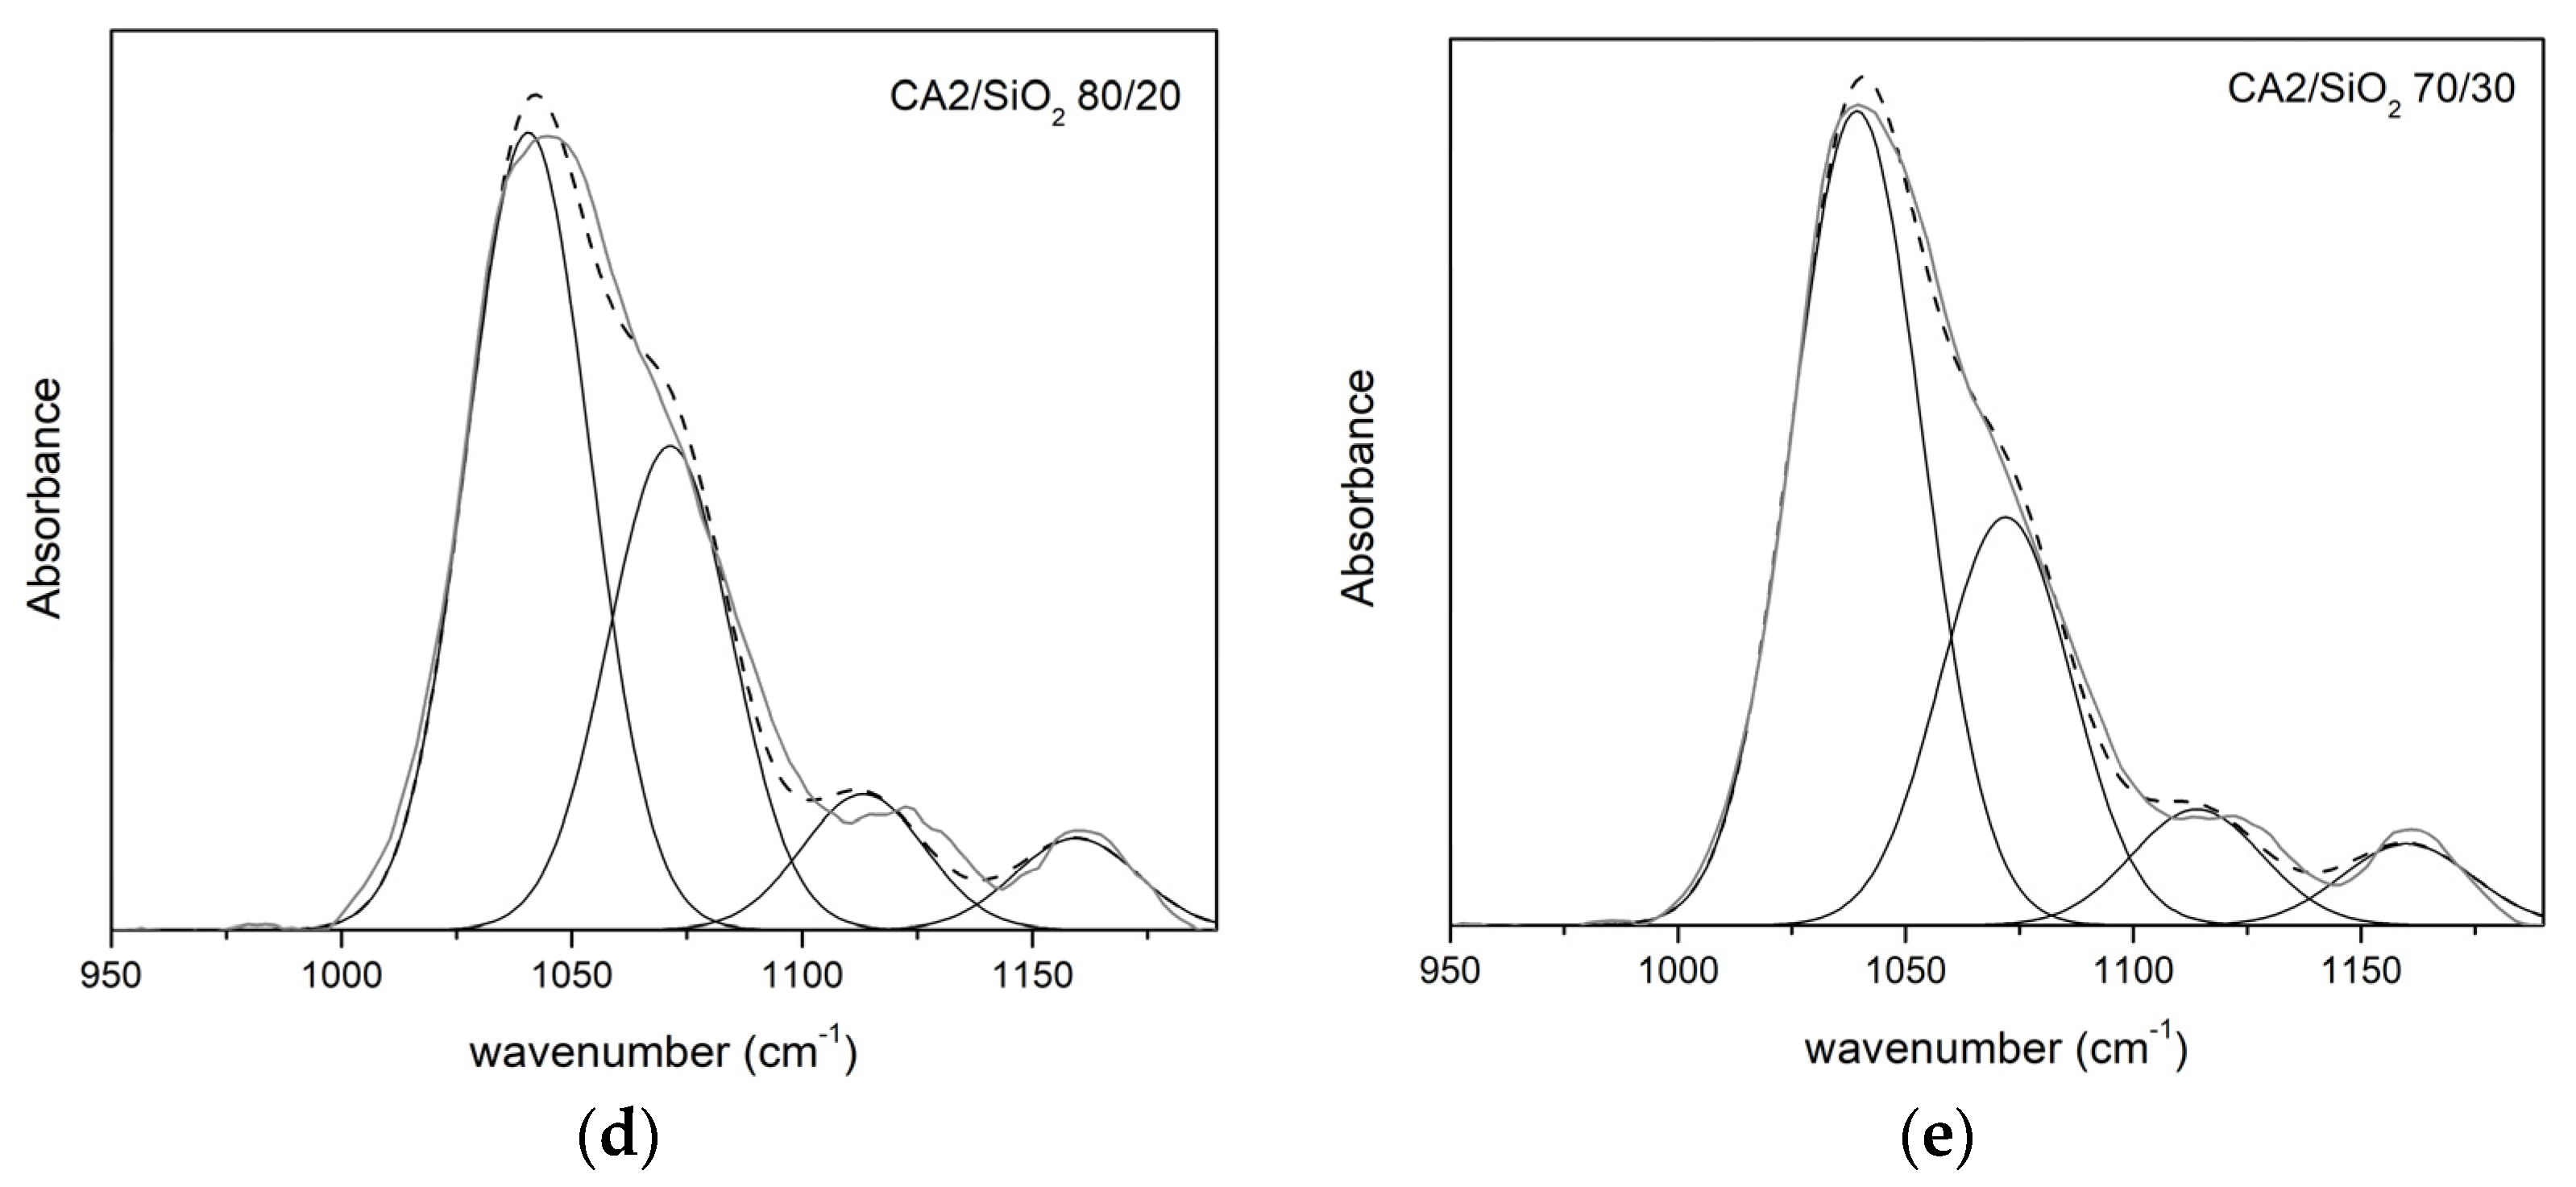
3.1.2. FTIR-ATR
Series One
Series Two
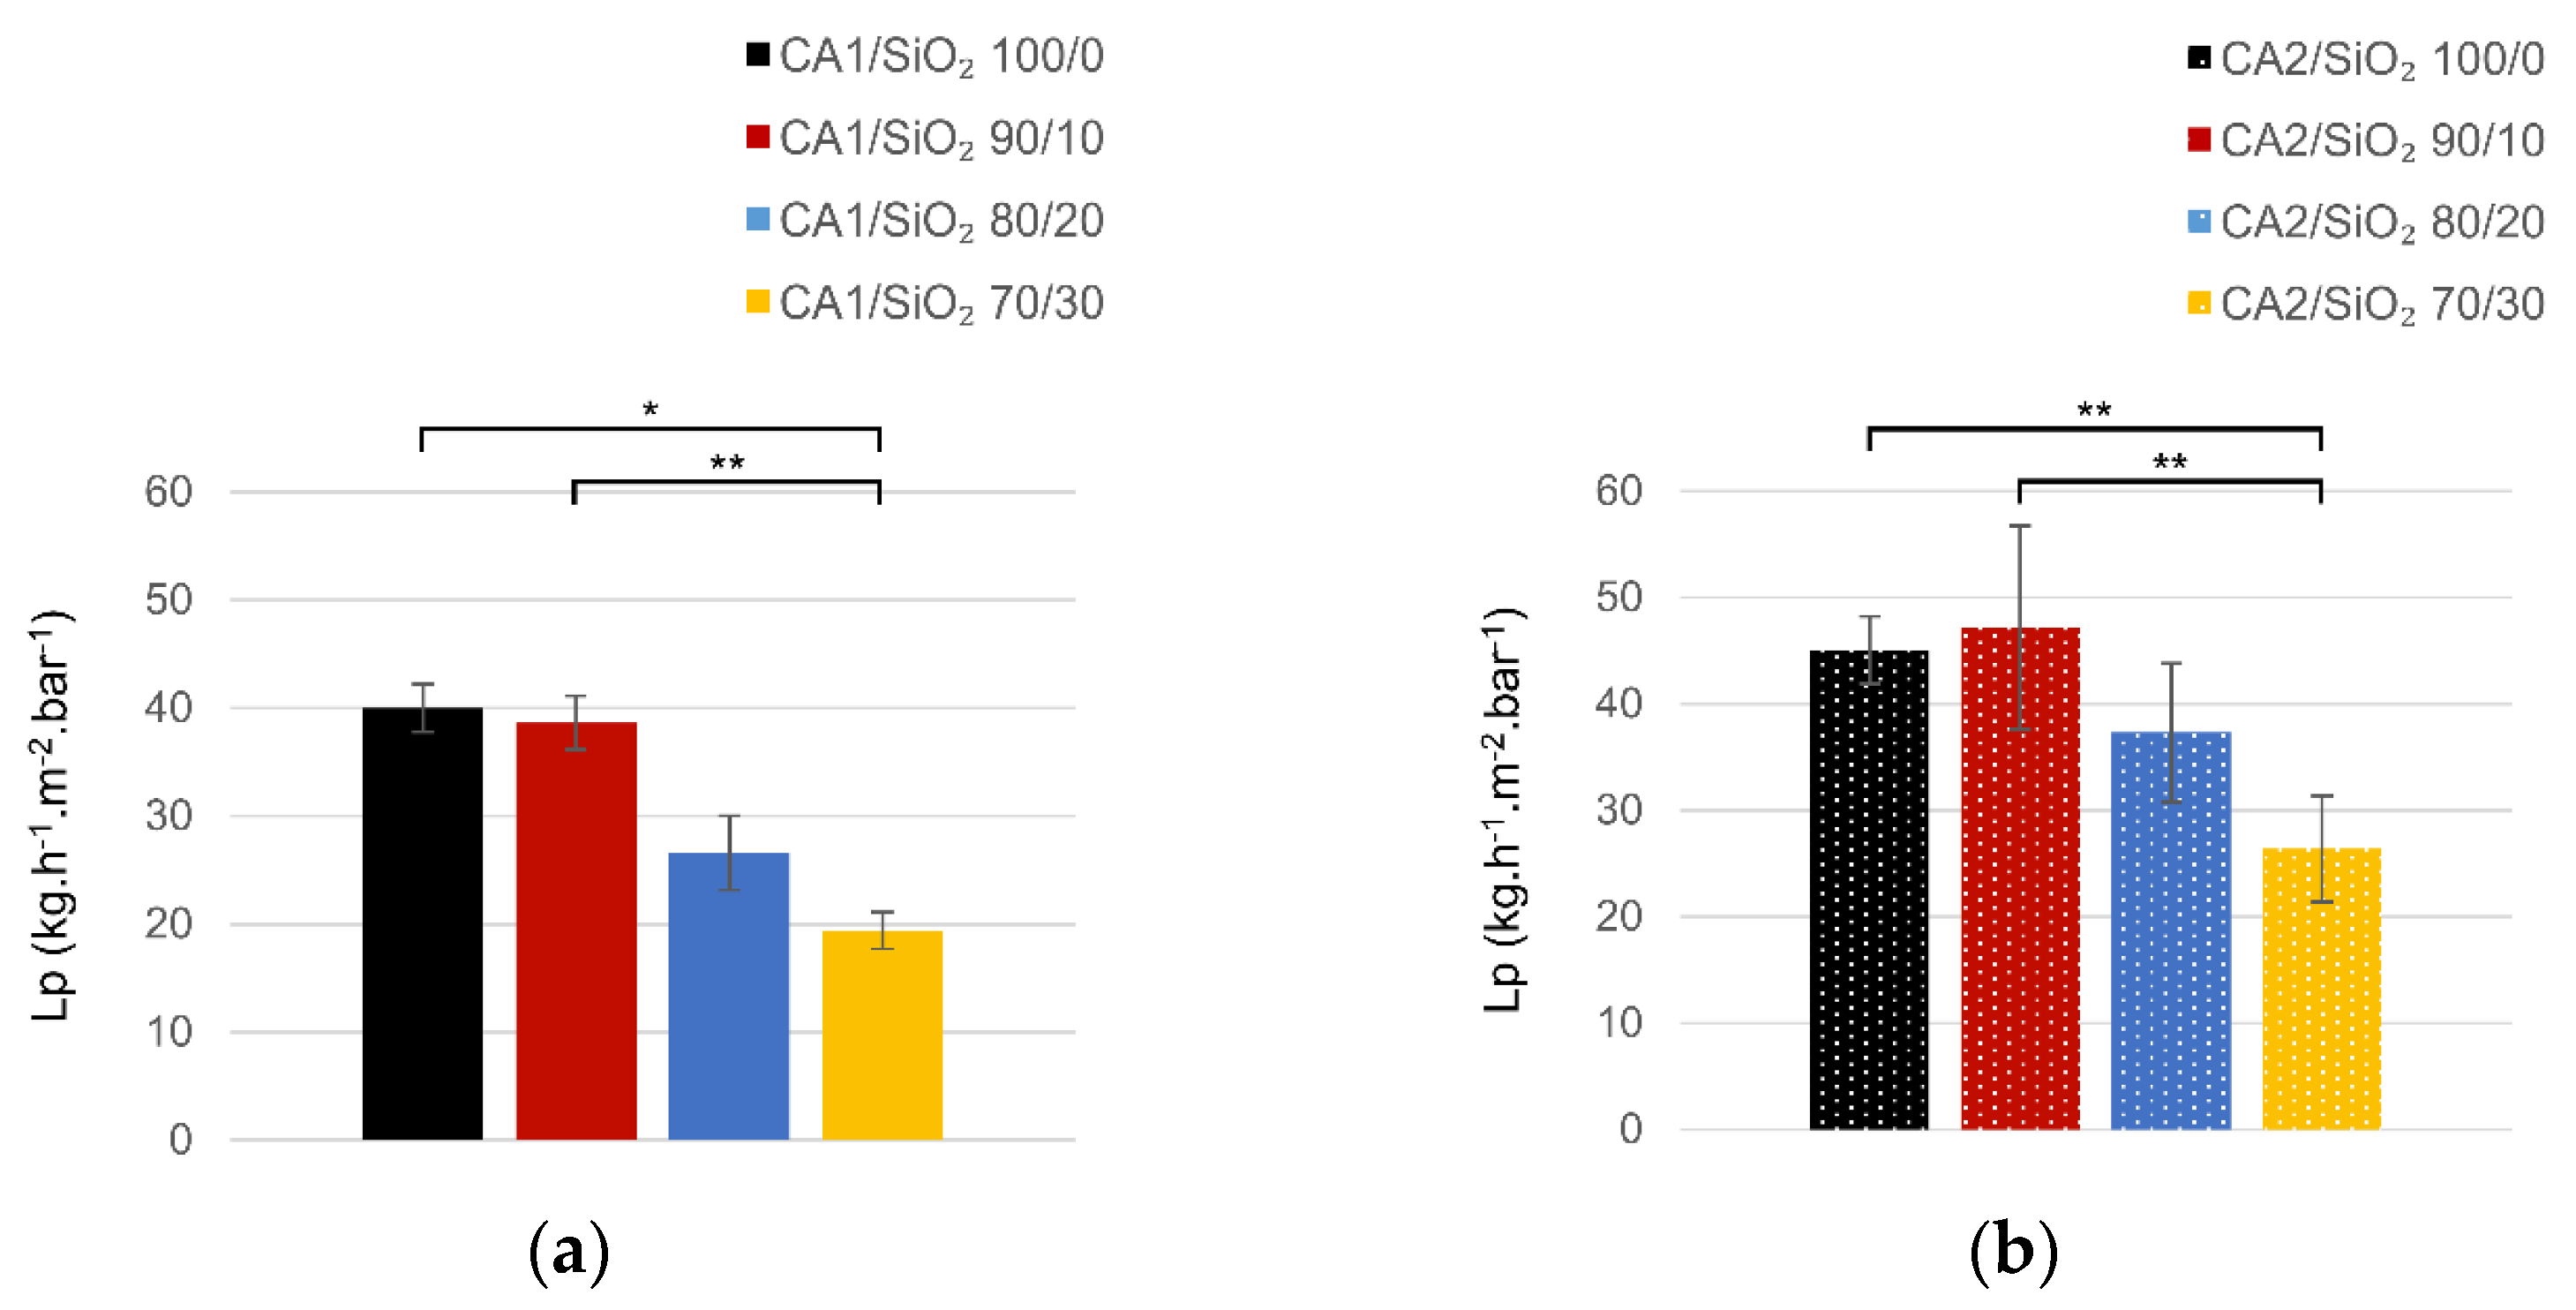
3.2. Ultrafiltration Performance
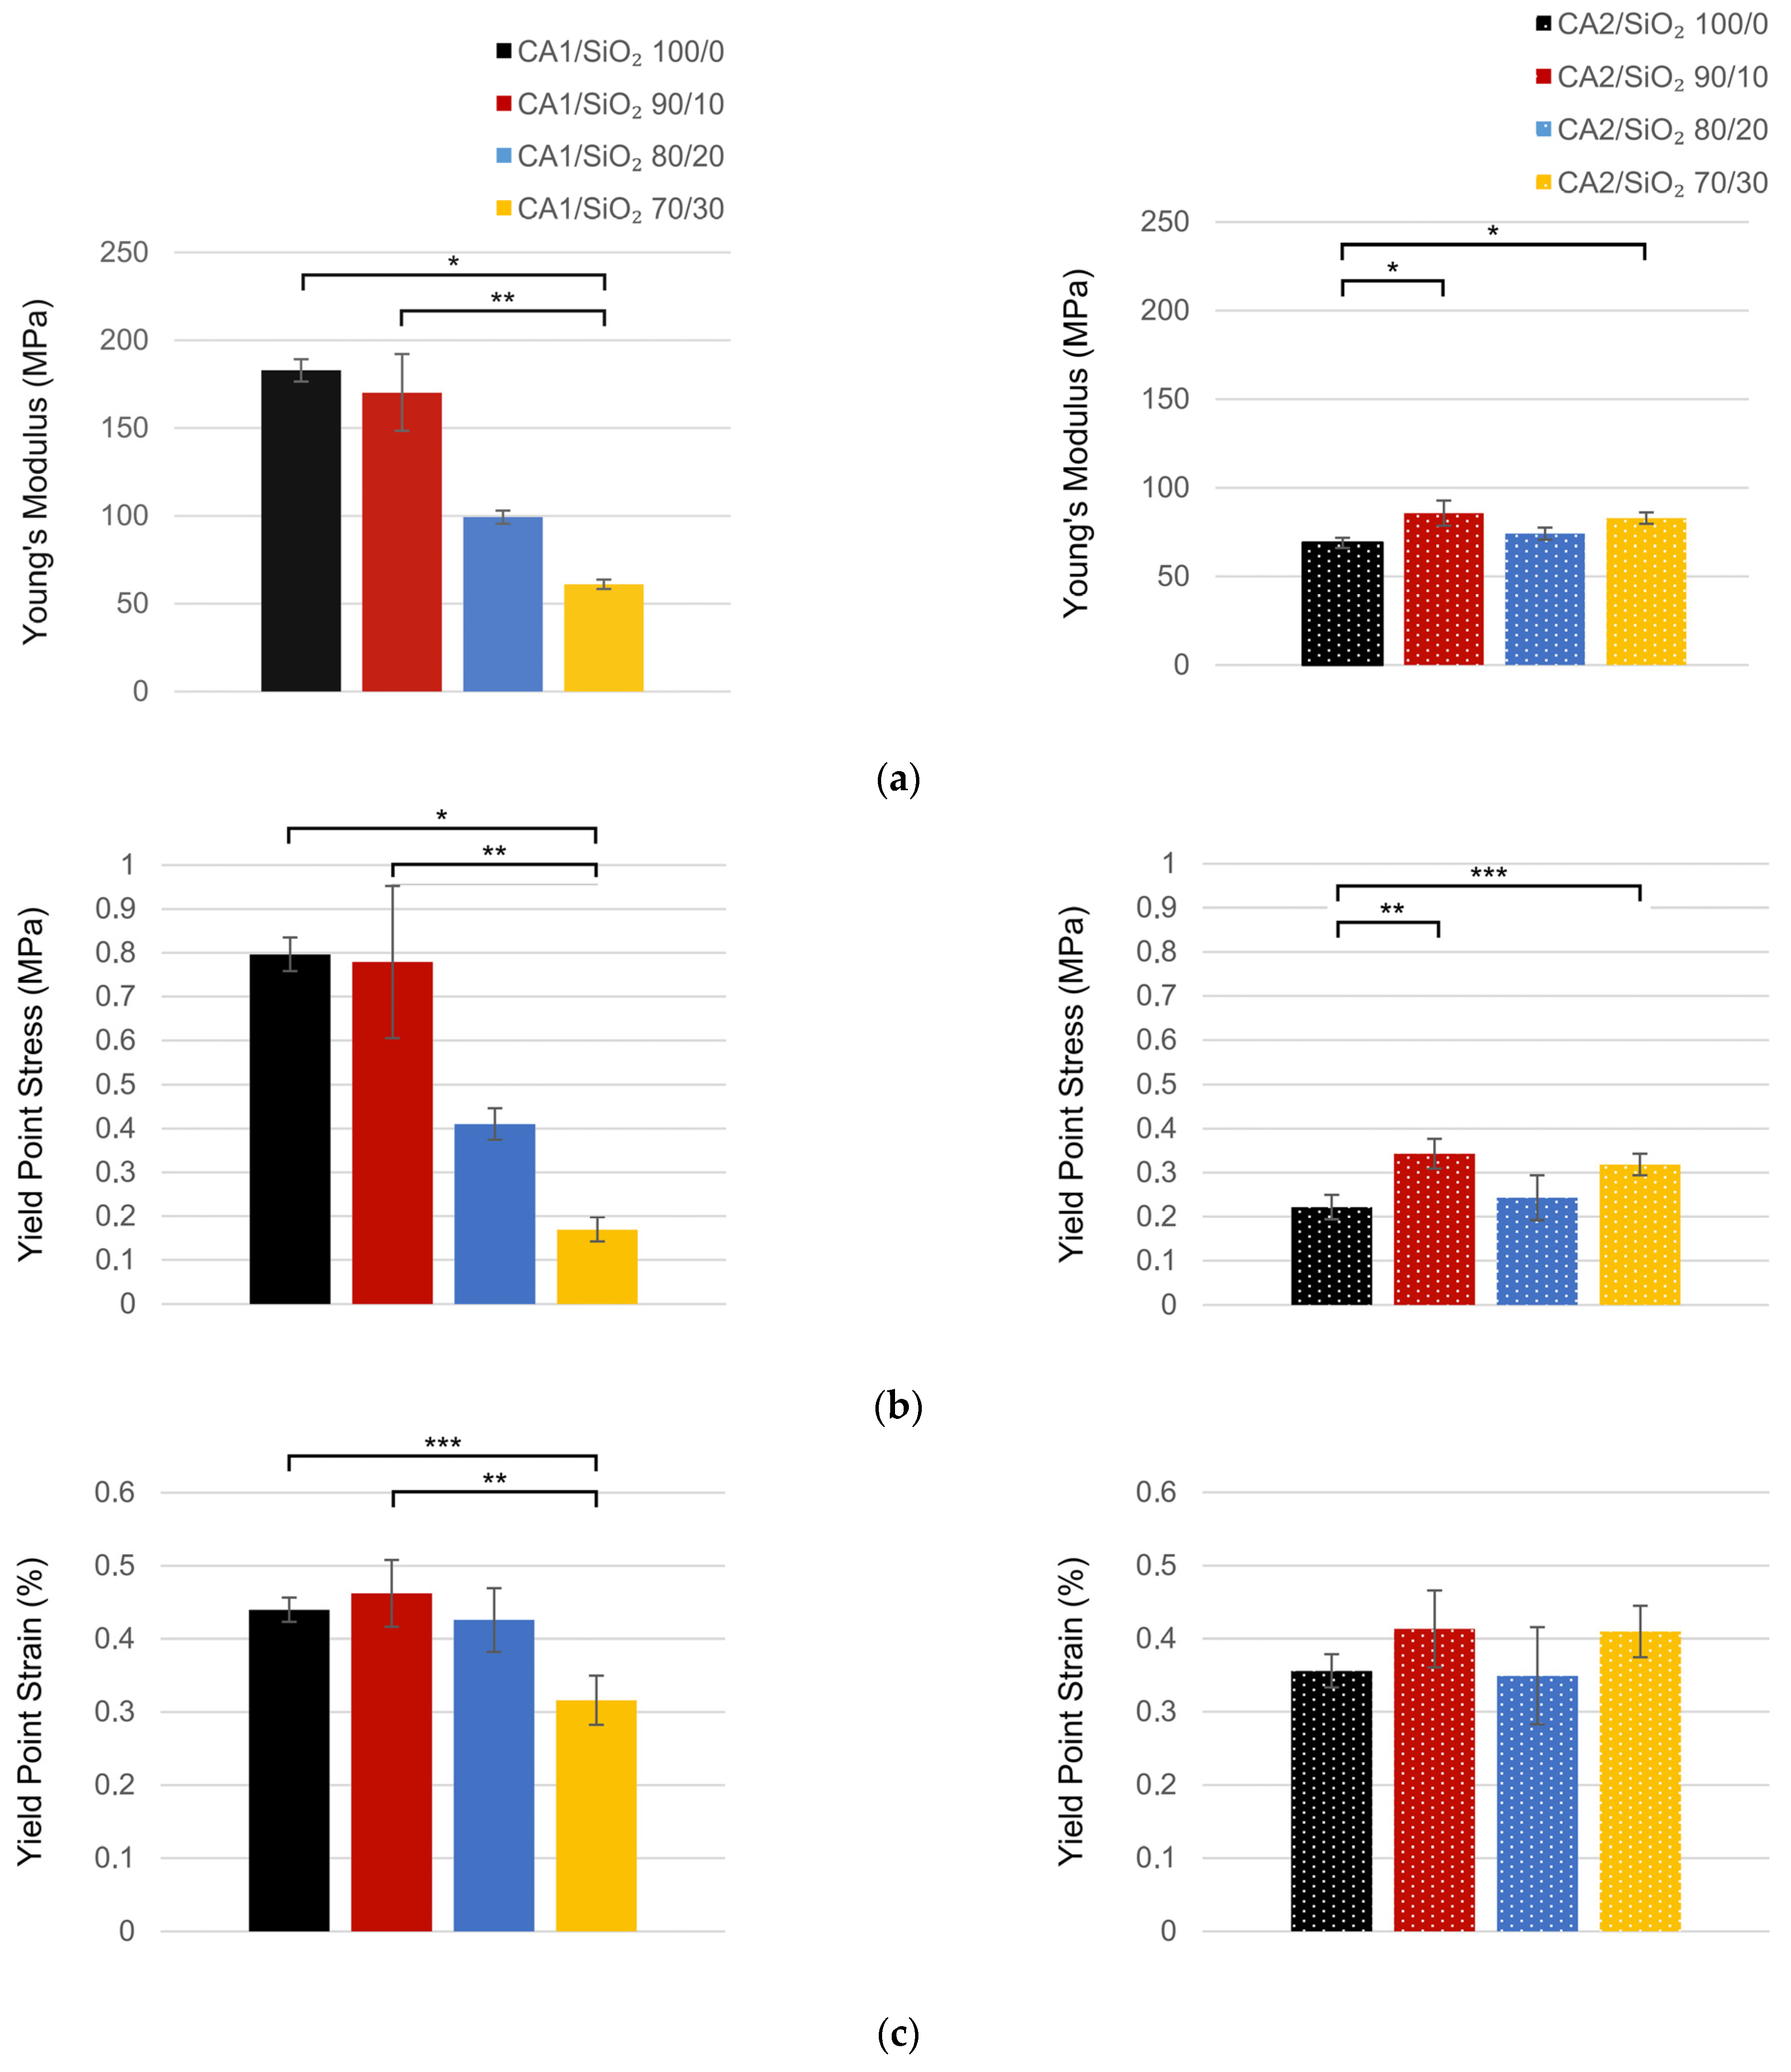
3.3. Mechanical Performance
4. Conclusions
Supplementary Materials
Author Contributions
Funding
Institutional Review Board Statement
Informed Consent Statement
Data Availability Statement
Conflicts of Interest
References
- Pendergast, M.M.; Hoek, E.M.V. A Review of Water Treatment Membrane Nanotechnologies. Energy Environ. Sci. 2011, 4, 1946–1971. [Google Scholar] [CrossRef] [Green Version]
- Kamcev, J.; Freeman, B.D. Charged Polymer Membranes for Environmental/Energy Applications. Annu. Rev. Chem. Biomol. Eng. 2016, 7, 111–133. [Google Scholar] [CrossRef]
- Zare, F.; Janeca, A.; Jokar, S.M.; Faria, M.; Gonçalves, M.C. Interaction of Human Serum Albumin with Uremic Toxins: The Need of New Strategies Aiming at Uremic Toxins Removal. Membranes 2022, 12, 261. [Google Scholar] [CrossRef]
- Faria, M.; de Pinho, M.N. Challenges of Reducing Protein-Bound Uremic Toxin Levels in Chronic Kidney Disease and End Stage Renal Disease. Transl. Res. 2020, 229, 115–134. [Google Scholar] [CrossRef]
- Rodrigues, F.S.C.; Faria, M. Adsorption- and Displacement-Based Approaches for the Removal of Protein-Bound Uremic Toxins. Toxins 2023, 15, 110. [Google Scholar] [CrossRef] [PubMed]
- Eusébio, T.M.; Martins, A.R.; Pon, G.; Faria, M.; Morgado, P.; Pinto, M.L.; Filipe, E.J.M.; de Pinho, M.N. Sorption/Diffusion Contributions to the Gas Permeation Properties of Bi-Soft Segment Polyurethane/Polycaprolactone Membranes for Membrane Blood Oxygenators. Membranes 2020, 10, 8. [Google Scholar] [CrossRef] [PubMed] [Green Version]
- Peixoto, I.; Faria, M.; Gonçalves, M.C. Synthesis and Characterization of Novel Integral Asymmetric Monophasic Cellulose–Acetate/Silica/Titania and Cellulose–Acetate/Titania Membranes. Membranes 2020, 10, 195. [Google Scholar] [CrossRef]
- Andrade, M.C.; Pereira, J.C.; de Almeida, N.; Marques, P.; Faria, M.; Gonçalves, M.C. Improving Hydraulic Permeability, Mechanical Properties, and Chemical Functionality of Cellulose Acetate-Based Membranes by Co-Polymerization with Tetraethyl Orthosilicate and 3-(Aminopropyl) Triethoxysilane. Carbohydr. Polym. 2021, 261, 117813. [Google Scholar] [CrossRef]
- De Pascale, M.; Faria, M.; Boi, C.; Semiao, V.; de Pinho, M.N.; Pekguleryuz, M.O. The Effect of Ultrafiltration Transmembrane Permeation on the Flow Field in a Surrogate System of an Artificial Kidney. Exp. Results 2021, 2, E16. [Google Scholar] [CrossRef]
- Janeca, A.; Rodrigues, F.S.C.; Gonçalves, M.C.; Faria, M. Novel Cellulose Acetate-Based Monophasic Hybrid Membranes for Improved Blood Purification Devices: Characterization under Dynamic Conditions. Membranes 2021, 11, 825. [Google Scholar] [CrossRef]
- Mendes, G.; Faria, M.; Carvalho, A.; Gonçalves, M.C.; de Pinho, M.N. Structure of Water in Hybrid Cellulose Acetate-Silica Ultrafiltration Membranes and Permeation Properties. Carbohydr. Polym. 2018, 189, 342–351. [Google Scholar] [CrossRef]
- Faria, M.; Moreira, C.; Eusébio, T.; Brogueira, P.; de Pinho, M.N. Hybrid Flat Sheet Cellulose Acetate/Silicon Dioxide Ultrafiltration Membranes for Uremic Blood Purification. Cellulose 2020, 27, 3847–3869. [Google Scholar] [CrossRef]
- Kunst, B.; Sourirajan, S. An Approach to the Development of Cellulose Acetate Ultrafiltration Membranes. J. Appl. Polym. Sci. 1974, 18, 3423–3434. [Google Scholar] [CrossRef]
- Brinker, C.J.; Scherer, G.W.; Scherer, G.W. Sol-Gel Science: The Physics and Chemistry of Sol-Gel Processing; Gulf Professional Publishing: Houston, TX, USA, 1990; ISBN 0121349705. [Google Scholar]
- Almeida, R.M.; Gonçalves, M.C. Sol–Gel Process and Products. In Encyclopedia of Glass Science, Technology, History, and Culture; Wiley: New York, NY, USA, 2021; Volume 2, pp. 969–979. [Google Scholar]
- Huggins, M.L. Solutions of Long Chain Compounds. J. Chem. Phys. 1941, 9, 440. [Google Scholar] [CrossRef]
- Huggins, M.L. The Viscosity of Dilute Solutions of Long-Chain Molecules. IV. Dependence on Concentration. J. Am. Chem. Soc. 1942, 64, 2716–2718. [Google Scholar] [CrossRef]
- Huggins, M.L. Some Properties of Solutions of Long-Chain Compounds. J. Phys. Chem. 1942, 46, 151–158. [Google Scholar] [CrossRef]
- Flory, P.J. Thermodynamics of High Polymer Solutions. J. Chem. Phys. 1942, 10, 51–61. [Google Scholar] [CrossRef]
- Marques, A.C.; Vale, M. Macroporosity Control by Phase Separation in Sol-Gel Derived Monoliths and Microspheres. Materials 2021, 14, 4247. [Google Scholar] [CrossRef]
- Kaji, H.; Nakanishi, K.; Soga, N. Polymerization-Induced Phase Separation in Silica Sol-Gel Systems Containing Formamide. J. Solgel Sci. Technol. 1993, 1, 35–46. [Google Scholar] [CrossRef]
- Nakanishi, K.; Soga, N. Phase Separation in Gelling Silica–Organic Polymer Solution: Systems Containing Poly (Sodium Styrenesulfonate). J. Am. Ceram. Soc. 1991, 74, 2518–2530. [Google Scholar] [CrossRef]
- Nakanichi, K. Pore Structure Control of Silica Gels Based on Phased Separation. J. Porous Mater. 1997, 4, 67–112. [Google Scholar] [CrossRef]
- Chiang, Y.-M.; Birnie, D.P.; Kingery, W.D. Physical Ceramics: Principles for Ceramic Science and Engineering; Wiley: New York, NY, USA, 1997; Volume 409. [Google Scholar]
- Costa, A.R.; de Pinho, M.N. The Role of Membrane Morphology on Ultrafiltration for Natural Organic Matter Removal. Desalination 2002, 145, 299–304. [Google Scholar] [CrossRef]
- Arthanareeswaran, G.; Devi, T.K.S.; Raajenthiren, M. Effect of Silica Particles on Cellulose Acetate Blend Ultrafiltration Membranes: Part I. Sep. Purif. Technol. 2008, 64, 38–47. [Google Scholar] [CrossRef]
- Sivakumar, M.; Mohanasundaram, A.K.; Mohan, D.; Balu, K.; Rangarajan, R. Modification of Cellulose Acetate: Its Characterization and Application as an Ultrafiltration Membrane. J. Appl. Polym. Sci. 1998, 67, 1939–1946. [Google Scholar] [CrossRef]
- Kesting, R.E.; Menefee, A. The Role of Formamide in the Preparation of Cellulose Acetate Membranes by the Phase Inversion Process. Kolloid-Z. Und Z. Für Polym. 1969, 230, 341–346. [Google Scholar] [CrossRef]
- Murphy, D.; de Pinho, M.N. An ATR-FTIR Study of Water in Cellulose Acetate Membranes Prepared by Phase Inversion. J. Memb. Sci. 1995, 106, 245–257. [Google Scholar] [CrossRef]
- Toprak, C.; Agar, J.N.; Falk, M. State of Water in Cellulose Acetate Membranes. J. Chem. Soc. Faraday Trans. 1 Phys. Chem. Condens. Phases 1979, 75, 803–815. [Google Scholar] [CrossRef]
- Mukherjee, S.P.; Evans, P.E. The Deposition of Thin Films by the Decomposition of Tetra-Ethoxy Silane in a Radio Frequency Glow Discharge. Thin Solid. Film. 1972, 14, 105–118. [Google Scholar] [CrossRef]
- Stamatialis, D.F.; Dias, C.R.; de Pinho, M.N. Structure and Permeation Properties of Cellulose Esters Asymmetric Membranes. Biomacromolecules 2000, 1, 564–570. [Google Scholar] [CrossRef] [PubMed]
- Nunes, S.; Ramacciotti, F.; Neves, A.; Angelin, E.M.; Ramos, A.M.; Roldão, É.; Wallaszkovits, N.; Armijo, A.A.; Melo, M.J. A Diagnostic Tool for Assessing the Conservation Condition of Cellulose Nitrate and Acetate in Heritage Collections: Quantifying the Degree of Substitution by Infrared Spectroscopy. Herit. Sci. 2020, 8, 33. [Google Scholar] [CrossRef] [Green Version]
- Al-Oweini, R.; El-Rassy, H. Synthesis and Characterization by FTIR Spectroscopy of Silica Aerogels Prepared Using Several Si(OR)4 and R′′ Si(OR′)3 Precursors. J. Mol. Struct. 2009, 919, 140–145. [Google Scholar] [CrossRef]
- Minhas, F.T.; Farrukh, S.; Hussain, A.; Mujahid, M. Comparison of Silica and Novel Functionalized Silica-Based Cellulose Acetate Hybrid Membranes in Gas Permeation Study. J. Polym. Res. 2015, 22, 63. [Google Scholar] [CrossRef]
- Naghsh, M.; Sadeghi, M.; Moheb, A.; Chenar, M.P.; Mohagheghian, M. Separation of Ethylene/Ethane and Propylene/Propane by Cellulose Acetate–Silica Nanocomposite Membranes. J. Memb. Sci. 2012, 423, 97–106. [Google Scholar] [CrossRef]
- Wojciechowska, P.; Foltynowicz, Z.; Nowicki, M. Synthesis and Characterization of Modified Cellulose Acetate Propionate Nanocomposites via Sol-Gel Process. J. Spectrosc. 2013, 2013, 616159. [Google Scholar] [CrossRef]
- Wojciechowska, P.; Foltynowicz, Z.; Nowicki, M. Celluloseacetate Butyrate Nanocomposites Synthesized via Sol-Gel Method. Polimery 2013, 58, 543–549. [Google Scholar] [CrossRef]
- Bartholomew, R.F.; Butler, B.L.; Hoover, H.L.; Wu, C.K. Infrared Spectra of a Water-containing Glass. J. Am. Ceram. Soc. 1980, 63, 481–485. [Google Scholar] [CrossRef]
- Warring, S.L.; Beattie, D.A.; McQuillan, A.J. Surficial Siloxane-to-Silanol Interconversion during Room-Temperature Hydration/Dehydration of Amorphous Silica Films Observed by ATR-IR and TIR-Raman Spectroscopy. Langmuir 2016, 32, 1568–1576. [Google Scholar] [CrossRef] [PubMed]


| Series One | Composition (g) | CA1/SiO2 100/0 | CA1/SiO2 90/10 | CA1/SiO2 80/20 | CA1/SiO2 70/30 |
|---|---|---|---|---|---|
| Polymer | CA | 17.00 | 15.80 | 14.50 | 13.10 |
| Solvent | Formamide | 30.00 | 27.90 | 25.60 | 23.10 |
| Solvent | Acetone | 53.00 | 49.20 | 45.20 | 40.90 |
| Silica precursor | TEOS | - | 6.10 | 12.60 | 19.50 |
| Reactant | H2O | - | 1.00 | 2.10 | 3.40 |
| Catalyst | HNO3 | - | pH~2 | pH~2 | pH~2 |
| TEOS/CA | TEOS/CA | - | 0.39 | 0.87 | 1.49 |
| CA/(solvent) | CA/(formamide + acetone) | 0.20 | 0.20 | 0.20 | 0.20 |
| Formamide/Acetone | 0.57 | 0.57 | 0.57 | 0.57 | |
| Series Two | Composition (g) | CA2/SiO2 100/0 | CA2/SiO2 90/10 | CA2/SiO2 80/20 | CA2/SiO2 70/30 |
| Polymer | CA | 17.00 | 17.00 | 17.00 | 17.00 |
| Solvent | Formamide | 35.00 | 35.00 | 35.00 | 35.00 |
| Solvent | Acetone | 48.00 | 48.00 | 48.00 | 48.00 |
| Silica precursor | TEOS | - | 6.55 | 14.70 | 25.30 |
| Reactant | H2O | - | 1.00 | 2.10 | 3.40 |
| Catalyst | HNO3 | - | pH~2 | pH~2 | pH~2 |
| TEOS/CA | TEOS/CA | - | 0.39 | 0.86 | 1.49 |
| CA/(solvent) | CA/(formamide + acetone) | 0.20 | 0.20 | 0.20 | 0.20 |
| Formamide/acetone | 0.73 | 0.73 | 0.73 | 0.73 |
| νδ(C-O) | νδ(C-O-C) | νδ(Si-O-C) | νδ(Si-O-Si) | |||||
|---|---|---|---|---|---|---|---|---|
| CA1/SiO2 | ν (cm−1) | A (%) | ν (cm−1) | A (%) | ν (cm−1) | A (%) | ν (cm−1) | A (%) |
| 100/0 | 1038 | 67 | 1069 | 33 | - | - | - | - |
| 90/10 | 1039 | 51 | 1070 | 33 | 1111 | 9 | 1160 | 7 |
| 80/20 | 1041 | 52 | 1074 | 29 | 1114 | 12 | 1157 | 6 |
| 70/30 | 1031 | 57 | 1075 | 25 | 1112 | 14 | 1154 | 4 |
| νδ(C-O) | νδ(C-O-C) | νδ(Si-O-C) | νδ(Si-O-Si) | |||||
|---|---|---|---|---|---|---|---|---|
| CA2/SiO2 | ν (cm−1) | A (%) | ν (cm−1) | A (%) | ν (cm−1) | A (%) | ν (cm−1) | A (%) |
| 100/0 | 1034 | 68 | 1066 | 32 | - | - | - | - |
| 90/10 | 1041 | 46 | 1071 | 32 | 1123 | 16 | 1160 | 6 |
| 80/20 | 1042 | 51 | 1074 | 31 | 1123 | 11 | 1160 | 6 |
| 70/30 | 1039 | 57 | 1072 | 29 | 1124 | 8 | 1160 | 6 |
Disclaimer/Publisher’s Note: The statements, opinions and data contained in all publications are solely those of the individual author(s) and contributor(s) and not of MDPI and/or the editor(s). MDPI and/or the editor(s) disclaim responsibility for any injury to people or property resulting from any ideas, methods, instructions or products referred to in the content. |
© 2023 by the authors. Licensee MDPI, Basel, Switzerland. This article is an open access article distributed under the terms and conditions of the Creative Commons Attribution (CC BY) license (https://creativecommons.org/licenses/by/4.0/).
Share and Cite
Zare, F.; Gonçalves, S.B.; Faria, M.; Gonçalves, M.C. Improving Structural Homogeneity, Hydraulic Permeability, and Mechanical Performance of Asymmetric Monophasic Cellulose Acetate/Silica Membranes: Spinodal Decomposition Mix. Membranes 2023, 13, 346. https://doi.org/10.3390/membranes13030346
Zare F, Gonçalves SB, Faria M, Gonçalves MC. Improving Structural Homogeneity, Hydraulic Permeability, and Mechanical Performance of Asymmetric Monophasic Cellulose Acetate/Silica Membranes: Spinodal Decomposition Mix. Membranes. 2023; 13(3):346. https://doi.org/10.3390/membranes13030346
Chicago/Turabian StyleZare, Fahimeh, Sérgio B. Gonçalves, Mónica Faria, and Maria Clara Gonçalves. 2023. "Improving Structural Homogeneity, Hydraulic Permeability, and Mechanical Performance of Asymmetric Monophasic Cellulose Acetate/Silica Membranes: Spinodal Decomposition Mix" Membranes 13, no. 3: 346. https://doi.org/10.3390/membranes13030346