
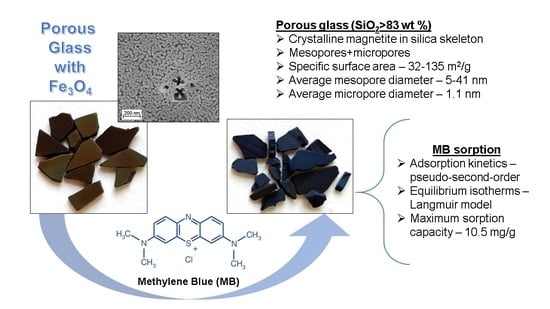
Novel Inorganic Membranes Based on Magnetite-Containing Silica Porous Glasses for Ultrafiltration: Structure and Sorption Properties
 ,
,
Abstract
:
1. Introduction
2. Materials and Methods
2.1. Glass Synthesis
2.2. Chemical Analysis of Glasses
2.3. X-ray Powder Diffractometry (XRPD)
2.4. Raman Spectroscopy
2.5. Leaching Kinetics
2.6. Classical Gas Adsorption Method
2.7. Methylene Blue Adsorption Studies
3. Results
3.1. Phase-Separated Glasses
3.1.1. Structure
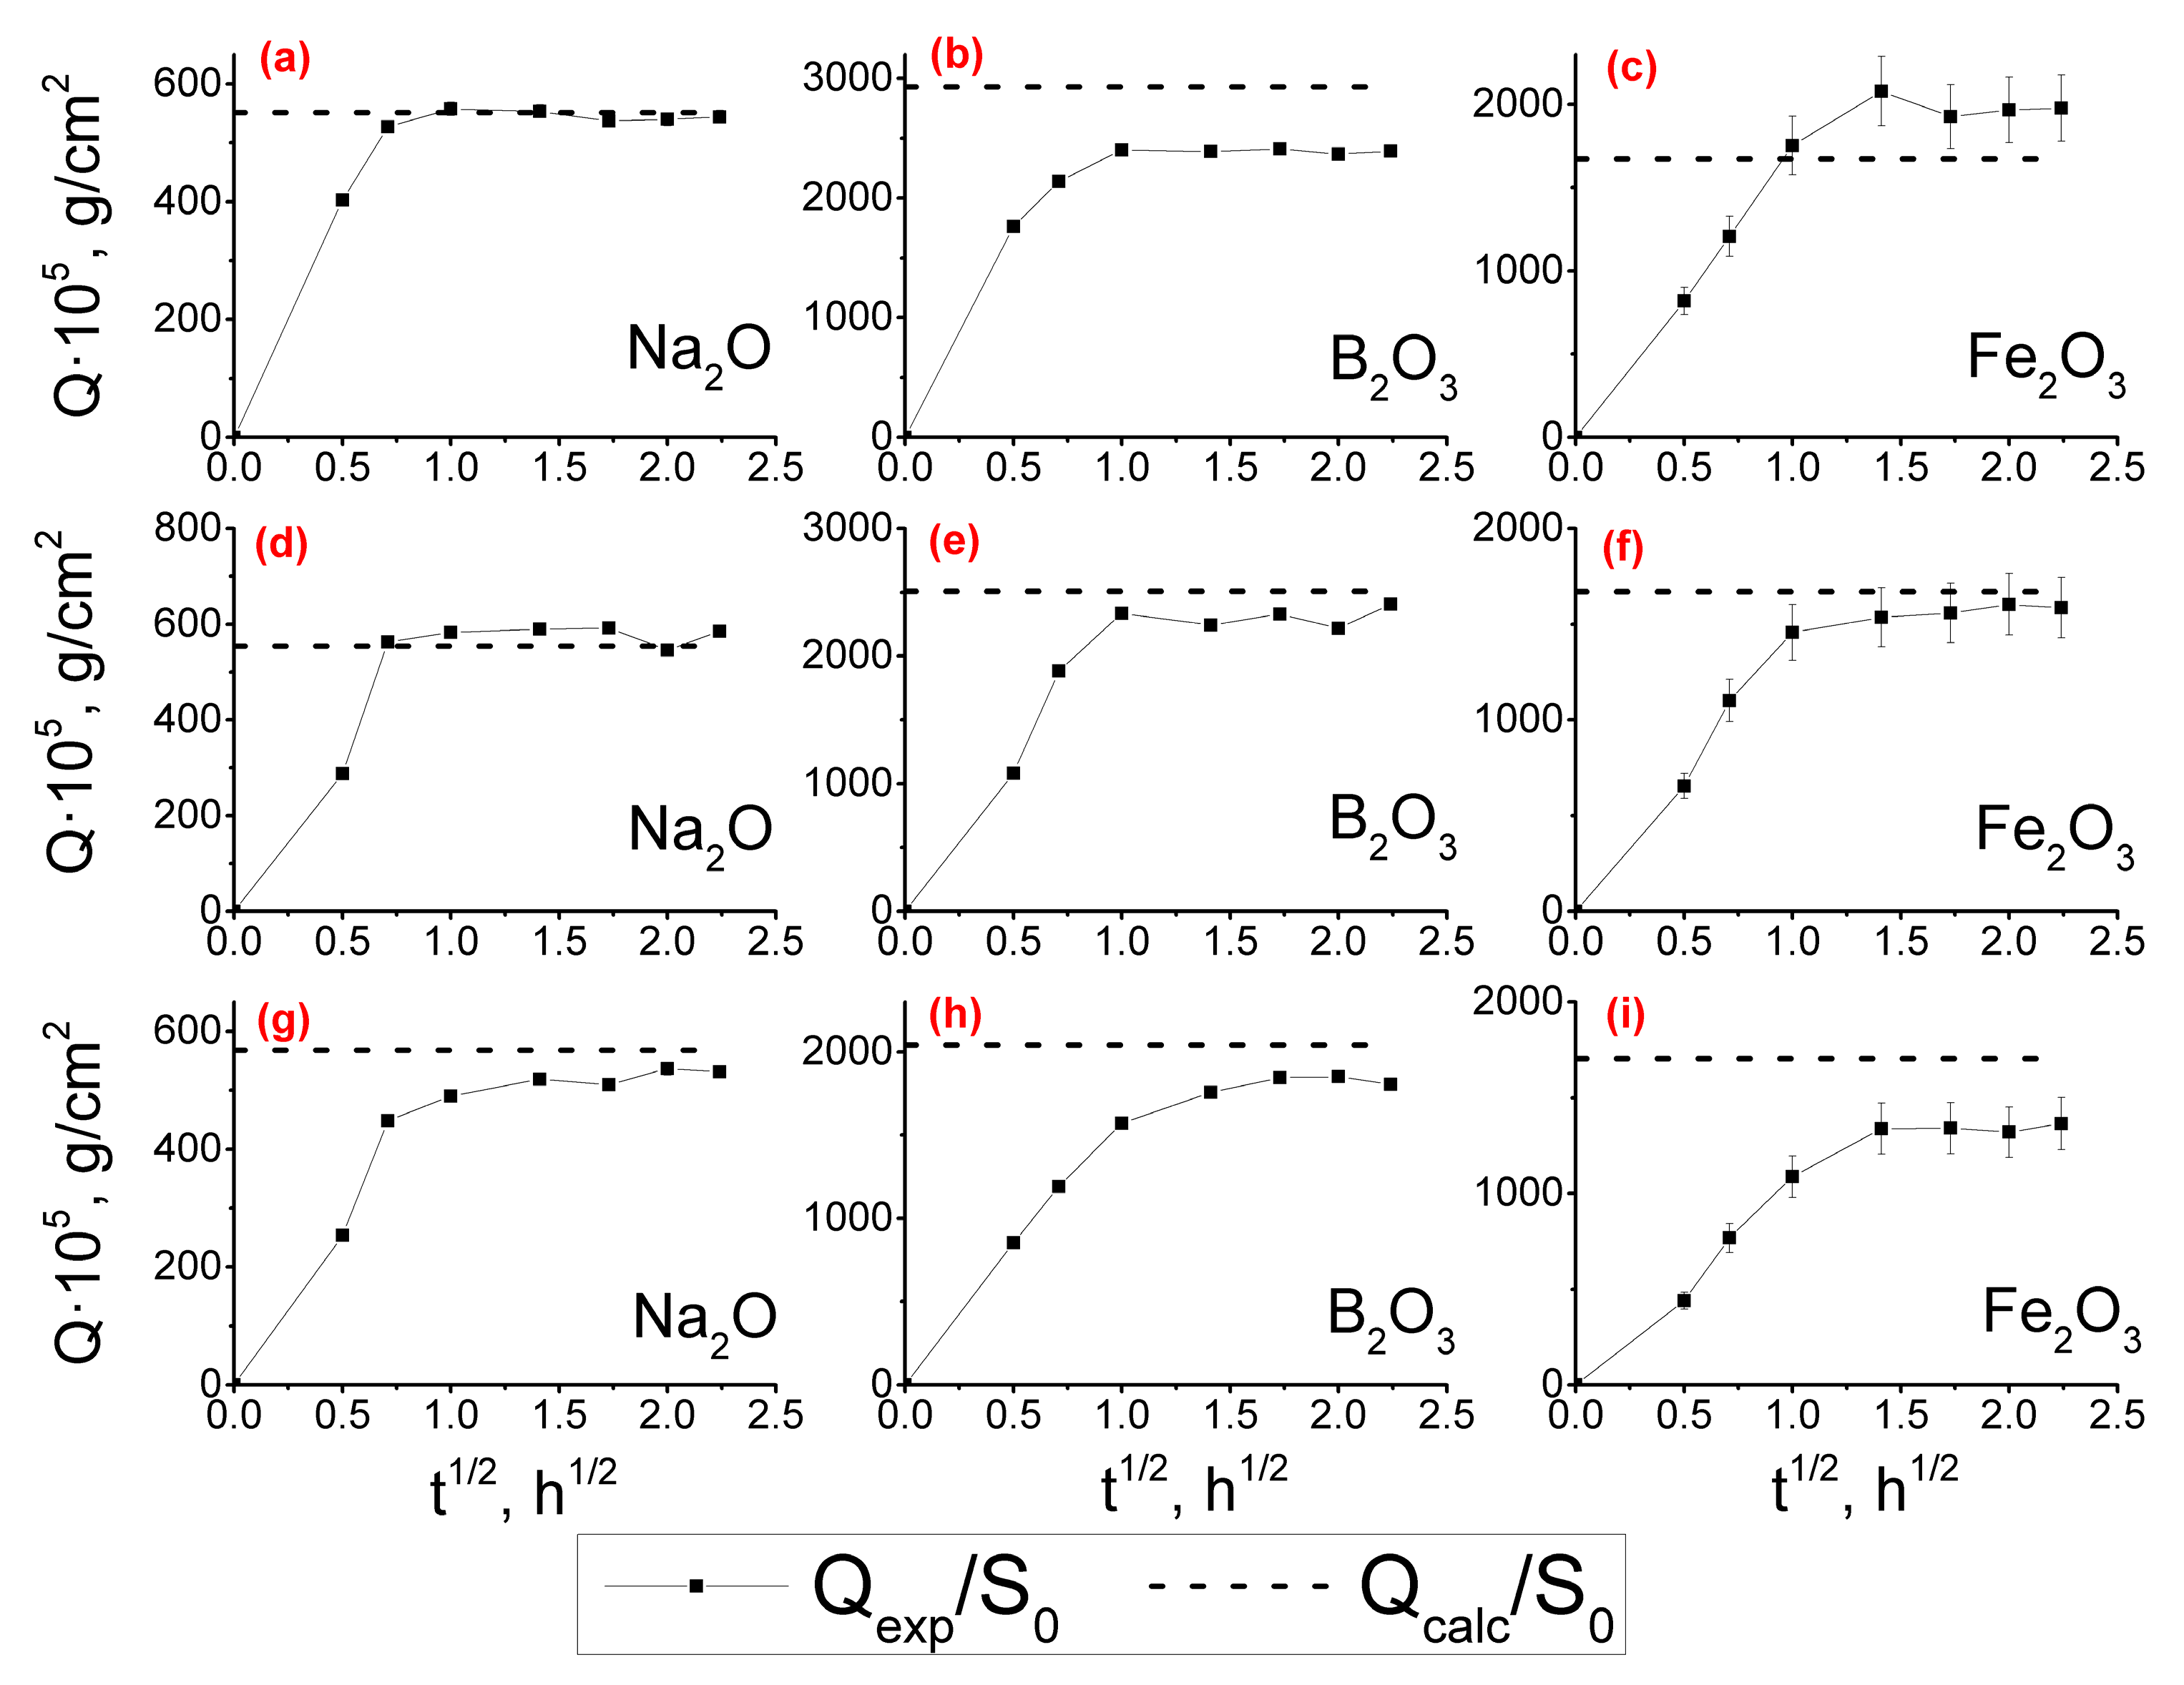
3.1.2. Leaching Kinetics
3.2. Porous Glasses
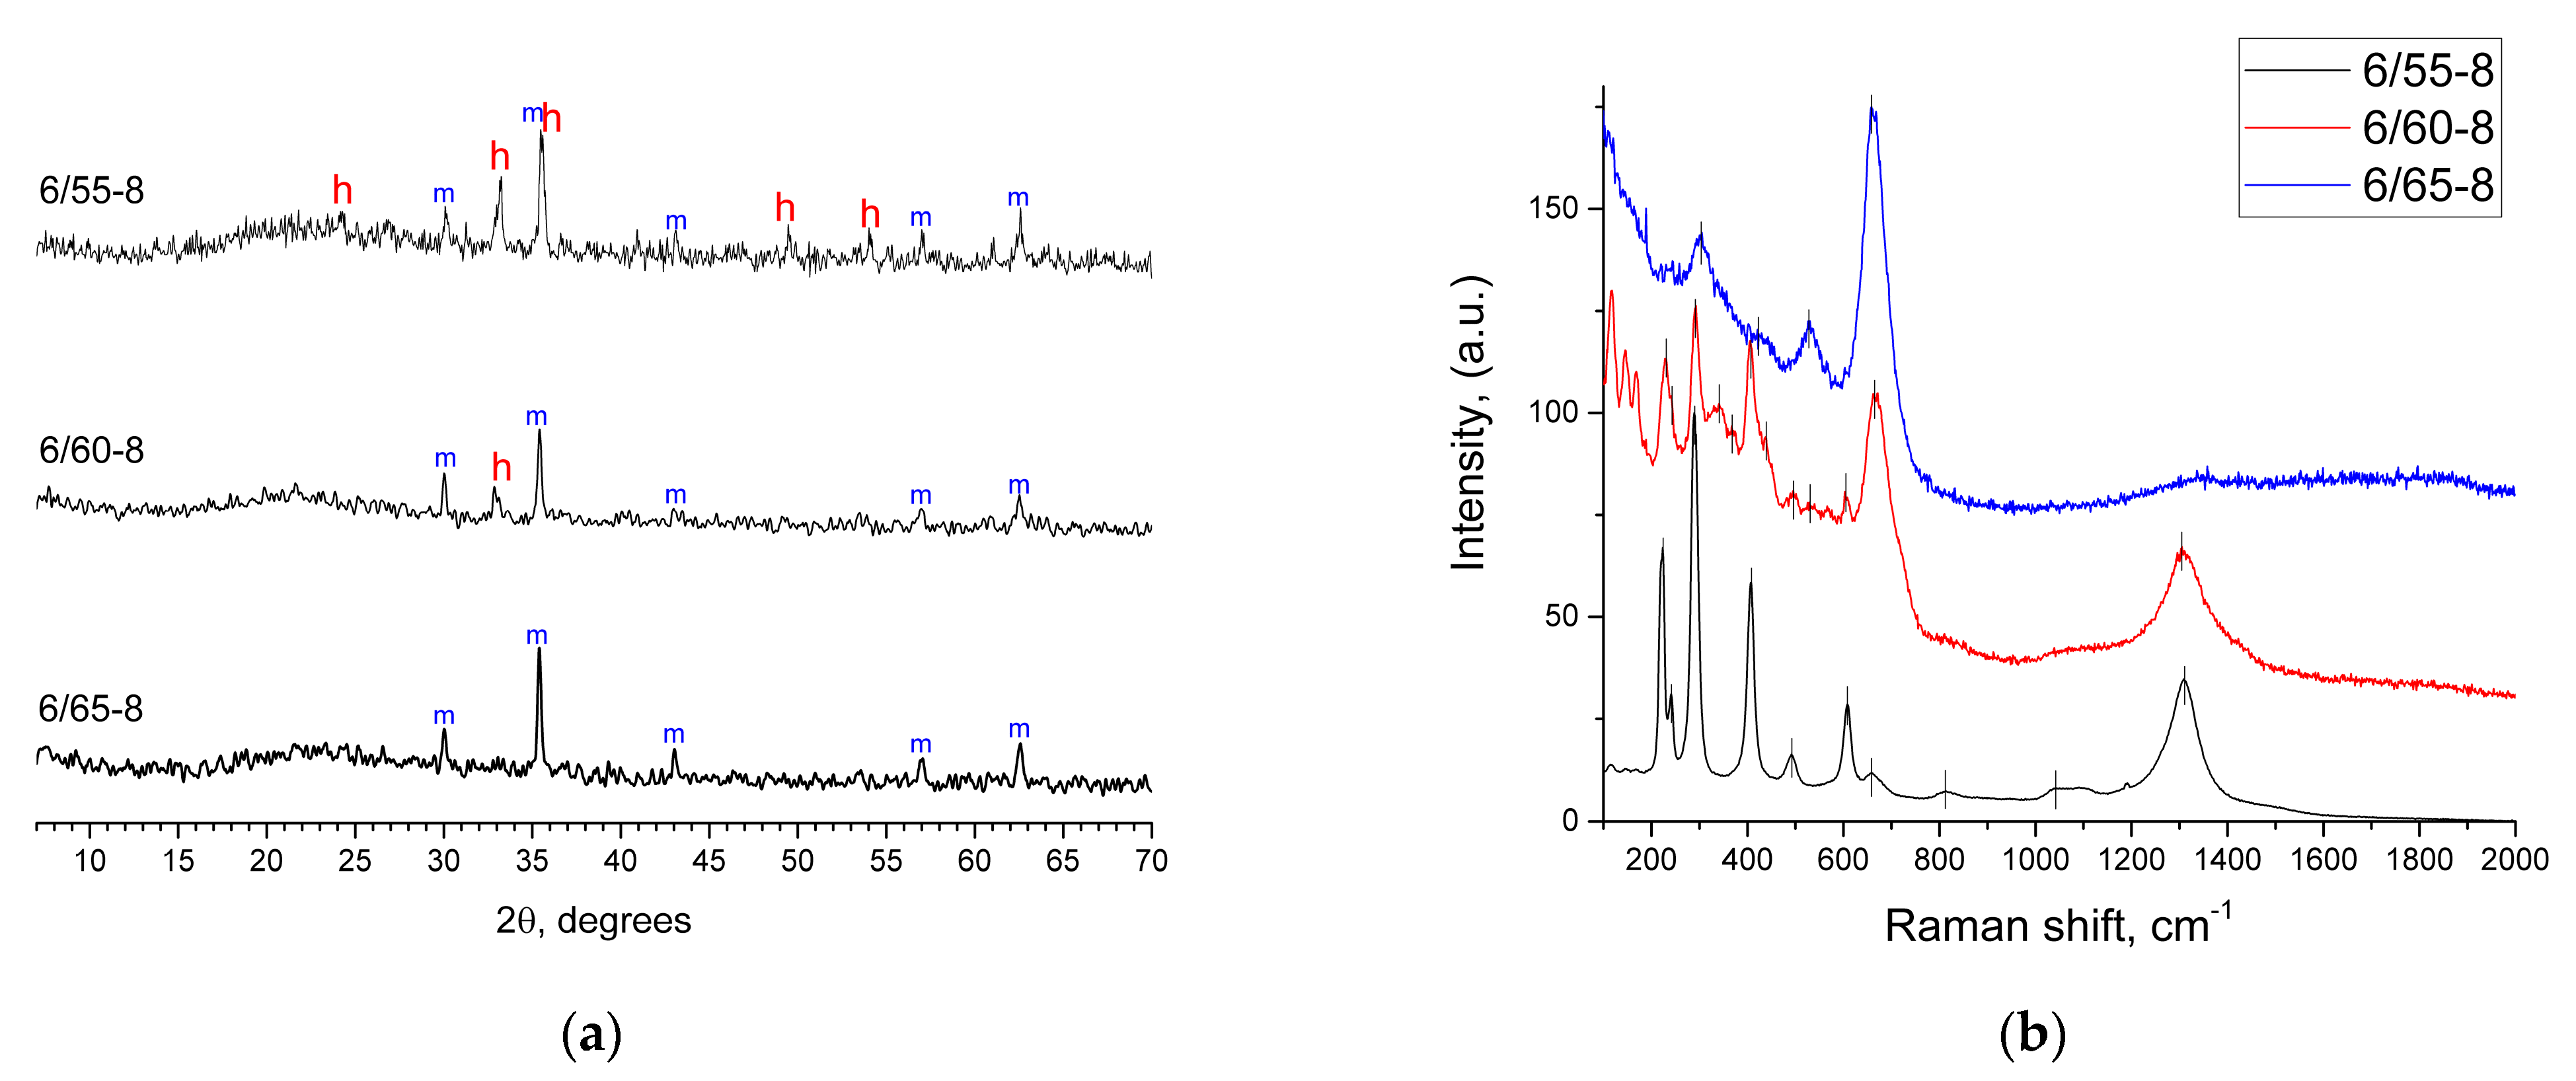
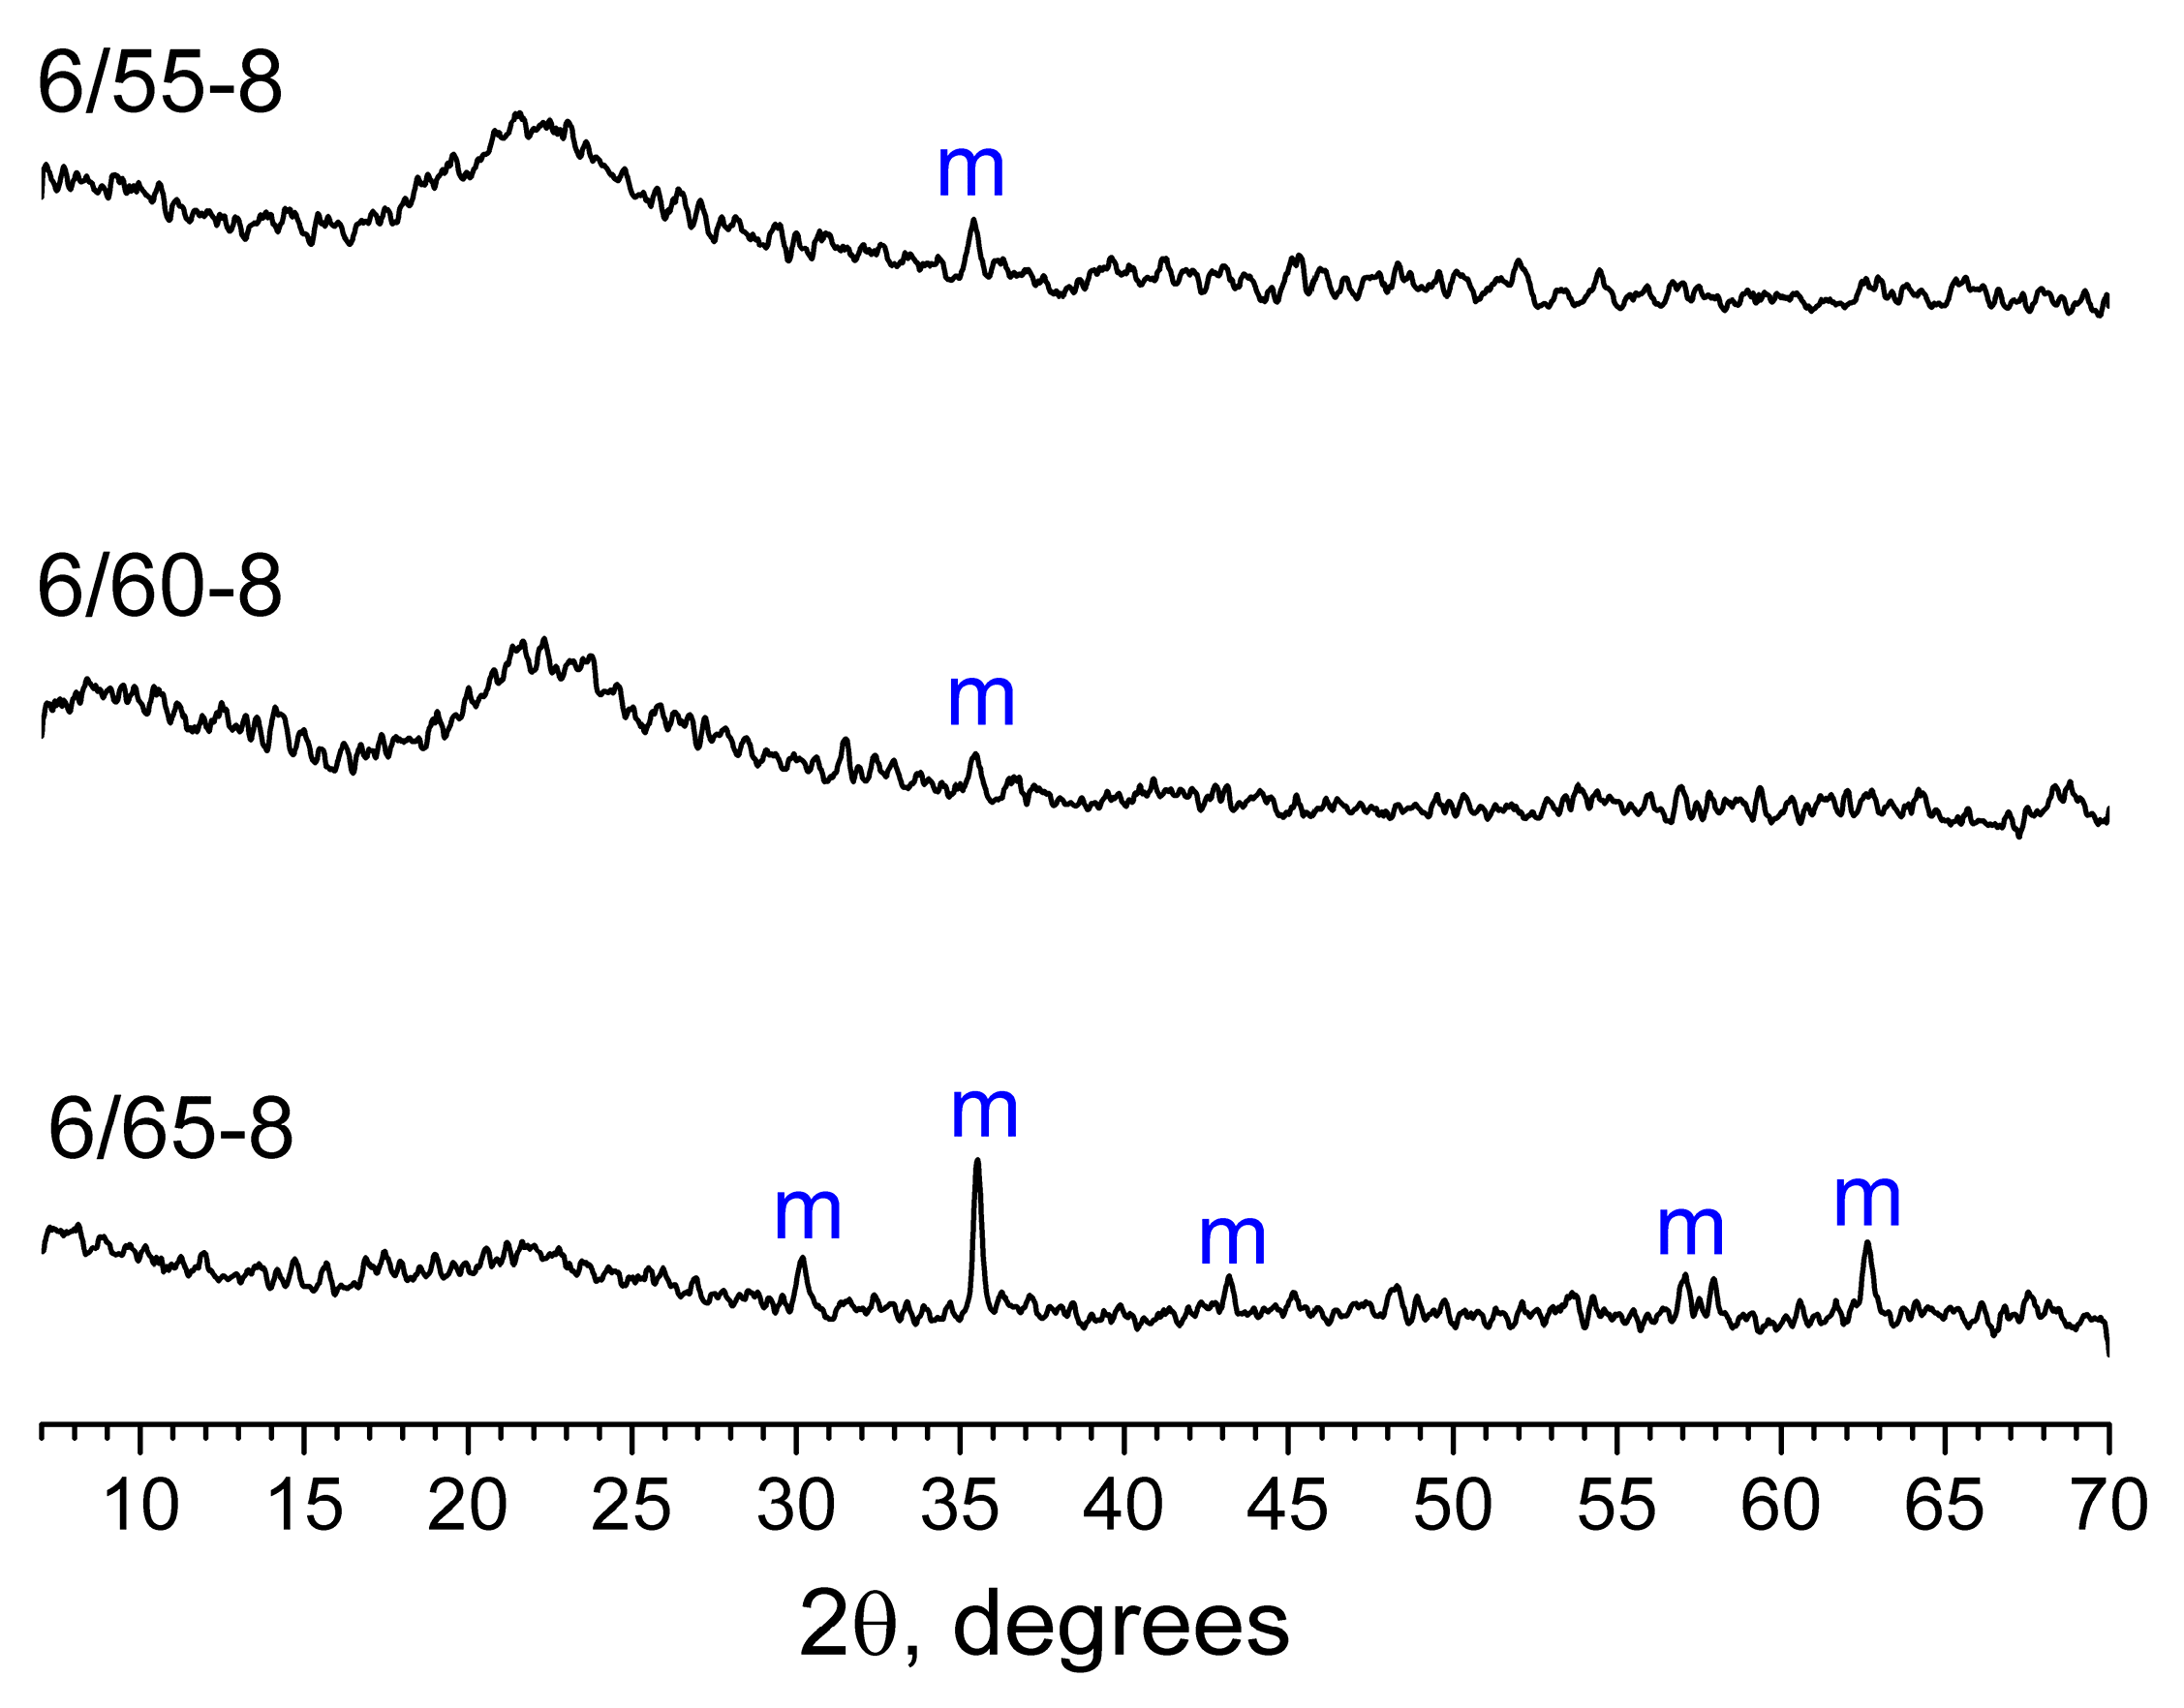
3.2.1. XRPD Results
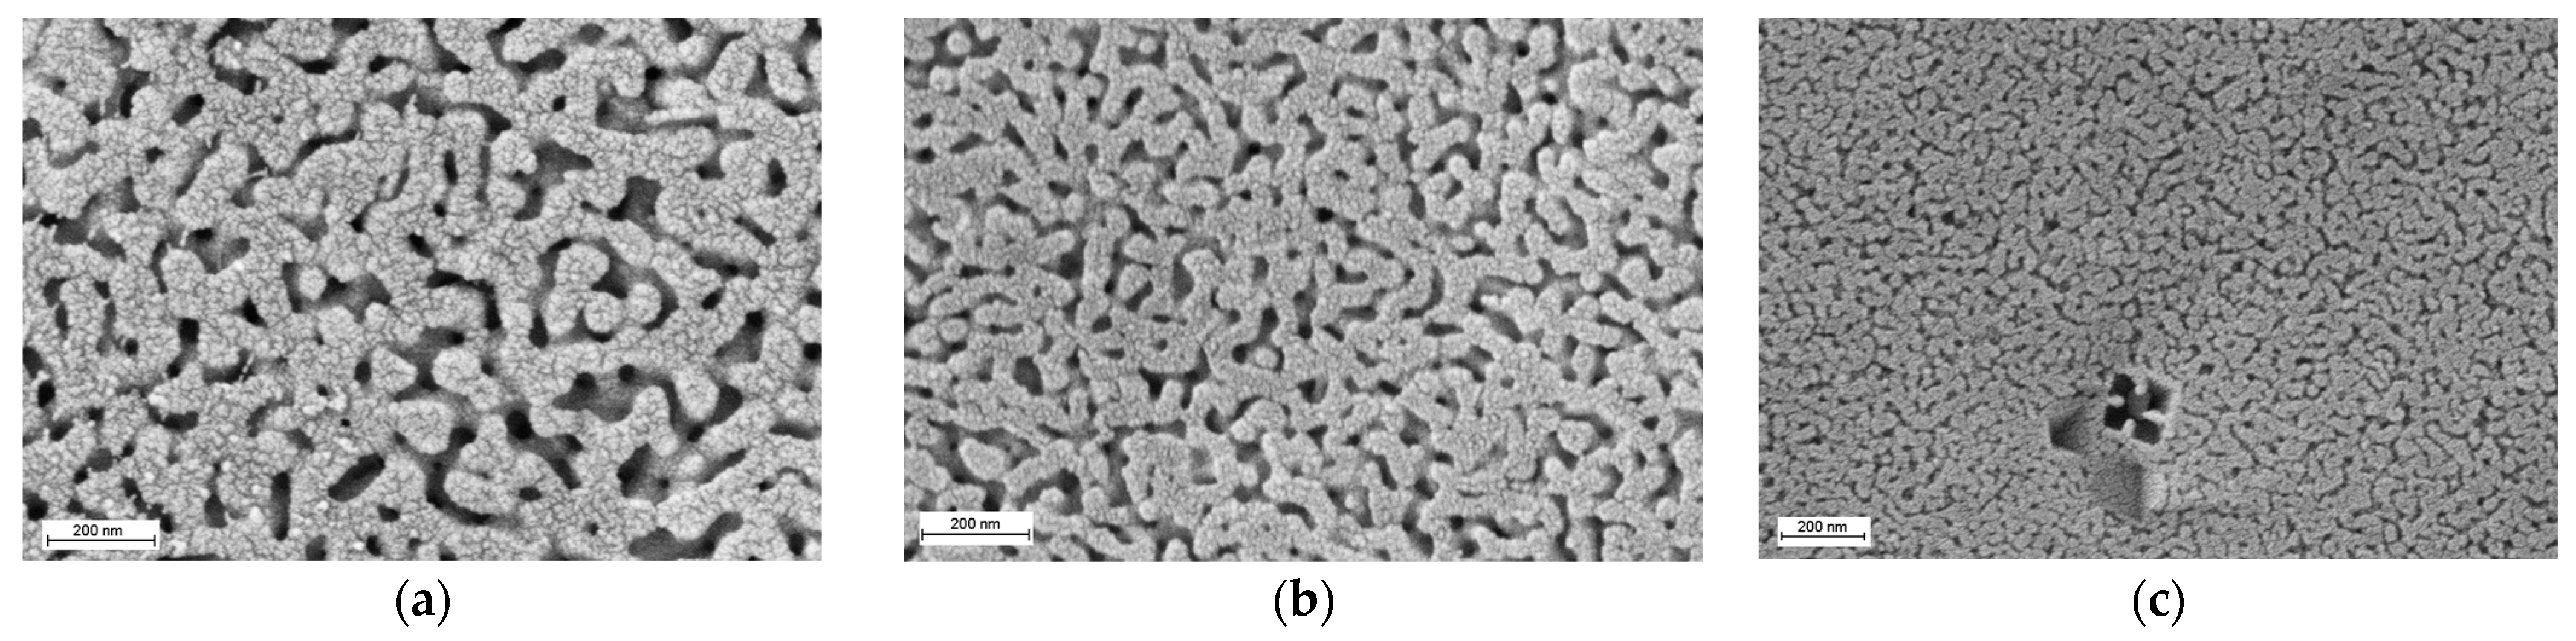
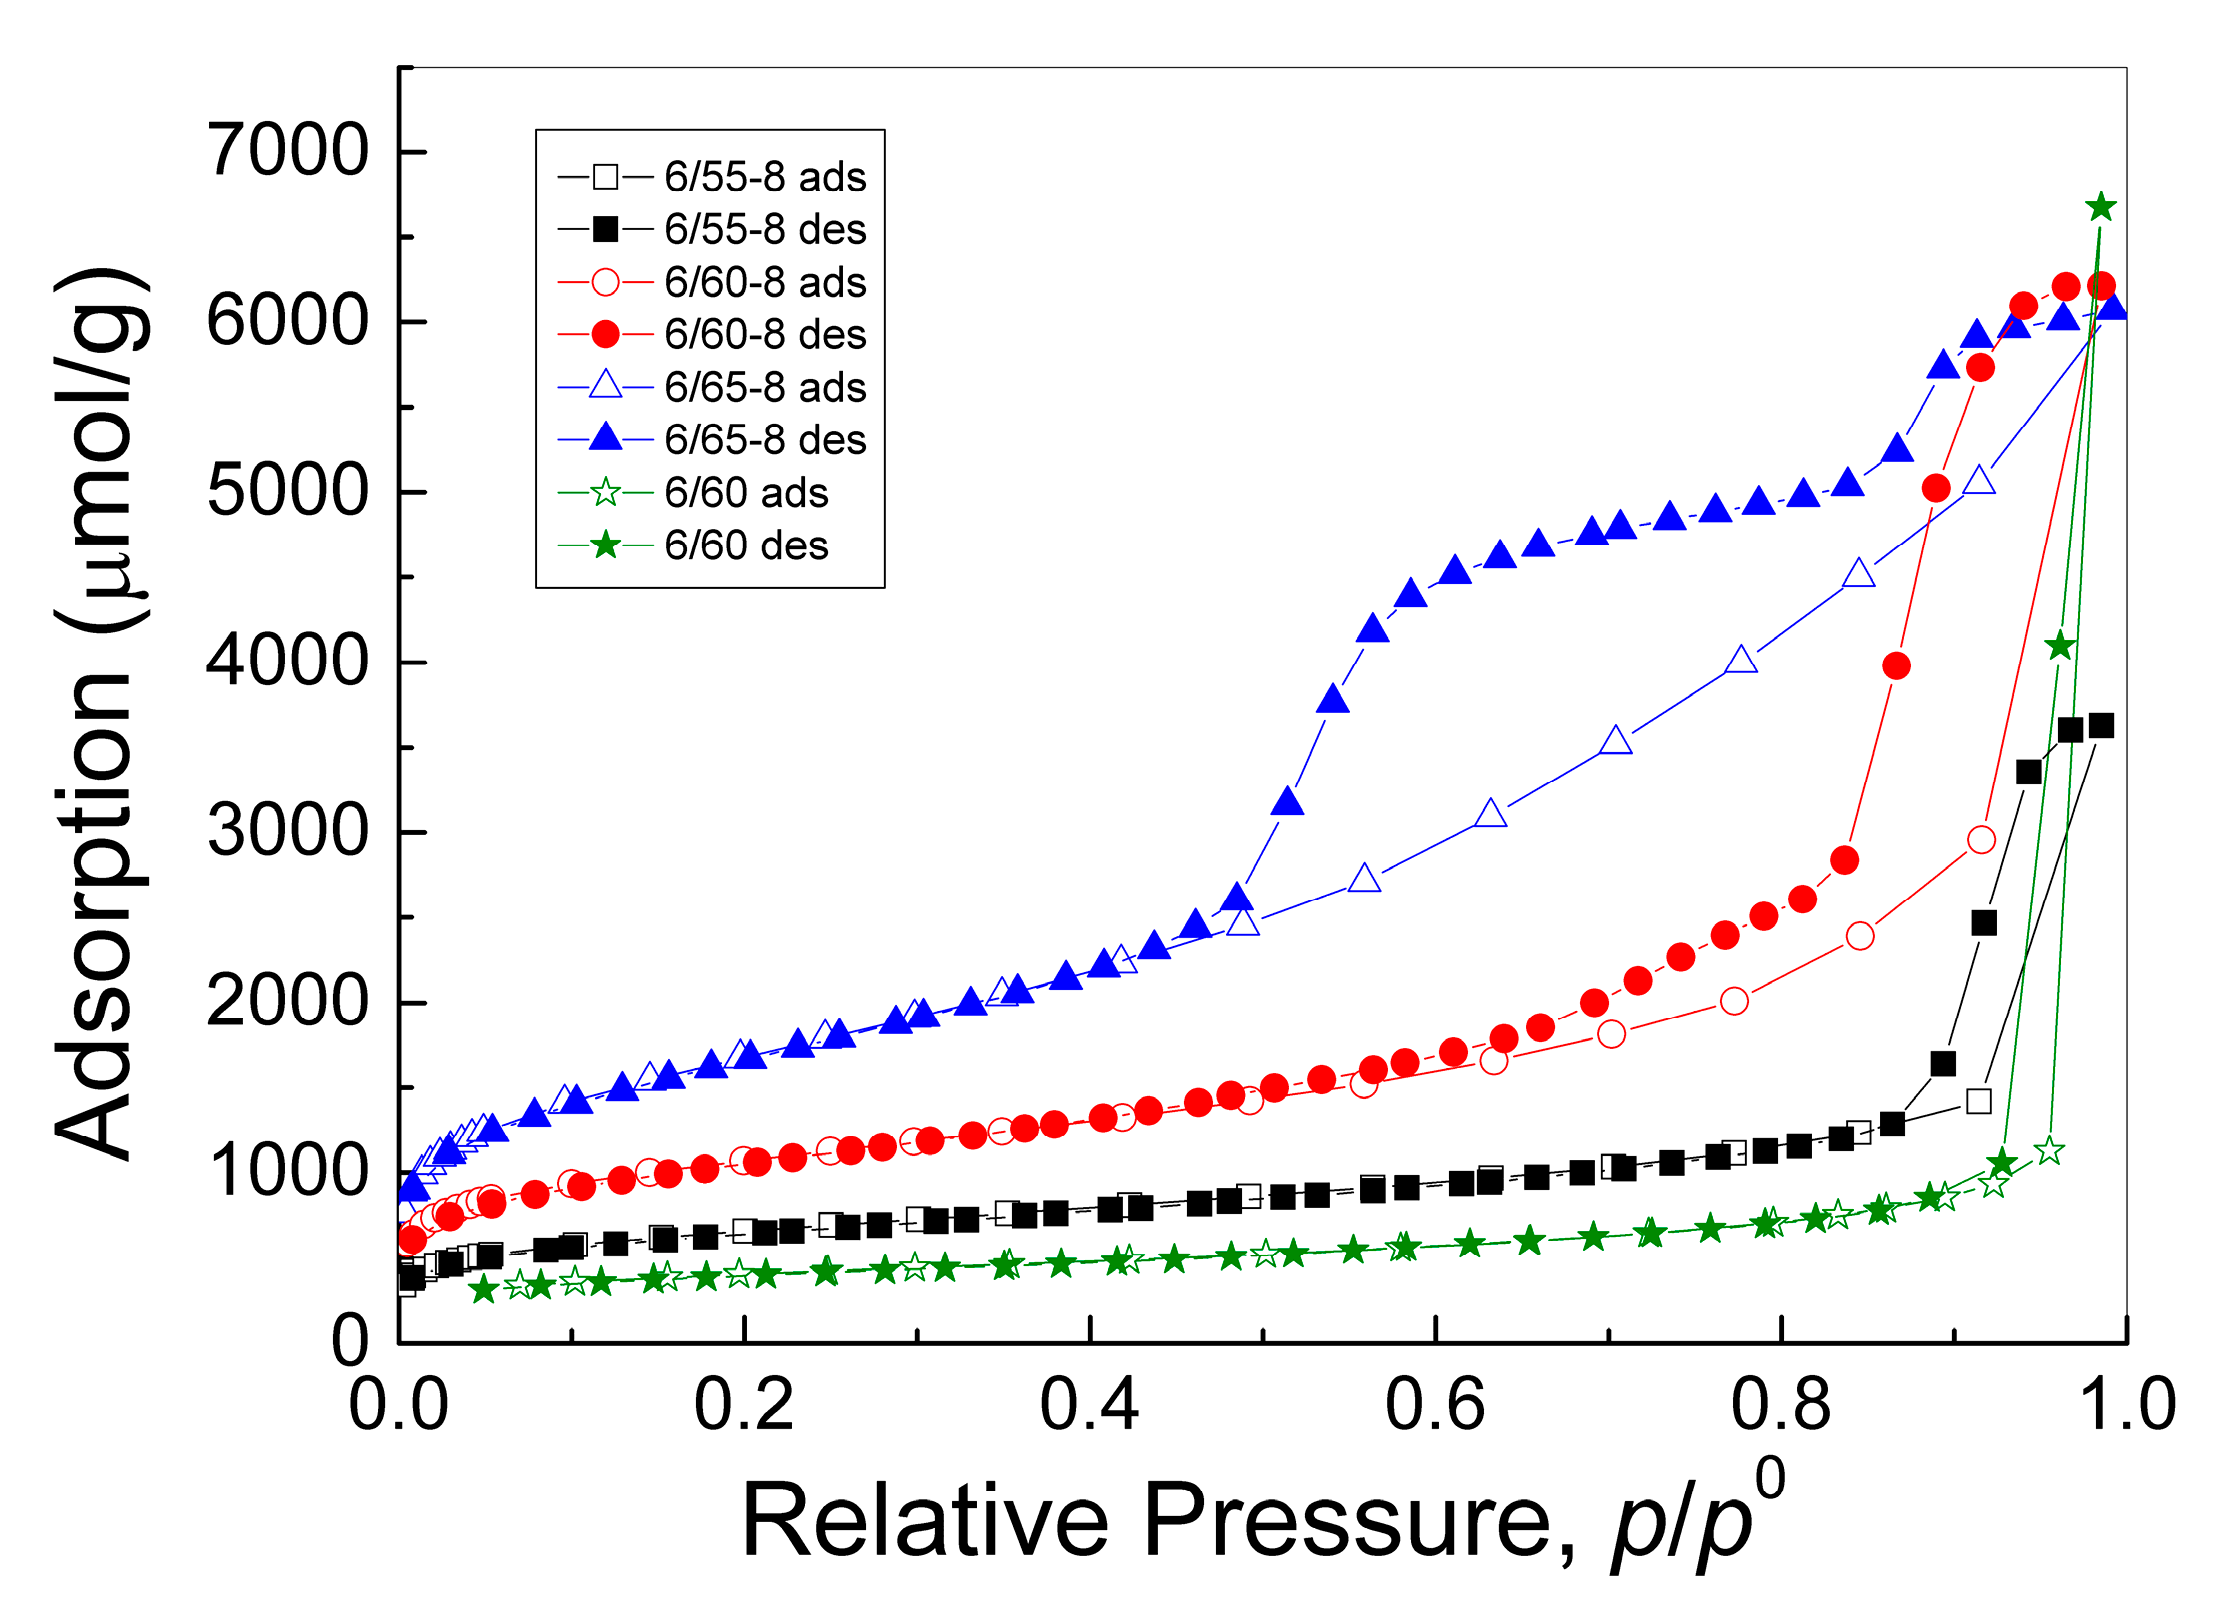
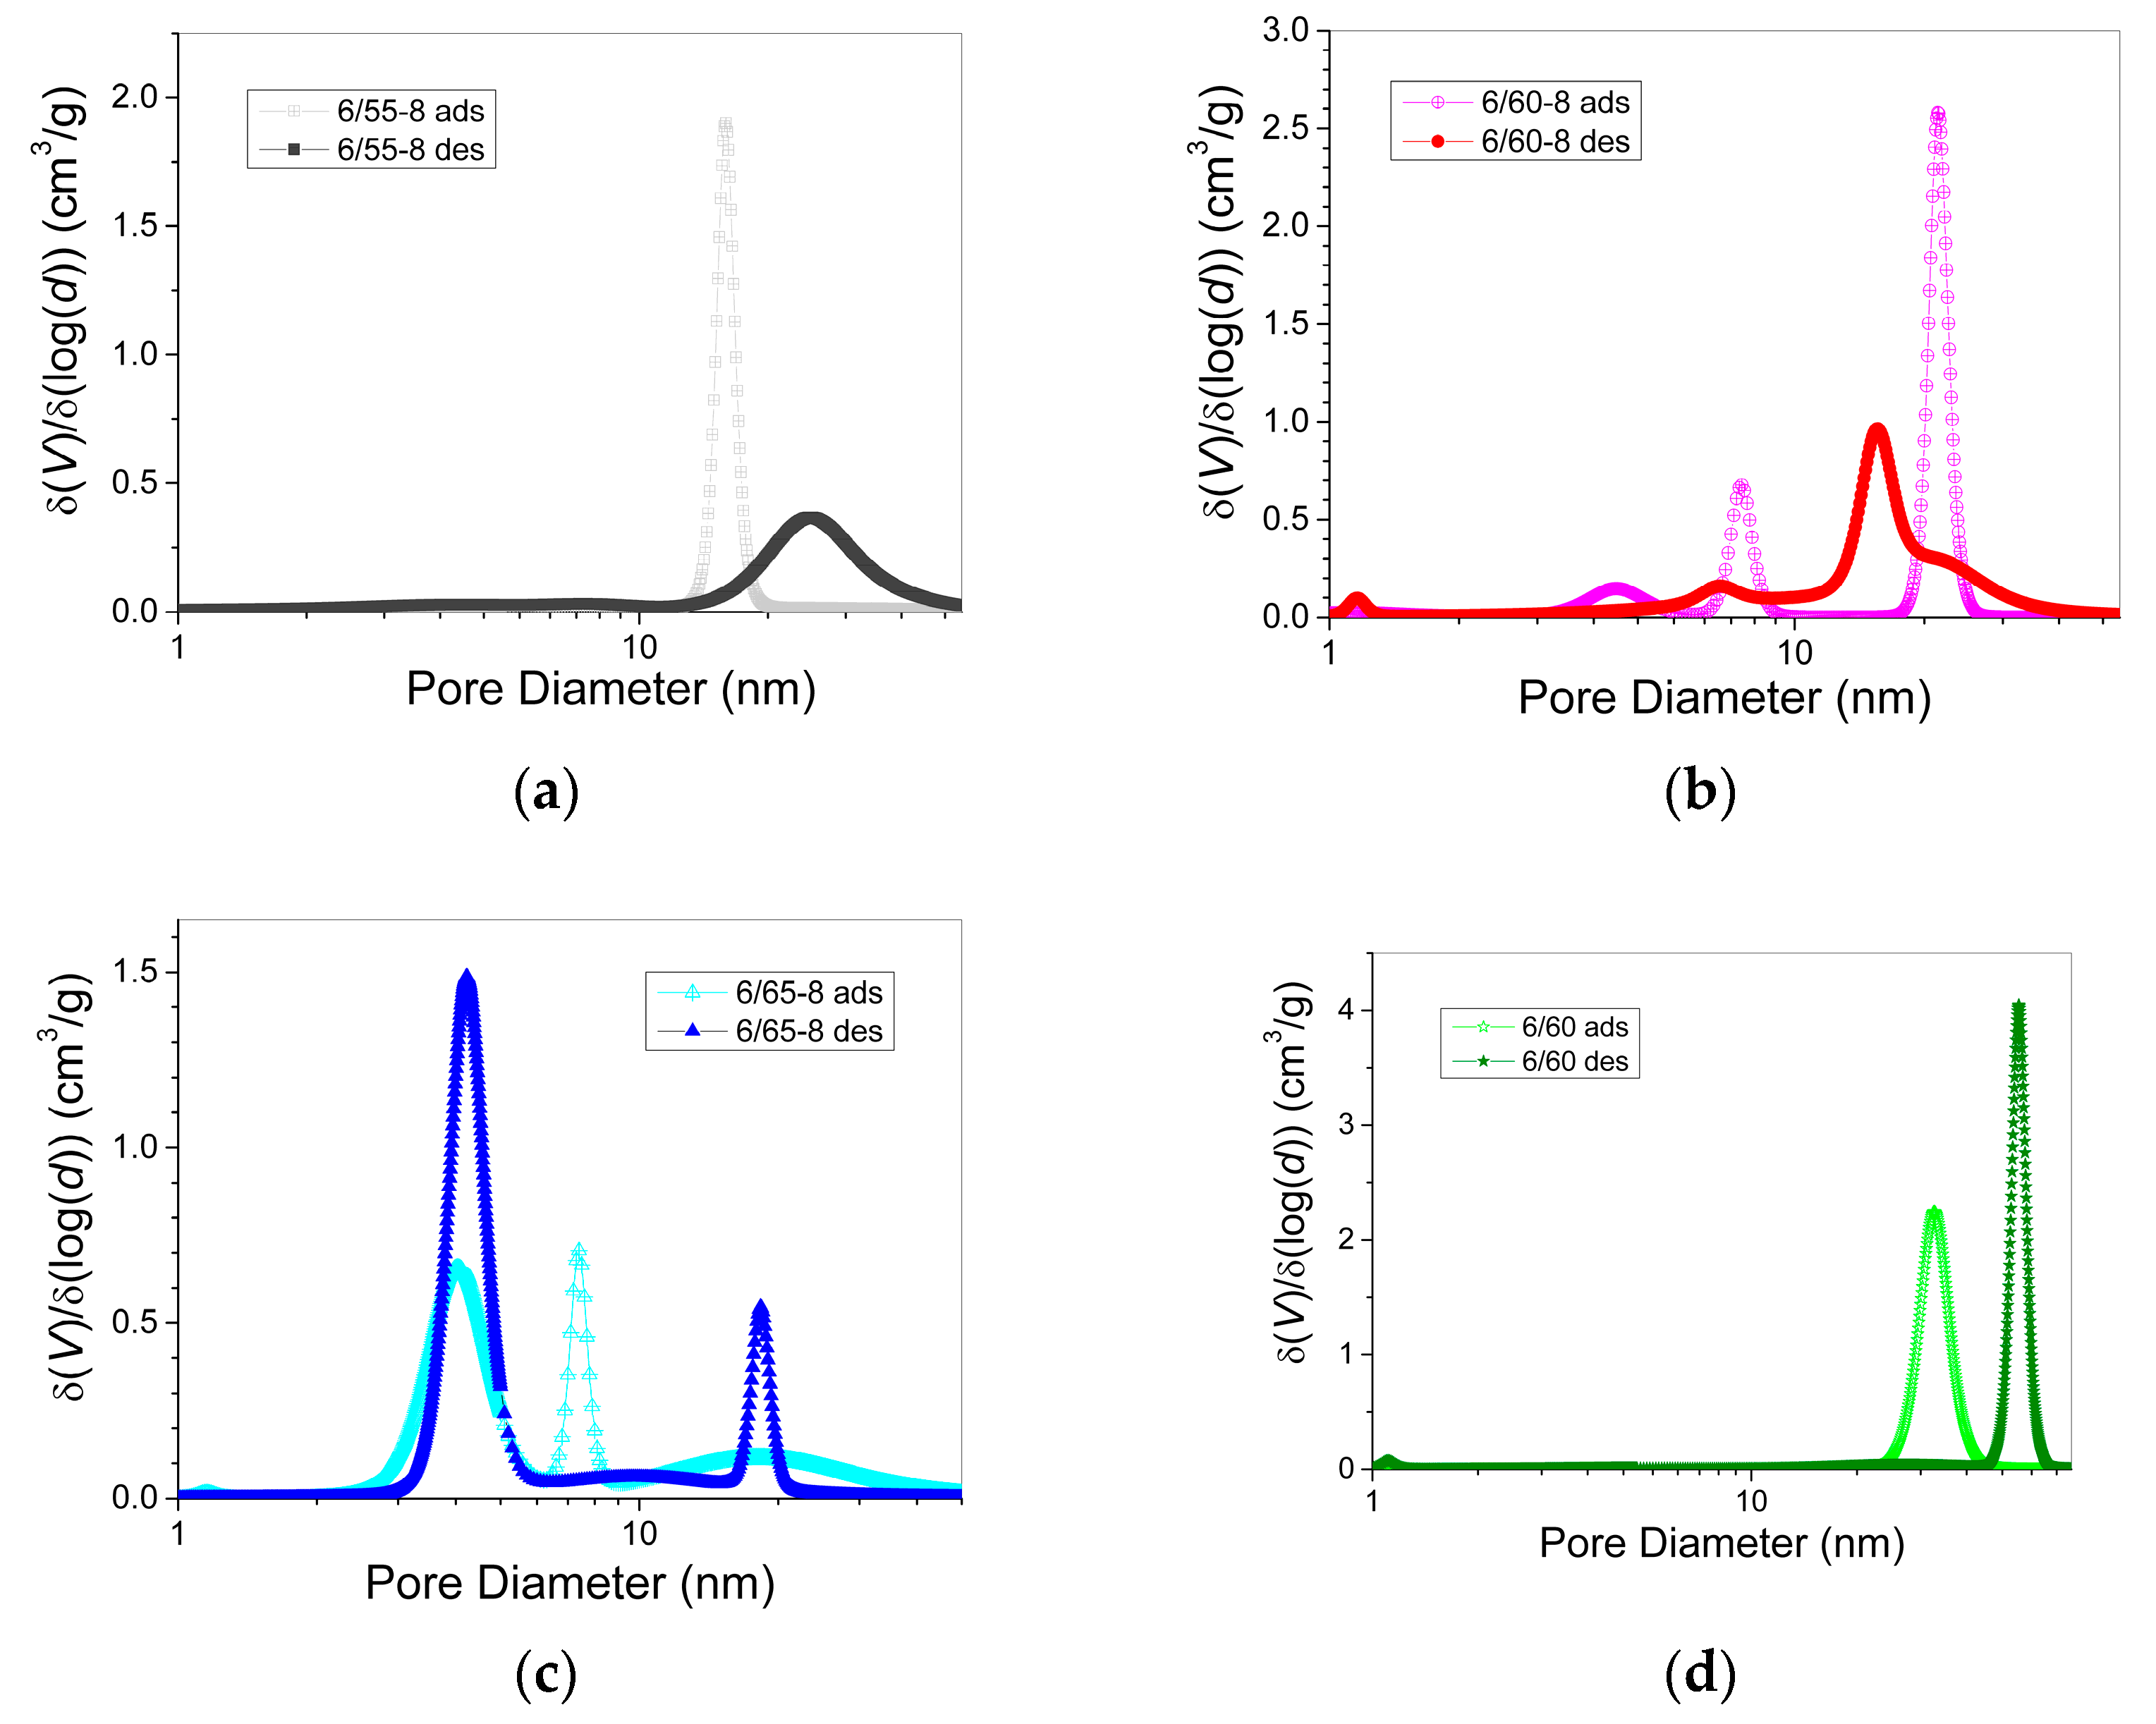
3.2.2. Structural Characteristics of Porous Glasses
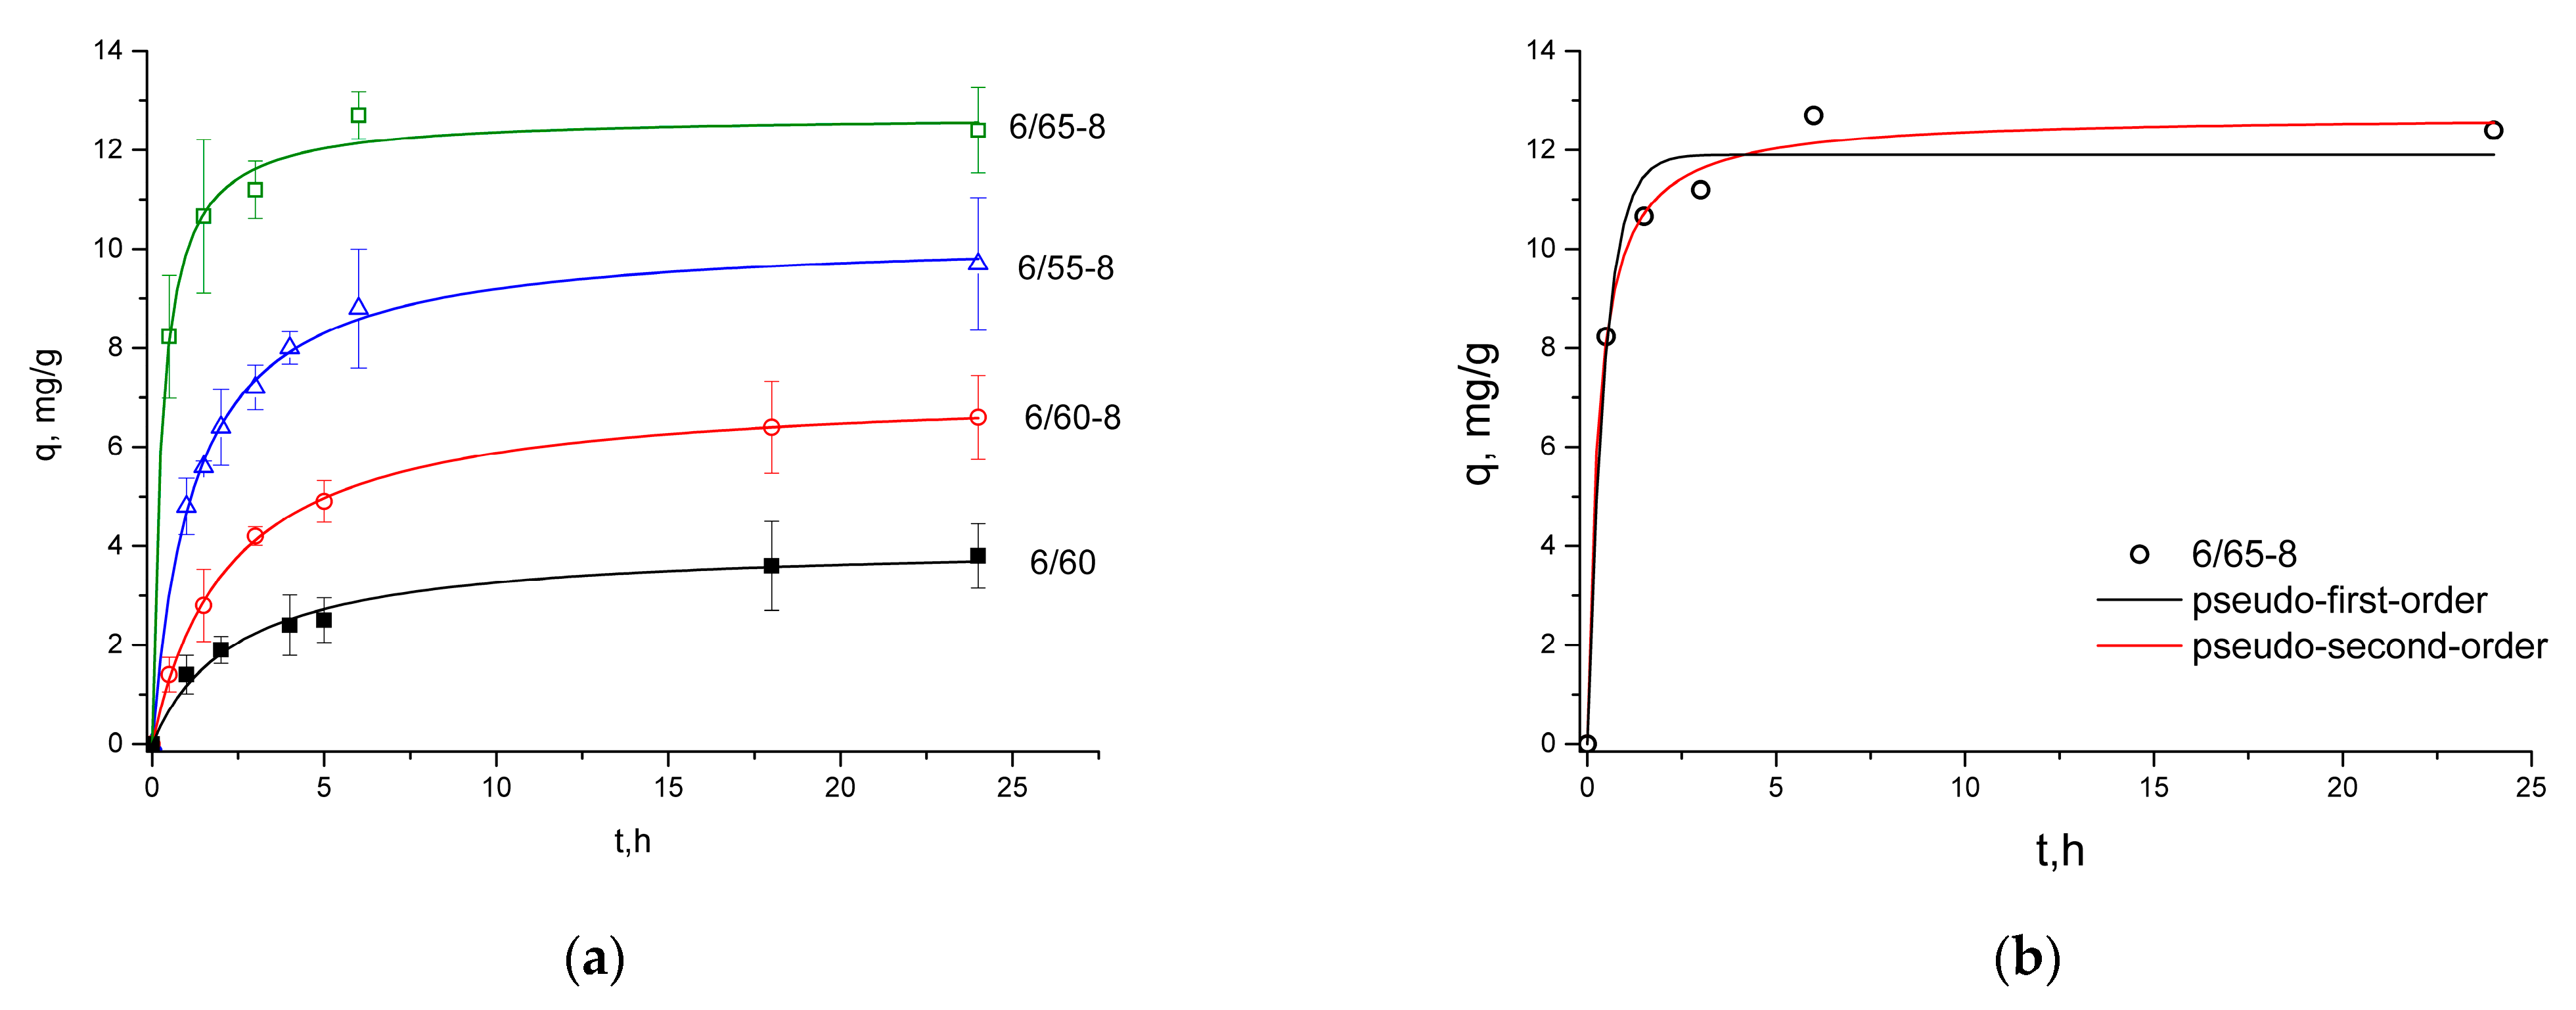
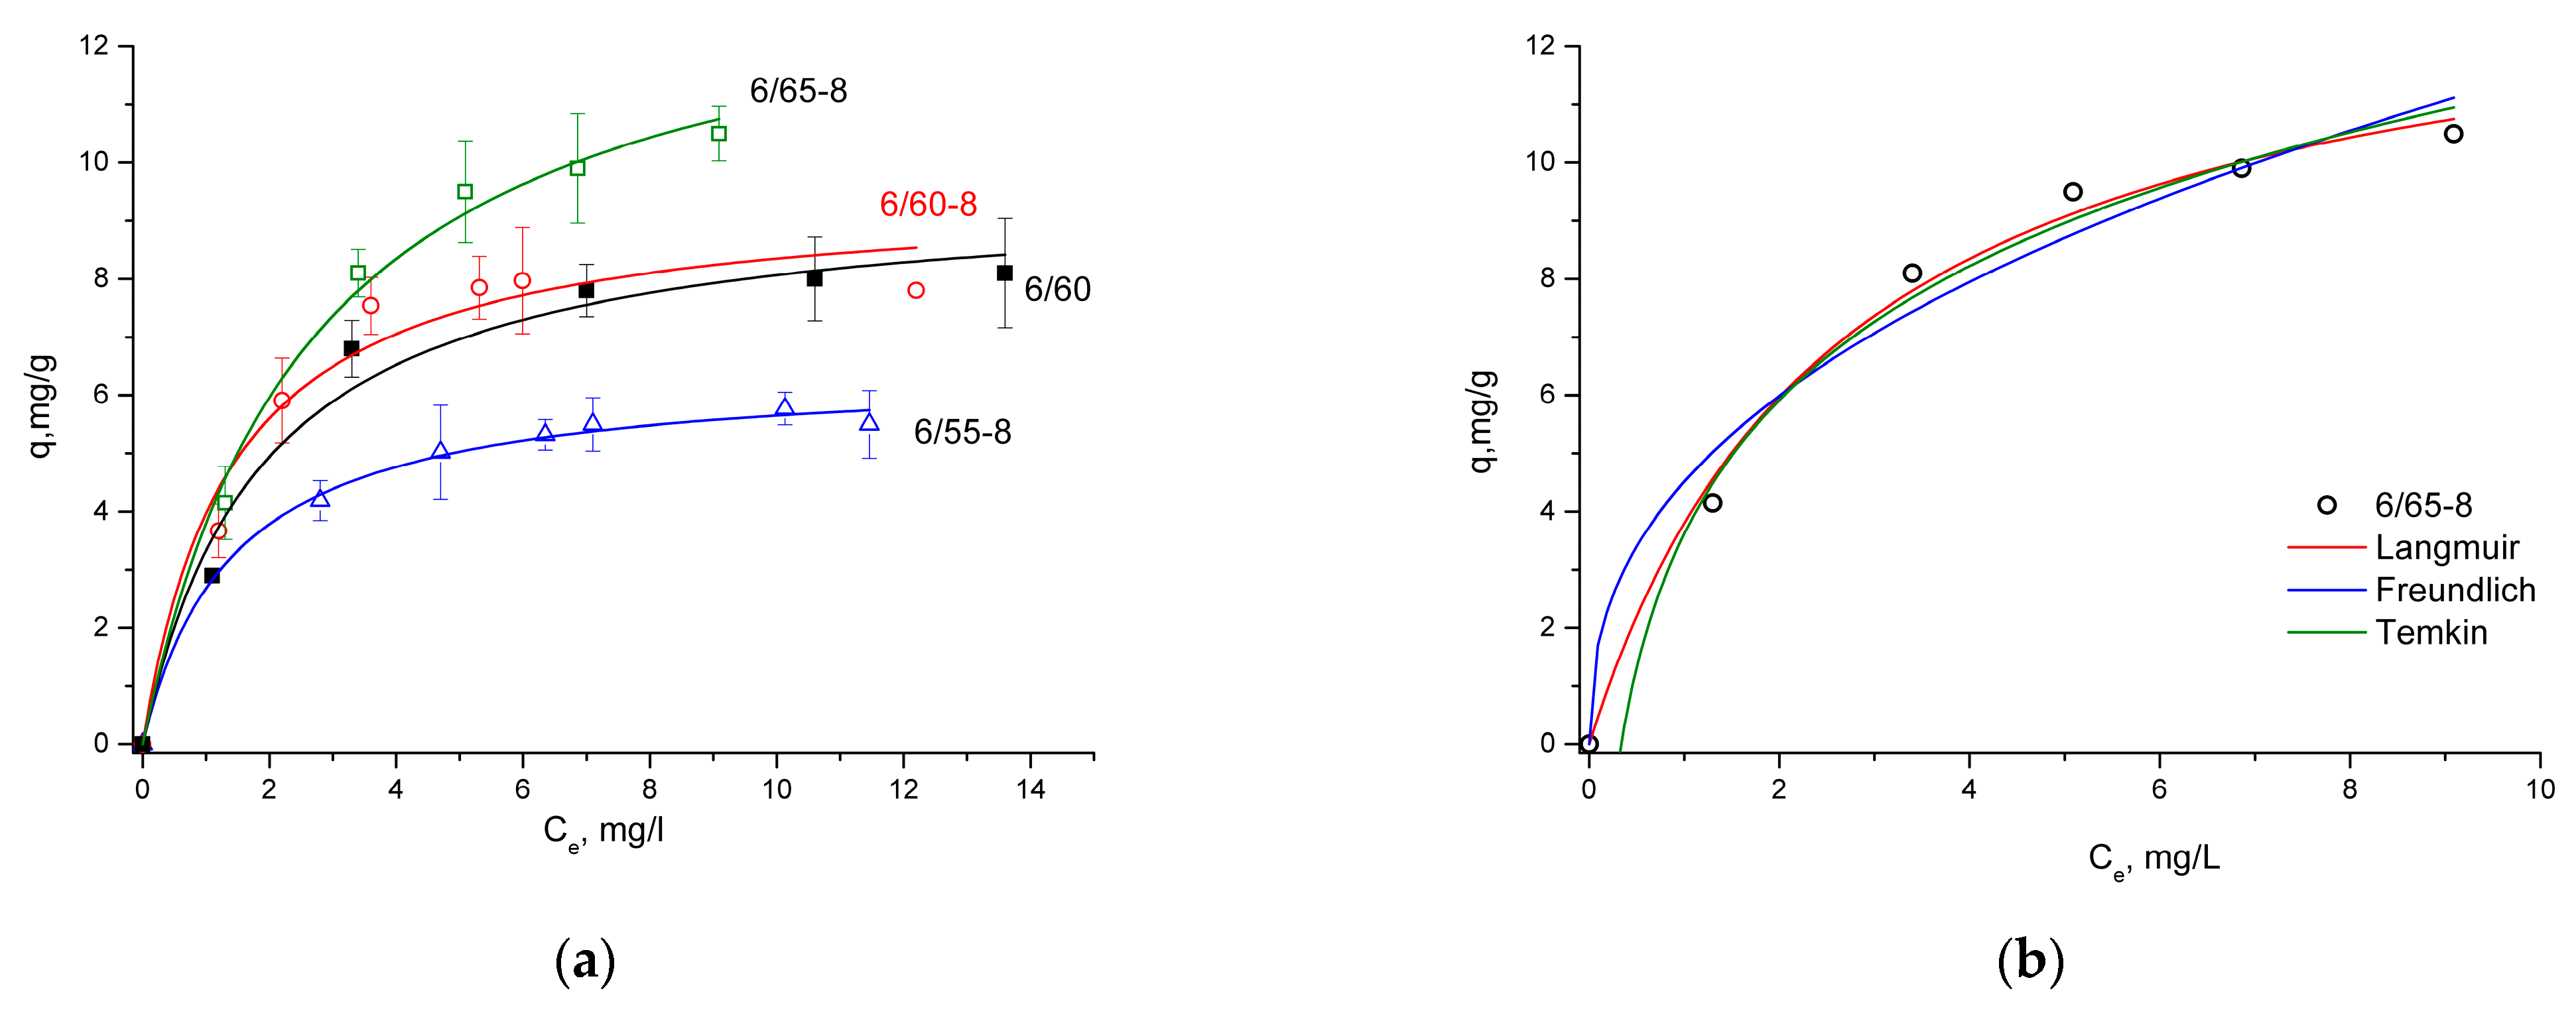
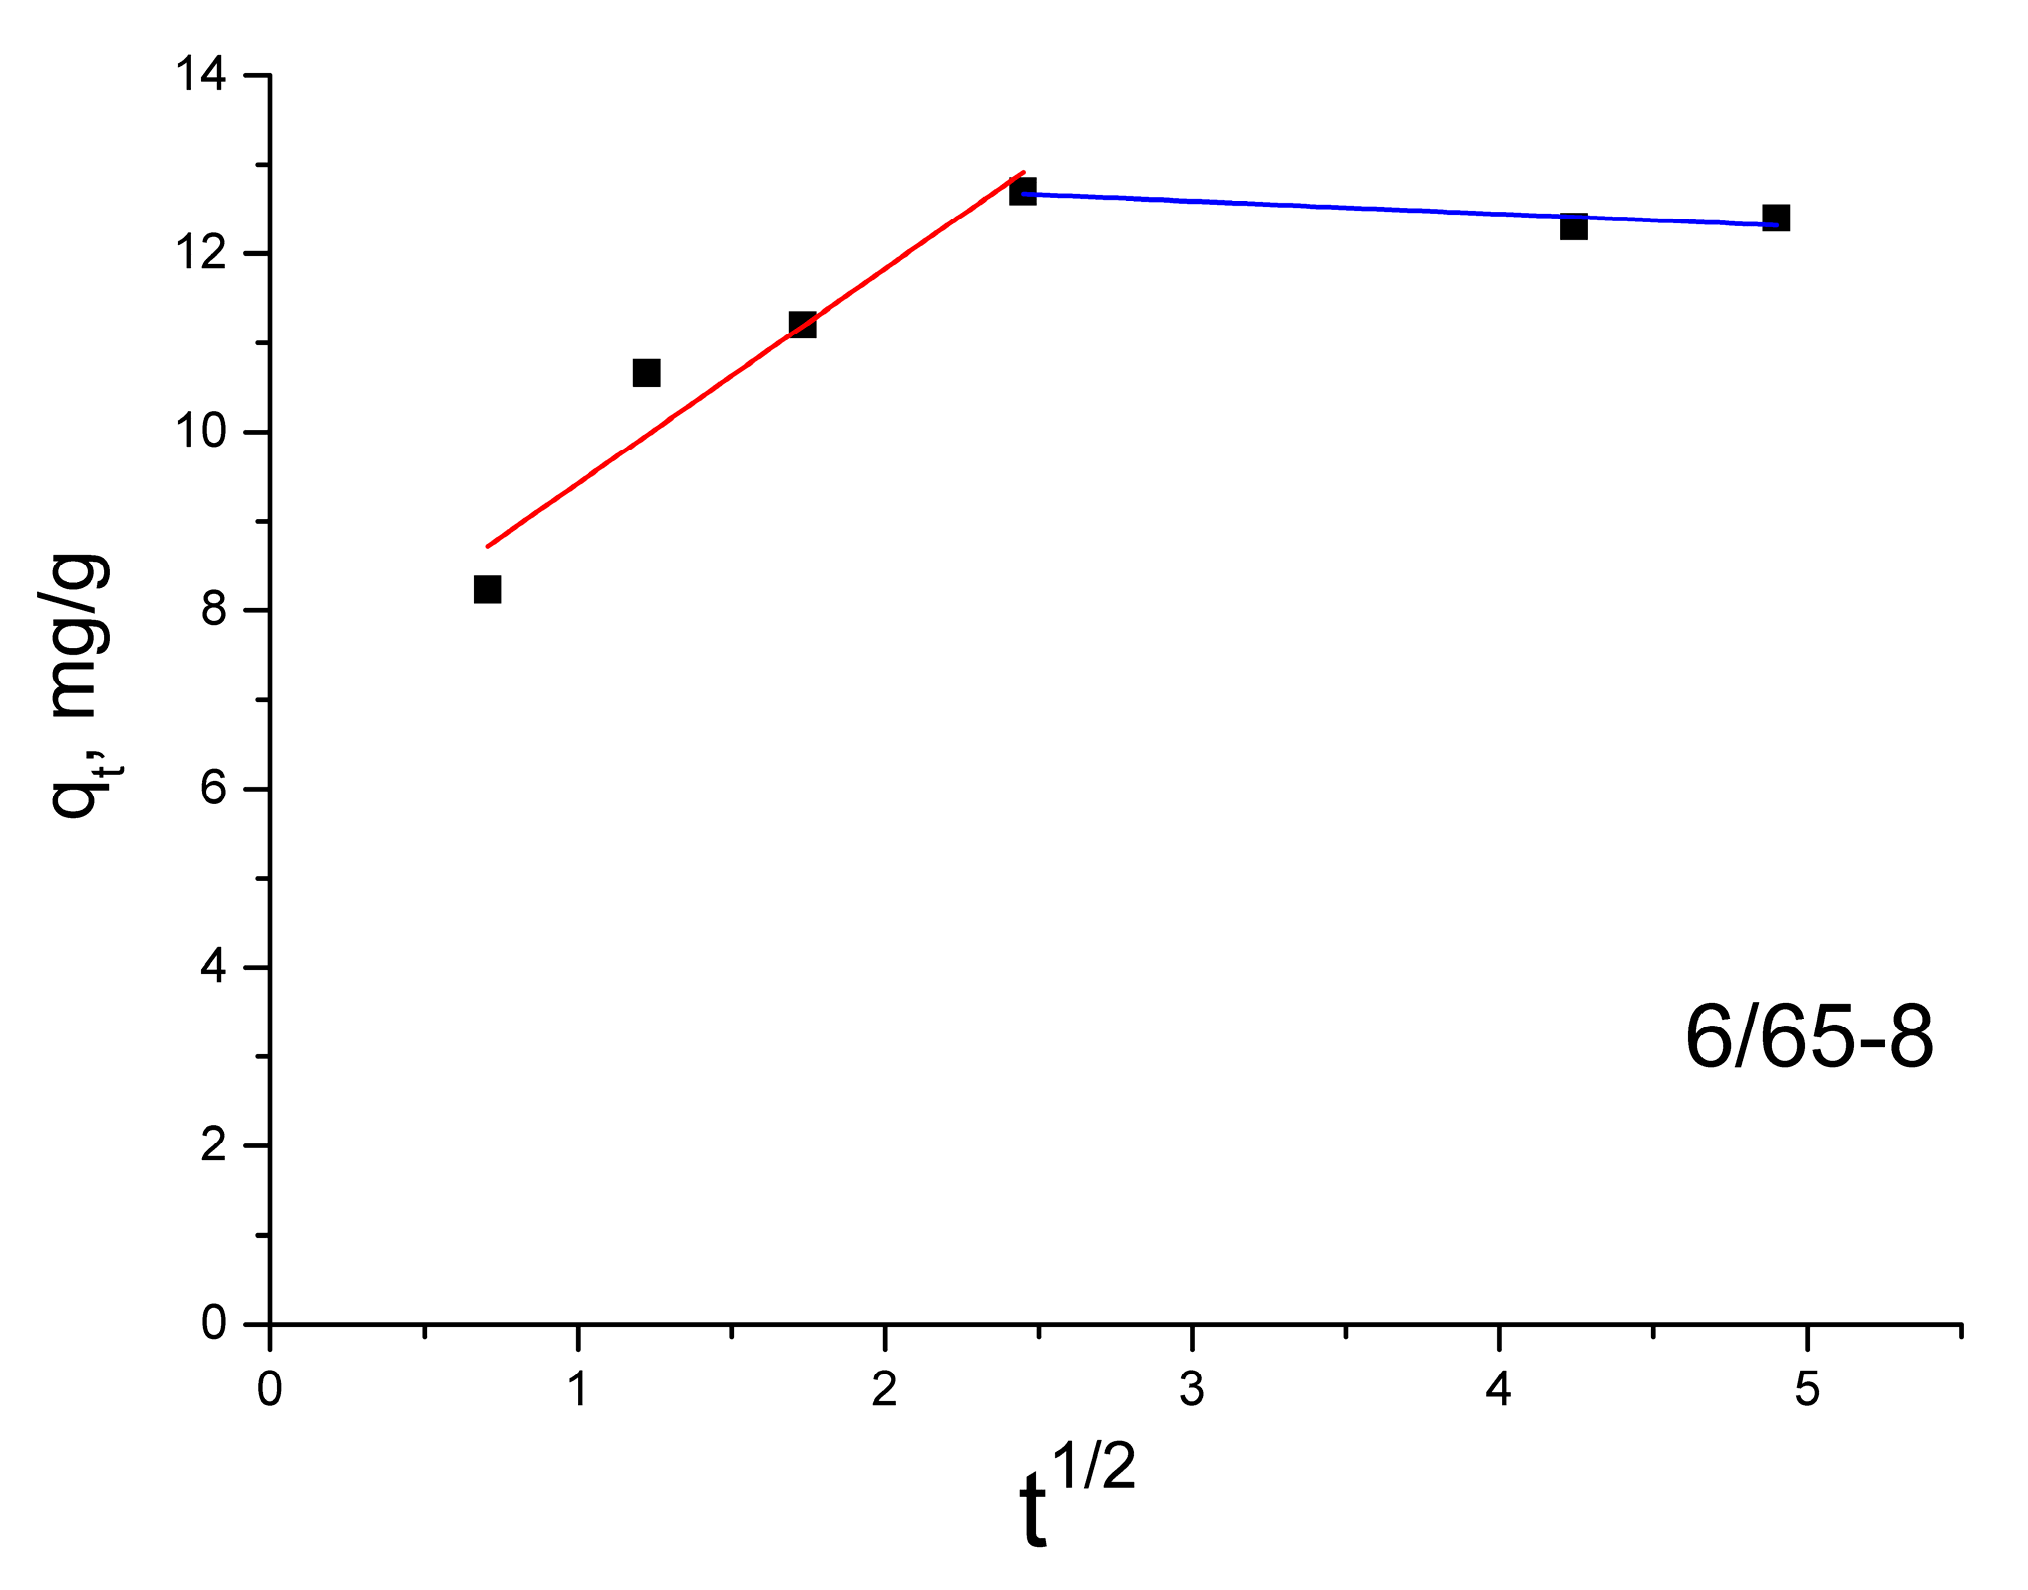
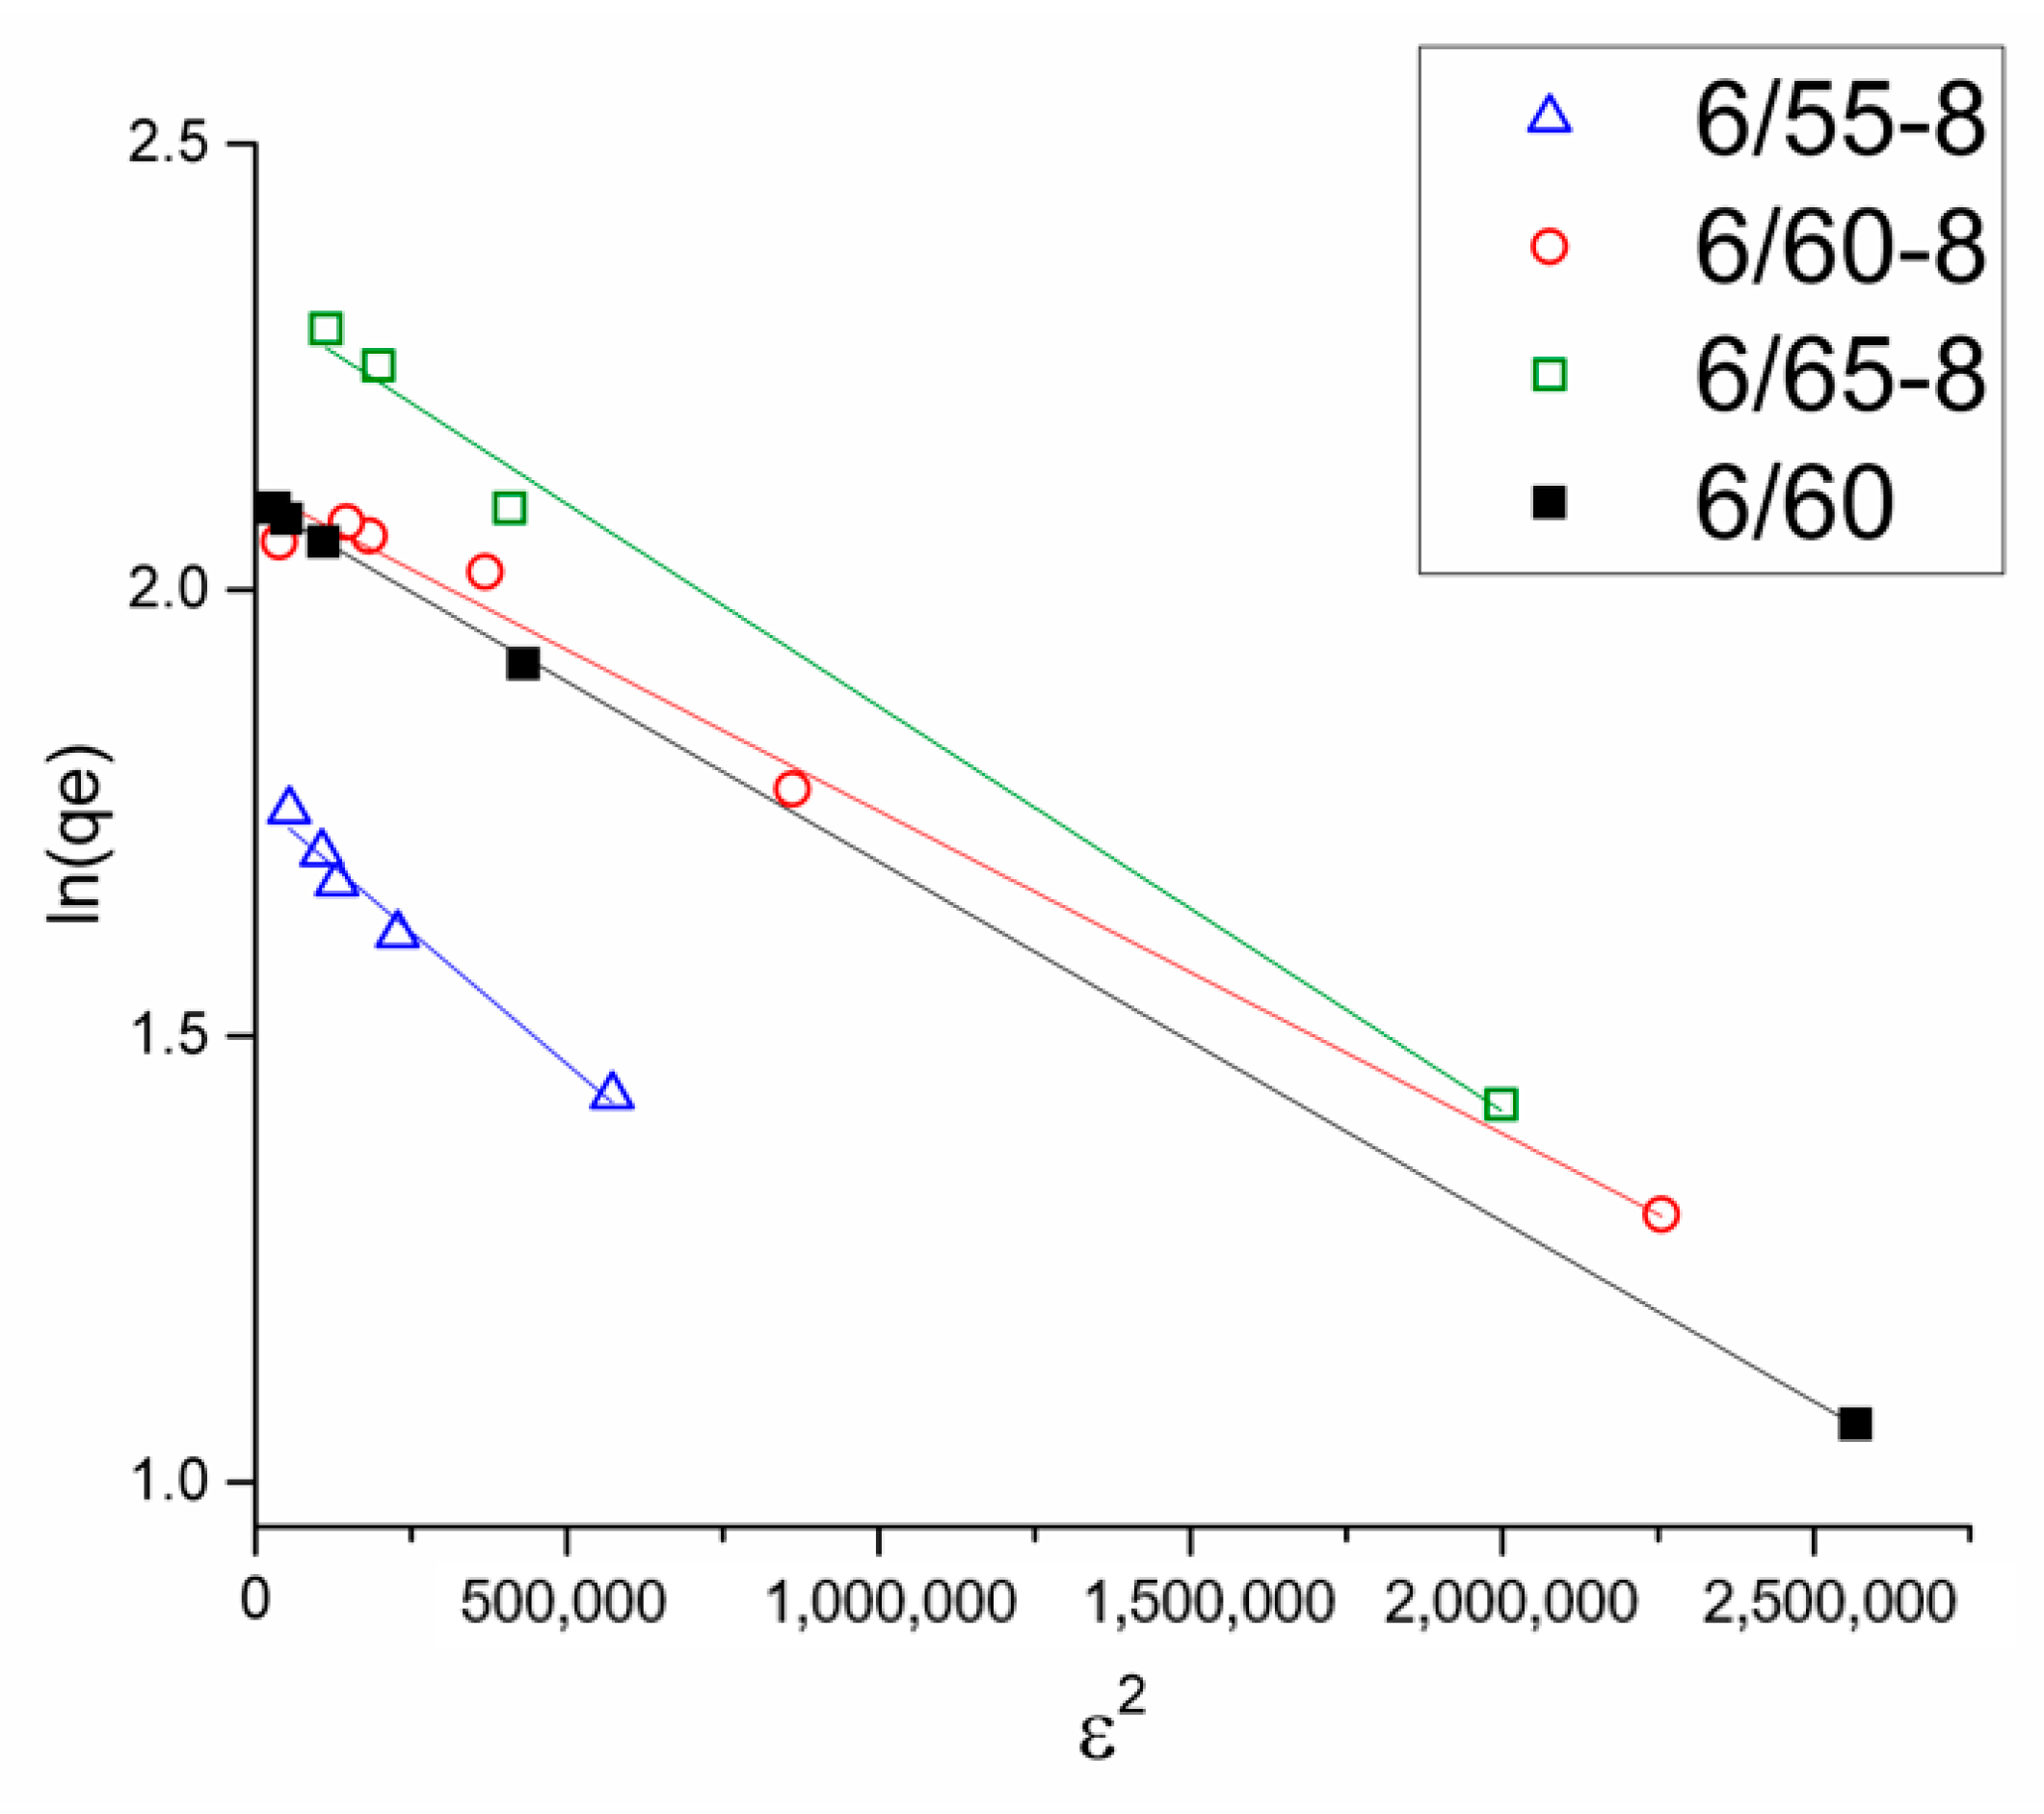
3.2.3. Sorption of Methylene Blue
4. Discussion
5. Conclusions
6. Patents
Author Contributions
Funding
Institutional Review Board Statement
Data Availability Statement
Acknowledgments
Conflicts of Interest
References
- Mulder, M. Basic Principles of Membrane Technology; Springer: Dordrecht, Germany, 1996. [Google Scholar] [CrossRef]
- Zydney, A.L. High Performance Ultrafiltration Membranes. Pore Geometry and Charge Effects. Membr. Sci. Technol. 2011, 14, 333–352. [Google Scholar] [CrossRef]
- Isawi, H. Evaluating the Performance of Different Nano-Enhanced Ultrafiltration Membranes for the Removal of Organic Pollutants from Wastewater. J. Water Process Eng. 2019, 31, 100833. [Google Scholar] [CrossRef]
- Hidalgo, A.M.; Gómez, M.; Murcia, M.D.; Serrano, M.; Rodríguez-Schmidt, R.; Escudero, P.A. Behaviour of Polysulfone Ultrafiltration Membrane for Dyes Removal. Water Sci. Technol. 2018, 77, 2093–2100. [Google Scholar] [CrossRef] [PubMed]
- Ismail, A.F.; Matsuura, T. Ultrafiltration and Microfiltration. In Membrane Separation Processes; Elsevier: Amsterdam, The Netherlands, 2022; pp. 69–75. [Google Scholar]
- Bardhan, A.; Akhtar, A.; Subbiah, S. Microfiltration and Ultrafiltration Membrane Technologies. In Advancement in Polymer-Based Membranes for Water Remediation; Elsevier: Amsterdam, The Netherlands, 2022. [Google Scholar]
- Wu, Z. Inorganic Membranes for Gas Separations. In Membrane Separation Principles and Applications: From Material Selection to Mechanisms and Industrial Uses; Elsevier: Amsterdam, The Netherlands, 2018. [Google Scholar]
- Singh, R.; Purkait, M.K. Microfiltration Membranes. In Membrane Separation Principles and Applications: From Material Selection to Mechanisms and Industrial Uses. Handbooks for separation science; Elsevier: Amsterdam, The Netherlands, 2019; pp. 111–146. [Google Scholar]
- Goh, P.S.; Ismail, A.F. A Review on Inorganic Membranes for Desalination and Wastewater Treatment. Desalination 2018, 434, 60–80. [Google Scholar] [CrossRef]
- Crull, A. Prospects for the Inorganic Membrane Business. In Proceedings of the Inorganic Membranes ICIM2-91, Montpellier, France, 1–4 July 1991; Volume 61–62, pp. 279–288. [Google Scholar]
- Kukizaki, M. Large-Scale Production of Alkali-Resistant Shirasu Porous Glass (SPG) Membranes: Influence of ZrO2 Addition on Crystallization and Phase Separation in Na2O-CaO-Al2O3-B2O3-SiO2 Glasses; and Alkali Durability and Pore Morphology of the Membranes. J. Memb. Sci. 2010, 360, 426–435. [Google Scholar] [CrossRef]
- Mazurin, O.V.; Porai-Koshits, E.A. Phase Separation in Glass. North-Holland, Amsterdam, Oxford, New York, Tokyo 1984. Mazurin, O.V., Porai-Koshits, E.A., Eds.; Elsevier: Amsterdam, The Netherlands, 1984. [Google Scholar]
- Janowski, F.; Enke, D. Porous Glasses. Handb. Porous Solids 2008, 3, 1432–1542. [Google Scholar] [CrossRef]
- Inayat, A.; Reinhardt, B.; Herwig, J.; Küster, C.; Uhlig, H.; Krenkel, S.; Raedlein, E.; Enke, D. Recent Advances in the Synthesis of Hierarchically Porous Silica Materials on the Basis of Porous Glasses. New J. Chem. 2016, 40, 4095–4114. [Google Scholar] [CrossRef] [Green Version]
- Hasanuzzaman, M.; Rafferty, A.; Sajjia, M.; Olabi, A.-G. Production and Treatment of Porous Glass Materials for Advanced Usage; Elsevier Ltd.: Amsterdam, The Netherlands, 2016; ISBN 9780128035818. [Google Scholar]
- Enke, D.; Janowski, F.; Schwieger, W. Porous Glasses in the 21st Century-a Short Review. Microporous Mesoporous Mater. 2003, 60, S1387–S1811. [Google Scholar] [CrossRef]
- Kameyama, T.; Dokiya, M.; Fujishige, M.; Yokokawa, H.; Fukuda, K. Production of Hydrogen from Hydrogen Sulfide by Means of Selective Diffusion Membranes. Int. J. Hydrogen Energy 1983, 8, 5–13. [Google Scholar] [CrossRef]
- Kameyama, T.; Dokiya, M.; Fujishige, M.; Yokokawa, H.; Fukuda, K. Possibility for Effective Production of Hydrogen from Hydrogen Sulfide by Means of a Porous Vycor Glass Membrane. Ind. Eng. Chem. Fundam. 1981, 20, 97–99. [Google Scholar] [CrossRef]
- Hood, H.P.; Nordberg, M.E. Treated Borosilicate Glass. U.S. Patent 2106744, 1938. [Google Scholar]
- Marković, A.; Stoltenberg, D.; Enke, D.; Schlünder, E.U.; Seidel-Morgenstern, A. Gas Permeation through Porous Glass Membranes. Part I. Mesoporous Glasses-Effect of Pore Diameter and Surface Properties. J. Memb. Sci. 2009, 336, 17–31. [Google Scholar] [CrossRef]
- Nakamura, K.; Matsumoto, K. Adsorption Behavior of BSA in Microfiltration with Porous Glass Membrane. J. Memb. Sci. 1998, 145, 119–128. [Google Scholar] [CrossRef]
- Ermakova, L.; Sidorova, M.; Jura, N. Electrochemistry of Porous Glass Membranes in Electrolyte Solutions. J. Memb. Sci. 1996, 115, 11–19. [Google Scholar] [CrossRef]
- Kuraoka, K.; Ueda, T.; Fujiwara, M.; Sato, M. aki Ship-in-a-Bottle Synthesis of a Cobalt Phthalocyanine/Porous Glass Composite Membrane for Oxygen Separation. J. Memb. Sci. 2006, 286, 12–14. [Google Scholar] [CrossRef] [Green Version]
- Sun, D.; Duan, X.; Li, W.; Zhou, D. Demulsification of Water-in-Oil Emulsion by Using Porous Glass Membrane. High Technol. Lett. 1999, 5, 98–102. [Google Scholar] [CrossRef]
- Voevodina, I.N.; Marchenko, Y.Y.; Nikolaev, B.P.; Yakovleva, L.Y. Synthesis and Magnetic Relaxation Properties of a Porous Glass Magnetic Microcarrier. Russ. J. Appl. Chem. 2012, 85, 1083–1089. [Google Scholar] [CrossRef]
- Hood, H.P.; Nordberg, M.E. Method of treating borosilicate glasses U.S. Patent 228. U.S. Patent 2286275, 1942. [Google Scholar]
- Beltsios, K.; Charalambopoulou, G.; Romanos, G.; Kanellopoulos, N. Vycor Membrane with Reduced Size Surface Pores. I. Preparation and Characterization. J. Porous Mater. 1999, 6, 25–31. [Google Scholar] [CrossRef]
- Mousavi, M.P.S.; Saba, S.A.; Anderson, E.L.; Hillmyer, M.A.; Bühlmann, P. Avoiding Errors in Electrochemical Measurements: Effect of Frit Material on the Performance of Reference Electrodes with Porous Frit Junctions. Anal. Chem. 2016, 88, 8706–8713. [Google Scholar] [CrossRef]
- CoralPor®. Available online: https://www.schott.com/en-be/products/coralpor-p1000377 (accessed on 8 February 2023).
- Michos, I.; Cao, Z.; Xu, Z.; Jing, W.; Dong, J. Investigations on a Mesoporous Glass Membrane as Ion Separator for a Redox Flow Battery. Batteries 2019, 5, 6. [Google Scholar] [CrossRef] [Green Version]
- Schadeck, U.; Kyrgyzbaev, K.; Gerdes, T.; Willert-Porada, M.; Moos, R. Porous and Non-Porous Micrometer-Sized Glass Platelets as Separators for Lithium-Ion Batteries. J. Memb. Sci. 2018, 550, 518–525. [Google Scholar] [CrossRef]
- Mögelin, H.; Yao, G.; Zhong, H.; dos Santos, A.R.; Barascu, A.; Meyer, R.; Krenkel, S.; Wassersleben, S.; Hickmann, T.; Enke, D.; et al. Porous Glass Membranes for Vanadium Redox-Flow Battery Application—Effect of Pore Size on the Performance. J. Power Sources 2018, 377, 18–25. [Google Scholar] [CrossRef]
- Mazo, M.A.; Sanguino, J.; Martín-Gullón, I.; Rubio, J. Formation of Carbon Nanofibers with Ni Catalyst Supported on a Micro-Mesoporous Glass. Microporous Mesoporous Mater. 2021, 323, 111168. [Google Scholar] [CrossRef]
- Ertuş, E.B.; Vakifahmetoglu, C.; Öztürk, A. Enhanced Methylene Blue Removal Efficiency of TiO2 Embedded Porous Glass. J. Eur. Ceram. Soc. 2021, 41, 1530–1536. [Google Scholar] [CrossRef]
- Girsova, M.A.; Golovina, G.F.; Kurilenko, L.N.; Anfimova, I.N. Spectral-Luminescent Properties of Composite Materials Based on Nanoporous High-Silica Glasses Activated with Bismuth and Cerium Ions. Glas. Phys. Chem. 2021, 47, 353–359. [Google Scholar] [CrossRef]
- Gwak, J.; Ayral, A.; Rouessac, V.; Kim, K.H.; Grenier, J.C.; Cot, L.; Choy, J.H. Porous Ceramic Membranes Exhibiting Ferri/Ferromagnetic Properties for Separation. Sep. Purif. Technol. 2005, 46, 118–124. [Google Scholar] [CrossRef]
- Himstedt, H.H.; Yang, Q.; Dasi, L.P.; Qian, X.; Wickramasinghe, S.R.; Ulbricht, M. Magnetically Activated Micromixers for Separation Membranes. Langmuir 2011, 27, 5574–5581. [Google Scholar] [CrossRef] [PubMed]
- Huang, Z.Q.; Guo, X.P.; Guo, C.L.; Zhang, Z. Magnetization Influence on the Performance of Ferrosoferric Oxide: Polyacrylonitrile Membranes in Ultrafiltration of Pig Blood Solution. Bioprocess Biosyst. Eng. 2006, 28, 415–421. [Google Scholar] [CrossRef] [PubMed]
- Sabbatini, P.; Yrazu, F.; Rossi, F.; Thern, G.; Marajofsky, A.; Fidalgo de Cortalezzi, M.M. Fabrication and Characterization of Iron Oxide Ceramic Membranes for Arsenic Removal. Water Res. 2010, 44, 5702–5712. [Google Scholar] [CrossRef]
- Daraei, P.; Madaeni, S.S.; Ghaemi, N.; Khadivi, M.A.; Astinchap, B.; Moradian, R. Fouling Resistant Mixed Matrix Polyethersulfone Membranes Blended with Magnetic Nanoparticles: Study of Magnetic Field Induced Casting. Sep. Purif. Technol. 2013, 109, 111–121. [Google Scholar] [CrossRef]
- Konon, M.; Polyakova, I.; Stolyar, S.; Simonenko, N.; Simonenko, T.; Zolotov, N.; Semenova, E.; Antropova, T. Mössbauer Spectroscopy, XRPD, and SEM Study of Iron-Containing Na2O-B2O3-SiO2 Glasses. J. Am. Ceram. Soc. 2021, 104, 3149–3157. [Google Scholar] [CrossRef]
- Konon, M.; Antropova, T.; Zolotov, N.; Simonenko, T.; Simonenko, N.; Brazovskaya, E.; Kreisberg, V.; Polyakova, I. Chemical Durability of the Iron-Containing Sodium Borosilicate Glasses. J. Non. Cryst. Solids 2022, 584, 121519. [Google Scholar] [CrossRef]
- Pshenko, O.A.; Drozdova, I.A.; Polyakova, I.G.; Rogacki, K.; Ciźman, A.; Poprawski, R.; Rysiakiewicz-Pasek, E.; Antropova, T.V. Ferromagnetic Iron-Containing Porous Glasses. Glas. Phys. Chem. 2014, 40, 167–172. [Google Scholar] [CrossRef]
- Beall, G.H.; Gerald, R.M.; Schreurs, J.W.H. Porous Magnetic Glass Structure. US Patent 4233169, 1980. [Google Scholar]
- Beall, G.H.; Gerald, R.M.; Schreurs, J.W.H. Method for Making Porous Magnetic Glass and Crystal-Containing Structures; US Patent 4395271, 1983. [Google Scholar]
- Pshenko, O.A.; Antropova, T.V.; Arsent’ev, M.Y.; Drozdova, I.A. New Vitreous Nanocomposites Containing Phases of Fe3O4 and γ-KNO3. Glas. Phys. Chem. 2015, 41, 509–514. [Google Scholar] [CrossRef]
- Cizman, A.; Bednarski, W.; Antropova, T.V.; Pshenko, O.; Rysiakiewicz-Pasek, E.; Waplak, S.; Poprawski, R. Structural, Dielectric, Thermal and Electron Magnetic Resonance Studies of Magnetic Porous Glasses Filled with Ferroelectrics. Compos. Part B Eng. 2014, 64, 16–23. [Google Scholar] [CrossRef]
- Antropova, T.V.; Pshenko, O.A.; Anfimova, I.N.; Drozdova, I.A. Methos of Producing Composite Multiferroic Based on Ferromagnetic Porous Glass. RU Patent 2,594,183, 10 April 2015. [Google Scholar]
- Volkova, A.V.; Ermakova, L.E.; Kashpurina, E.A.; Pshenko, O.A.; Antropova, T.V. Electrokinetic Properties of Iron-Containing Microporous Glasses. Glas. Phys. Chem. 2016, 42, 322–324. [Google Scholar] [CrossRef]
- Ermakova, L.E.; Kuznetsova, A.S.; Volkova, A.V.; Antropova, T.V. Structural and Electrosurface Properties of Iron-Containing Nanoporous Glasses in KNO3 Solutions. Colloids Surfaces A Physicochem. Eng. Asp. 2019, 576, 91–102. [Google Scholar] [CrossRef]
- Zhang, L.Y.; Zhang, W.; Zhou, Z.; Li, C.M. γ-Fe2O3 Nanocrystals-Anchored Macro/Meso-Porous Graphene as a Highly Efficient Adsorbent toward Removal of Methylene Blue. J. Colloid Interface Sci. 2016, 476, 200–205. [Google Scholar] [CrossRef]
- Konon, M.Y.; Polyakova, I.G.; Stolyar, S.V.; Anfimova, I.N. Crystallization in Glasses of the Na2O–B2O3–SiO2–Fe2O3 System with a Different SiO2 Content. Glas. Phys. Chem. 2020, 46, 646–649. [Google Scholar] [CrossRef]
- Konon, M.Y.; Stolyar, S.V.; Semenova, E.A.; Dikaya, L.F.; Kurilenko, L.N.; Simonenko, N.P.; Simonenko, T.L. Physicochemical Properties of Glasses of the Na2O–B2O3–SiO2–Fe2O3 System with a Varying SiO2 Content. Glas. Phys. Chem. 2021, 47, 703–708. [Google Scholar] [CrossRef]
- Stolyar, S.V.; Konon, M.Y.; Drozdova, I.A.; Anfimova, I.N. Criterion for Estimating the Number of Phases in Phase-Separated Glass of the Na2O-K2O-B2O3-SiO2 System by Dilatometric Analysis. Glas. Phys. Chem. 2014, 40, 298–302. [Google Scholar] [CrossRef]
- Price, W.J. Analytical Atomic Absorption Spectrometry; Heyden & Son Ltd: London, UK; New York, NY, USA; Rheine, Germany, 1972. [Google Scholar]
- Popov, N.P.; Stolyarova, I.A. Khimicheskii Analiz Gornykh Porod I Mineralov (Chemical Analysis of Rocks and Minerals); Nedra: Moscow, Russia, 1974. [Google Scholar]
- Schwarzenbach, G.; Flaschka, H.A. Complexometric Titrations Hardcover, 2nd ed.; Methuen young books: London, UK, 1969. [Google Scholar]
- Piryutko, M.M.; Benediktova-Lodochnikova, N.V. Accelerated Titrimetric Determination of Boron in Silicates. Zhurnal Anal. Khimii J. Anal. Chem. 1970, 25, 136–141. [Google Scholar]
- Piryutko, M.M.; Benediktova, N.V.; Korsak, L.F. Improved Method for Determining Silicon Content in the Form of a Quinoline-Silicon-Molybdenum Complex. Glas. Ceram. 1981, 38, 439–441. [Google Scholar] [CrossRef]
- Charlot, G. Les Méthodes de La Chimie Analytique: Analyse Quantitative Minérale (Methods of Analytical Chemistry. Quantitative Analysis of Inorganic Compounds); Masson et Cie Chartres: Paris, France, 1960. [Google Scholar]
- Rouquerol, J.; Avnir, D.; Fairbridge, C.W.; Everett, D.H.; Haynes, J.H.; Pernicone, N.; Ramsay, J.D.F.; Sing, K.S.W.; Unger, K.K. Recommendations for the Characterization of Porous Solids (Technical Report). Pure Appl. Chem. 1994, 66, 1739–1758. [Google Scholar] [CrossRef]
- Kreisberg, V.A.; Antropova, T.V. Changing the Relation between Micro- and Mesoporosity in Porous Glasses: The Effect of Different Factors. Microporous Mesoporous Mater. 2014, 190, 128–138. [Google Scholar] [CrossRef]
- Kreisberg, V.A.; Antropova, T.V.; Kalinina, S.V. Formation of Micro- and Mesoporous Substructures in the Course of the Leaching Process of Two-Phase Alkali Borosilicate Glass. Glas. Phys. Chem. 2014, 40, 384–387. [Google Scholar] [CrossRef]
- Kreisberg, V.A.; Rakcheev, V.P.; Antropova, T.V. The Relationship between Micro- and Mesoporous Substructures upon Removal of Colloidal Silica from Porous Glasses Subjected to Alkaline Treatment. Colloid J. 2014, 76, 161–169. [Google Scholar] [CrossRef]
- Kreisberg, V.A.; Konon, M.Y.; Brazovskaya, E.Y.; Drozdova, I.A.; Antropova, T.V. The Influence of Acidic Treatment and Mechanical Grinding on the Structural Characteristics and Morphology of Pores in Iron-Containing Sodium-Borosilicate Porous Glasses. Colloid J. 2022, 84, 46–54. [Google Scholar] [CrossRef]
- Li, Q.; Li, Y.; Ma, X.; Du, Q.; Sui, K.; Wang, D.; Wang, C.; Li, H.; Xia, Y. Filtration and Adsorption Properties of Porous Calcium Alginate Membrane for Methylene Blue Removal from Water. Chem. Eng. J. 2017, 316, 623–630. [Google Scholar] [CrossRef]
- Weber, W.J.; Morris, J.C. Kinetics of Adsorption on Carbon from Solution. J. Sanit. Eng. Div. 1963, 89, 31–59. [Google Scholar] [CrossRef]
- Huang, T.; Yan, M.; He, K.; Huang, Z.; Zeng, G. Efficient Removal of Methylene Blue from Aqueous Solutions Using Magnetic Graphene Oxide Modified Zeolite. J. Colloid Interface Sci. 2019, 543, 43–51. [Google Scholar] [CrossRef]
- Bayat, M.; Javanbakht, V.; Esmaili, J. Synthesis of Zeolite/Nickel Ferrite/Sodium Alginate Bionanocomposite via a Co-Precipitation Technique for Efficient Removal of Water-Soluble Methylene Blue Dye. Int. J. Biol. Macromol. 2018, 116, 607–619. [Google Scholar] [CrossRef] [PubMed]
- Russakova, A.V.; Altynbaeva, L.S.; Barsbay, M.; Zheltov, D.A.; Zdorovets, M.V.; Mashentseva, A.A. Kinetic and Isotherm Study of as(Iii) Removal from Aqueous Solution by Pet Track-Etched Membranes Loaded with Copper Microtubes. Membranes 2021, 11, 116. [Google Scholar] [CrossRef] [PubMed]
- Montagnac, G. Raman Spectra of Some Oxide-Hydroxide Minerals. Available online: https://doi.org/10.26302/SSHADE/EXPERIMENT_GM_20190905_001 (accessed on 8 February 2023).
- Hanesch, M. Raman Spectroscopy of Iron Oxides and (Oxy)Hydroxides at Low Laser Power and Possible Applications in Environmental Magnetic Studies. Geophys. J. Int. 2009, 177, 941–948. [Google Scholar] [CrossRef]
- Konon, M.; Antropova, T.; Polyakova, I.; Anfimova, I.; Dikaya, L.; Semenova, E.; Kurilenko, L. The Phase Separation Phenomenon in the Na2O-B2O3-SiO2-Fe2O3 Glass-Forming System and Its Application for Producing Porous Glasses. Opt. Appl. 2019, 49, 437–444. [Google Scholar] [CrossRef]
- Antropova, T. Morphology of Porous Glasses. Colloid-Chemical Aspect. Opt. Appl. 2008, 38, 5–16. [Google Scholar]
- Thommes, M.; Kaneko, K.; Neimark, A.V.; Olivier, J.P.; Rodriguez-Reinoso, F.; Rouquerol, J.; Sing, K.S.W. Physisorption of Gases, with Special Reference to the Evaluation of Surface Area and Pore Size Distribution (IUPAC Technical Report). Pure Appl. Chem. 2015, 87, 1051–1069. [Google Scholar] [CrossRef] [Green Version]
- Li, L.; Shi, H.; Chen, L.; Yuan, Q.; Chen, X.; Lin, W. Evaluation of La-Doped Mesoporous Bioactive Glass as Adsorbent and Photocatalyst for Removal of Methylene Blue from Aqueous Solution. Int. J. Photoenergy 2015, 2015, 708568. [Google Scholar] [CrossRef] [Green Version]
- Samad, S.A.; Arafat, A.; Ferrari, R.; Gomes, R.L.; Lester, E.; Ahmed, I. Adsorption Studies and Effect of Heat Treatment on Porous Glass Microspheres. Int. J. Appl. Glas. Sci. 2022, 13, 63–81. [Google Scholar] [CrossRef]
- Rożek, P.; Król, M.; Mozgawa, W. Lightweight Geopolymer-Expanded Glass Composites for Removal of Methylene Blue from Aqueous Solutions. Ceram. Int. 2020, 46, 19785–19791. [Google Scholar] [CrossRef]
- Zhang, Y.; Liu, J.; Du, X.; Shao, W. Preparation of Reusable Glass Hollow Fiber Membranes and Methylene Blue Adsorption. J. Eur. Ceram. Soc. 2019, 39, 4891–4900. [Google Scholar] [CrossRef]
- McKay, G.; Poots, V.J.P. Kinetics and Diffusion Processes in Colour Removal from Effluent Using Wood as an Adsorbent. J. Chem. Technol. Biotechnol. 1980, 30, 279–292. [Google Scholar] [CrossRef]
- Kittappa, S.; Pichiah, S.; Kim, J.R.; Yoon, Y.; Snyder, S.A.; Jang, M. Magnetised Nanocomposite Mesoporous Silica and Its Application for Effective Removal of Methylene Blue from Aqueous Solution. Sep. Purif. Technol. 2015, 153, 67–75. [Google Scholar] [CrossRef]
- Li, H.; Budarin, V.L.; Clark, J.H.; North, M.; Wu, X. Rapid and Efficient Adsorption of Methylene Blue Dye from Aqueous Solution by Hierarchically Porous, Activated Starbons®: Mechanism and Porosity Dependence. J. Hazard. Mater. 2022, 436, 129174. [Google Scholar] [CrossRef]
- Murzin, D.Y. On the Scientific Heritage of Mikhail Isaakovich Temkin. Kinet. Catal. 2019, 60, 388–397. [Google Scholar] [CrossRef]
- Jin, X.; Jiang, M.Q.; Shan, X.Q.; Pei, Z.G.; Chen, Z. Adsorption of Methylene Blue and Orange II onto Unmodified and Surfactant-Modified Zeolite. J. Colloid Interface Sci. 2008, 328, 243–247. [Google Scholar] [CrossRef]
- Ghosh, D.; Bhattacharyya, K.G. Adsorption of Methylene Blue on Kaolinite. Appl. Clay Sci. 2002, 20, 295–300. [Google Scholar] [CrossRef]
- Gong, J.L.; Wang, B.; Zeng, G.M.; Yang, C.P.; Niu, C.G.; Niu, Q.Y.; Zhou, W.J.; Liang, Y. Removal of Cationic Dyes from Aqueous Solution Using Magnetic Multi-Wall Carbon Nanotube Nanocomposite as Adsorbent. J. Hazard. Mater. 2009, 164, 1517–1522. [Google Scholar] [CrossRef] [PubMed]


| Glass Designation * | Glass Composition As-Analyzed, wt% ** | Volumetric Concentration Cv, g/cm3 | Density ρ, g/cm3 | ||||||
|---|---|---|---|---|---|---|---|---|---|
| SiO2 | B2O3 | Na2O | Fe2O3 *** | SiO2 | B2O3 | Na2O | Fe2O3 | ||
| 6/60 | 57.39 | 36.98 | 5.63 | - | 1.23 | 0.79 | 0.12 | - | 2.145 |
| 6/55-8 | 47.65 | 29.75 | 5.61 | 16.99 | 1.15 | 0.72 | 0.13 | 0.41 | 2.415 |
| 6/60-8 | 51.93 | 25.46 | 5.64 | 16.97 | 1.26 | 0.62 | 0.14 | 0.41 | 2.437 |
| 6/65-8 | 56.58 | 20.55 | 5.72 | 17.14 | 1.40 | 0.51 | 0.14 | 0.42 | 2.470 |
| Glass | D*, cm2/s * | Component Extraction, % | PGs Composition (as Analyzed, wt%) | |||||||||
|---|---|---|---|---|---|---|---|---|---|---|---|---|
| Na | B | Fe | Na2O | B2O3 | SiO2 | Fe2O3 | SiO2 | B2O3 | Na2O | Fe2O3 | FeO | |
| 6/60 | 3.8 × 10⁻⁷ | 2.1 × 10⁻⁷ | - | 100 | 81 | 11 | - | 87.05 | 12.73 | 0.22 | - | - |
| 6/55-8 | 3.6 × 10⁻⁷ | 2.4 × 10⁻⁷ | 3.5 × 10⁻⁷ | 100 | 82 | 8 | 100 | 85.88 | 11.25 | 0.59 | 1.97 | 0.30 |
| 6/60-8 | 3.7 × 10⁻⁷ | 3.1 × 10⁻⁷ | 2.7 × 10⁻⁷ | 100 | 96 | 10 | 96 | 87.20 | 6.95 | 0.35 | 5.16 | 0.34 |
| 6/65-8 | 2.7 × 10⁻⁷ | 2.1 × 10⁻⁷ | 1.4 × 10⁻⁷ | 94 | 91 | 5 | 80 | 82.97 | 5.38 | 0.40 | 9.75 | 1.49 |
| PG Sample | 6/55-8 | 6/60-8 | 6/65-8 | 6/60 |
|---|---|---|---|---|
| Total pore volume, cm3/g | 0.126 | 0.215 | 0.211 | 0.231 |
| Micropore volume, cm3/g (percentage of the total volume is given in parentheses) | 0.0058 (4.6%) | 0.0045 (2.1%) | 0.0058 (2.8%) | 0.0039 (1.7%) |
| Mesopore volume, cm3/g | 0.120 | 0.210 | 0.205 | 0.227 |
| BET-specific surface area, m2/g | 53 | 86 | 135 | 32 |
| BET-specific surface area of mesopores, m2/g | 39 | 63 | 123 | 22 |
| Specific surface area of micropores, m2/g | 14 | 23 | 12 | 10 |
| Effective mesopore diameters, nm (adsorption isotherm, the volume fraction of the mode in mesopore volume is given in parentheses) | 3.22 (0.7%) 15.4 (78.9%) 16.3 (2.5%) 17.1 (17.9%) | 4.16 (11.7%) 7.68 (20.2%) 20.3 (57.8%) 21.2 (10.3%) | 4.04 (53.1%) 7.33 (15.2%) 16.8 (31.3%) 24.5 (0.4%) | 26.3 (74.9%) 54.6 (25.1%) |
| Effective mesopore diameters, nm (desorption isotherm, the volume fraction of the mode in mesopore volume is given in parentheses) | 4.00 (11.9%) 8.03 (4.9%) 23.3 (69.8%) 33.3 (13.4%) | 6.87 (4.3%) 10.9 (34.0%) 15.0 (34.1%) 20.3 (27.6%) | 2.86 (1.7%) 4.19 (62.1%) 5.51 (16.1%) 17.1 (20.1%) | 5.12 (1.9%) 25.2 (6.9%) 50.8 (91.2%) |
| Average mesopore diameter, nm (adsorption) | 15.3 | 11.4 | 5.84 | 30.2 |
| Average mesopore diameter, nm (desorption) | 14.3 | 13.6 | 5.12 | 41.1 |
| Average micropore diameter, nm (adsorption) | 1.07 | 1.11 | 1.15 | 1.10 |
| Average structural coefficient of mesopores | 4.79 | 3.92 | 3.13 | 4.25 |
| Average structural coefficient of micropores | 2.59 | 2.43 | 2.88 | 2.43 |
| Glass | 6/55-8 | 6/60-8 | 6/65-8 | 6/60 | |
|---|---|---|---|---|---|
| qexp | 9.70 ± 1.34 | 6.60 ± 0.85 | 12.40 ± 0.86 | 3.80 ± 0.65 | |
| Pseudo-first-order | qcalc | 9.16 | 6.42 | 11.91 | 3.62 |
| k1, min−1 | 0.61 | 0.35 | 2.20 | 0.31 | |
| R2 | 0.9804 | 0.9882 | 0.9772 | 0.9498 | |
| Pseudo-second-order | qcalc | 10.29 | 7.20 | 12.70 | 4.06 |
| k2, g/mg min | 0.08 | 0.06 | 0.28 | 0.10 | |
| R2 | 0.9978 | 0.9991 | 0.9942 | 0.9842 | |
| Intraparticle diffusion | kid1 | 2.77 | 2.73 | 2.41 | 0.89 |
| C | 2.26 | 0.54 | 7.02 | 0.56 | |
| R21 | 0.9749 | 0.9999 | 0.8888 | 0.9712 | |
| kid2 | 0.35 | 0.66 | 0.14 | 0.50 | |
| C | 7.92 | 3.45 | 13.02 | 1.39 | |
| R22 | 0.9228 | 0.9659 | 0.5329 | 0.9818 | |
| Glass | 6/55-8 | 6/60-8 | 6/65-8 | 6/60 | |
|---|---|---|---|---|---|
| qexp, mg/g | 5.50 ± 0.58 | 7.80 ± 0.91 | 10.50 ± 0.47 | 8.10 ± 0.94 | |
| Langmuir Equation | qm, mg/g | 6.44 | 9.52 | 13.90 | 9.58 |
| KL, L/mg | 0.71 | 0.72 | 0.38 | 0.53 | |
| R2 | 0.9952 | 0.9620 | 0.9930 | 0.9765 | |
| RL | 0.07 | 0.08 | 0.12 | 0.08 | |
| Freundlich Equation | 1/n | 0.19 | 0.24 | 0.41 | 0.30 |
| KF, L/g | 3.64 | 4.80 | 4.51 | 3.95 | |
| R2 | 0.9886 | 0.8990 | 0.9691 | 0.9239 | |
| Temkin Equation | BT | 1.01 | 1.85 | 3.32 | 2.04 |
| A, L/g | 26.93 | 10.01 | 2.97 | 5.20 | |
| b, kJ/mol | 2.45 | 1.34 | 0,75 | 1,21 | |
| R2 | 0.9906 | 0.9264 | 0.9893 | 0.9554 | |
| Dubinin-Radushkevich Equation | qD, mg/g | 5.777 | 8.275 | 10.203 | 8.153 |
| BD, mol2/J2 | 1.187 · 10−4 | 1.514 · 10−4 | 0.447 · 10−4 | 0.187 · 10−4 | |
| R2 | 0.9791 | 0.9874 | 0.9910 | 0.9998 | |
| E, kJ/mol | 0.064 | 0.057 | 0.105 | 0.163 | |
Disclaimer/Publisher’s Note: The statements, opinions and data contained in all publications are solely those of the individual author(s) and contributor(s) and not of MDPI and/or the editor(s). MDPI and/or the editor(s) disclaim responsibility for any injury to people or property resulting from any ideas, methods, instructions or products referred to in the content. |
© 2023 by the authors. Licensee MDPI, Basel, Switzerland. This article is an open access article distributed under the terms and conditions of the Creative Commons Attribution (CC BY) license (https://creativecommons.org/licenses/by/4.0/).
Share and Cite
Konon, M.; Brazovskaya, E.Y.; Kreisberg, V.; Semenova, E.; Polyakova, I.G.; Osipov, A.; Antropova, T. Novel Inorganic Membranes Based on Magnetite-Containing Silica Porous Glasses for Ultrafiltration: Structure and Sorption Properties. Membranes 2023, 13, 341. https://doi.org/10.3390/membranes13030341
Konon M, Brazovskaya EY, Kreisberg V, Semenova E, Polyakova IG, Osipov A, Antropova T. Novel Inorganic Membranes Based on Magnetite-Containing Silica Porous Glasses for Ultrafiltration: Structure and Sorption Properties. Membranes. 2023; 13(3):341. https://doi.org/10.3390/membranes13030341
Chicago/Turabian StyleKonon, Marina, Elena Yu. Brazovskaya, Valery Kreisberg, Ekaterina Semenova, Irina G. Polyakova, Armenak Osipov, and Tatiana Antropova. 2023. "Novel Inorganic Membranes Based on Magnetite-Containing Silica Porous Glasses for Ultrafiltration: Structure and Sorption Properties" Membranes 13, no. 3: 341. https://doi.org/10.3390/membranes13030341