
A Green Method for the Determination of Cadmium in Natural Waters Based on Multi-Fibre Supported Liquid Membranes

Department of Analytical Chemistry, Faculty of Marine and Environmental Sciences, University of Cadiz, 11510 Puerto Real, Spain
*
Author to whom correspondence should be addressed.
Membranes 2023, 13(3), 327; https://doi.org/10.3390/membranes13030327
Submission received: 16 February 2023
/
Revised: 6 March 2023
/
Accepted: 9 March 2023
/
Published: 12 March 2023
(This article belongs to the Special Issue Development and Application of Membrane Separation Processes)
Abstract
:Supported liquid membranes have been used to implement a hollow fibre liquid-phase microextraction (HF-LPME) method for the preconcentration of Cd(II) in natural waters as a sample preparation step for its determination by high-resolution continuum source graphite furnace atomic absorption spectrometry (HR-CS-GFAAS). This system was designed to use four hollow fibres simultaneously with the same sample, thus improving the simplicity, speed and reproducibility of the results. The organic liquid membrane bis-(2,4,4-trimethylpentyl) phosphinic acid (Cyanex® 272) dissolved in dihexylether (DHE) was immobilised into the pores of the walls of polypropylene hollow fibres. After extraction, the cadmium-enriched acidic phases were recovered and analysed by triplicate. To optimise the extraction process, the effect of both physical and chemical variables was studied, and optimum results with an enrichment factor (EF) of 292 were obtained for a fibre length of 6 cm, 1.06 M Cyanex 272, 0.04 M HNO3, stirring rate of 600 rpm and an extraction time of 4.26 h. For practical applications, extraction time was reduced to 2 h, keeping the EF as high as 130. Under these conditions, a detection limit of 0.13 ng L−1 Cd(II) was obtained, with a reproducibility of 3.3 % and a linear range up to 3 µg L−1 being achieved. The proposed method was successfully applied to the determination of cadmium in mineral, tap and seawater samples.
1. Introduction
Sample preparation is still the bottleneck in many analytical procedures and specifically in the determination of trace metals in waters, where very low limits of detection are required for samples with complex matrices (e.g., seawater, estuarine or groundwater). Thus, a sample preparation step is often needed, and liquid membranes have demonstrated to be an excellent tool for this purpose [1,2,3]. Aligned with the principles of sustainability and green chemistry, liquid microextraction-based methods have arisen as a promising alternative for an efficient sample cleanup and/or analyte preconcentration. They have been mostly applied to organic compounds and, in less extension, to the separation of metal species [4,5,6]. Nonetheless, their implementation as routine methods in analytical laboratories has not been fully achieved, so further study and development is needed.
Cadmium is among the most toxic metals in the environment, as reflected in the list of priority pollutants published by the United States Environmental Protection Agency (USEPA) [7] and the European legislation [8,9]. Its presence in aquatic ecosystems can be related to sewage discharge and particles generated from different anthropogenic activities, such as burning of fossil fuels, mining industries, phosphate fertilisers or Ni-Cd batteries, among others [10]. It can be accumulated through the trophic chain and can cause severe damage to human health, even at very low concentrations [11].
Different analytical techniques have been applied for cadmium determination in natural waters [12,13,14,15,16,17,18,19]. Among them, inductively coupled plasma mass spectrometry (ICP-MS) makes it possible to reach the limits of detection usually required for the analysis of trace metals in water samples, but the high cost and the impossibility of analysing saline waters often prevent its use [20]. Moreover, an initial preconcentration step is often needed before the instrumental detection [21]. Therefore, and taking into account that water samples may contain cadmium at concentrations as low as a few ng L−1, it is necessary to develop sample-preparation methods for accurate and sensitive determination.
One of the advantages of liquid-phase microextraction (LPME) is the reduction of the solution volumes used for the separation/preconcentration process, allowing it to be considered a green technique [22,23,24]. In fact, only a few microlitres of an extraction solution are frequently used, making graphite furnace atomic absorption spectroscopy (GF-AAS) an attractive and efficient alternative for the quantification step due to its capacity to determine trace metals with very low samples volumes [25,26,27].
In LPME, the analyte is extracted from the sample into a small volume of an organic solution, and then it may be stripped into an appropriate acceptor solution, acting as a liquid membrane system. In this case, both extraction and re-extraction are done in a single step. Although a variety of approaches may be found, three methodologies can be distinguished: Single drop liquid-phase microextraction (SDME), dispersive liquid–liquid microextraction (DLLME) and hollow fibre liquid-phase microextraction (HF-LPME) [6,28]. The application of these systems to the determination of cadmium in environmental waters has also been reviewed [29].
If compared with the others, HF-LPME exhibits higher stability since the extraction solution is located in the pores of a polymeric hollow fibre that separates the two aqueous phases, the donor and the acceptor solutions.
Some approaches to the determination of cadmium in water samples have been previously studied, most of them with non-saline waters and for non-environmental concentrations [30,31,32,33]. Application to seawater is still scarce and mostly focused on the effect of saline matrix and extraction mechanism [33,34,35] and the behaviour and extraction mechanism of chloro-complexes [36,37].
In the present study, the commercial organophosphorus extractant bis-(2,4,4-trimethylpentyl) phosphinic acid (Cyanex® 272), dissolved in dihexylether (DHE), has been used as the organic liquid membrane for an LPME-based method to preconcentrate cadmium from water samples. The effect of the main chemical and physical variables affecting the microextraction system has been studied by applying a dual optimisation methodology, with a first univariate pre-optimisation followed by a multivariate optimisation strategy based on a central composite design. The proposed method was successfully applied to the preconcentration and determination of cadmium at the ng L−1 level in mineral, tap and seawater samples.
2. Materials and Methods
2.1. Reagents and Solutions
All chemicals were reagent grade and they were used as received without further purification. Potassium bromide, sodium sulphate, sodium chloride and tartaric acid were obtained from Merck (Darmstadt, Germany). Tri-sodium citrate 2-hydrate and acetic acid were provided by Panreac (Barcelona, Spain). Nitric acid (trace analysis, 63%) was obtained from Sigma–Aldrich (Steinheim, Germany) and sodium hydroxide from Scharlab (Barcelona, Spain). 2-hydroxyethyl piperazine-N’-(2-ethanesulphonic acid) (HEPES) was supplied by Biochemical (Barcelona, Spain).
Aqueous solutions of cadmium were prepared from a 1000 mg L−1 Cd(II) standard solution (Merck) with Milli-Q deionised water (Millipore, Bedford, MA, USA). The organic phases were obtained by dissolving the appropriate amount of bis-(2,4,4-trimethylpentyl) phosphinic acid (Cyanex® 272) from CYTEC (Woodland Park, NJ, USA) in dihexylether from Aldrich (Steinheim, Germany).
2.2. Equipment
Polypropylene hollow fibres, Accurel PP S6/2 from 3 M-Membrana (Wuppertal, Germany), with an internal diameter of 1800 µm, 450 µm wall thickness and nominal pore size of 0.2 µm, were used as the support for the liquid membranes. The length of the fibres used varied between 6 and 14 cm, resulting in an internal volume between 150 and 356 µL. The lumen of the hollow fibres was filled and emptied with the strip solution by a Perimax 12 peristaltic pump from Spetec (Erding, Germany), equipped with Tygon tubing while the solution remained stopped during extraction experiments. An Agimatic-SD digital magnetic stirrer from JP Selecta (Barcelona, Spain) was used to perform HF-LPME experiments. A continuum source atomic absorption spectrometer model ContrAA 700 from Analytik Jena (Jena, Germany) was used to determine Cd concentration in the aqueous solutions by applying graphite furnace atomisation (GFAAS). Transversal heating furnaces made in pyrolytic graphite were used, and 20 µL of acceptor solution were injected for each analysis. The measurements were carried out at 228 nm using 300 °C and 1200 °C as the ashing and atomisation temperatures, respectively, and the signals were recorded by adjusting the detector between pixels 98–102. Aqueous solution pH was monitored by a combined glass Ag/AgCl electrode pH-meter from Crison Instruments (Barcelona, Spain).
2.3. Extraction Procedure
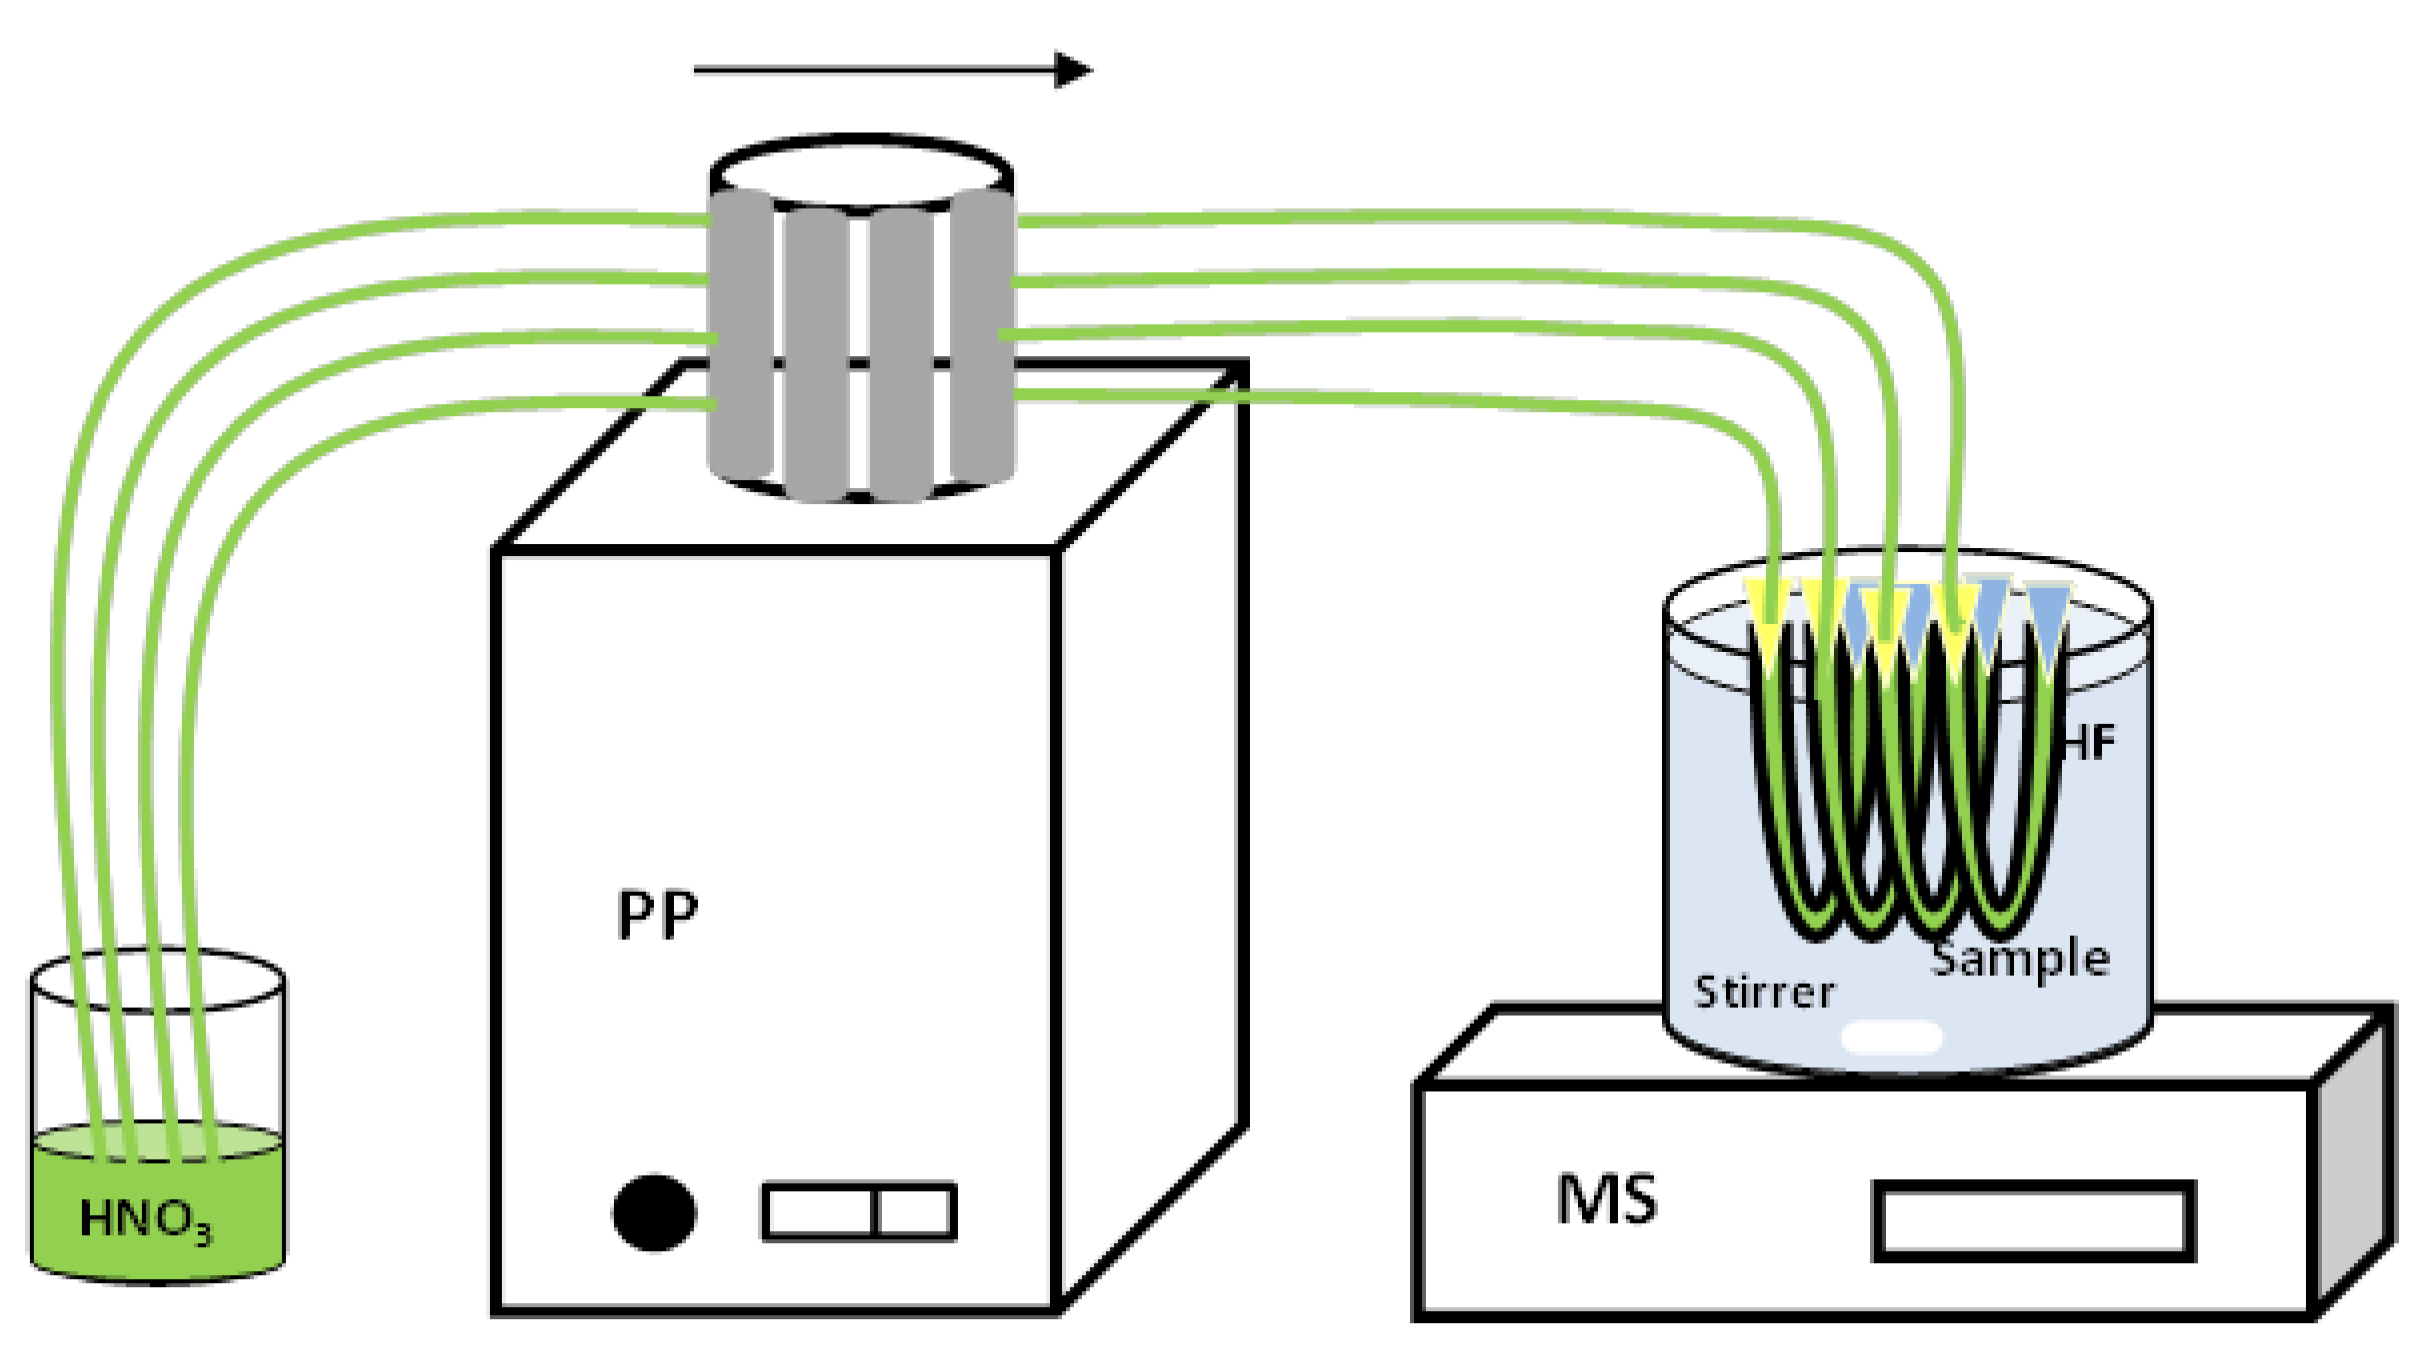
For each experiment, four segments of hollow fibres were carefully cut using a blade and then immersed into the Cyanex® 272 in DHE solution for 15 min. The organic solution contained in the pores of each fibre was as low as 31.6 µL, which greatly reduced impact on the environment. After impregnation, the hollow fibres were adjusted into a “U” shape, and connected to a peristaltic pump with corresponding pump tubing to fill the lumens of the fibres with the acceptor HNO3 solution (Figure 1). Following this, the pump tubes were disconnected and the extraction process was carried out by stirring the sample at room temperature for a pre-determined time. Finally, the acceptor solution of each fibre was recovered in a different vial, and Cd(II) concentration was measured by GFAAS. This procedure is able to obtain four replicates simultaneously in a single experiment. The efficiency of the process was estimated from the enrichment factor (Equation (1)), with Co being the initial Cd(II) concentration in the feed solution and Cf being the Cd(II) concentration in the strip solution after extraction.
2.4. Optimisation of the Supported Liquid Membrane Method
As mentioned before, a dual optimisation methodology was used. First, for the univariate pre-optimisation method, the effect of extraction time, fibre length, Cyanex® 272 concentration in the liquid membrane, HNO3 concentration in the receiving solution and stirring rate were evaluated. For optimisation studies, samples containing 0.1 µg L−1 Cd in NaNO3 0.1 M and buffered at pH = 7.5 with HEPES 0.1 M were used. Taking into account that the proposed method was intended to be used for natural waters, sample pH was always kept at 7.5. In each experiment, the device containing the four hollow fibres was immersed in a vessel with 250 mL of sample and the extraction was carried out.
Subsequently, a multivariate optimisation procedure based on a central composite design was carried out both for better optimisation and in order to correct the effect of possible interactions between the variables. In this case, the variables included were those affected by higher interactions (extraction time, Cyanex® 272 concentration in the organic phase and HNO3 concentration in the receiving solution). The initial conditions were selected from the results obtained in the univariate preoptimisation.
In both procedures, the response variable was the EF, and experiments were run in duplicate and randomised to minimise the effect of uncontrolled variables [38].
Software Statgraphics 5.1 from Startpoint Technologies (Addison, TX, USA) was used for all the calculations carried out in the optimisation procedures.
3. Results
3.1. Univariate Pre-Optimisation of the Supported Liquid Membrane Method
3.1.1. Effect of Extraction Time
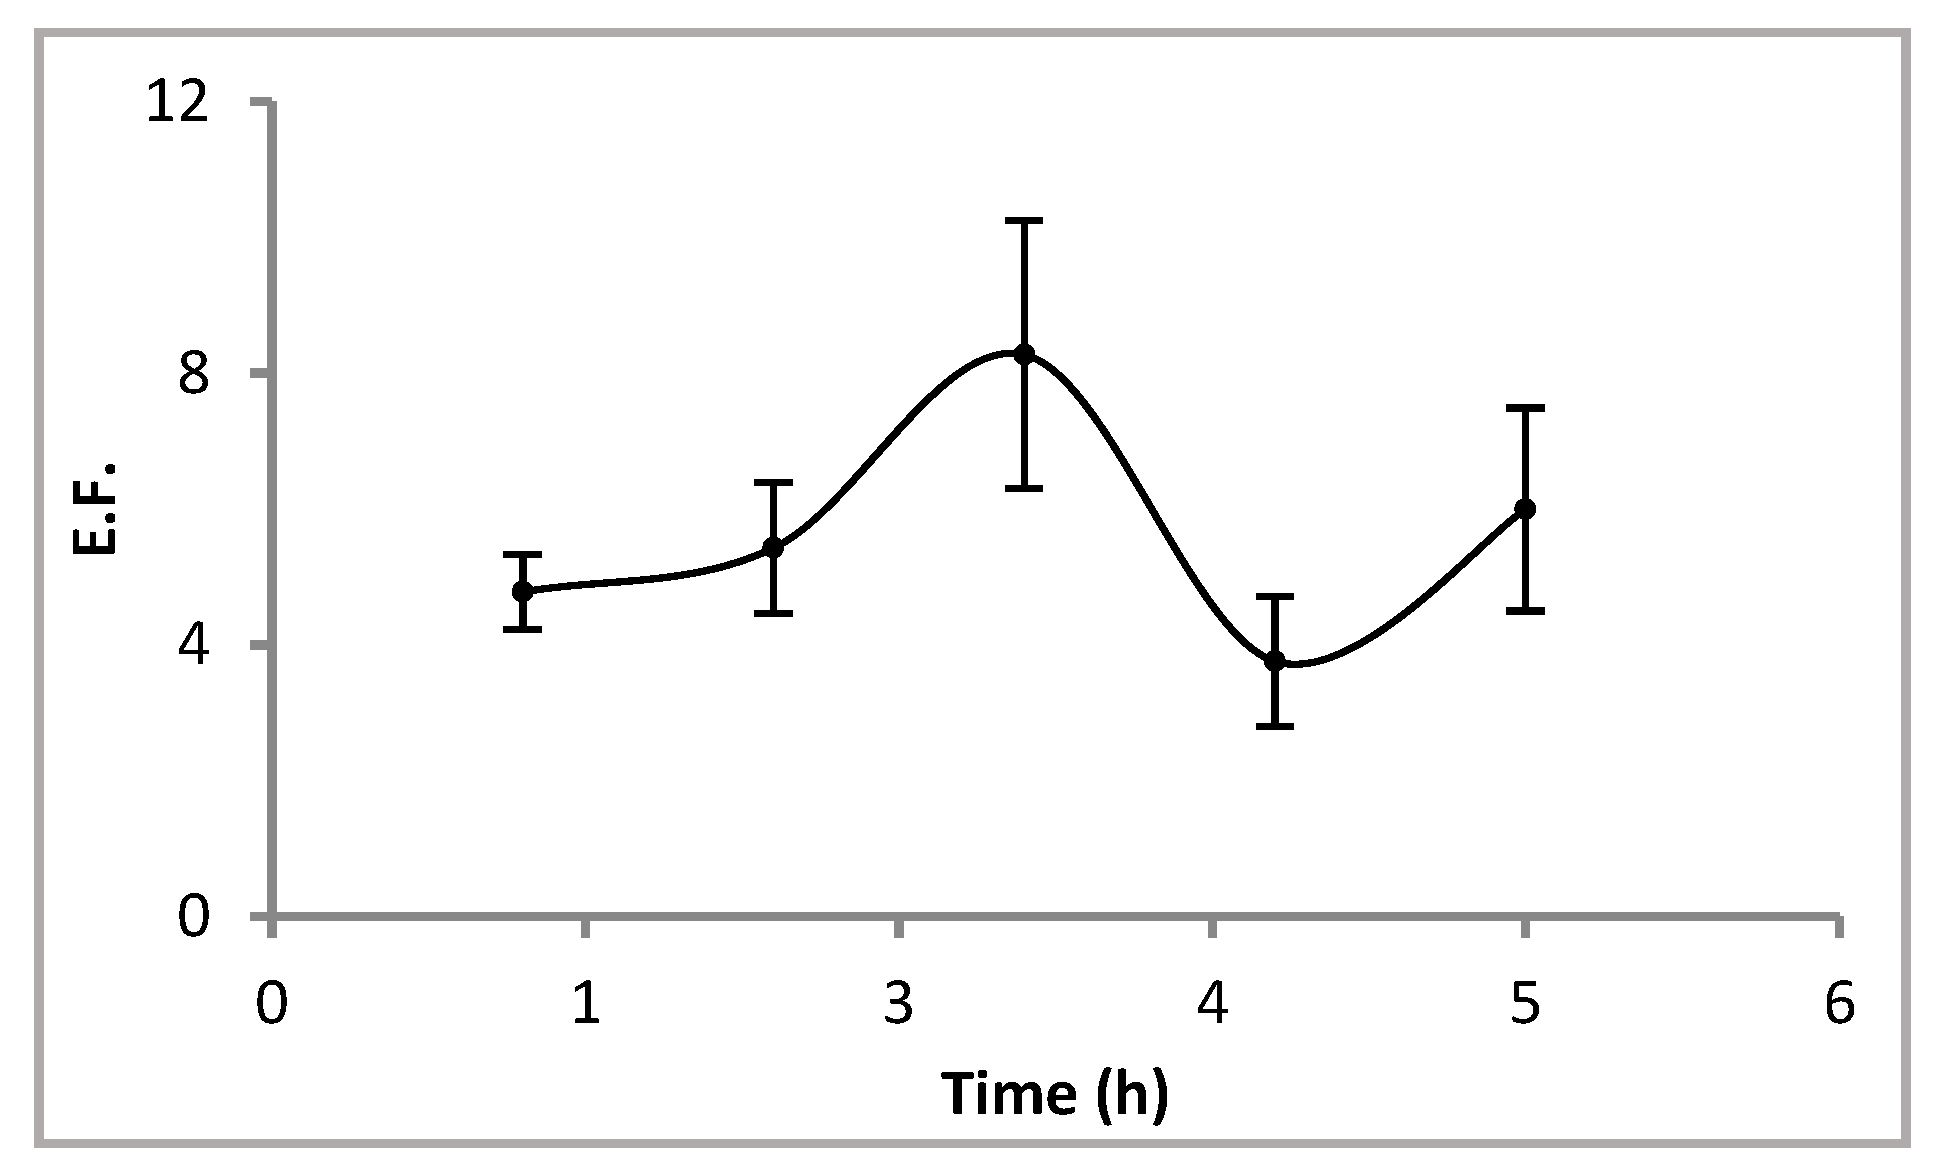
All the experiments were carried out with hollow fibres 10 cm long and with stirring of the sample at 200 rpm. The samples were prepared containing 0.1 µg L−1 Cd2+ in NaNO3 1 M and HEPES 0.1 M. The hollow fibres consisted of Cyanex® 272 1 M in dihexyl ether as liquid membrane impregnating its pores, and HNO3 1 M in the lumen as the acceptor solution. Figure 2 shows the results obtained when extraction time was varied within the range 1–5 h. An increase in EF was obtained in times of up to 3 h. In these systems, the transport of the analyte from the sample to the receiving solution is mainly governed by the diffusion process through the liquid membrane impregnating the pores of the wall of the hollow fibre, which is 450 µm in thickness, and through minimisation of the interfaces processes. Therefore, it is expected that the longer the extraction time, the higher the EF until equilibrium is reached. For higher extraction times, lower EF and higher irreproducibility of the results were obtained, probably due to instability of the organic solution contained into the pores of the fibre. Therefore, the next experiments were carried out at 3 h.
3.1.2. Effect of Hollow Fibre Length
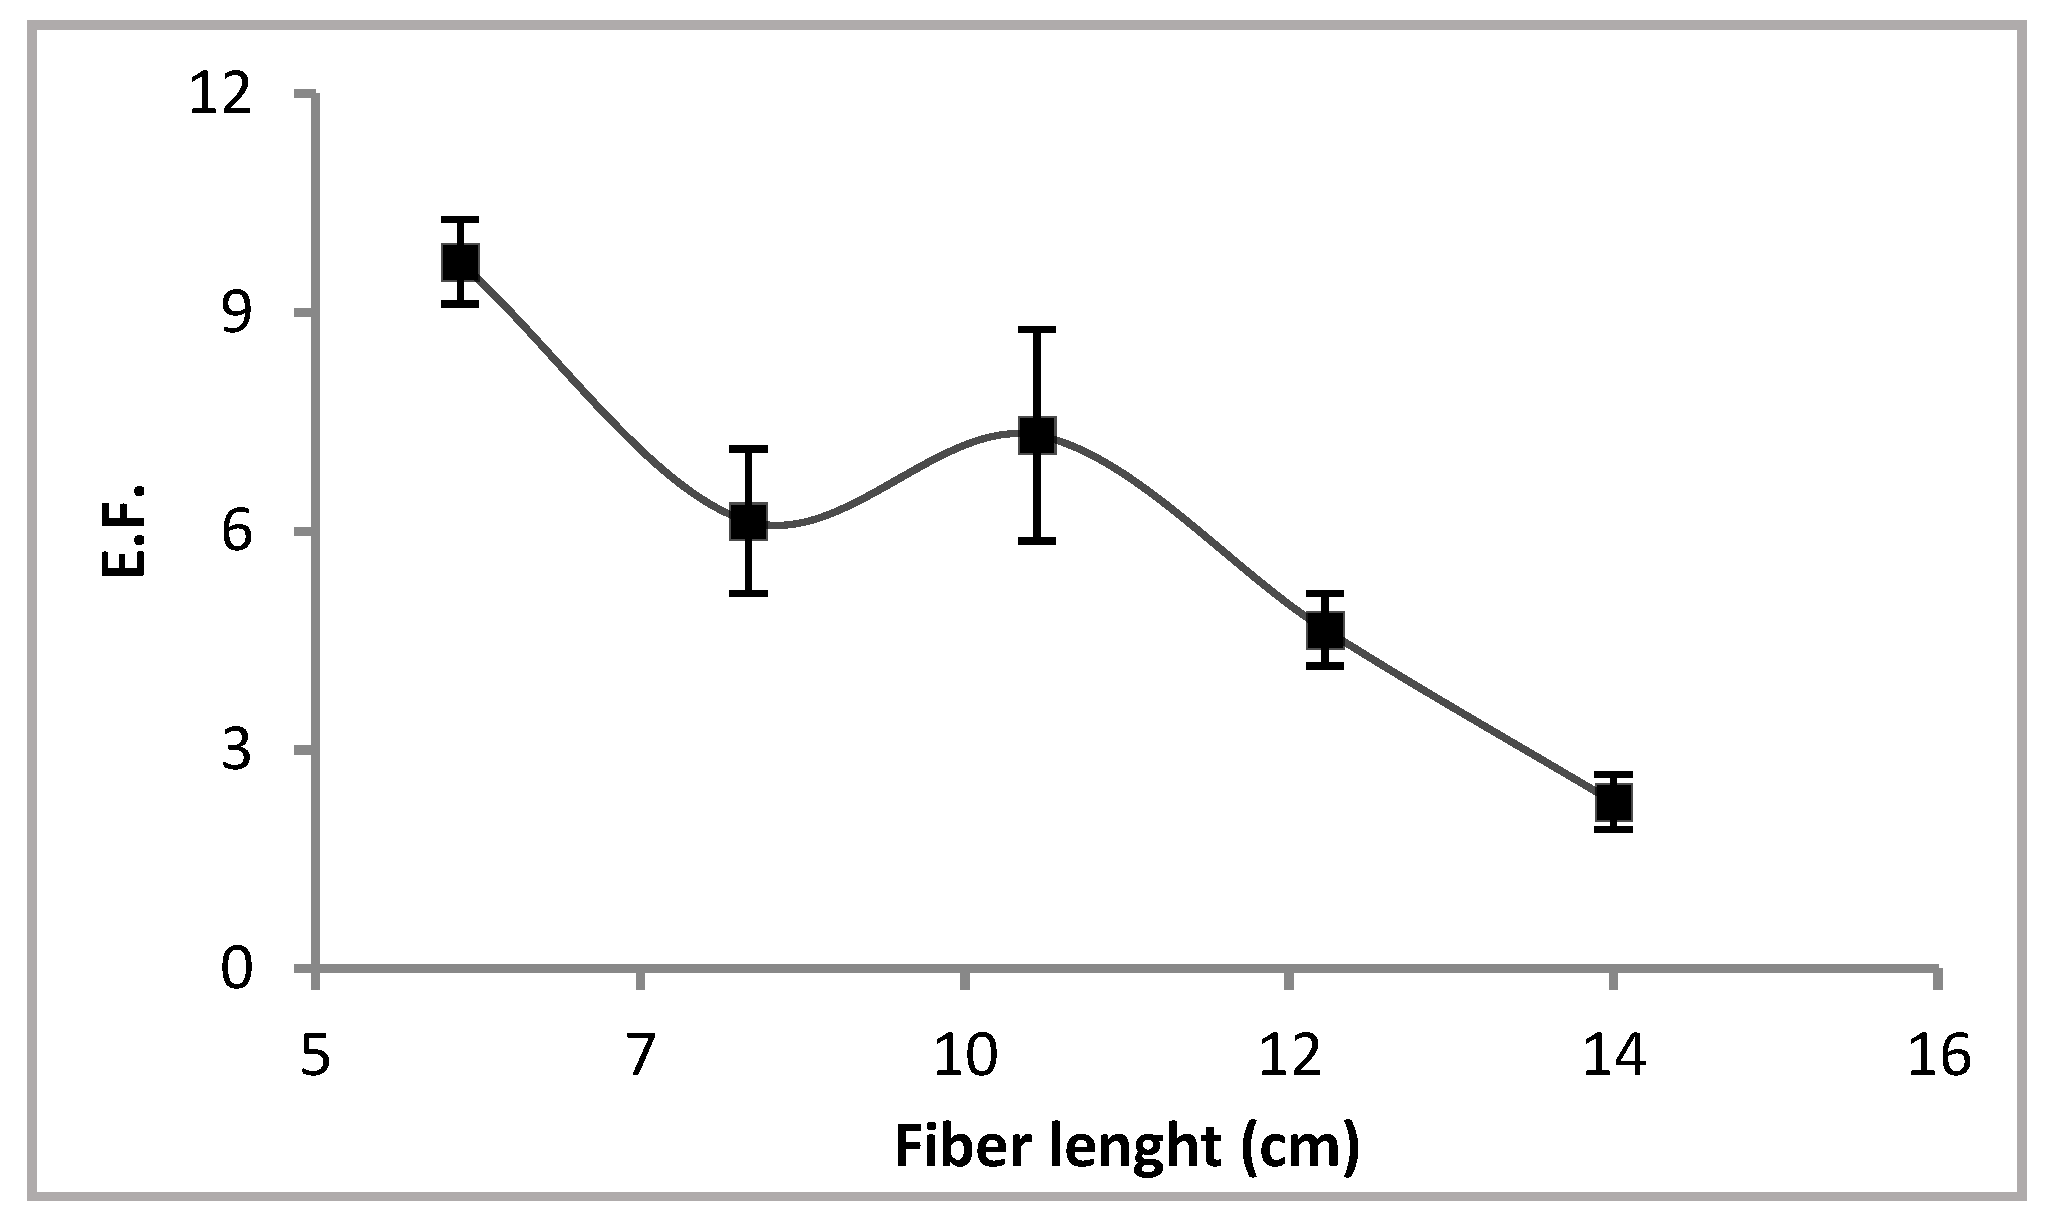
The influence of hollow fibre length on the transport of the analyte from the sample through the supported liquid membrane and into the acceptor solution was directly related with the volume of the later in the lumen. An increase in the fibre length implies a greater volume of the acceptor phase and a dilution effect of the extracted analyte, which leads to a decrease in EF. However, when increasing fibre length, a greater contact area between analyte and liquid membrane is obtained and an EF increase is expected. In the proposed method, the fibre length was studied between 6–14 cm and the results showed that EF decreased with an increase in this variable (Figure 3). Therefore, the dilution effect prevailed over the contact area, so a fibre length of 6 cm was selected as optimum for the following experiments.
3.1.3. Effect of Cyanex® 272 Concentration
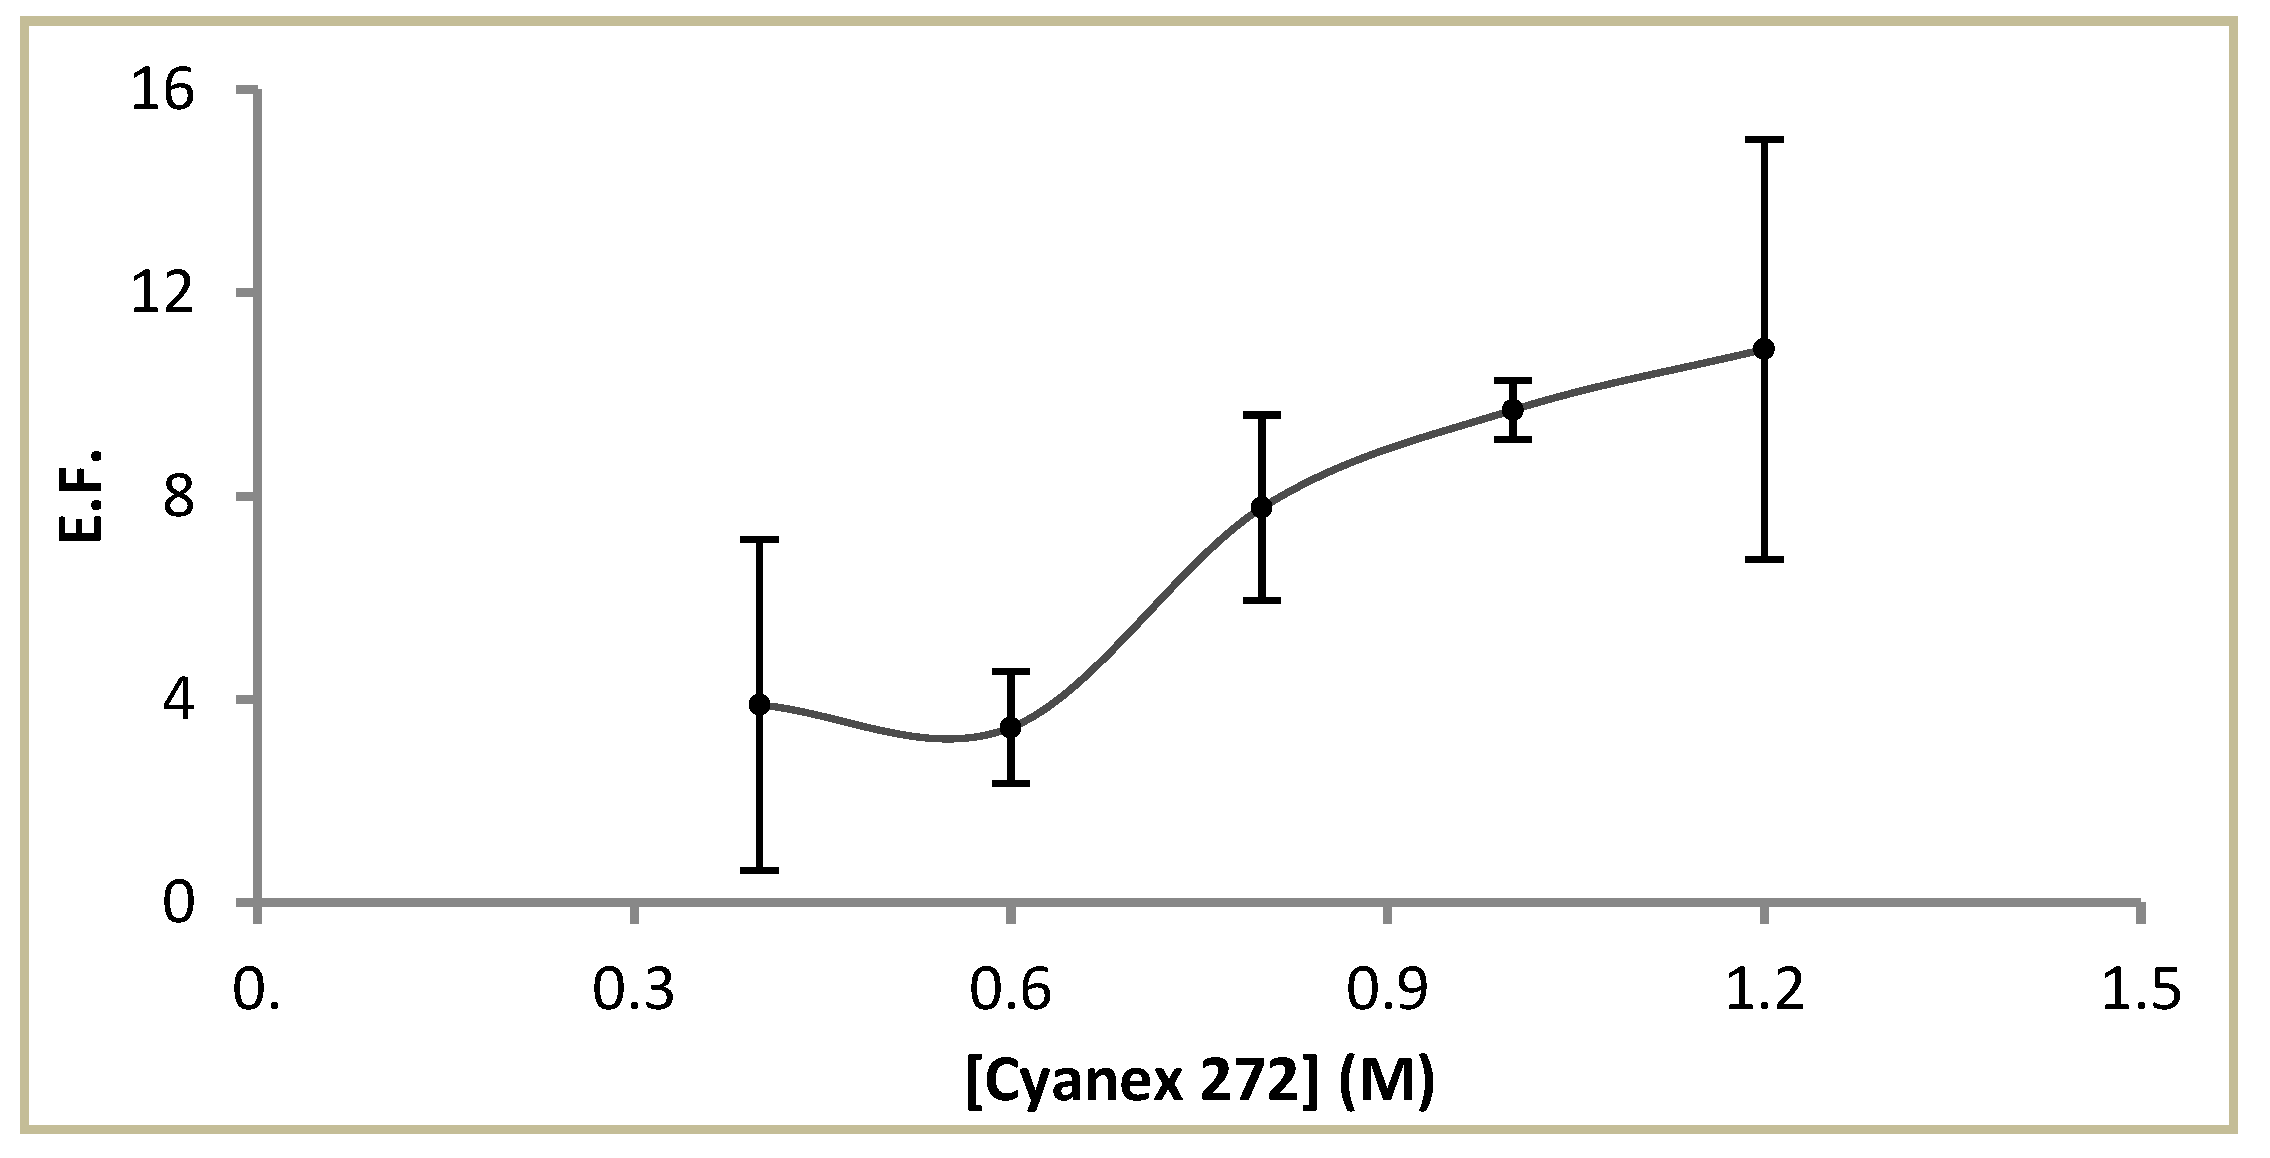
The results obtained when Cyanex® 272 concentration was varied from 0.4 M to 1.2 M showed an improvement in the EF up to the higher concentration assayed (Figure 4). However, at this concentration, a higher irreproducibility was observed in the results, probably due to instability of the liquid membrane in the pores of the hollow fibres. This instability was confirmed by the presence of organic droplets in the sample, and is an intrinsic characteristic of supported liquid membranes due to retention of polymeric fibre in the organic phase in the pores by capillary forces [39]. Thus, Cyanex® 272 1 M was selected as the liquid membrane concentration for further experiments.
3.1.4. Effect of HNO3 Concentration
Results obtained when the concentration of the acceptor solution varied within the range 0.01–2 M are shown in Figure 5. An improvement in EF was obtained when increasing HNO3 concentration up to 0.1 M and poorer EF was obtained for higher concentrations. Thus, much higher acid concentration in the lumen of the fibre could produce instability in the layer between the liquid membrane and acceptor solution, as previously stated by other authors [36]. This instability can be explained in terms of interfacial tension decrease, which has been described for extreme pH values [40]. Therefore, HNO3 0.1 M was selected as the optimum concentration of acceptor solution for the following experiments.
3.1.5. Effect of Stirring Rate
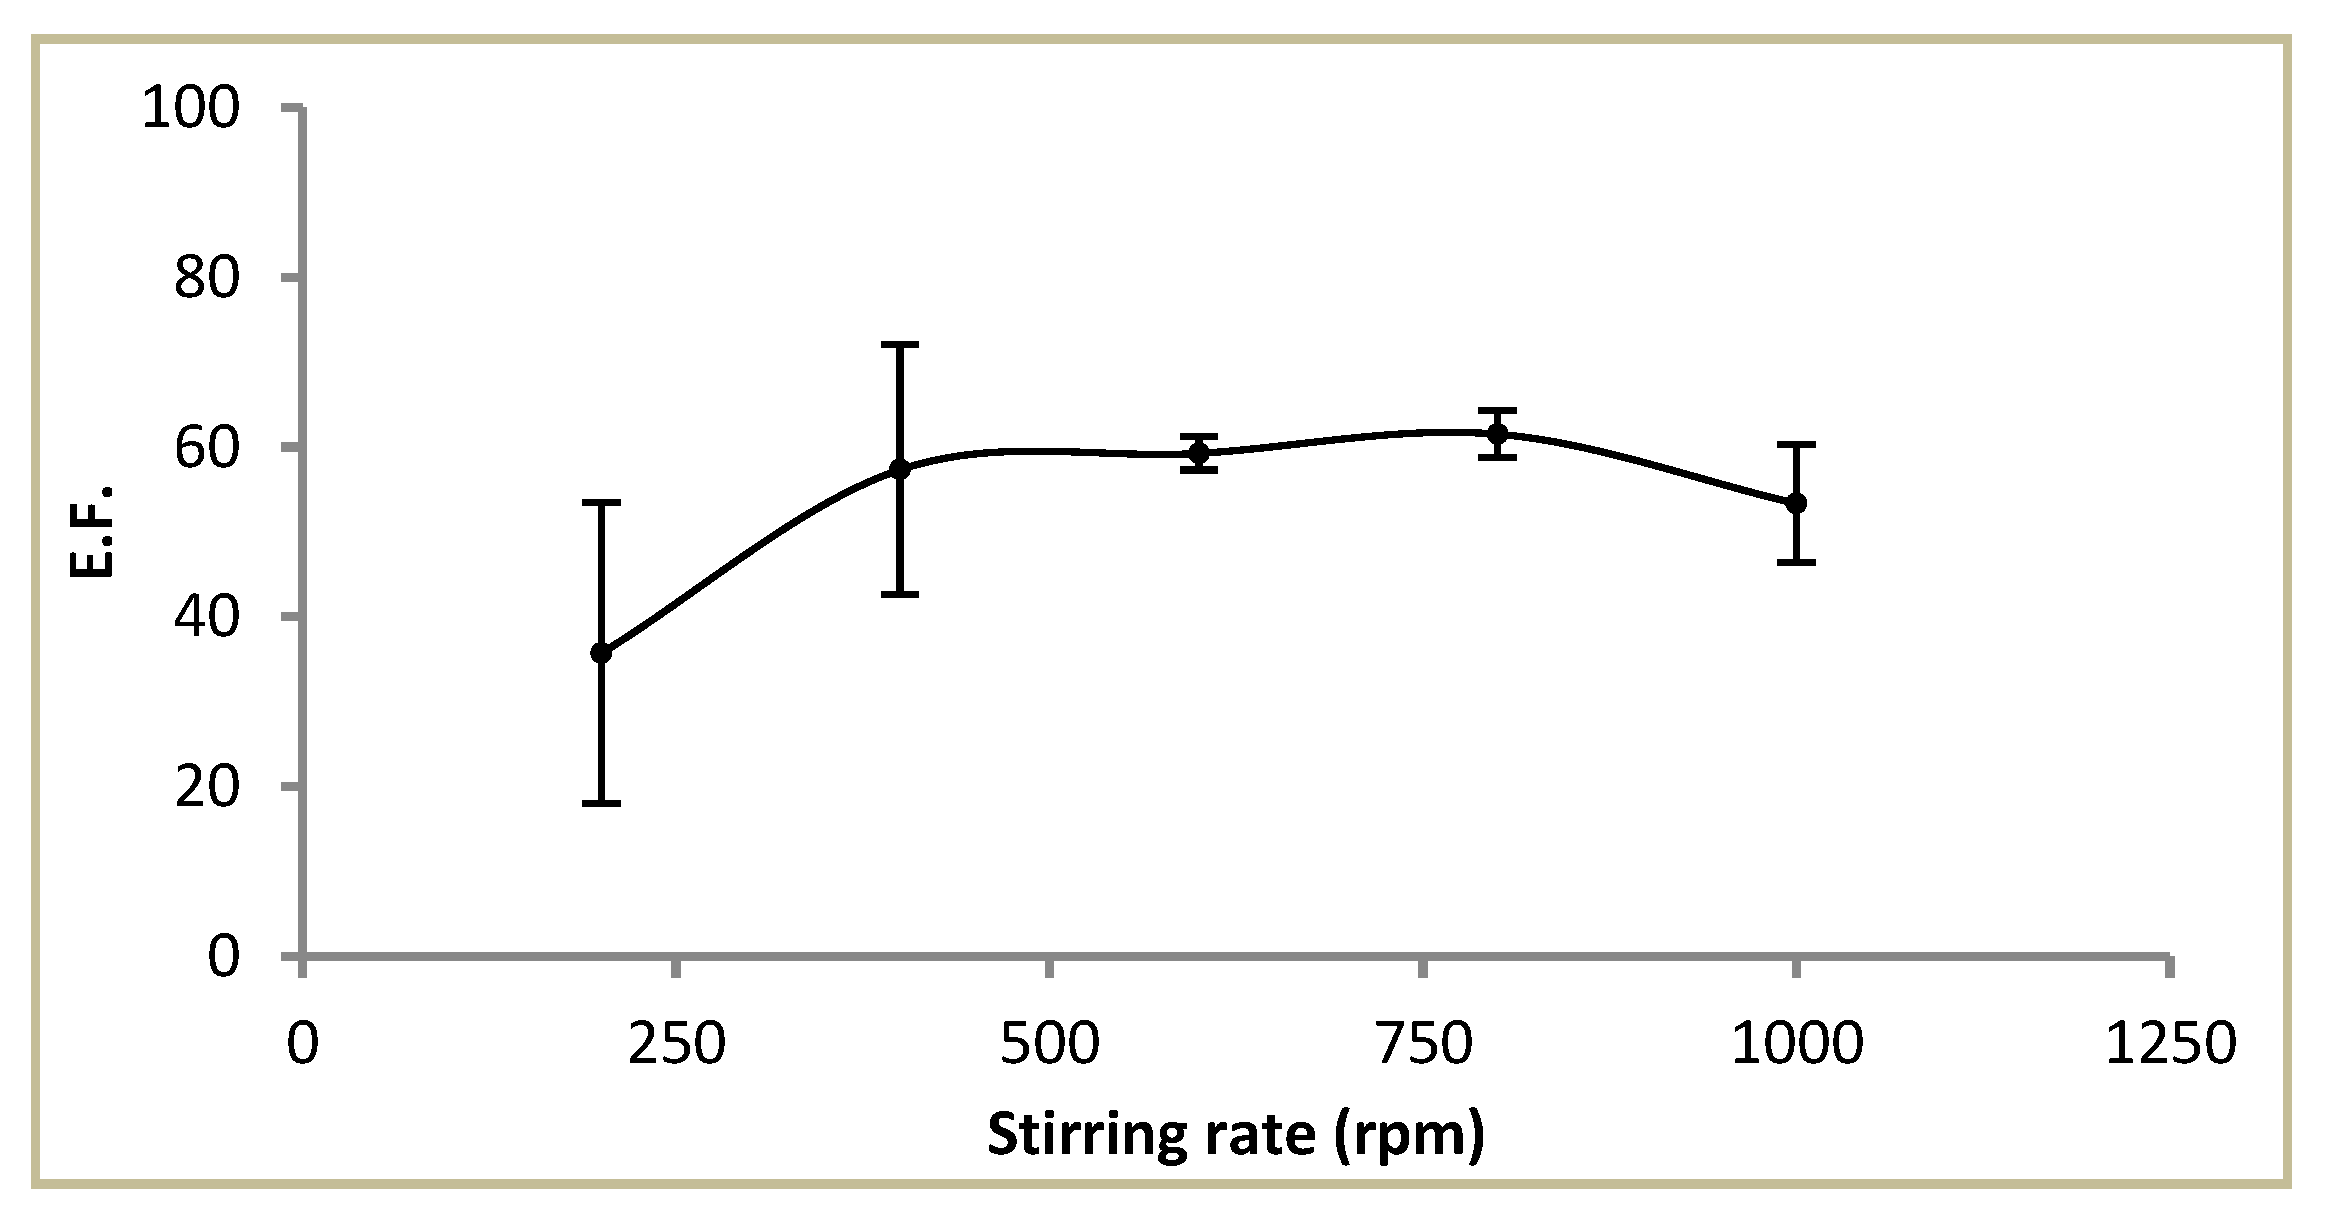
The stirring rate is an important factor in HFLPME because the agitation of the sample improves the mass transfer of the analyte and also reaches the equilibrium between the sample solution and the liquid membrane quickly. In the proposed method, it was evaluated between 200–1000 rpm. The results are shown in Figure 6. An increase in the EF was obtained with increasing stirring rate up to 600–800 rpm. The higher rate assayed obtained a decrease in the EF and poorer reproducibility. In these experiments, formation of air bubbles in the surface of the fibres was observed, which has been related to a reduction in the contact area between the sample and the liquid membrane negatively affecting the extraction efficacy [32]. Thus, 600 rpm was selected as the optimum stirring rate for the following experiments.
In summary, after the optimisation of the variables through application of the univariate methodology, the highest EF was obtained when each hollow fibre was 6 cm in length and contained a 1 M Cyanex® 272 in DHE solution as liquid membrane and 0.1 M HNO3 as acceptor solution. The best results were obtained at a stirring rate of 600 rpm and an extraction time of 3 h.
3.2. Multivariate Optimisation of the Supported Liquid Membrane Method
Based on the information previously obtained in the univariate pre-optimisation, a multivariate optimisation of the microextraction method was carried out and extraction time, Cyanex® 272 concentration and HNO3 concentration were evaluated following a central composite design with the surface response methodology. The experimental conditions and the enrichment factor obtained for each of the 32 experiments are shown in Table 1.
An analysis of variance (ANOVA) was carried out in order to evaluate the model and the significance of the effects. In this sense, a second order polynomial equation (Equation (2)) was obtained as the response surface model to fit the experimental data, where t represents the extraction time. The coefficients of determination, R2 and adjusted-R2, which are a measurement of the amount of the variations around the mean value explained by the model, were 0.9452 and 0.9228, respectively, highlighting its quality.
EF = −176.26 + 46.66·t + 734.01·[HNO3] + 332.61·[Cyanex] − 265.23·t·[HNO3] + 28.94·t·[Cyanex] − 199.54·[HNO3]·[Cyanex]+ 0.86·t2 − 2541.77·[HNO3]2 −177.79·[Cyanex]2
From this expression, the influence of the interactions between variables on the EF may be discussed. In this sense, the negative sign for the interactions nitric acid-time and nitric acid-Cyanex indicates the opposite effect of each individual variable on the response of the system. On the other hand, the interaction time-Cyanex indicates an increase in the EF when both variables take their highest values.
Finally, the maximisation of this function accessed the optimum values of the variables, i.e., t = 4.26 h; [Cyanex 272] = 1.06 M and [HNO3] = 0.04 M. Under optimum conditions, an EF value of 292 was obtained.
The optimisation of the function provided a high extraction time, affecting the applicability of the method. For that reason, and taking into consideration that the method provides a very high EF, we selected a compromise value of 2 h for extraction time, a condition under which an EF of 130 was obtained, which is high enough for practical applications.
3.3. Selectivity of Cadmium Transport and Chemical Speciation
In order to evaluate the effect of the main ionic species naturally occurring in natural waters on the EF, sample solutions containing 0.1 µg L−1 Cd(II) and the potential interfering ion were prepared and analysed by the proposed procedure.
The main cations were used at concentrations levels representative of natural conditions in seawater, i.e., calcium (10.7 mM), potassium (10.6 mM), magnesium (54.8 mM) and sodium (0.5 M). The results showed that the presence of Ca2+ and Mg2+ had a negative influence on EF, with a decrease of up to 80%. Then, the use of citrate as masking agent was considered. From the results obtained, a 0.01 g L−1 solution of the sodium salt of citric acid was shown to be the most appropriate, as previously reported [41]; it was then added for real sample analysis.
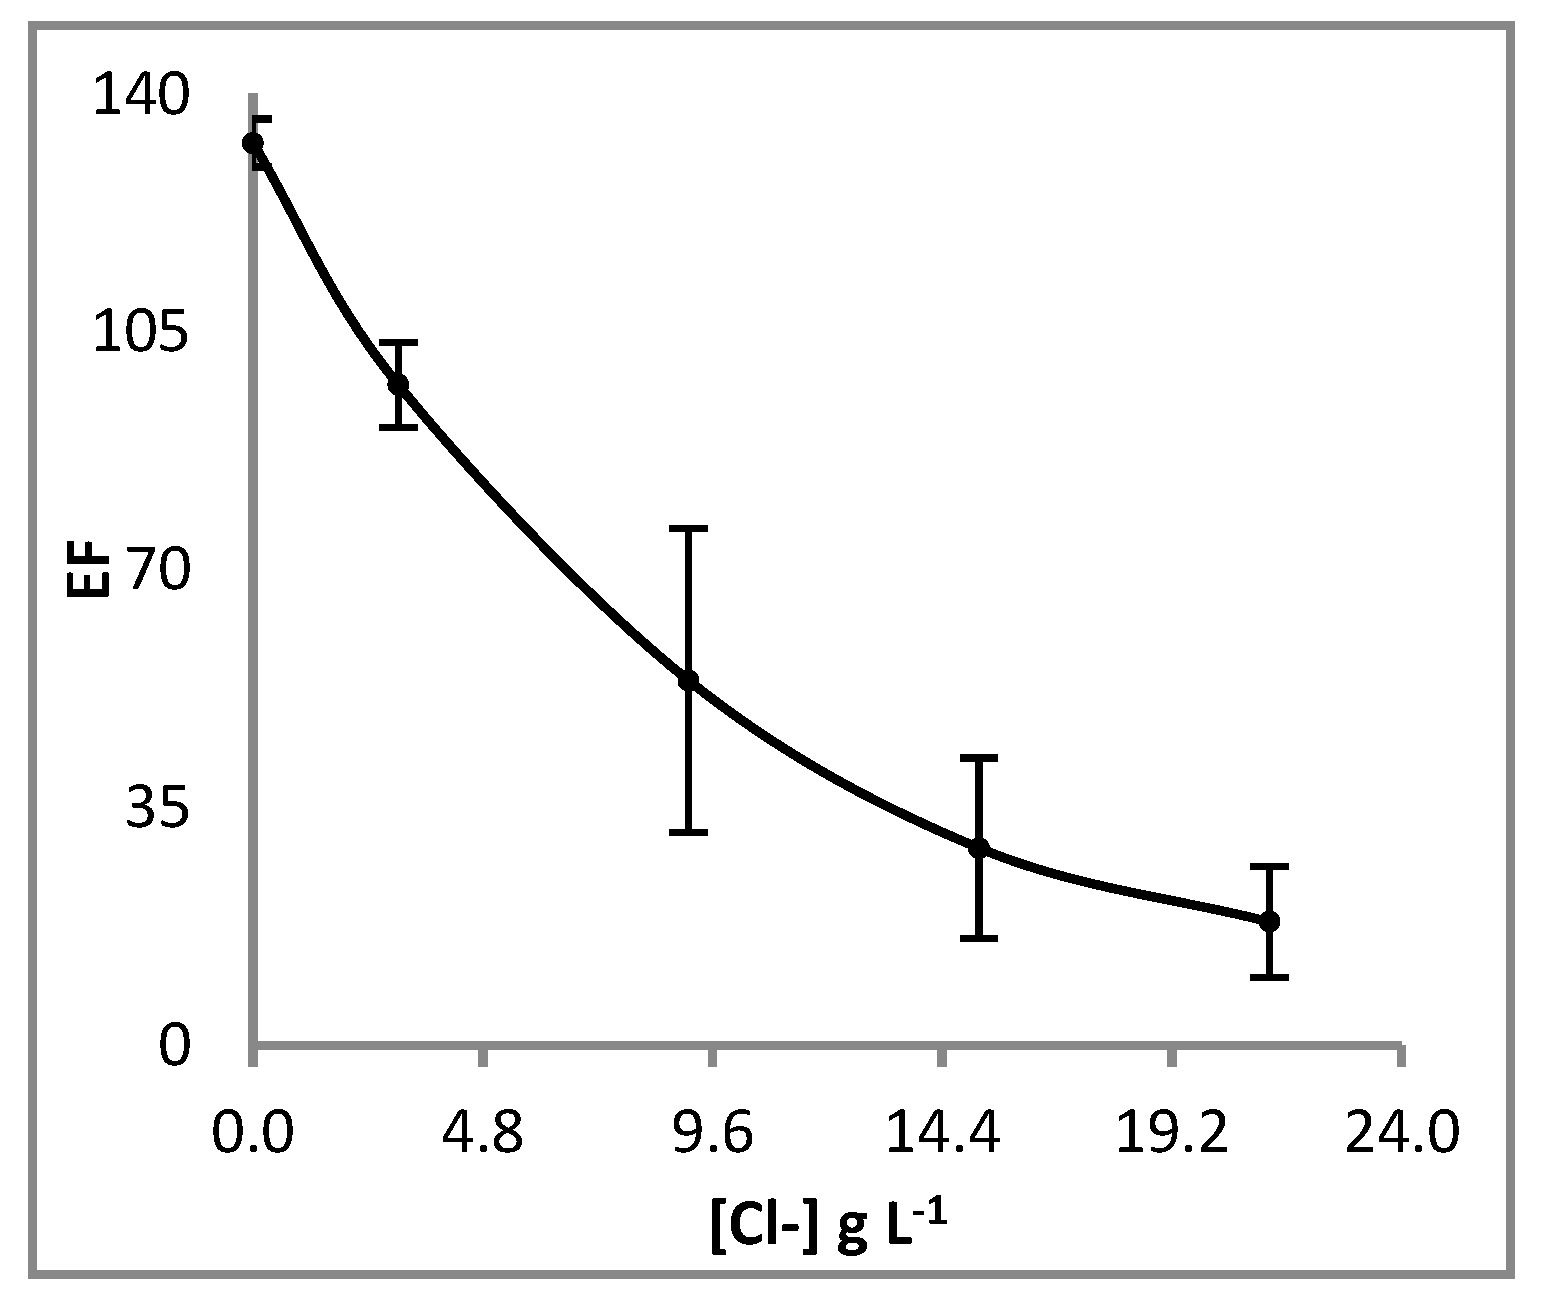
To evaluate the influence of the main anionic species, chlorides (0.09–0.60 M), bicarbonates (0.1–10 mM), bromides (0.5–10 mM) and sulphates (0.50–4 mM) were added to sample solutions accordingly. From the results it was obtained that only chlorides had a significant effect on the enrichment factor. This behaviour can be explained by the formation of cadmium chloride complexes in the aqueous phase ([CdCln](n−2)− with n ≥ 2) which could not be transported through the liquid membrane from the sample using Cyanex® 272 at selected conditions. In this case, as shown in Figure 7, the decrease observed in EF should be directly related with the concentration of chloride in the samples, and could open the possibility of using the system for chemical speciation studies. In this sense, increasing chloride concentration in the sample is directly related with the concentration of both free Cd2+ and CdCl+ in the sample solution, which are the transported species by Cyanex® 272.
Thus, from the results reported above, we obtained a linear relationship between the logarithm of enrichment factor and Cl− concentration (in g L−1) in the samples as follows (Equation (3)):
Log (EF) = 2.1003 − 0.0404 [Cl−]
Therefore, by measuring the concentration of Cl− in water samples, the estimated EF can be calculated and used for the determination of the total concentration of cadmium in the sample [Cd]t by measuring the concentration of cadmium in the acceptor solution [Cd]acceptor after preconcentration, according to Equation (4).
3.4. Analytical Performance
To estimate the limit of detection (LOD) of the method, first a calibration set between 0.05 µg L−1 Cd and 1 µg L−1 Cd and ten independent blank solutions were prepared and analysed by the proposed method. LOD was calculated as the ratio between three times the standard deviation of the blank and the slope of the calibration graph and resulted at 0.13 ng L−1 Cd. Similarly, a limit of quantification (LOQ) of 0.34 ng L−1 Cd was obtained. As can be seen in Table 2, a very low LOD was obtained even if compared with similar methods based on ICP-MS. From different hollow fibre-based microextraction methods previously reported in the literature, only through employing an ionic liquid as the organic membrane [32] was a detection limit as low as the one obtained here exhibited. The reproducibility obtained was 3.3% (0.1 µg L−1 Cd, n = 10). The linearity of the method was evaluated by the quality coefficient (%QC) and by analysing different solutions containing Cd concentration ranging between 0.1 µg L−1 and 4 µg L−1 by the proposed method. The signal was linear up to 3 µg L−1 Cd with a R2 of 0.9991.
3.5. Application to Real Samples
The proposed method was applied to the determination of Cd in two bottled water samples and a tap water sample from the facilities of the laboratory. Two aliquots of each sample were used. Chloride concentration was measured using a potentiometric probe. One of them was then spiked with 10 ng L−1 Cd. After preconcentration experiments, they were analysed and Cd concentration was calculated using Equations (3) and (4). A synthetic seawater sample spiked with three different Cd concentrations was used by using the same procedure. The results obtained, shown in Table 3, proved the applicability of the method to the determination of Cd concentration at the ng L−1 level in water samples with different matrices. Additionally, the results obtained for the recovery tests have demonstrated the accuracy of the method for the preconcentration and determination of cadmium in natural waters.
4. Conclusions
A very sensitive and environmentally friendly method has been developed for the determination of Cd in natural waters, based on HF-LPME preconcentration and determination by GFAAS. Under optimum conditions, a relationship between the enrichment factor and chloride concentration was obtained, allowing its application in real samples with different salinity.
Author Contributions
Conceptualisation, methodology, software, validation, formal analysis, investigation, resources, data curation, writing—original draft preparation, writing—review and editing, visualisation, supervision, project administration and funding acquisition, J.J.P., V.M. and C.M. All authors have read and agreed to the published version of the manuscript.
Funding
This research was funded by the Spanish Ministry of Science and Innovation through the research projects CTM2013-47549-P and PID2021-128642OB-I00.
Institutional Review Board Statement
Not applicable.
Informed Consent Statement
Not applicable.
Data Availability Statement
Not applicable.
Conflicts of Interest
The authors declare no conflict of interest.
References
- Kislik, V. Liquid Membranes: Principles and Applications in Chemical Separations and Wastewater Treatment, 1st ed.; Elsevier: Amsterdam, The Netherlands, 2010. [Google Scholar]
- Song, X.; Huang, X. Recent developments in microextraction techniques for detection and speciation of heavy metals. Adv. Sample Prep. 2022, 2, 100019. [Google Scholar] [CrossRef]
- Yamini, Y.; Rezazadeh, M.; Seidi, S. Liquid-phase microextraction—The different principles and configurations. TrAC Trends Anal. Chem. 2019, 112, 264–272. [Google Scholar] [CrossRef]
- López-López, J.A.; Mendiguchía, C.; Pinto, J.J.; Moreno, C. Application of Solvent-Bar Micro-Extraction for the Determination of Organic and Inorganic Compounds. TrAC Trends Anal. Chem. 2019, 110, 57–65. [Google Scholar] [CrossRef]
- Dmitrienko, S.G.; Apyari, V.V.; Tolmacheva, V.V.; Gorbunova, M.V. Liquid–Liquid Extraction of Organic Compounds into a Single Drop of the Extractant: Overview of Reviews. J. Anal. Chem. 2021, 76, 907–919. [Google Scholar] [CrossRef]
- Kannouma, R.E.; Hammad, M.A.; Kamal, A.H.; Mansour, F.R. Miniaturization of liquid-liquid extraction; the barriers and the enablers. Microchem. J. 2022, 182, 107863. [Google Scholar] [CrossRef]
- Available online: http://water.epa.gov/scitech/methods/cwa/pollutants.cfm (accessed on 14 December 2022).
- Directive 2000/60/EC of the European Parliament and of the Council of 23 October 2000 Establishing a Framework for Community Action in the Field of Water Policy. Available online: https://eur-lex.europa.eu/legal-content/EN/TXT/?uri=celex%3A32000L0060 (accessed on 14 December 2022).
- Directive 2006/11/EC of the European Parliament and of the Council of 15 February 2006 on Pollution Caused by Certain Dangerous Substances Discharged into the Aquatic Environment of the Community. Available online: https://eur-lex.europa.eu/legal-content/EN/TXT/?uri=CELEX%3A32006L0011 (accessed on 14 December 2022).
- Kumar, V.; Sharma, A.; Cerdá, A. Heavy Metals in the Environment: Impact, Assessment and Remediation; Elsevier: Amsterdam, The Netherlands, 2020. [Google Scholar]
- Wang, L.K.; Chen, J.P.; Hung, Y.; Shammas, N.K. Heavy Metals in the Environment; CRC Press: Boca Raton, FL, USA, 2009. [Google Scholar]
- Xiao, H.; Wang, W.; Pi, S.; Cheng, Y.; Xie, Q. Pyridine-2-sulfonic (or carboxylic) acid modified glassy carbon electrode for anodic stripping voltammetry analysis of Cd2+ and Pb2+. Anal. Chim. Acta 2020, 1135, 20–28. [Google Scholar] [CrossRef]
- Nalawade, A.M.; Nalawade, R.A.; Shejwal, R.V.; Kamble, G.S.; Ling, Y.; Anuse, M.A. Development of a reliable analytical method for the precise extractive spectrophotometric determination of cadmium(II) by using of chromogenic reagent: Analysis of real samples. Int. J. Environ. Anal. Chem. 2022, 102, 4158–4177. [Google Scholar] [CrossRef]
- Şanlier Uҫak, Ş.; Aydin, A. A novel thiourea derivative for preconcentration of copper(II), nickel(II), cadmium(II), lead(II) and iron(II) from seawater samples for Flame Atomic Absorption Spectrophotometry. Mar. Pollut. Bull. 2022, 180, 113787. [Google Scholar] [CrossRef] [PubMed]
- Montoro-Leal, P.; Garcia-Mesa, J.C.; Siles Cordero, M.T.; Lopez Guerrero, M.M.; Vereda Alonso, E. Magnetic dispersive solid phase extraction for simultaneous enrichment of cadmium and lead in environmental water samples. Microchem. J. 2020, 155, 104796. [Google Scholar] [CrossRef]
- Greda, K.; Welna, M.; Szymczycha-Madeja, A.; Pohl, P. Sensitive determination of Ag, Bi, Cd, Hg, Pb, Tl, and Zn by inductively coupled plasma optical emission spectrometry combined with the microplasma-assisted vapor generation. Talanta 2022, 249, 123694. [Google Scholar] [CrossRef]
- Soriano, E.; Pastor, A.; de la Guardia, M. Multielemental determination of trace mineral elements in seawater by dynamic reaction cell inductively coupled plasma-mass spectrometry after Al(OH)3 coprecipitation. Microchem. J. 2020, 157, 104864. [Google Scholar] [CrossRef]
- Samanta, S.; Cloete, R.; Loock, J.; Rossouw, R.; Roychoudhury, A.N. Determination of trace metal (Mn, Fe, Ni, Cu, Zn, Co, Cd and Pb) concentrations in seawater using single quadrupole ICP-MS: A comparison between offline and online preconcentration setups. Minerals 2021, 11, 1289. [Google Scholar] [CrossRef]
- Unutkan, T.; Seda, E.; Öztürk, E.; Bakirdere, S. Accurate and sensitive determination of concentrations of twenty-two elements in the surface water from west Antarctica. Water Soil Air Pollut. 2022, 233, 233. [Google Scholar]
- Grasshoff, K.; Kremling, K.; Ehrhardt, M. Methods of Seawater Analysis, 3rd ed.; Wiley-VCH: Weinheim, Germany, 1999. [Google Scholar]
- Lucena, R.; Cárdenas, S. Analytical sample treatment: Basics and trends. In Analytical Sample Preparation with Nano- and Other High-Performance Materials; Lucena, R., Cárdenas, S., Eds.; Elsevier: Amsterdam, The Netherlands, 2021; pp. 1–11. [Google Scholar]
- Liu, H.; Dasgupta, P.K. Analytical chemistry in a drop. Solvent extraction in a microdrop. Anal. Chem. 1996, 68, 1817–1821. [Google Scholar] [CrossRef] [PubMed]
- Jeannot, M.A.; Cantwell, F.F. Solvent microextraction into a single drop. Anal. Chem. 1996, 68, 2236–2240. [Google Scholar] [CrossRef]
- Gałuszka, A.; Migaszewski, Z.; Namieśnik, J. The 12 principles of green analytical chemistry and the significance mnemonic of green analytical practices. Trends Anal. Chem. 2013, 50, 78–84. [Google Scholar] [CrossRef]
- Pasias, I.N.; Rousis, N.I.; Psoma, A.K.; Thomaidis, N.S. Simultaneous or sequential multi-element graphite furnace atomic absorption spectrometry techniques: Advances within the last 20 years. At. Spectrosc. 2021, 42, 310–327. [Google Scholar]
- de la Calle, I.; Pena-Pereira, F.; Lavilla, I.; Bendicho, C. Liquid-phase microextraction combined with graphite furnace atomic absorption spectrometry: A review. Anal. Chim. Acta 2016, 936, 12–39. [Google Scholar] [CrossRef]
- Zhang, S.; Chen, B.; He, M.; Hu, B. Switchable solvent based liquid phase microextraction of trace lead and cadmium from environmental and biological samples prior to graphite furnace atomic absorption spectrometry detection. Microchem. J. 2018, 139, 380–385. [Google Scholar] [CrossRef]
- Dadfarnia, S.; Shabani, A.M.H. Recent development in liquid phase microextraction for determination of trace level concentration of metals—A review. Anal. Chim. Acta 2010, 658, 107–119. [Google Scholar] [CrossRef] [PubMed]
- Santos, P.; Andrade, M.G.; Azevedo, V. Methods of liquid phase microextraction for the determination of cadmium in environmental samples. Environ. Monit. Assess. 2017, 189, 444. [Google Scholar] [CrossRef] [PubMed]
- Medeiros, R.; Bedendo, G.; Schneider, J.; Carasek, E. Isolation and preconcentration of Cd(II) from environmental samples using polypropylene porous membrane in a hollow fiber renewal liquid membrane extraction procedure and determination by FAAS. J. Haz. Mat. 2010, 177, 567–572. [Google Scholar]
- Zeng, C.J.; Yang, F.W.; Zhou, J.; Qiu, H.L. Determination of Cd in water samples by Hollow-fiber-supported liquid-membrane extraction coupled with thermospray-flame-furnace atomic-absorption spectrometry. Spectrosc. Lett. 2011, 44, 278–284. [Google Scholar] [CrossRef]
- Chen, H.; Han, J.; Wang, Y.; Hu, Y.; Ni, L.; Liu, Y.; Kang, W.; Liu, Y. Hollow fiber liquid-phase microextraction of cadmium(II) using an ionic liquid as the extractant. Microchim. Acta 2014, 181, 1455–1461. [Google Scholar] [CrossRef]
- Pont, N.; Salvadó, V.; Fontás, C. Applicability of a supported liquid membrane in the enrichment and determination of cadmium from complex aqueous samples. Membranes 2018, 8, 21. [Google Scholar] [CrossRef] [Green Version]
- Anagnostou, D.D.; Fiamegos, Y.C.; Stalikas, C.D. Determination of cadmium and lead in aqueous environmental samples after complexation and microextraction onto the surface of an empty solvent-impregnated polypropylene fibre coupled with electrothermal AAS. Int. J. Environ. Anal. Chem. 2012, 92, 1227–1238. [Google Scholar] [CrossRef]
- Herce-Sesa, B.; López-López, J.A.; Pinto, J.; Moreno, C. Ionic liquid-based solvent micro-extraction of Ag and Cd form saline and hyper-saline waters. Chem. Eng. J. 2017, 308, 649–655. [Google Scholar] [CrossRef]
- Herce-Sesa, B.; López-López, J.A.; Moreno, C. Ionic liquid solvent bar micro-extraction of CdCln(n−2)- species for ultratrace Cd determination in seawater. Chemosphere 2018, 193, 306–312. [Google Scholar] [CrossRef]
- Herce-Sesa, B.; Pirkwieser, P.; López-López, J.A.; Jirsa, F.; Moreno, C. Selective liquid phase micro-extraction of metal chloro-complexes from saline waters using ionic liquids. J. Clean. Prod. 2020, 262, 121415. [Google Scholar] [CrossRef]
- Morgan, E. Chemometrics: Experimental Design; Wiley: Belmont, FL, USA, 1995. [Google Scholar]
- Dżygiel, P.; Wieczorek, P.P. Supported Liquid Membranes and Their Modifications: Definition, Classification, Theory, Stability, Application and Perspectives. In Liquid Membranes. Principles and Applications in Chemical Separations and Wastewater Treatment; Kislik, V.S., Ed.; Elsevier: Amsterdam, The Nederlands, 2010. [Google Scholar]
- Al-Rossies, A.A.S.; Al-Anazi, B.D.; Paiaman, A.M. Effect of pH-values on the contact angle and interfacial tension. NAFTA 2010, 61, 181–186. [Google Scholar]
- Irigoyen, L.; Moreno, C.; Mendiguchía, C.; García-Vargas, M. Application of liquid membranes to sample preconcentration for the spectrometric determination of cadmium in seawater. J. Memb. Sci. 2006, 274, 169–172. [Google Scholar] [CrossRef]
Figure 1.
Set-up of the HF-LPME system. PP: Peristaltic pump. MS: Magnetic stirrer. HF: hollow fibre.
Figure 1.
Set-up of the HF-LPME system. PP: Peristaltic pump. MS: Magnetic stirrer. HF: hollow fibre.

Figure 2.
Effect of extraction time on the enrichment factor. Sample: 0.1 µg L−1 Cd2+ in NaNO3 1 M and HEPES 0.1 M. Liquid membrane: Cyanex® 272 1 M in dihexyl ether. Acceptor solution: HNO3 1 M. Fibre length: 10 cm. Stirring rate: 200 rpm.
Figure 2.
Effect of extraction time on the enrichment factor. Sample: 0.1 µg L−1 Cd2+ in NaNO3 1 M and HEPES 0.1 M. Liquid membrane: Cyanex® 272 1 M in dihexyl ether. Acceptor solution: HNO3 1 M. Fibre length: 10 cm. Stirring rate: 200 rpm.

Figure 3.
Effect of the fibre length on the enrichment factor. Sample: 0.1 µg L−1 Cd2+ in NaNO3 1 M and HEPES 0.1 M. Liquid membrane: Cyanex® 272 1 M in dihexyl ether. Acceptor solution: HNO3 1 M. Extraction time: 180 min. Stirring rate: 200 rpm.
Figure 3.
Effect of the fibre length on the enrichment factor. Sample: 0.1 µg L−1 Cd2+ in NaNO3 1 M and HEPES 0.1 M. Liquid membrane: Cyanex® 272 1 M in dihexyl ether. Acceptor solution: HNO3 1 M. Extraction time: 180 min. Stirring rate: 200 rpm.

Figure 4.
Effect of Cyanex ® 272 concentration on the enrichment factor. Sample: 0.1 µg L−1 Cd2+ in NaNO3 1 M and HEPES 0.1 M. Acceptor solution: HNO3 1 M. Extraction time: 180 min. Fiber length: 6 cm. Stirring rate: 200 rpm.
Figure 4.
Effect of Cyanex ® 272 concentration on the enrichment factor. Sample: 0.1 µg L−1 Cd2+ in NaNO3 1 M and HEPES 0.1 M. Acceptor solution: HNO3 1 M. Extraction time: 180 min. Fiber length: 6 cm. Stirring rate: 200 rpm.

Figure 5.
Effect of HNO3 concentration on the enrichment factor. Sample: 0.1 µg L−1 Cd2+ in NaNO3 1 M and HEPES 0.1 M. Liquid membrane: Cyanex® 272 1 M in dihexyl ether. Extraction time: 180 min. Fibre length: 6 cm. Stirring rate: 200 rpm.
Figure 5.
Effect of HNO3 concentration on the enrichment factor. Sample: 0.1 µg L−1 Cd2+ in NaNO3 1 M and HEPES 0.1 M. Liquid membrane: Cyanex® 272 1 M in dihexyl ether. Extraction time: 180 min. Fibre length: 6 cm. Stirring rate: 200 rpm.

Figure 6.
Effect of stirring rate on the enrichment factor. Sample: 0.1 µg L−1 Cd2+ in NaNO3 1 M and HEPES 0.1 M. Liquid membrane: Cyanex® 272 1 M in dihexyl ether. Extraction time: 180 min. Fibre length: 6 cm. Acceptor solution: HNO3 0.1 M.
Figure 6.
Effect of stirring rate on the enrichment factor. Sample: 0.1 µg L−1 Cd2+ in NaNO3 1 M and HEPES 0.1 M. Liquid membrane: Cyanex® 272 1 M in dihexyl ether. Extraction time: 180 min. Fibre length: 6 cm. Acceptor solution: HNO3 0.1 M.

Figure 7.
Effect of chloride concentration in the sample on the enrichment factor. Liquid membrane: Cyanex® 272 1.06 M in dihexyl ether. Extraction time: 120 min. Fiber length: 6 cm. Acceptor solution: HNO3 0.04 M.
Figure 7.
Effect of chloride concentration in the sample on the enrichment factor. Liquid membrane: Cyanex® 272 1.06 M in dihexyl ether. Extraction time: 120 min. Fiber length: 6 cm. Acceptor solution: HNO3 0.04 M.


Table 1.
Experimental conditions for the central composite design and EF values obtained.
| Time (h) | HNO3 (M) | Cyanex® 272 (M) | EF | |
|---|---|---|---|---|
| 1 | 2.25 | 0.209 | 0.8 | 39.26 |
| 2 | 3.5 | 0.175 | 1.1 | 103.16 |
| 3 | 3.5 | 0.075 | 0.5 | 136.94 |
| 4 | 1 | 0.175 | 1.1 | 10.88 |
| 5 | 3.5 | 0.075 | 1.1 | 192.6 |
| 6 | 2.25 | 0.125 | 1.3 | 93.96 |
| 7 | 2.25 | 0.125 | 0.8 | 122.54 |
| 8 | 2.25 | 0.041 | 0.8 | 121.44 |
| 9 | 2.25 | 0.125 | 0.8 | 84.74 |
| 10 | 1 | 0.175 | 0.5 | 13.34 |
| 11 | 4.35 | 0.125 | 0.8 | 231.51 |
| 12 | 1 | 0.075 | 0.5 | 11.82 |
| 13 | 1 | 0.075 | 1.1 | 74.87 |
| 14 | 2.25 | 0.125 | 0.3 | 12.55 |
| 15 | 3.5 | 0.175 | 0.5 | 21.98 |
| 16 | 0.15 | 0.125 | 0.8 | 0.52 |
| 17 | 2.25 | 0.209 | 0.8 | 21.08 |
| 18 | 3.5 | 0.175 | 1.1 | 108.86 |
| 19 | 3.5 | 0.075 | 0.5 | 131.28 |
| 20 | 1 | 0.175 | 1.1 | 13.4 |
| 21 | 3.5 | 0.075 | 1.1 | 196.54 |
| 22 | 2.25 | 0.125 | 1.3 | 106.97 |
| 23 | 2.25 | 0.125 | 0.8 | 99.33 |
| 24 | 2.25 | 0.041 | 0.8 | 146.37 |
| 25 | 2.25 | 0.125 | 0.8 | 69.81 |
| 26 | 1 | 0.175 | 0.5 | 0.8 |
| 27 | 4.35 | 0.125 | 0.8 | 182.94 |
| 28 | 1 | 0.075 | 0.5 | 22.88 |
| 29 | 1 | 0.075 | 1.1 | 70.97 |
| 30 | 2.25 | 0.125 | 0.3 | 5.53 |
| 31 | 3.5 | 0.175 | 0.5 | 16.01 |
| 32 | 0.15 | 0.125 | 0.8 | 0.3 |
Table 2.
Comparison of the proposed method with other reported methods.
| Technique | Vol. (mL) | EF | LOD (ng L−1) | Reference |
|---|---|---|---|---|
| SAGD-ICP-OES a | 10 | -- | 60 | 16 |
| NH3-DRC-ICP-MS b | 40 | 2 | 5 | 17 |
| SQ-ICP-MS c | 10 | 30 | 0.63 | 18 |
| HFRLM-FAAS d | 20 | 107 | 1500 | 30 |
| HFLPME-IL-TS-FF-AAS e | 100 | 90 | 9 | 31 |
| HFLPME-IL-GFAAS f | 50 | 162 | 0.12 | 32 |
| HFLPME-ETAAS g | 25 | 30 | 4 | 34 |
| 3SBME-IL-GFAAS h | 35 | 65 | 4.5 | 36 |
| HFLPME-GFAAS i | 250 | 130 | 0.13 | This method |
a Solution anode glow discharge–Inductively coupled plasma–Optical emission spectroscopy. b Ammonia–Dynamic reaction cell–Inductively coupled plasma–Mass spectrometry. c Single quadrupole–Inductively coupled plasma–Mass spectrometry. d Hollow-fibre renewal liquid membrane–Flame atomic absorption spectrometry. e Hollow-fibre liquid-phase microextraction–Ionic liquid–Thermospray flame furnace atomic absorption spectrometry. f Hollow-fibre liquid-phase microextraction–Ionic liquid–Graphite furnace atomic absorption spectrometry. g Hollow-fibre liquid-phase microextraction–Electrothermal atomic absorption spectrometry. h Three-phase solvent bar microextraction–Ionic liquid–Graphite furnace atomic absorption spectrometry. i Hollow-fibre liquid-phase microextraction–Graphite furnace atomic absorption spectrometry.
Table 3.
Cadmium concentration obtained in different water samples.
| Sample | [Cd]spiked ng L−1 | [Cd]found ng L−1 | % R |
|---|---|---|---|
| Bottled water 1 | --- | 4.5 | |
| Bottled water 1 | 10 | 14.4 | 99.4 |
| Bottled water 2 | --- | 2.7 | |
| Bottled water 2 | 10 | 11.7 | 92.3 |
| Tap water | --- | 2.2 | |
| Tap water | 10 | 14.6 | 119.9 |
| Seawater | 50 | 67 | 133.8 |
| Seawater | 100 | 104 | 103.9 |
| Seawater | 200 | 208 | 103.8 |
Disclaimer/Publisher’s Note: The statements, opinions and data contained in all publications are solely those of the individual author(s) and contributor(s) and not of MDPI and/or the editor(s). MDPI and/or the editor(s) disclaim responsibility for any injury to people or property resulting from any ideas, methods, instructions or products referred to in the content. |
© 2023 by the authors. Licensee MDPI, Basel, Switzerland. This article is an open access article distributed under the terms and conditions of the Creative Commons Attribution (CC BY) license (https://creativecommons.org/licenses/by/4.0/).
Share and Cite
MDPI and ACS Style
Pinto, J.J.; Mánuel, V.; Moreno, C. A Green Method for the Determination of Cadmium in Natural Waters Based on Multi-Fibre Supported Liquid Membranes. Membranes 2023, 13, 327. https://doi.org/10.3390/membranes13030327
AMA Style
Pinto JJ, Mánuel V, Moreno C. A Green Method for the Determination of Cadmium in Natural Waters Based on Multi-Fibre Supported Liquid Membranes. Membranes. 2023; 13(3):327. https://doi.org/10.3390/membranes13030327
Chicago/Turabian StylePinto, Juan J., Victoria Mánuel, and Carlos Moreno. 2023. "A Green Method for the Determination of Cadmium in Natural Waters Based on Multi-Fibre Supported Liquid Membranes" Membranes 13, no. 3: 327. https://doi.org/10.3390/membranes13030327
Note that from the first issue of 2016, this journal uses article numbers instead of page numbers. See further details here.