
Evaluation of Forward Osmosis and Low-Pressure Reverse Osmosis with a Tubular Membrane for the Concentration of Municipal Wastewater and the Production of Biogas
 ,
, 

Abstract
:
1. Introduction
2. Materials and Methods
2.1. Forward Osmosis Membrane
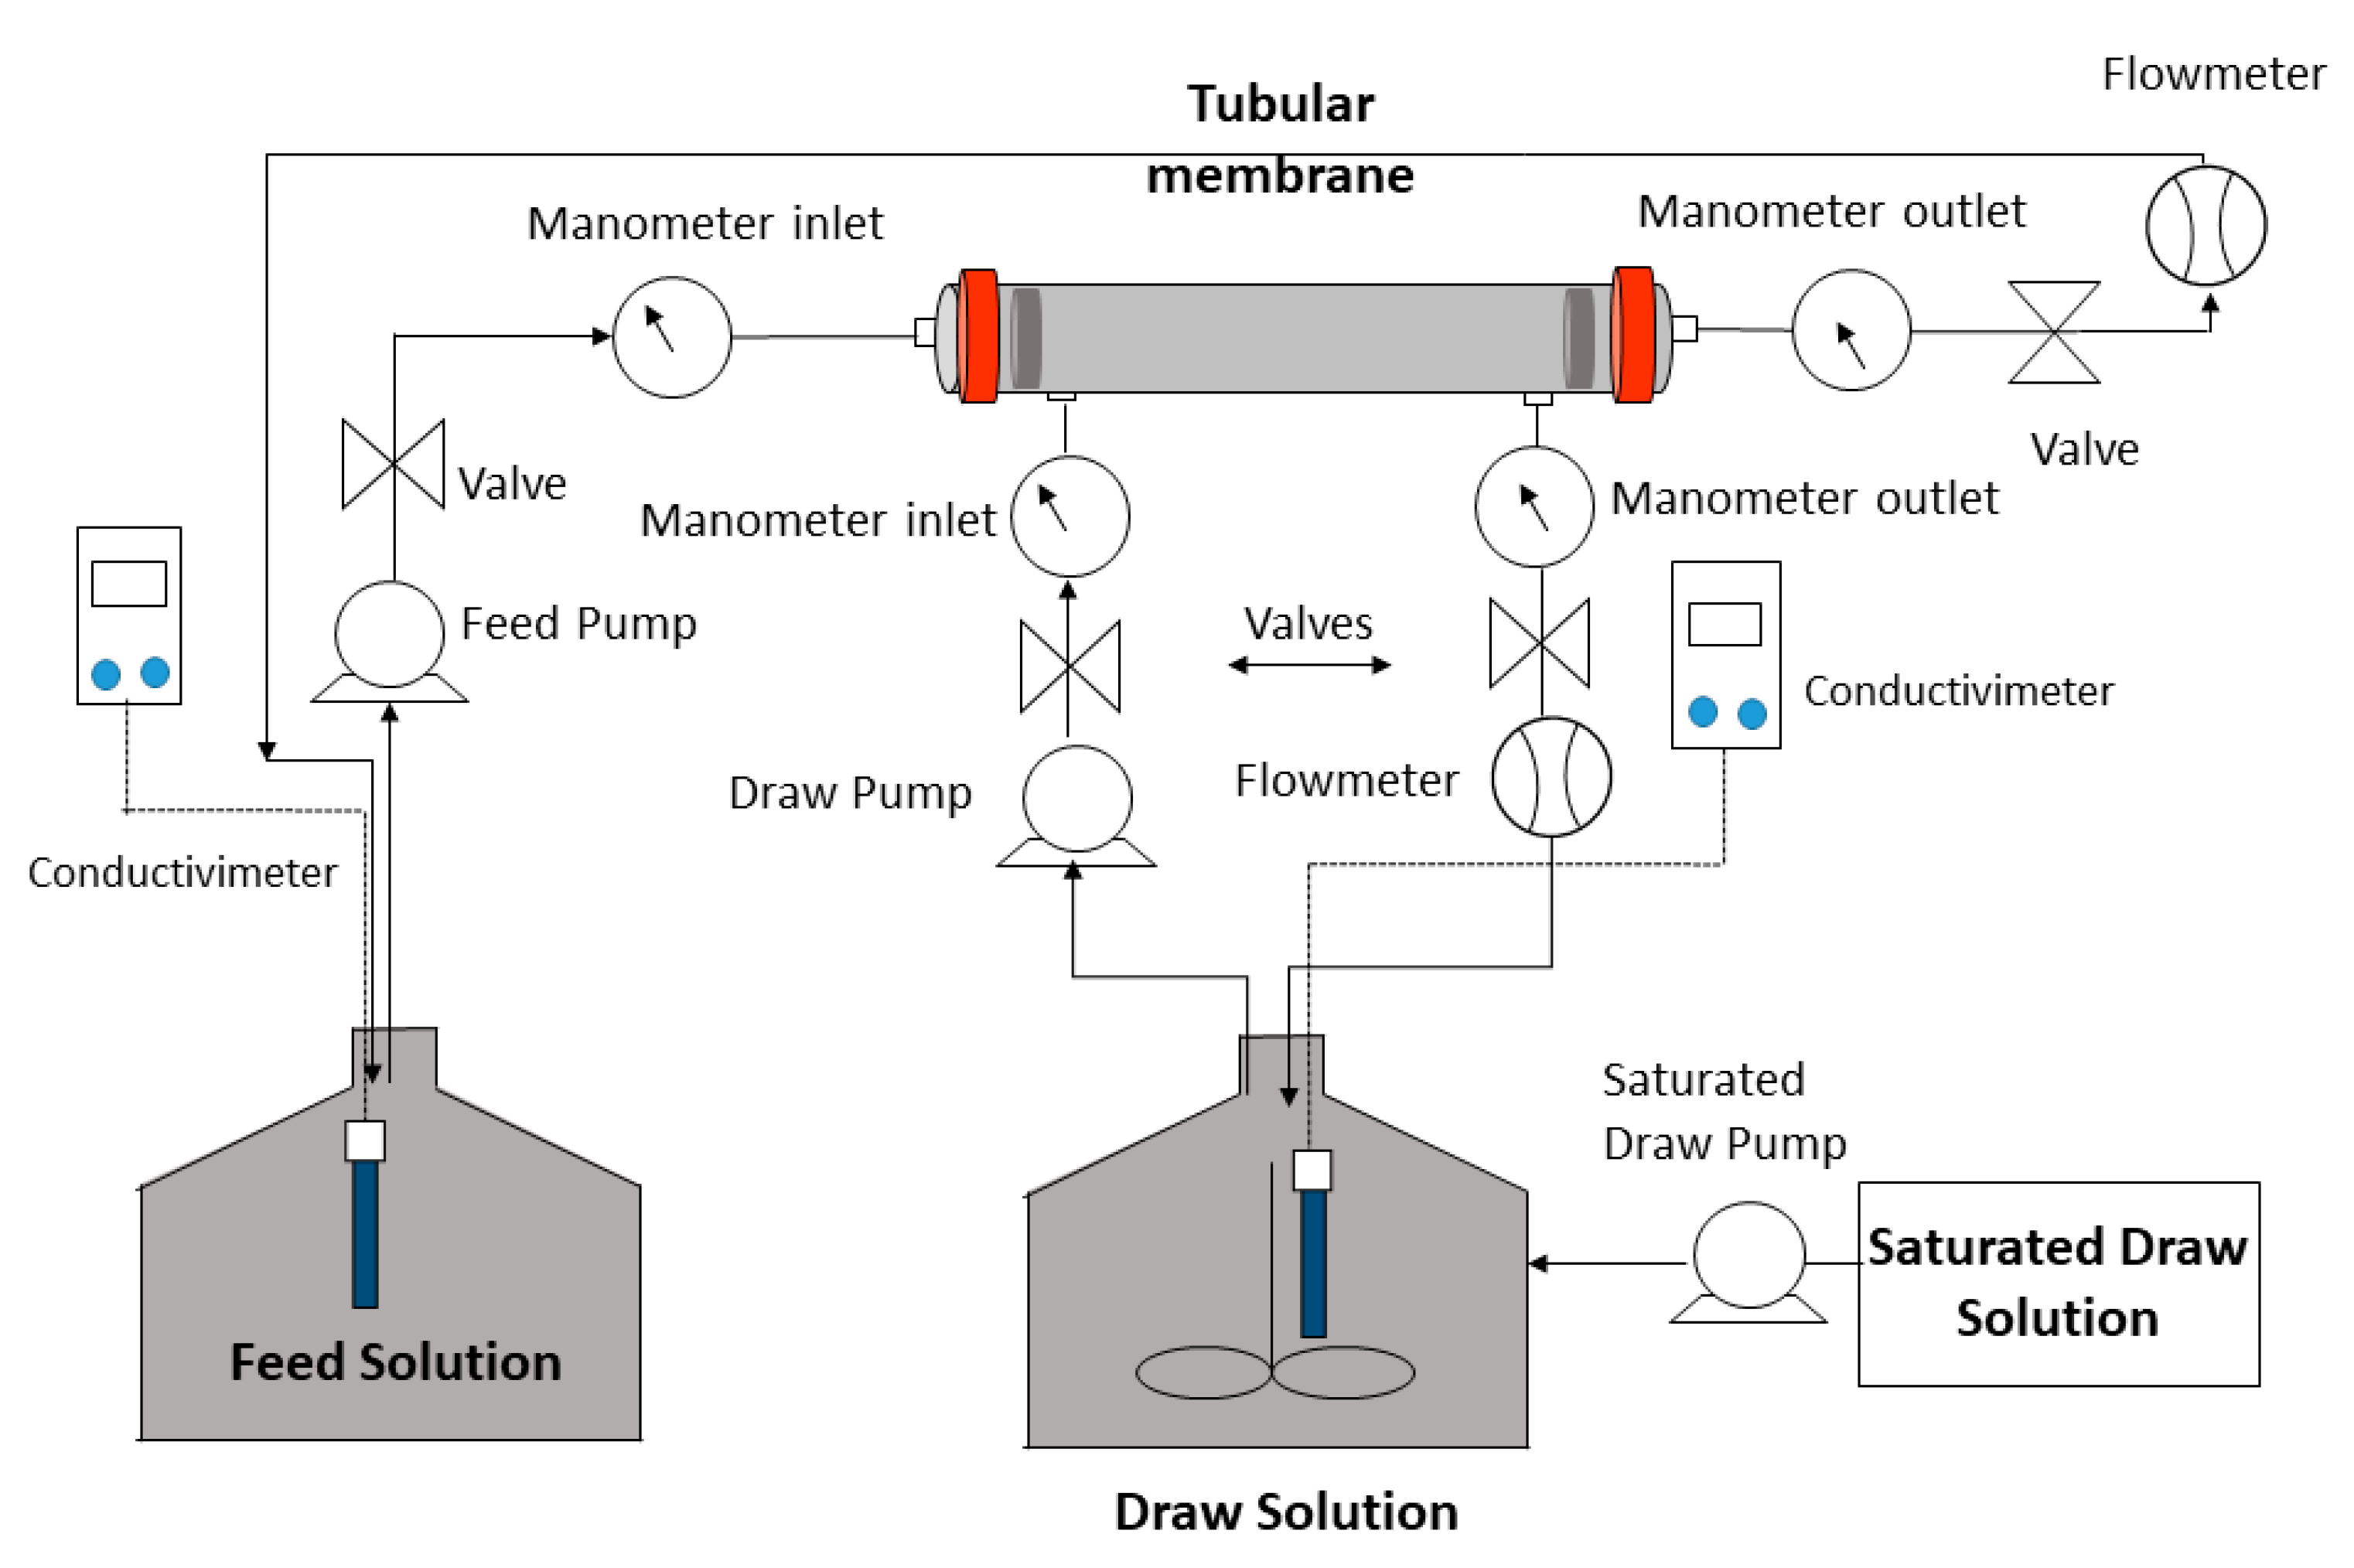
2.2. Experimental System: FO Mode and LPRO Mode
2.2.1. FO Mode
2.2.2. LPRO Mode
2.3. Membrane Characterization and Operation Conditions
2.4. Municipal Wastewater Concentration
2.4.1. Initial Membrane Permeability
2.4.2. Wastewater Stabilization in the System
2.4.3. Concentration of Wastewater
- A.
- Concentration by FO
- B.
- Concentration by LPRO
2.4.4. Membrane Washes
2.4.5. Membrane Final Permeability
2.5. Biochemical Methane Potential (BMP) Tests
2.6. Analytical Methods
3. Results
3.1. Characterization of the Membrane in FO
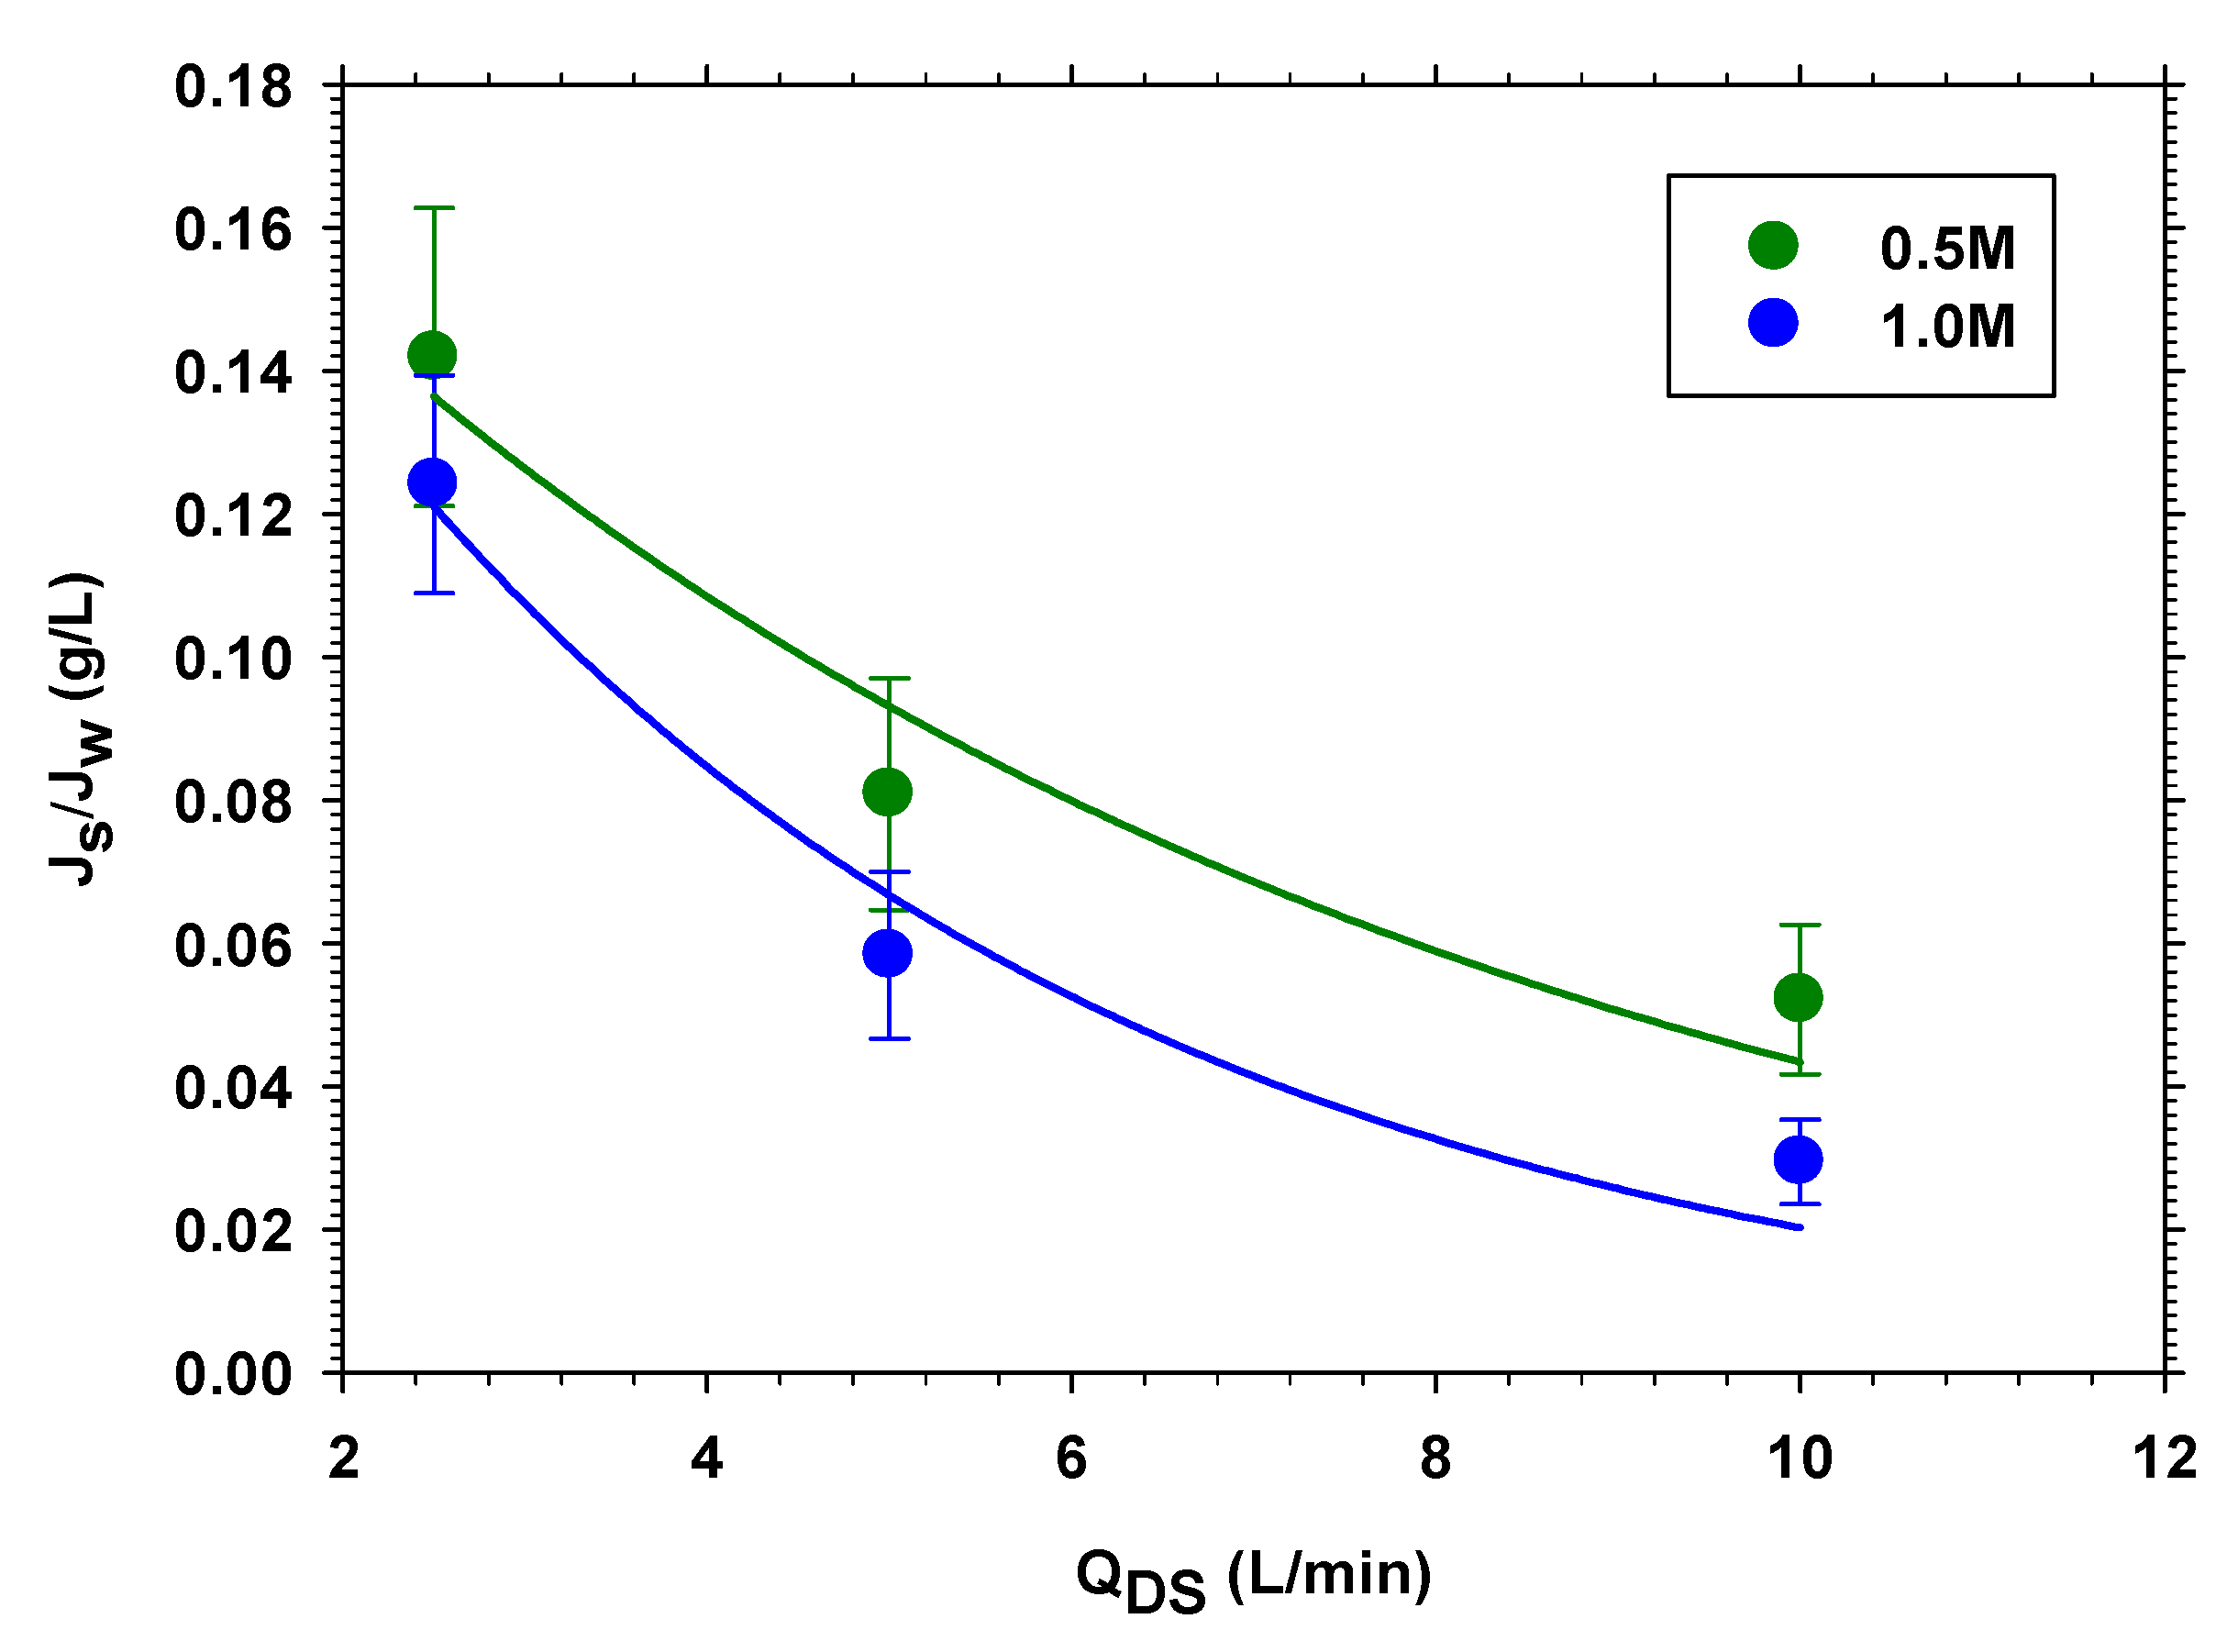
3.1.1. Different Concentration of NaCl as DS
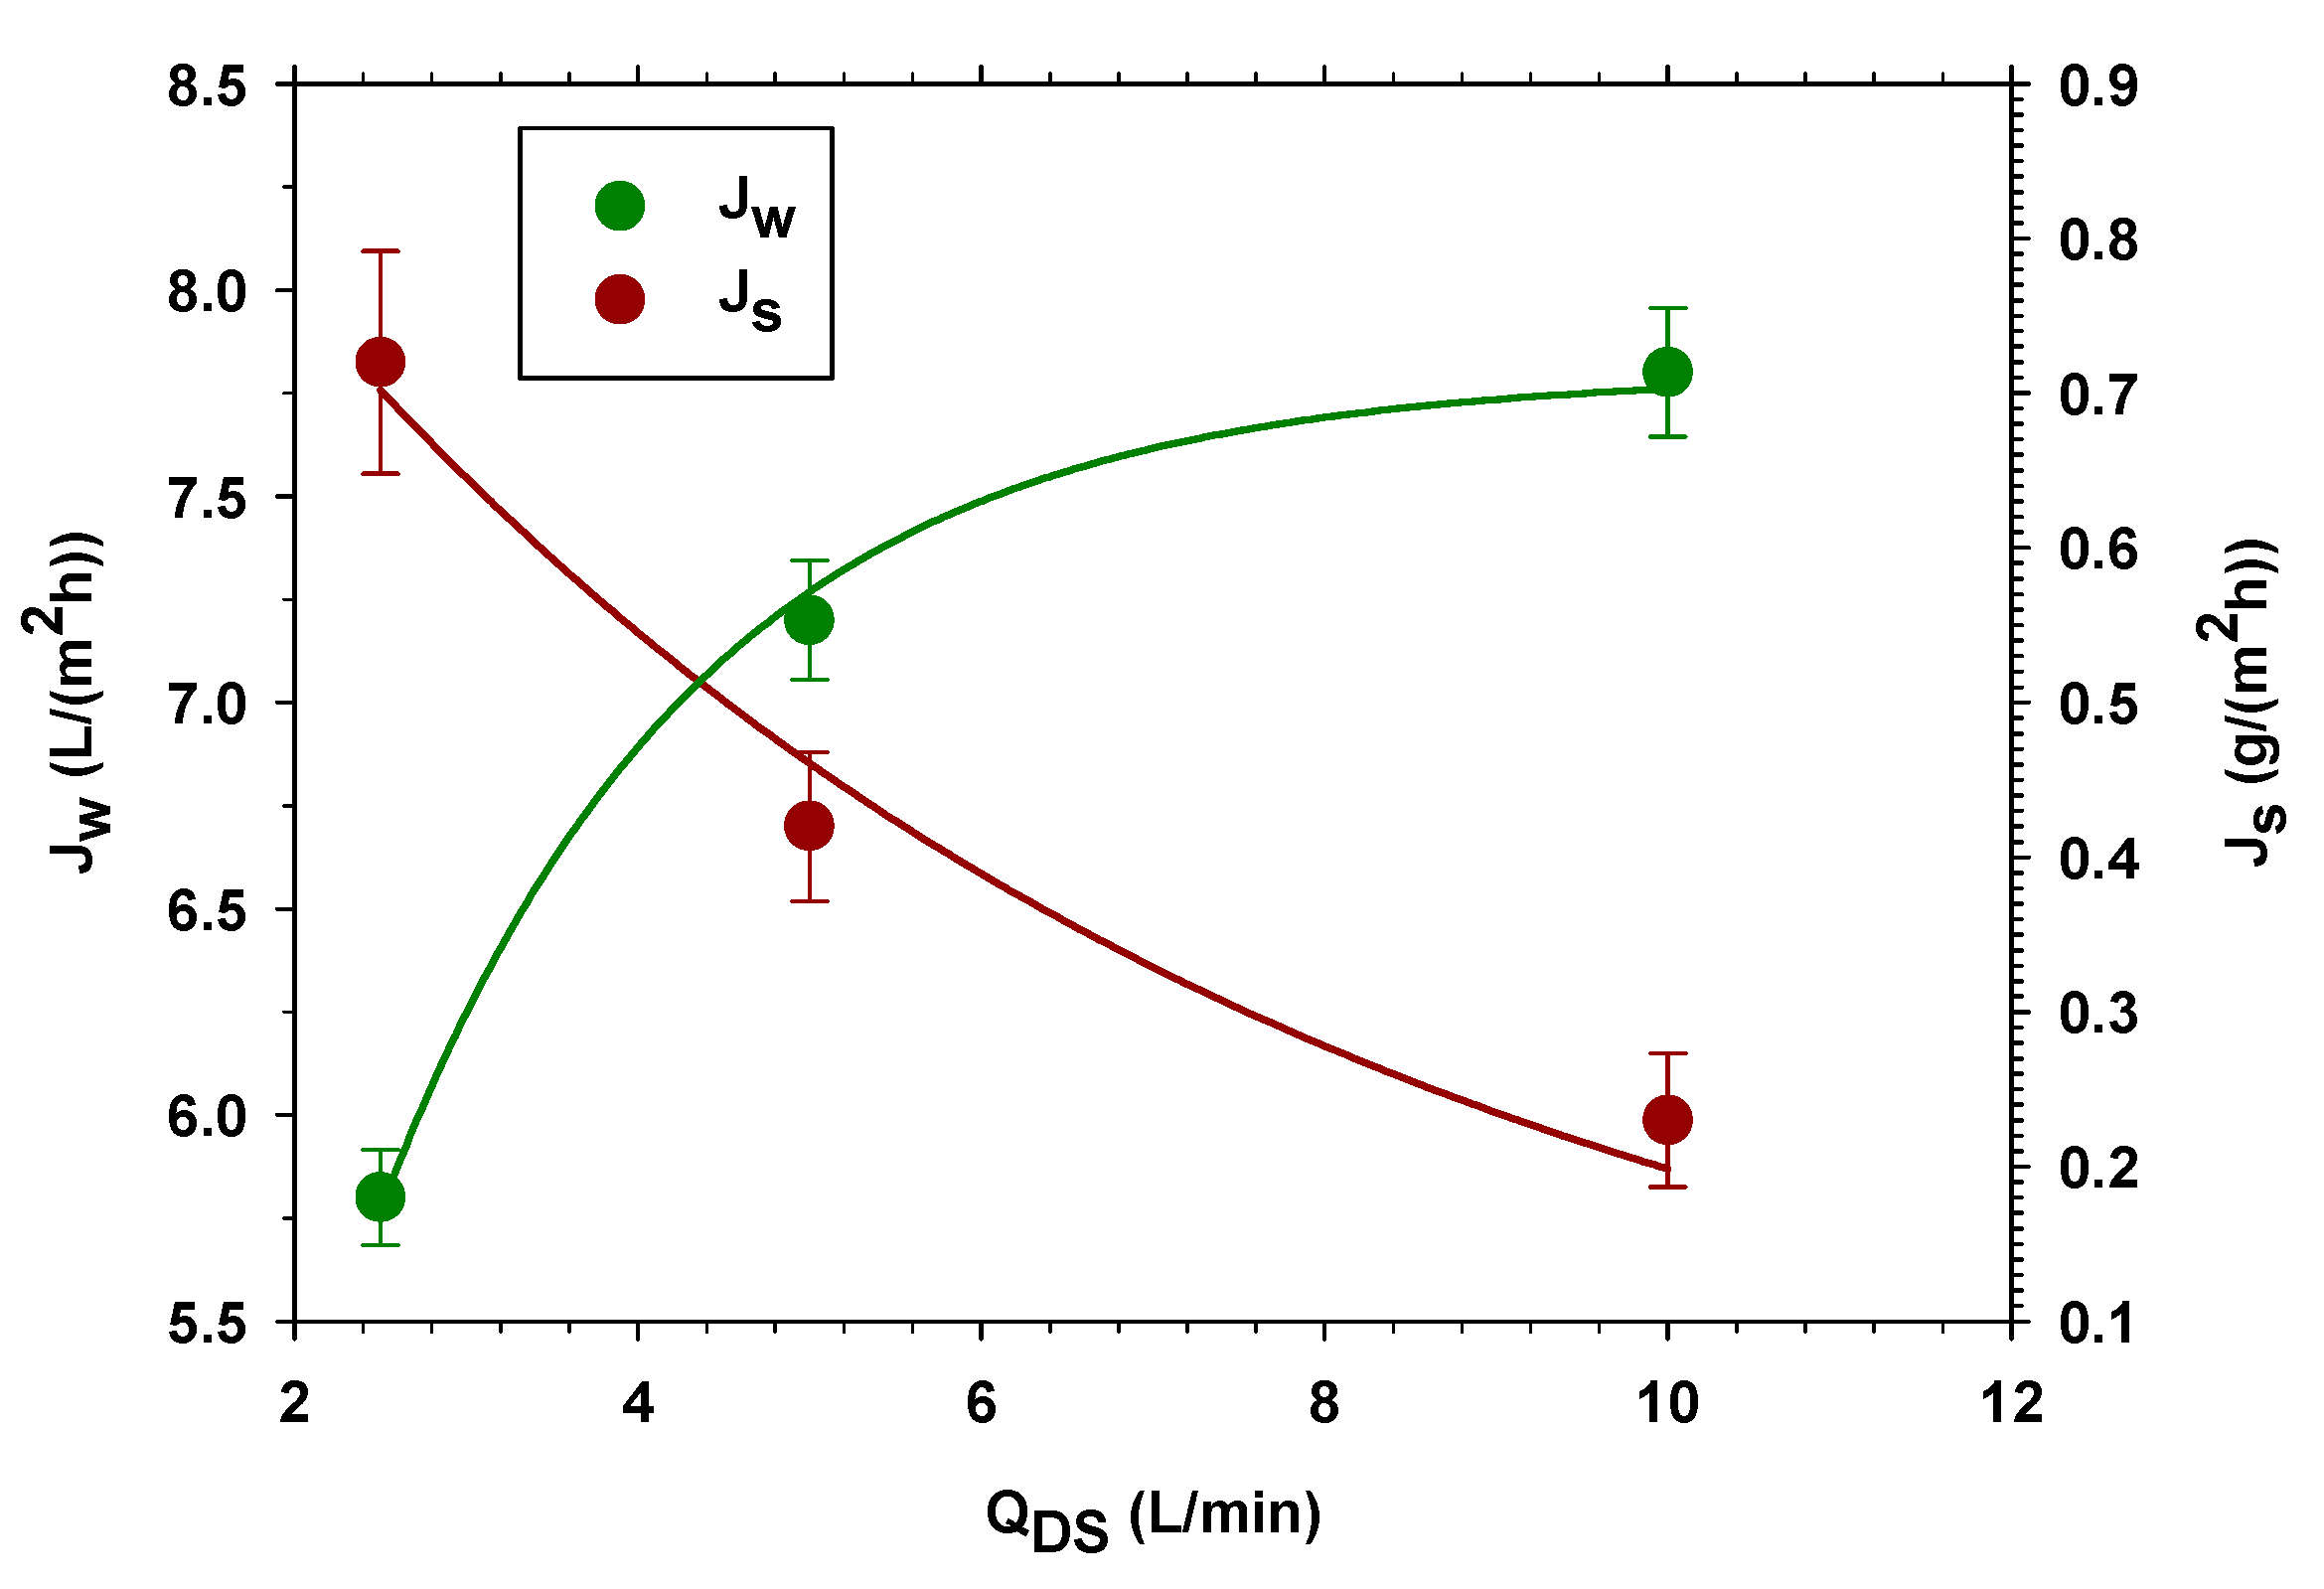
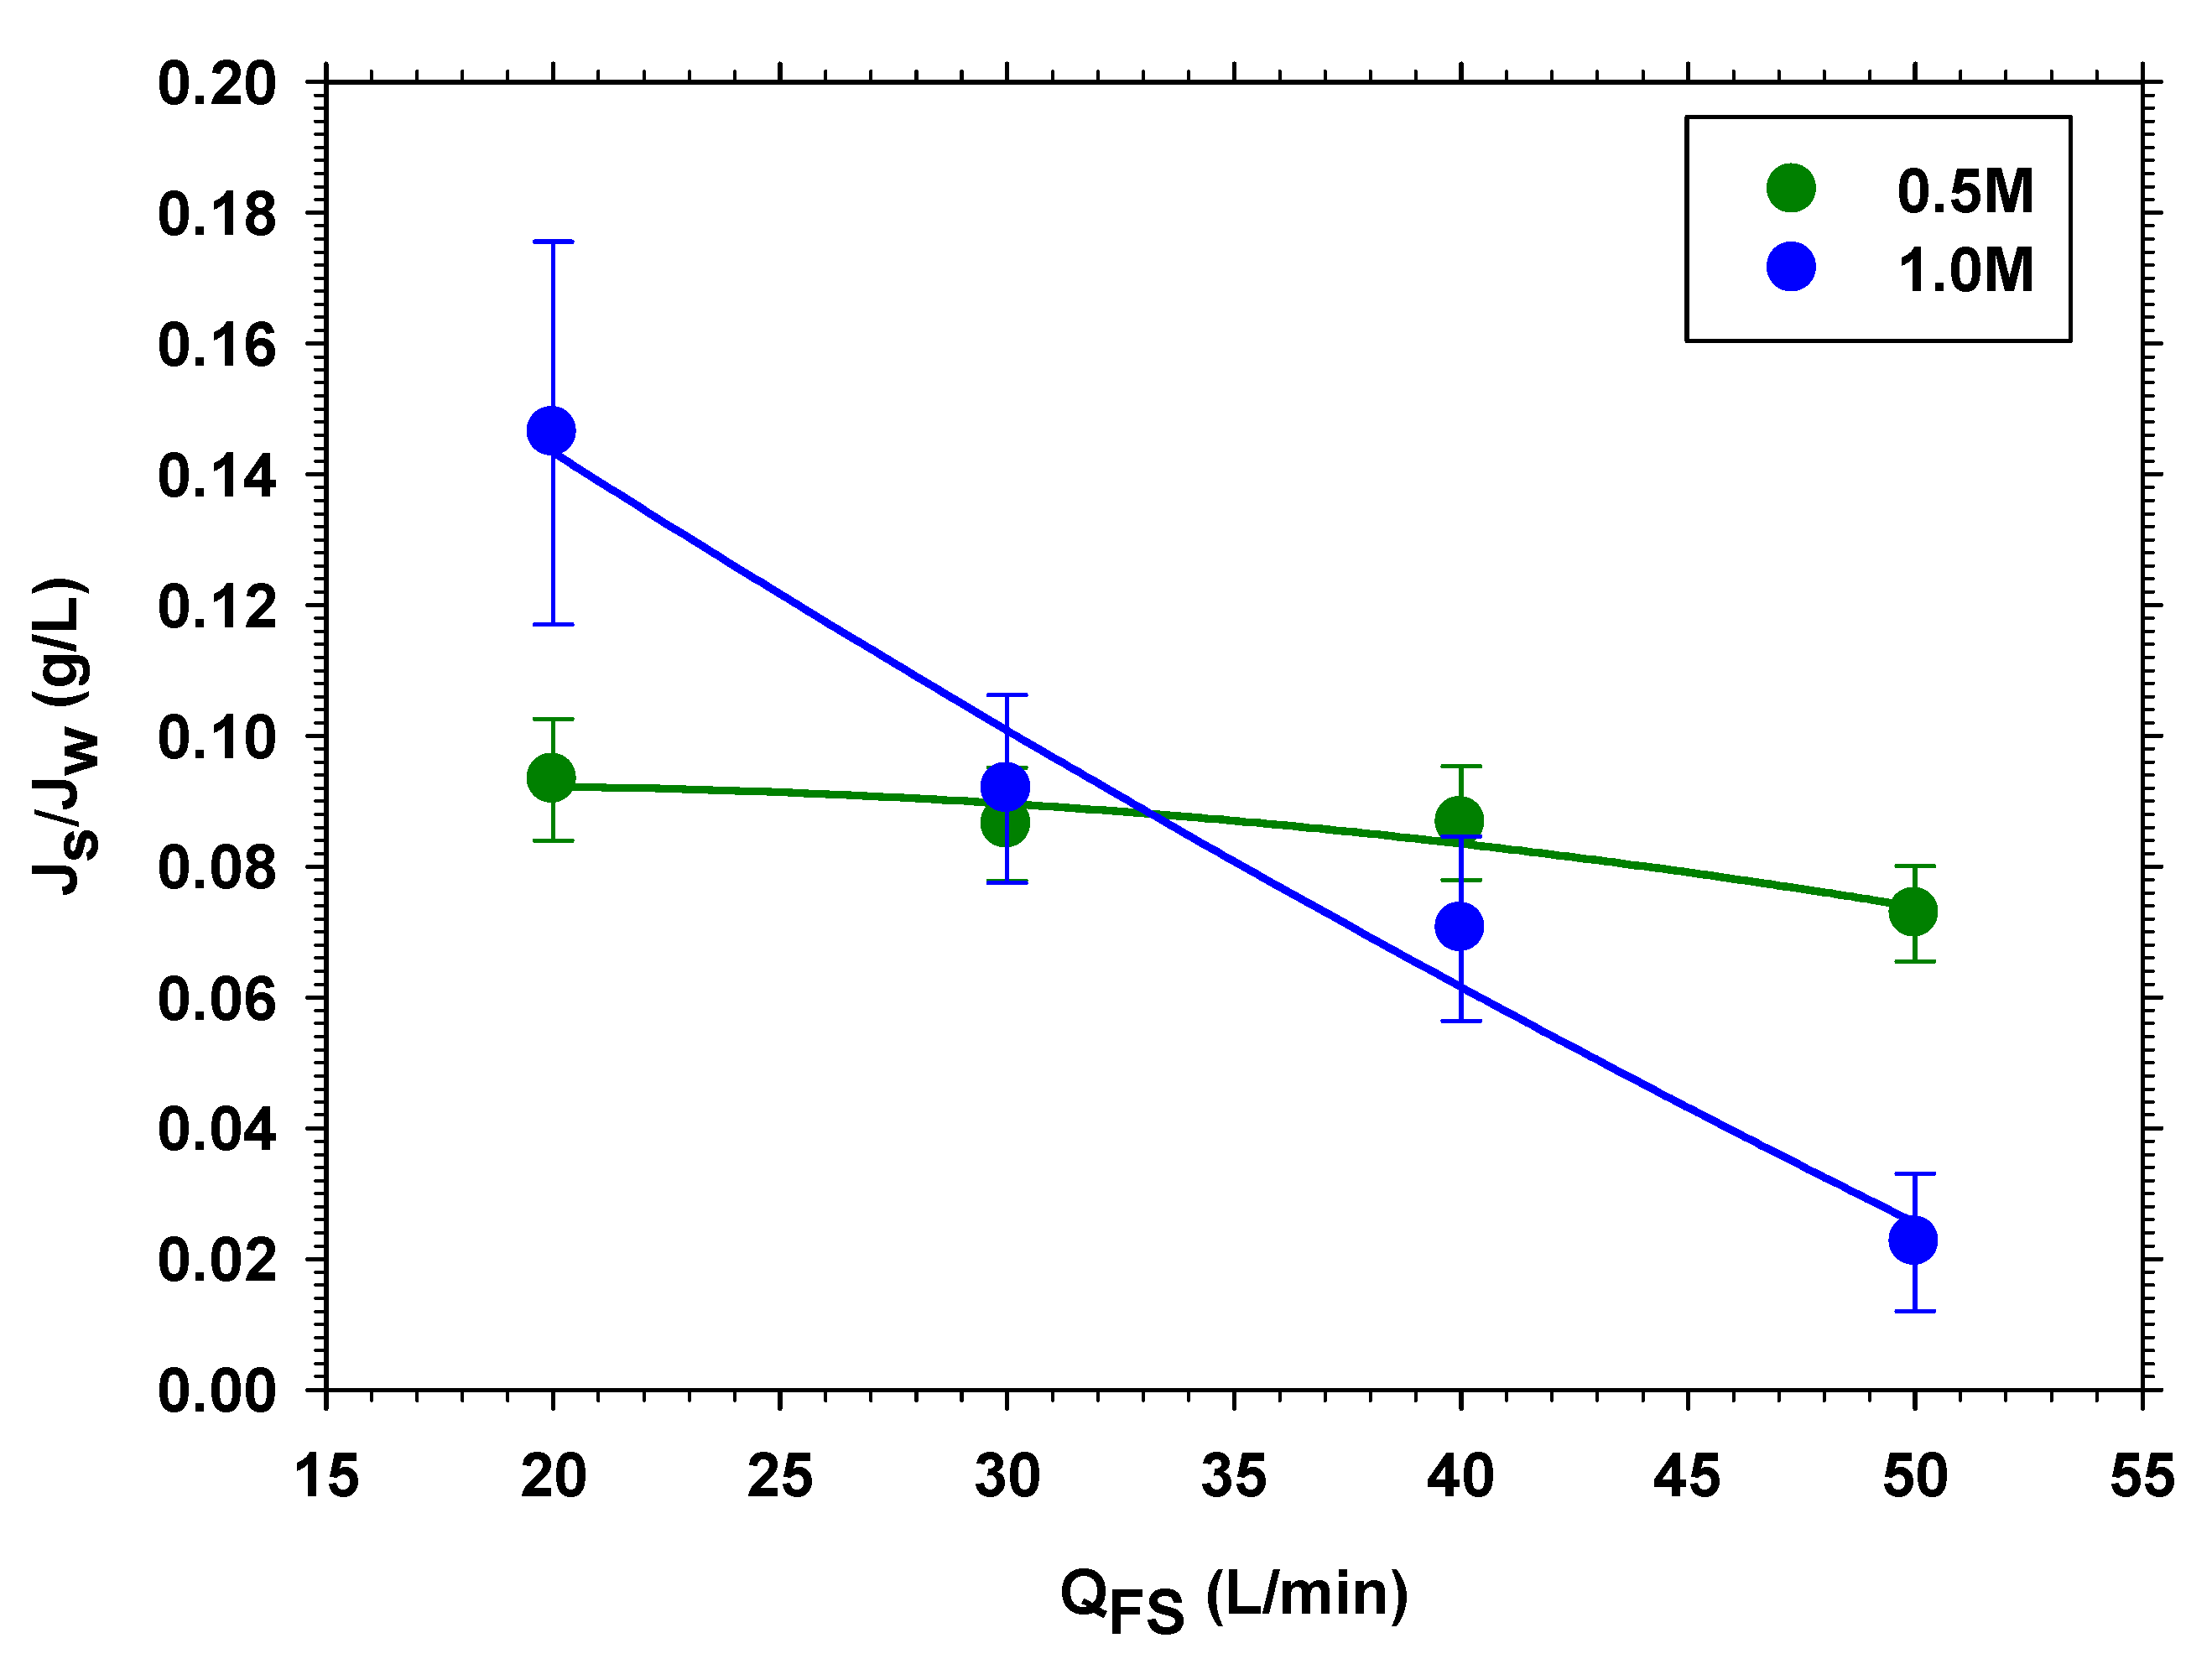
3.1.2. Different Feed and Draw Volume Flow Rates
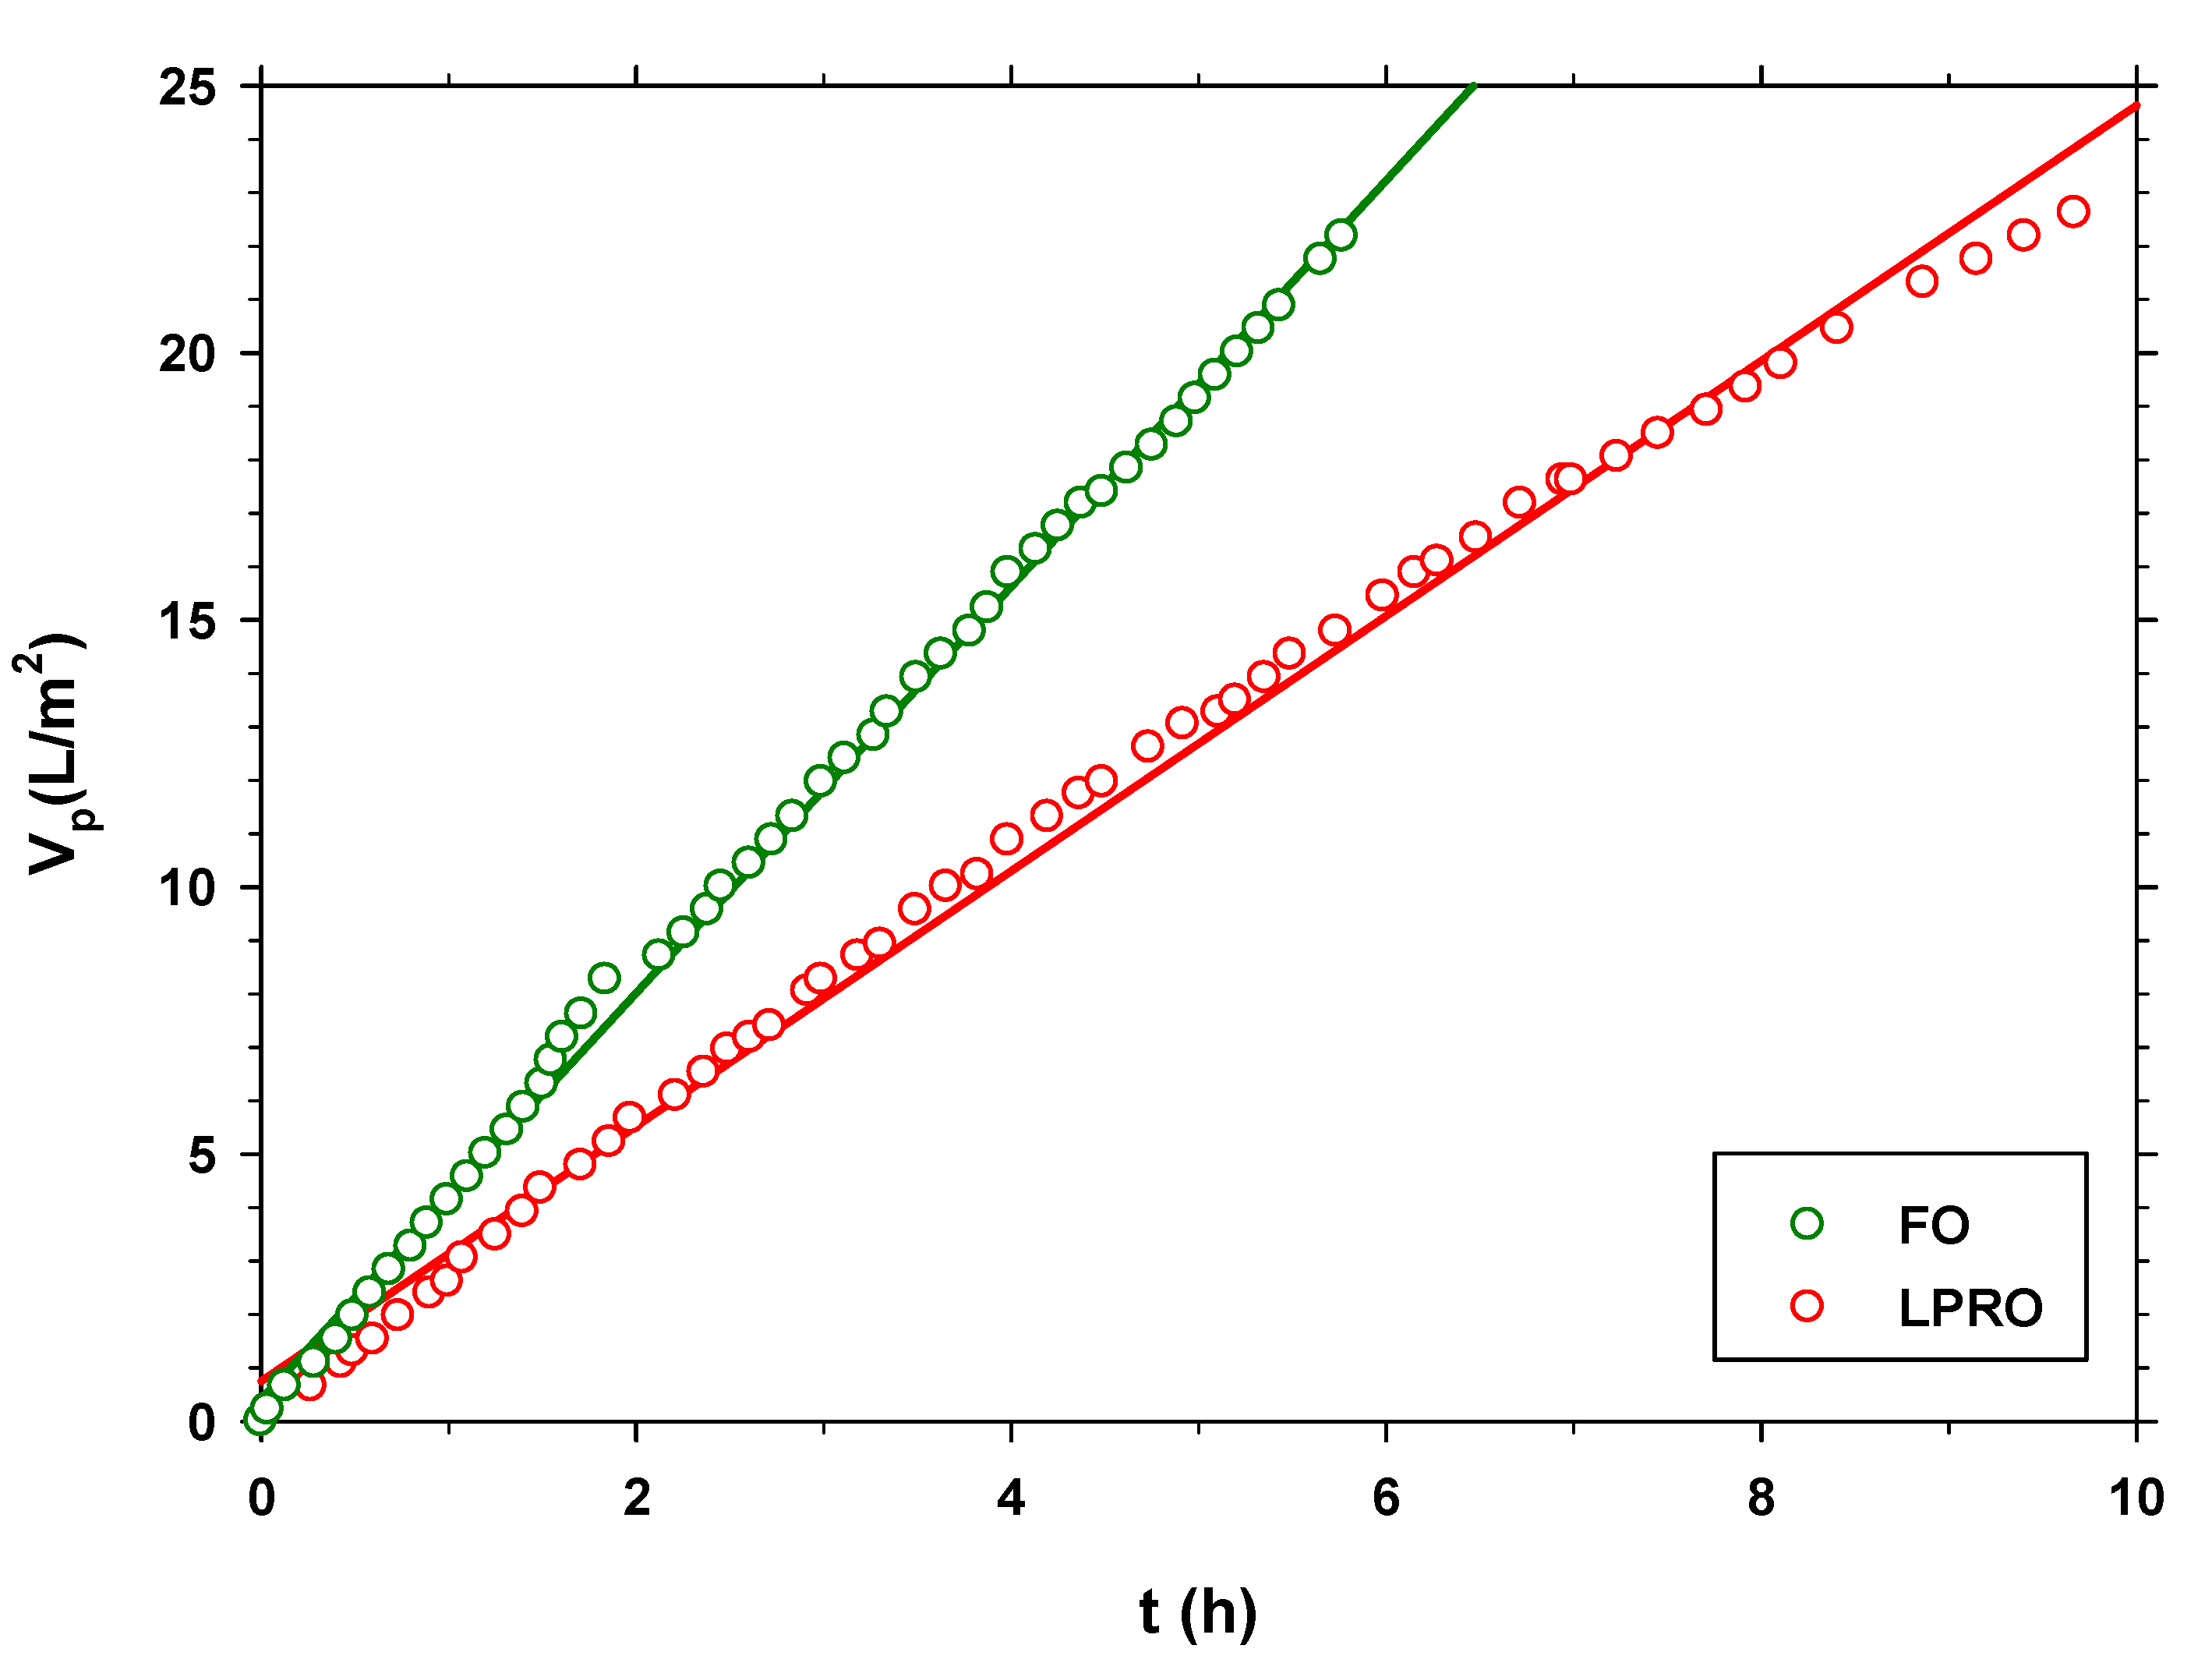
3.2. Flow Analysis in the Concentration Wastewater Processes: FO vs. LPRO
3.3. Concentration Process and Recovery
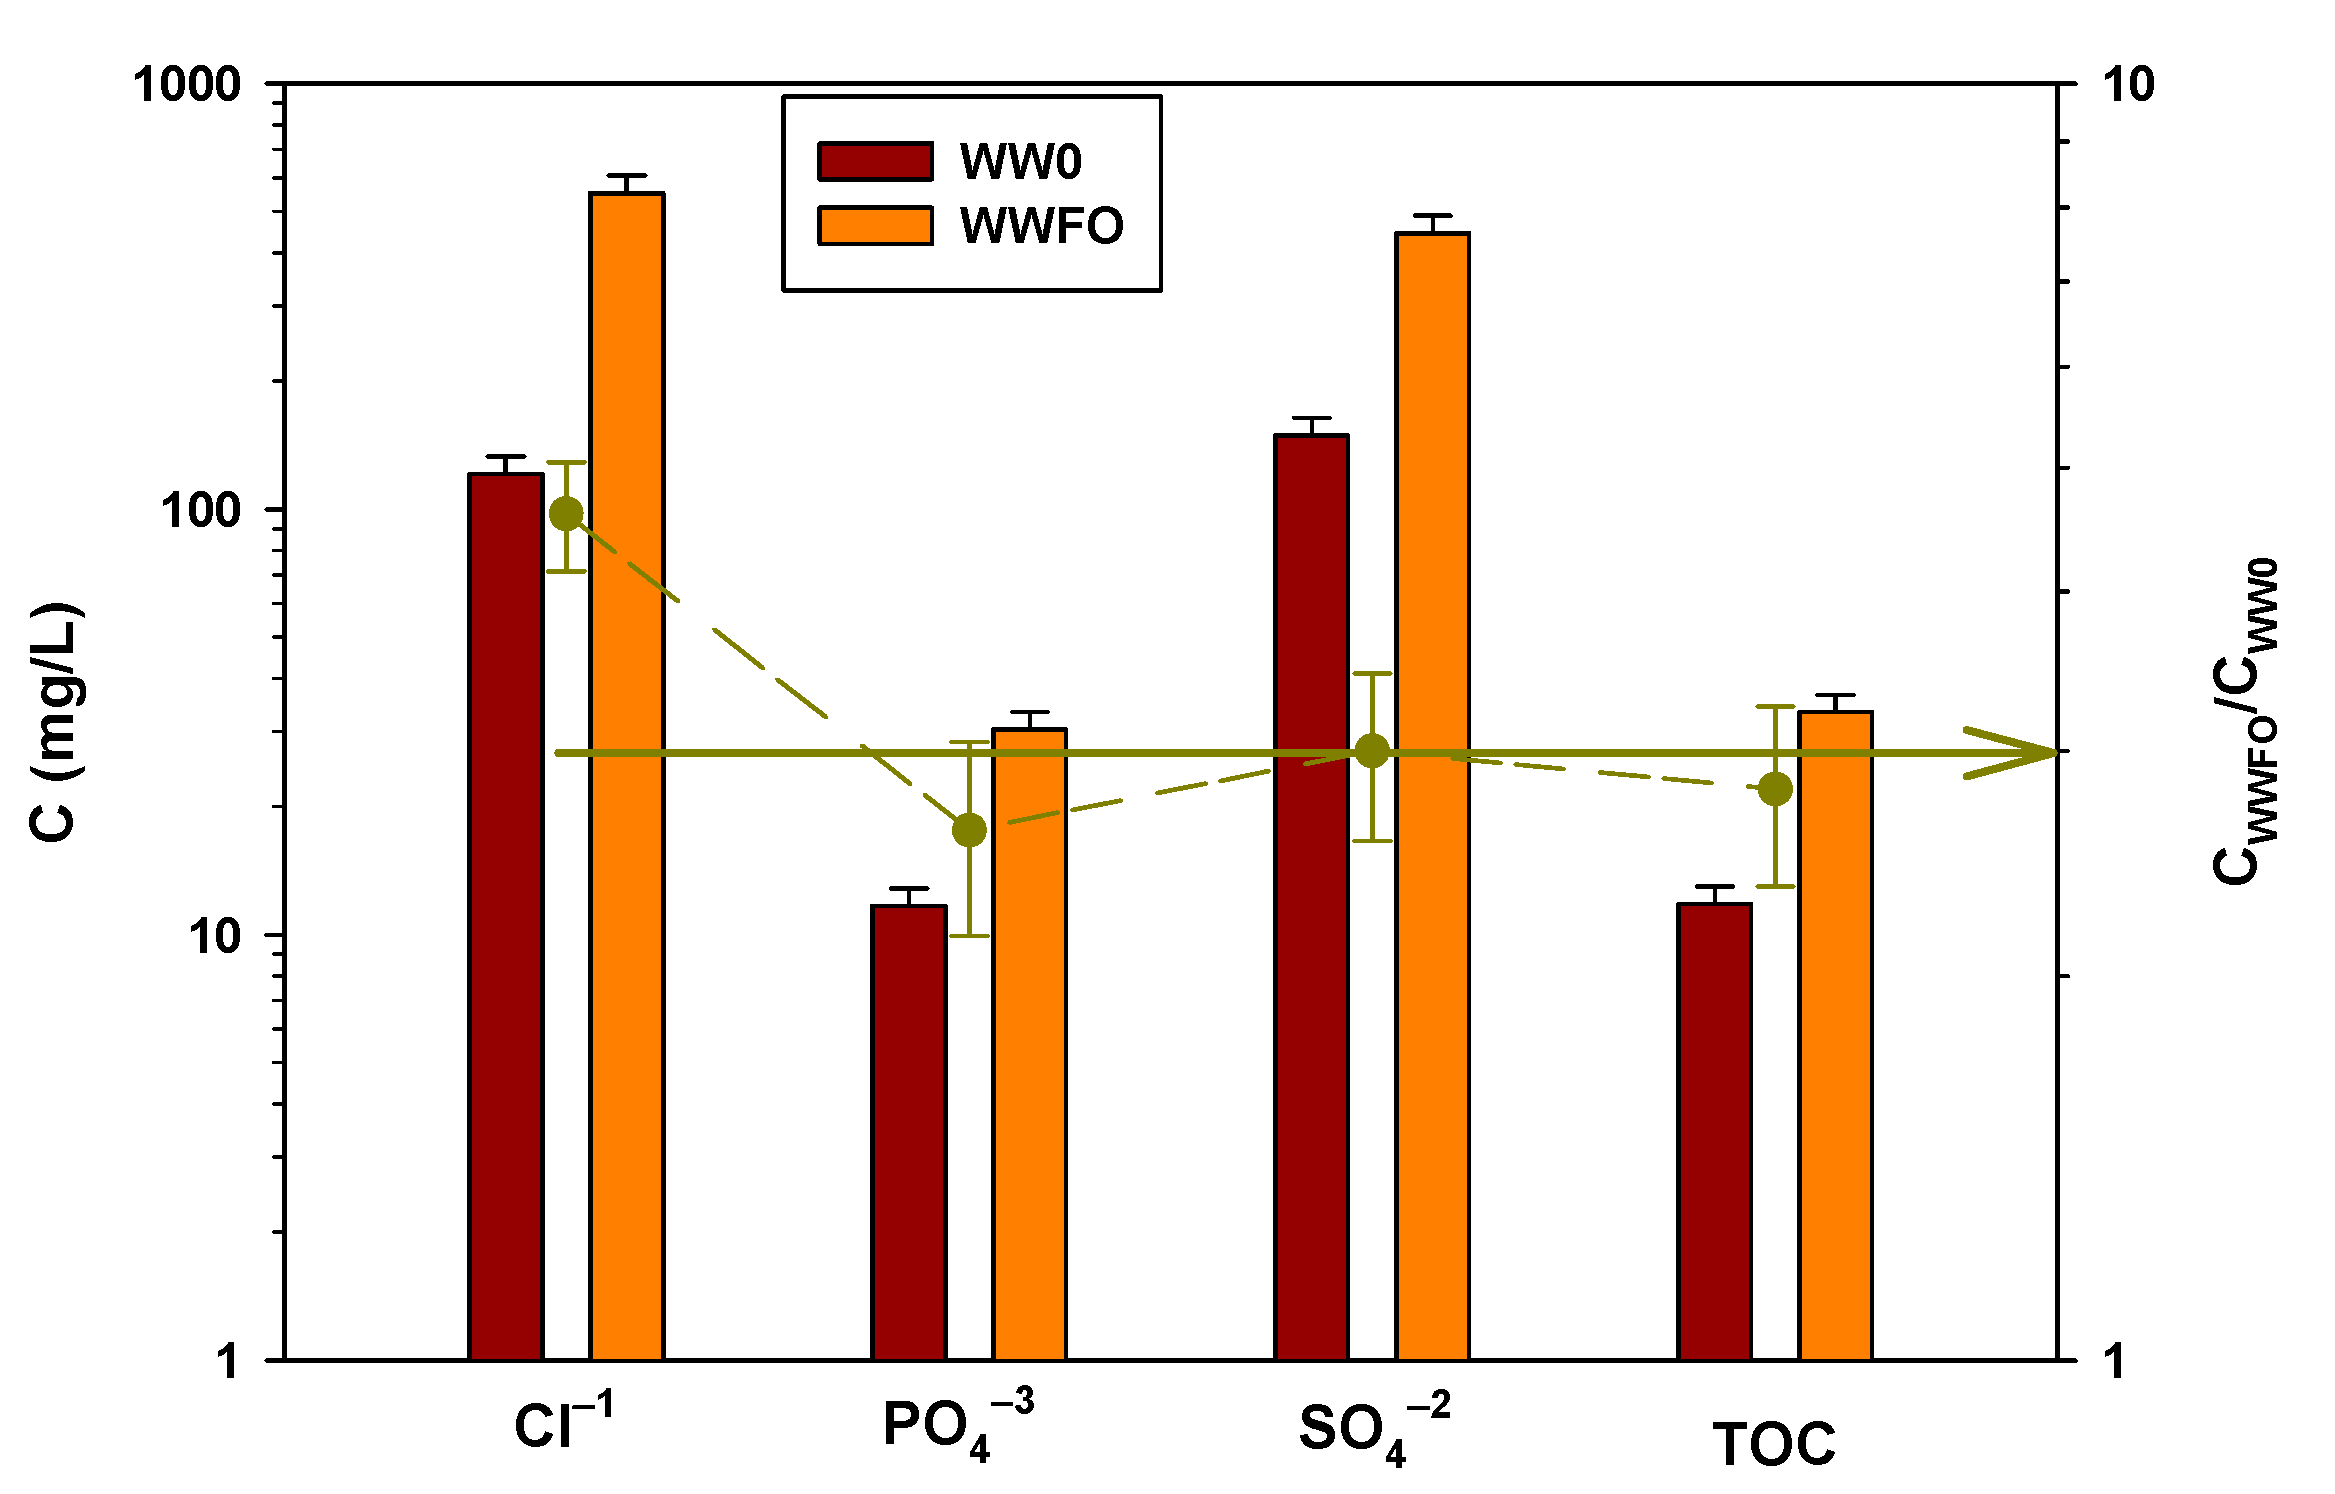
3.3.1. FO Process
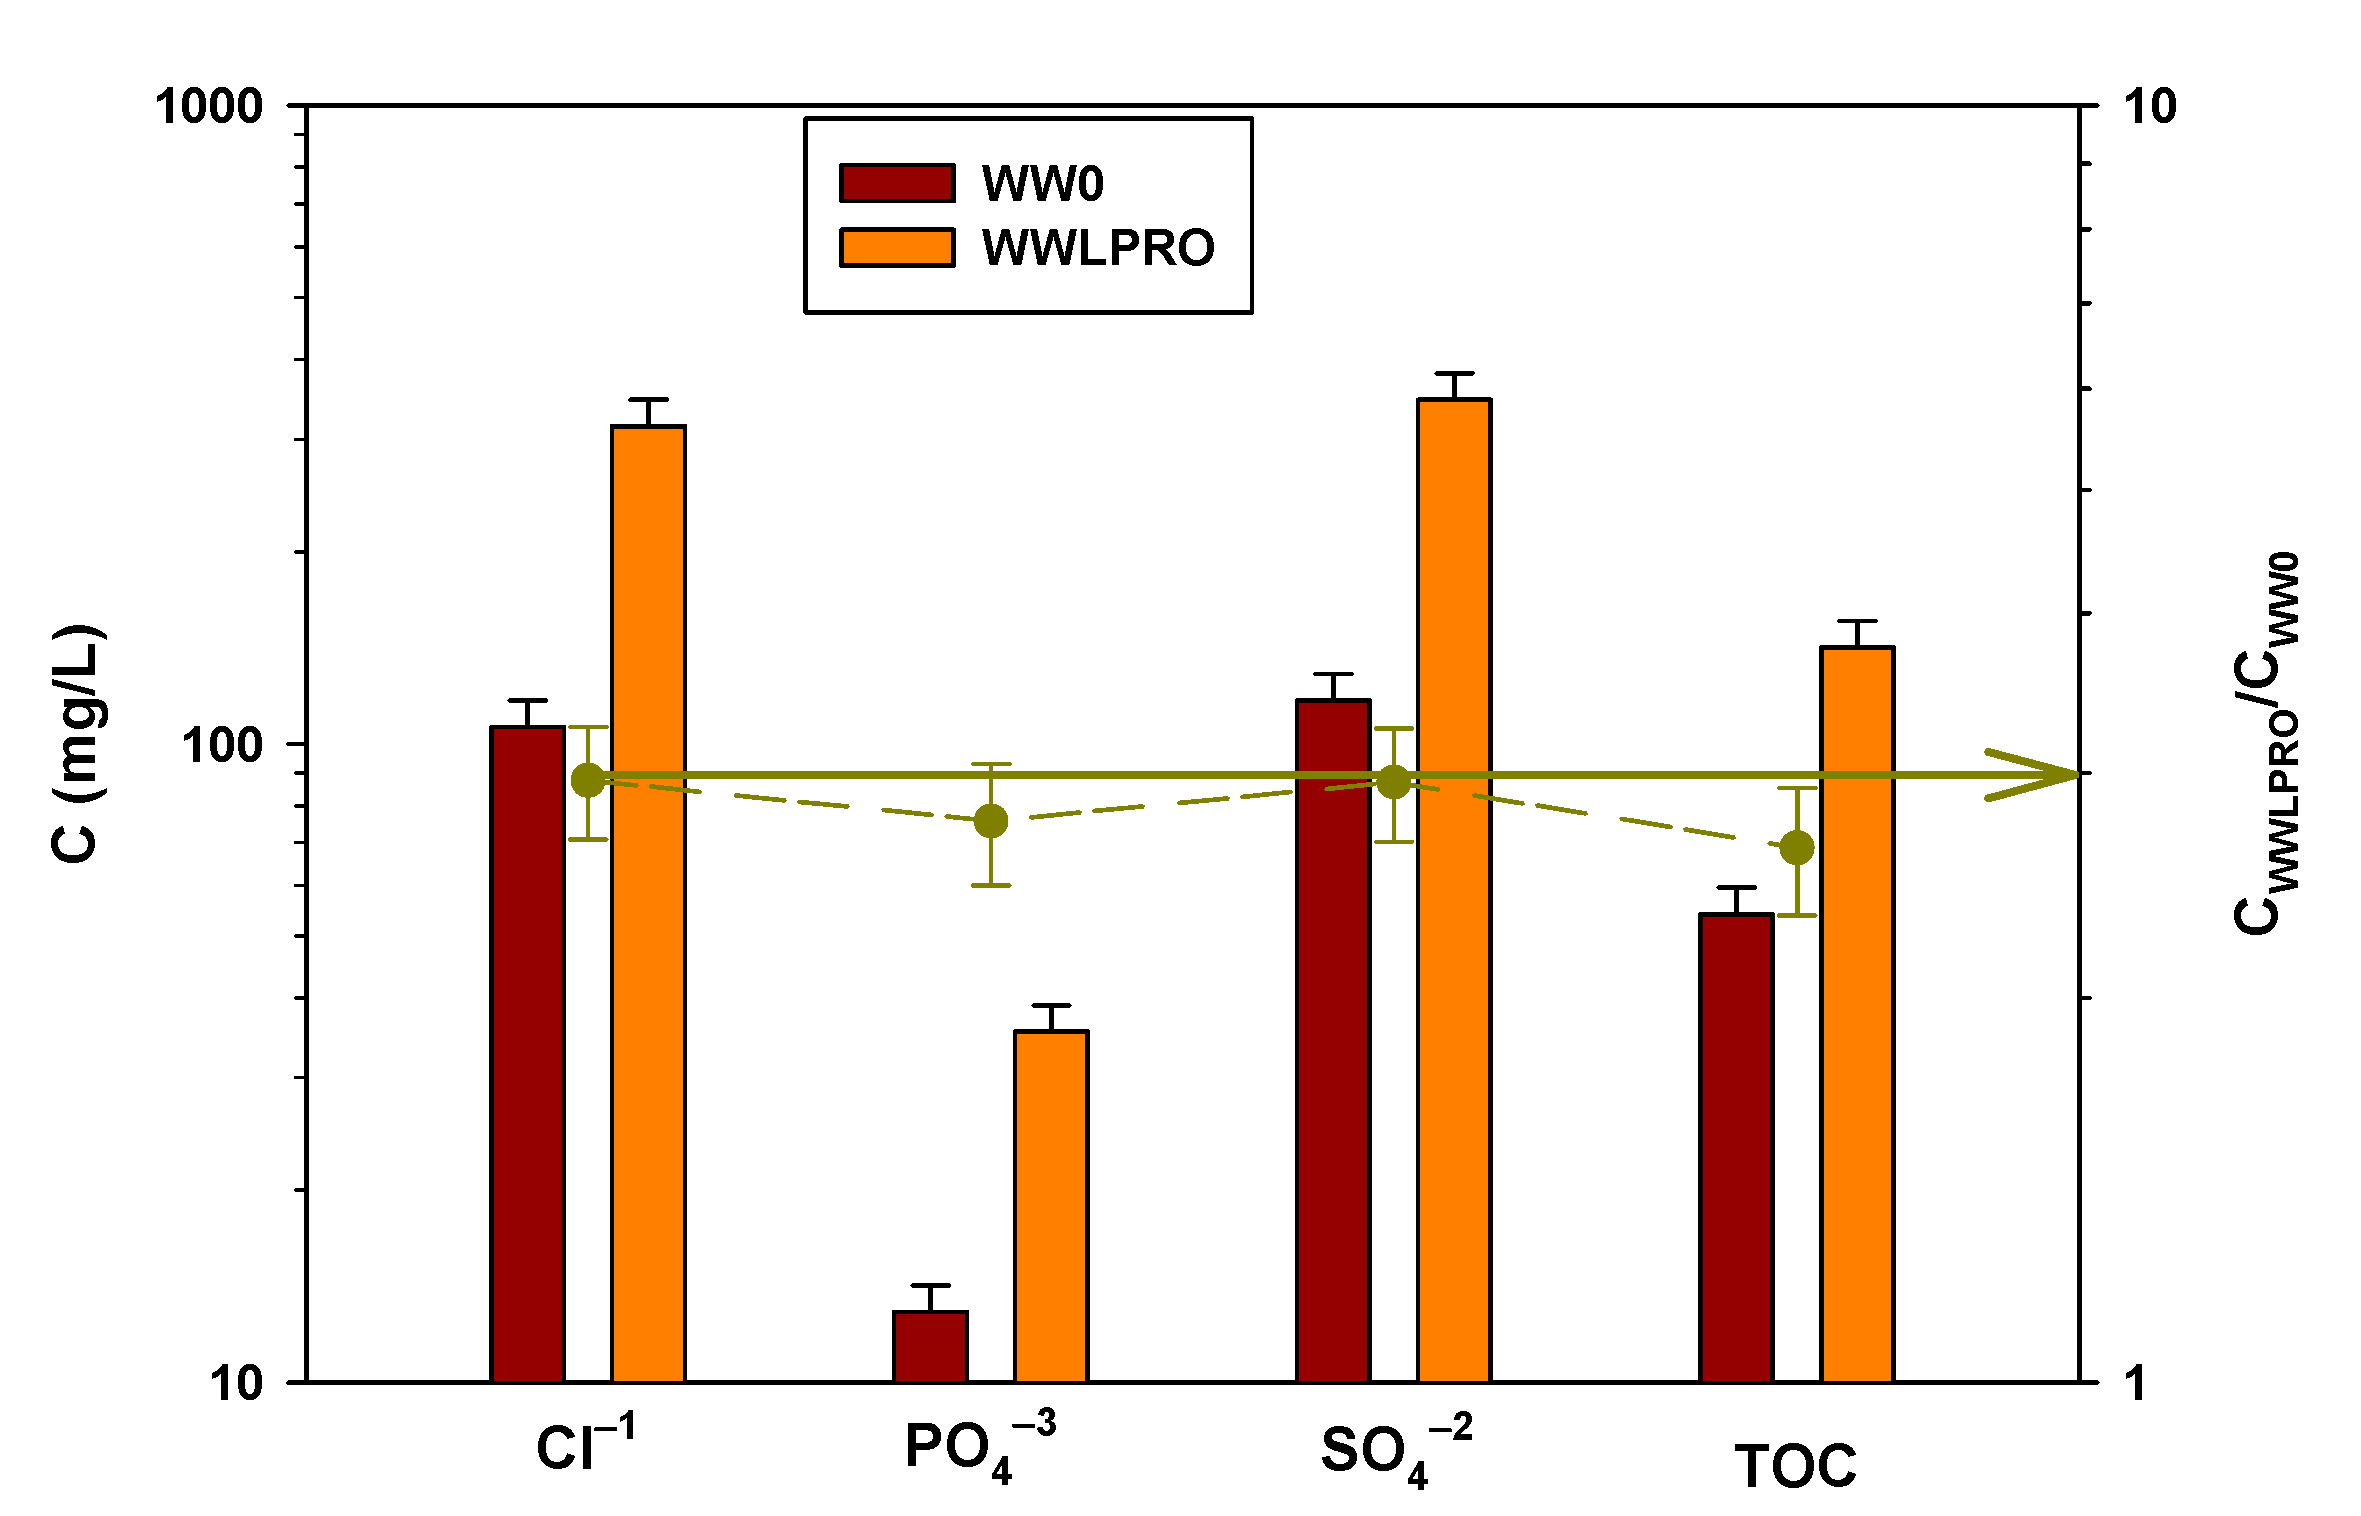
3.3.2. LPRO Process
3.4. Biogas Production
4. Conclusions
Author Contributions
Funding
Institutional Review Board Statement
Data Availability Statement
Acknowledgments
Conflicts of Interest
References
- Nascimento, T.A.; Miranda, M.P. Control Strategies for the Long-Term Operation of Direct Membrane Filtration of Municipal Wastewater. J. Environ. Chem. Eng. 2021, 9, 105335. [Google Scholar] [CrossRef]
- Ansari, A.J.; Hai, F.I.; Price, W.E.; Drewes, J.E.; Nghiem, L.D. Forward Osmosis as a Platform for Resource Recovery from Municipal Wastewater—A Critical Assessment of the Literature. J. Membr. Sci. 2017, 529, 195–206. [Google Scholar] [CrossRef] [Green Version]
- Suwaileh, W.; Pathak, N.; Shon, H.; Hilal, N. Forward Osmosis Membranes and Processes: A Comprehensive Review of Research Trends and Future Outlook. Desalination 2020, 485, 114455. [Google Scholar] [CrossRef]
- Almoalimi, K.; Liu, Y.Q. Fouling and Cleaning of Thin Film Composite Forward Osmosis Membrane Treating Municipal Wastewater for Resource Recovery. Chemosphere 2022, 288, 132507. [Google Scholar] [CrossRef] [PubMed]
- Ansari, A.J.; Hai, F.I.; Guo, W.; Ngo, H.H.; Price, W.E.; Nghiem, L.D. Factors Governing the Pre-Concentration of Wastewater Using Forward Osmosis for Subsequent Resource Recovery. Sci. Total Environ. 2016, 566–567, 559–566. [Google Scholar] [CrossRef] [PubMed]
- Blandin, G.; Ferrari, F.; Lesage, G.; Le-Clech, P.; Héran, M.; Martinez-Lladó, X. Forward Osmosis as Concentration Process: Review of Opportunities and Challenges. Membranes 2020, 10, 284. [Google Scholar] [CrossRef]
- Gao, Y.; Fang, Z.; Liang, P.; Huang, X. Direct Concentration of Municipal Sewage by Forward Osmosis and Membrane Fouling Behavior. Bioresour. Technol. 2018, 247, 730–735. [Google Scholar] [CrossRef]
- Yuan, H.; Abu-Reesh, I.M.; He, Z. Enhancing Desalination and Wastewater Treatment by Coupling Microbial Desalination Cells with Forward Osmosis. Chem. Eng. J. 2015, 270, 437–443. [Google Scholar] [CrossRef]
- Zhao, S.; Zou, L.; Tang, C.Y.; Mulcahy, D. Recent Developments in Forward Osmosis: Opportunities and Challenges. J. Membr. Sci. 2012, 396, 1–21. [Google Scholar] [CrossRef]
- Sanahuja-Embuena, V.; Frauholz, J.; Oruc, T.; Trzaskus, K.; Hélix-Nielsen, C. Transport Mechanisms behind Enhanced Solute Rejection in Forward Osmosis Compared to Reverse Osmosis Mode. J. Membr. Sci. 2021, 636, 119561. [Google Scholar] [CrossRef]
- Ezugbe, E.O.; Tetteh, E.K.; Rathilal, S.; Asante-Sackey, D.; Amo-Duodu, G. Desalination of Municipal Wastewater Using Forward Osmosis. Membranes 2021, 11, 119. [Google Scholar] [CrossRef] [PubMed]
- Hernández-Sánchez, J.C.; Boluda-Botella, N.; Sánchez-Lizaso, J.L. The Role of Desalination in Water Management in Southeast Spain. Desalination Water Treat. 2017, 76, 71–76. [Google Scholar] [CrossRef] [Green Version]
- Al-Kaabi, A.; Al-Sulaiti, H.; Al-Ansari, T.; Mackey, H.R. Assessment of Water Quality Variations on Pretreatment and Environmental Impacts of SWRO Desalination. Desalination 2021, 500, 114831. [Google Scholar] [CrossRef]
- Park, H.G.; Kwon, Y.N. Long-Term Stability of Low-Pressure Reverse Osmosis (RO) Membrane Operation—A Pilot Scale Study. Water 2018, 10, 93. [Google Scholar] [CrossRef] [Green Version]
- Lim, Y.J.; Ma, Y.; Chew, J.W.; Wang, R. Assessing the Potential of Highly Permeable Reverse Osmosis Membranes for Desalination: Specific Energy and Footprint Analysis. Desalination 2022, 533, 115771. [Google Scholar] [CrossRef]
- Valladares Linares, R.; Li, Z.; Yangali-Quintanilla, V.; Ghaffour, N.; Amy, G.; Leiknes, T.; Vrouwenvelder, J.S. Life Cycle Cost of a Hybrid Forward Osmosis—Low Pressure Reverse Osmosis System for Seawater Desalination and Wastewater Recovery. Water Res. 2016, 88, 225–234. [Google Scholar] [CrossRef] [PubMed] [Green Version]
- Hey, T.; Zarebska, A.; Bajraktari, N.; Vogel, J.; Hélix-Nielsen, C.; Jansen, J.C.; Jönsson, K. Influences of Mechanical Pretreatment on the Non-Biological Treatment of Municipal Wastewater by Forward Osmosis. Environ. Technol. 2017, 38, 2295–2304. [Google Scholar] [CrossRef] [Green Version]
- Minier-Matar, J.; Al-Maas, M.; Hussain, A.; Nasser, M.S.; Adham, S. Pilot-Scale Evaluation of Forward Osmosis Membranes for Volume Reduction of Industrial Wastewater. Desalination 2022, 531, 115689. [Google Scholar] [CrossRef]
- Schneider, C.; Rajmohan, R.S.; Zarebska, A.; Tsapekos, P.; Hélix-Nielsen, C. Treating Anaerobic Effluents Using Forward Osmosis for Combined Water Purification and Biogas Production. Sci. Total Environ. 2019, 647, 1021–1030. [Google Scholar] [CrossRef]
- Ansari, A.J.; Hai, F.I.; Price, W.E.; Ngo, H.H.; Guo, W.; Nghiem, L.D. Assessing the Integration of Forward Osmosis and Anaerobic Digestion for Simultaneous Wastewater Treatment and Resource Recovery. Bioresour. Technol. 2018, 260, 221–226. [Google Scholar] [CrossRef]
- Ferrari, F.; Pijuan, M.; Rodriguez-Roda, I.; Blandin, G. Exploring Submerged Forward Osmosis for Water Recovery and Pre-Concentration of Wastewater before Anaerobic Digestion: A Pilot Scale Study. Membranes 2019, 9, 97. [Google Scholar] [CrossRef] [PubMed] [Green Version]
- Gao, Y.; Fang, Z.; Liang, P.; Zhang, X.; Qiu, Y.; Kimura, K.; Huang, X. Anaerobic Digestion Performance of Concentrated Municipal Sewage by Forward Osmosis Membrane: Focus on the Impact of Salt and Ammonia Nitrogen. Bioresour. Technol. 2019, 276, 204–210. [Google Scholar] [CrossRef] [PubMed]
- Hey, T.; Bajraktari, N.; Davidsson, Å.; Vogel, J.; Madsen, H.T.; Hélix-Nielsen, C.; Jansen, J.C.; Jönsson, K. Evaluation of Direct Membrane Filtration and Direct Forward Osmosis as Concepts for Compact and Energy-Positive Municipal Wastewater Treatment. Environ. Technol. 2018, 39, 264–276. [Google Scholar] [CrossRef] [PubMed]
- Lutchmiah, K.; Cornelissen, E.R.; Harmsen, D.J.H.; Post, J.W.; Lampi, K.; Ramaekers, H.; Rietveld, L.C.; Roest, K. Water Recovery from Sewage Using Forward Osmosis. Water Sci. Technol. 2011, 64, 1443–1449. [Google Scholar] [CrossRef] [PubMed]
- Ortega-Bravo, J.C.; Ruiz-Filippi, G.; Donoso-Bravo, A.; Reyes-Caniupán, I.E.; Jeison, D. Forward Osmosis: Evaluation Thin-Film-Composite Membrane for Municipal Sewage Concentration. Chem. Eng. J. 2016, 306, 531–537. [Google Scholar] [CrossRef]
- Sun, Y.; Tian, J.; Zhao, Z.; Shi, W.; Liu, D.; Cui, F. Membrane Fouling of Forward Osmosis (FO) Membrane for Municipal Wastewater Treatment: A Comparison between Direct FO and OMBR. Water Res. 2016, 104, 330–339. [Google Scholar] [CrossRef]
- Wang, Z.; Zheng, J.; Tang, J.; Wang, X.; Wu, Z. A Pilot-Scale Forward Osmosis Membrane System for Concentrating Low-Strength Municipal Wastewater: Performance and Implications. Sci. Rep. 2016, 6, 21653. [Google Scholar] [CrossRef] [Green Version]
- Xie, M.; Nghiem, L.D.; Price, W.E.; Elimelech, M. A Forward Osmosis-Membrane Distillation Hybrid Process for Direct Sewer Mining: System Performance and Limitations. Environ. Sci. Technol. 2013, 47, 13486–13493. [Google Scholar] [CrossRef] [Green Version]
- Xue, W.; Yamamoto, K.; Tobino, T. Membrane Fouling and Long-Term Performance of Seawater-Driven Forward Osmosis for Enrichment of Nutrients in Treated Municipal Wastewater. J. Membr. Sci. 2016, 499, 555–562. [Google Scholar] [CrossRef]
- Zahedi, S.; Ferrari, F.; Blandin, G.; Balcazar, J.L.; Pijuan, M. Enhancing Biogas Production from the Anaerobic Treatment of Municipal Wastewater by Forward Osmosis Pretreatment. J. Clean. Prod. 2021, 315, 128140. [Google Scholar] [CrossRef]
- Zhang, X.; Ning, Z.; Wang, D.K.; Diniz da Costa, J.C. Processing Municipal Wastewaters by Forward Osmosis Using CTA Membrane. J. Membr. Sci. 2014, 468, 269–275. [Google Scholar] [CrossRef] [Green Version]
- Salamanca, M.; López-Serna, R.; Palacio, L.; Hernández, A.; Prádanos, P.; Peña, M. Ecological Risk Evaluation and Removal of Emerging Pollutants in Urban Wastewater by a Hollow Fiber Forward Osmosis Membrane. Membranes 2022, 12, 293. [Google Scholar] [CrossRef] [PubMed]
- Salamanca, M.; López-Serna, R.; Palacio, L.; Hernández, A.; Prádanos, P.; Peña, M. Study of the Rejection of Contaminants of Emerging Concern by a Biomimetic Aquaporin Hollow Fiber Forward Osmosis Membrane. J. Water Process Eng. 2021, 40, 101914. [Google Scholar] [CrossRef]
- Yang, S.; Gao, B.; Jang, A.; Shon, H.K.; Yue, Q. Municipal Wastewater Treatment by Forward Osmosis Using Seawater Concentrate as Draw Solution. Chemosphere 2019, 237, 124485. [Google Scholar] [CrossRef]
- Valladares Linares, R.; Li, Z.; Sarp, S.; Bucs, S.S.; Amy, G.; Vrouwenvelder, J.S. Forward Osmosis Niches in Seawater Desalination and Wastewater Reuse. Water Res. 2014, 66, 122–139. [Google Scholar] [CrossRef] [PubMed]
- APHA. Standard Methods for the Examination of Water, 21st ed.; American Public Health Association: Washington, DC, USA, 2005. [Google Scholar]
- Bai, D.; Kruczek, B. Effect of Membrane Orientation and Concentration of Draw Solution on the Behavior of Commercial Osmotic Membrane in a Novel Dynamic Forward Osmosis Tests. Membranes 2022, 12, 385. [Google Scholar] [CrossRef]
- Xu, Y.; Peng, X.; Tang, C.Y.; Fu, Q.S.; Nie, S. Effect of Draw Solution Concentration and Operating Conditions on Forward Osmosis and Pressure Retarded Osmosis Performance in a Spiral Wound Module. J. Membr. Sci. 2010, 348, 298–309. [Google Scholar] [CrossRef]
- Long, Q.; Huang, J.; Xiong, S.; Shen, L.; Wang, Y. Exploration of Oligomeric Sodium Carboxylates as Novel Draw Solutes for Forward Osmosis. Chem. Eng. Res. Des. 2018, 138, 77–86. [Google Scholar] [CrossRef]
- Hermia, J. Constant pressure blocking filtration laws: Application to power-law non-Newtonian fluids. Trans. Inst. Chem. Eng. 1982, 60, 183–187. [Google Scholar] [CrossRef]
- Bowen, W.R.; Calvo, J.I.; Hernández, A. Steps of Membrane Blocking in Flux Decline during Protein Microfiltration. J. Membr. Sci. 1995, 101, 153–165. [Google Scholar] [CrossRef]
- Field, R.W.; She, Q.; Siddiqui, F.A.; Fane, A.G. Reverse Osmosis and Forward Osmosis Fouling: A Comparison. Discov. Chem. Eng. 2021, 1, 6. [Google Scholar] [CrossRef]
- Xie, M.; Lee, J.; Nghiem, L.D.; Elimelech, M. Role of Pressure in Organic Fouling in Forward Osmosis and Reverse Osmosis. J. Membr. Sci. 2015, 493, 748–754. [Google Scholar] [CrossRef] [Green Version]
- Siddiqui, F.A.; She, Q.; Fane, A.G.; Field, R.W. Exploring the Differences between Forward Osmosis and Reverse Osmosis Fouling. J. Membr. Sci. 2018, 565, 241–253. [Google Scholar] [CrossRef] [Green Version]
- Pratofiorito, G.; Horn, H.; Saravia, F. Differentiating Fouling on the Membrane and on the Spacer in Low-Pressure Reverse-Osmosis under High Organic Load Using Optical Coherence Tomography. Sep. Purif. Technol. 2022, 291, 120885. [Google Scholar] [CrossRef]
- Bao, X.; Wu, Q.; Tian, J.; Shi, W.; Wang, W.; Zhang, Z.; Zhang, R.; Zhang, B.; Guo, Y.; Shu, S.; et al. Fouling Mechanism of Forward Osmosis Membrane in Domestic Wastewater Concentration: Role of Substrate Structures. Chem. Eng. J. 2019, 370, 262–273. [Google Scholar] [CrossRef]
- Díaz, I.; Díaz-Curbelo, A.; Matute, K.I.; Fdz-Polanco, M.; Pérez-Elvira, S.I. Influence of the Operating Conditions of the Intermediate Thermal Hydrolysis on the Energetic Efficiency of the Sludge Treatment Process. Bioresour. Technol. 2021, 333, 125114. [Google Scholar] [CrossRef] [PubMed]
- Díaz, I.; Fdz-Polanco, F.; Mutsvene, B.; Fdz-Polanco, M. Effect of Operating Pressure on Direct Biomethane Production from Carbon Dioxide and Exogenous Hydrogen in the Anaerobic Digestion of Sewage Sludge. Appl. Energy 2020, 280, 115915. [Google Scholar] [CrossRef]
- Lim, S.J.; Fox, P. Biochemical Methane Potential (BMP) Test for Thickened Sludge Using Anaerobic Granular Sludge at Different Inoculum/Substrate Ratios. Biotechnol. Bioprocess Eng. 2013, 18, 306–312. [Google Scholar] [CrossRef]
- Yang, Q.; Wu, B.; Yao, F.; He, L.; Chen, F.; Ma, Y.; Shu, X.; Hou, K.; Wang, D.; Li, X. Biogas Production from Anaerobic Co-Digestion of Waste Activated Sludge: Co-Substrates and Influencing Parameters. Rev. Environ. Sci. Bio./Technol. 2019, 18, 771–793. [Google Scholar] [CrossRef]
- Dai, X.; Hu, C.; Zhang, D.; Dai, L.; Duan, N. Impact of a High Ammonia-Ammonium-PH System on Methane-Producing Archaea and Sulfate-Reducing Bacteria in Mesophilic Anaerobic Digestion. Bioresour. Technol. 2017, 245, 598–605. [Google Scholar] [CrossRef]
- Chen, Y.; Cheng, J.J.; Creamer, K.S. Inhibition of Anaerobic Digestion Process: A Review. Bioresour. Technol. 2008, 99, 4044–4064. [Google Scholar] [CrossRef] [PubMed]
- Chen, C.; Liu, Z.; Huang, X. Anaerobic Membrane Bioreactors for Sustainable and Energy-Efficient Municipal Wastewater Treatment. In Current Developments in Biotechnology and Bioengineering; Ngo, H.H., Guo, W., Ng, H.Y., Mannina, G., Pandey, A., Eds.; Elsevier: Amsterdam, The Netherlands, 2020; pp. 335–366. [Google Scholar] [CrossRef]
- Ozgun, H.; Dereli, R.K.; Ersahin, M.E.; Kinaci, C.; Spanjers, H.; van Lier, J.B. A Review of Anaerobic Membrane Bioreactors for Municipal Wastewater Treatment: Integration Options, Limitations and Expectations. Sep. Purif. Technol. 2013, 118, 89–104. [Google Scholar] [CrossRef]
- Filer, J.; Ding, H.H.; Chang, S. Biochemical Methane Potential (BMP) Assay Method for Anaerobic Digestion Research. Water 2019, 11, 921. [Google Scholar] [CrossRef] [Green Version]
- Li, Y.; Yang, Z.; Yang, K.; Wei, J.; Li, Z.; Ma, C.; Yang, X.; Wang, T.; Zeng, G.; Yu, G.; et al. Removal of Chloride from Water and Wastewater: Removal Mechanisms and Recent Trends. Sci. Total Environ. 2022, 821, 153174. [Google Scholar] [CrossRef]
- Li, F.; Guo, Y.; Wang, S. Pilot-Scale Selective Electrodialysis for the Separation of Chloride and Sulphate from High-Salinity Wastewater. Membranes 2022, 12, 610. [Google Scholar] [CrossRef] [PubMed]
- Akhter, M.; Habib, G.; Qamar, S.U. Application of Electrodialysis in Waste Water Treatment and Impact of Fouling on Process Performance. J. Membr. Sci. Technol. 2018, 8, 1000182. [Google Scholar] [CrossRef]
- Gurreri, L.; Tamburini, A.; Cipollina, A.; Micale, G. Electrodialysis Applications in Wastewater Treatment for Environmental Protection and Resources Recovery: A Systematic Review on Progress and Perspectives. Membranes 2020, 10, 146. [Google Scholar] [CrossRef]


| FO | LPRO | ||
|---|---|---|---|
| Operational parameters | Driving force | Similar in both processes | |
| Volume of municipal wastewater treated (L) | 78 | ||
| Operation time (min) | 346 | 580 | |
| Concentration factor | 3 | ||
| Parameters studied | Water flux (L/(m2h)) Reverse salt flux (g/(m2h)) Total recovery TOC concentration (included washes) (%) BMP test (NmL of CH4/g) | ||
| Manufacturers | Berghof Membranes (Germany) |
|---|---|
| Membrane module | TFO-D90 |
| Active area | 2.3 m2 |
| Average membrane tube diameter | 5.3 mm |
| Lumen open cross-sectional area | 26 cm2 |
| Shell open cross-sectional area | 15 cm2 |
| Housing material | PVC-U |
| Potting material | Epoxy resin |
| Water flux (*) | >6 L/(m2h) |
| Reverse salt flux (*) | <1 g/(m2h) |
| Specific reverse salt flux (*) | <0.17 g/L |
| Volatile Solids (VS) (g/kg) | Total Solids (TS) (g/kg) | TOC (Total Organic Carbon) (mg TOC/L) | pH | |
|---|---|---|---|---|
| Inoculum | 10.60 ± 0.13 | 20.70 ± 0.21 | 828.11 ± 42.00 | 7.3 ± 0.1 |
| FO substrate | 5.70 ± 0.06 | 0.58 ± 0.01 | 33.30 ± 1.12 | 7.4 ± 0.1 |
| LPRO substrate | 21.88 ± 0.22 | 2.84 ± 0.10 | 141.60 ± 4.65 | 7.5 ± 0.1 |
Disclaimer/Publisher’s Note: The statements, opinions and data contained in all publications are solely those of the individual author(s) and contributor(s) and not of MDPI and/or the editor(s). MDPI and/or the editor(s) disclaim responsibility for any injury to people or property resulting from any ideas, methods, instructions or products referred to in the content. |
© 2023 by the authors. Licensee MDPI, Basel, Switzerland. This article is an open access article distributed under the terms and conditions of the Creative Commons Attribution (CC BY) license (https://creativecommons.org/licenses/by/4.0/).
Share and Cite
Salamanca, M.; Palacio, L.; Hernandez, A.; Peña, M.; Prádanos, P. Evaluation of Forward Osmosis and Low-Pressure Reverse Osmosis with a Tubular Membrane for the Concentration of Municipal Wastewater and the Production of Biogas. Membranes 2023, 13, 266. https://doi.org/10.3390/membranes13030266
Salamanca M, Palacio L, Hernandez A, Peña M, Prádanos P. Evaluation of Forward Osmosis and Low-Pressure Reverse Osmosis with a Tubular Membrane for the Concentration of Municipal Wastewater and the Production of Biogas. Membranes. 2023; 13(3):266. https://doi.org/10.3390/membranes13030266
Chicago/Turabian StyleSalamanca, Mónica, Laura Palacio, Antonio Hernandez, Mar Peña, and Pedro Prádanos. 2023. "Evaluation of Forward Osmosis and Low-Pressure Reverse Osmosis with a Tubular Membrane for the Concentration of Municipal Wastewater and the Production of Biogas" Membranes 13, no. 3: 266. https://doi.org/10.3390/membranes13030266