
On the Operational Conditions’ Effect on the Performance of an Anion Exchange Membrane Water Electrolyzer: Electrochemical Impedance Spectroscopy Study
 , , , and
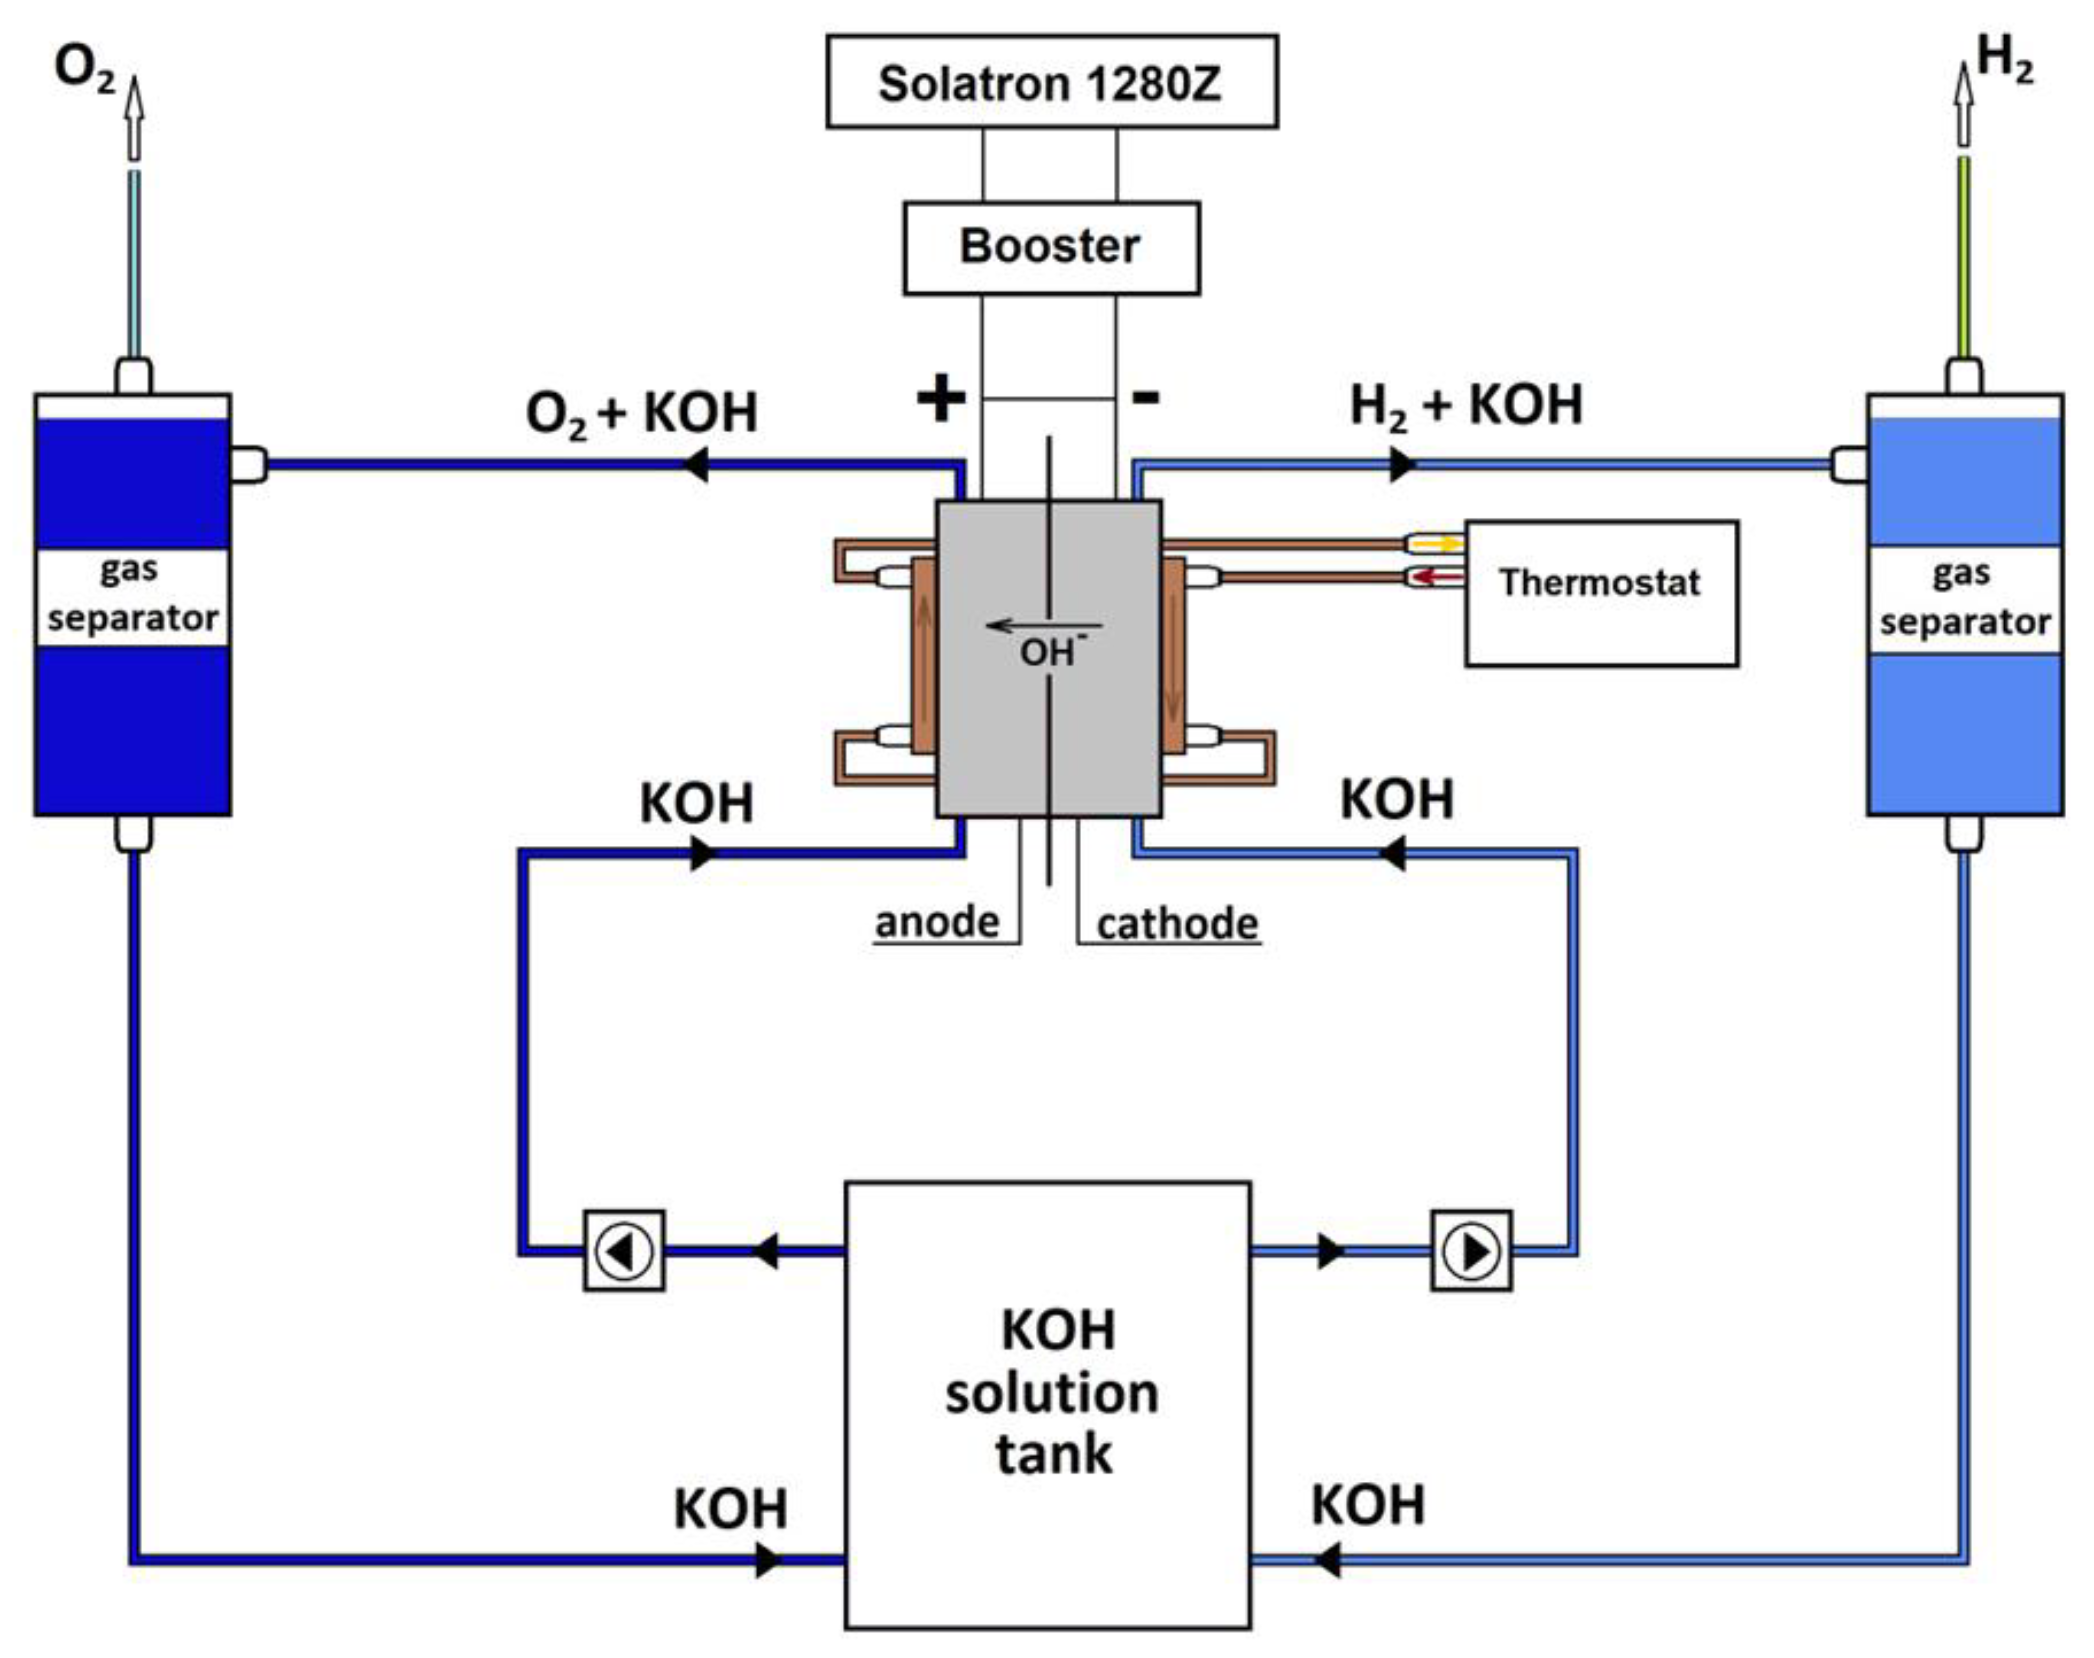
Abstract
:1. Introduction
2. Experimental
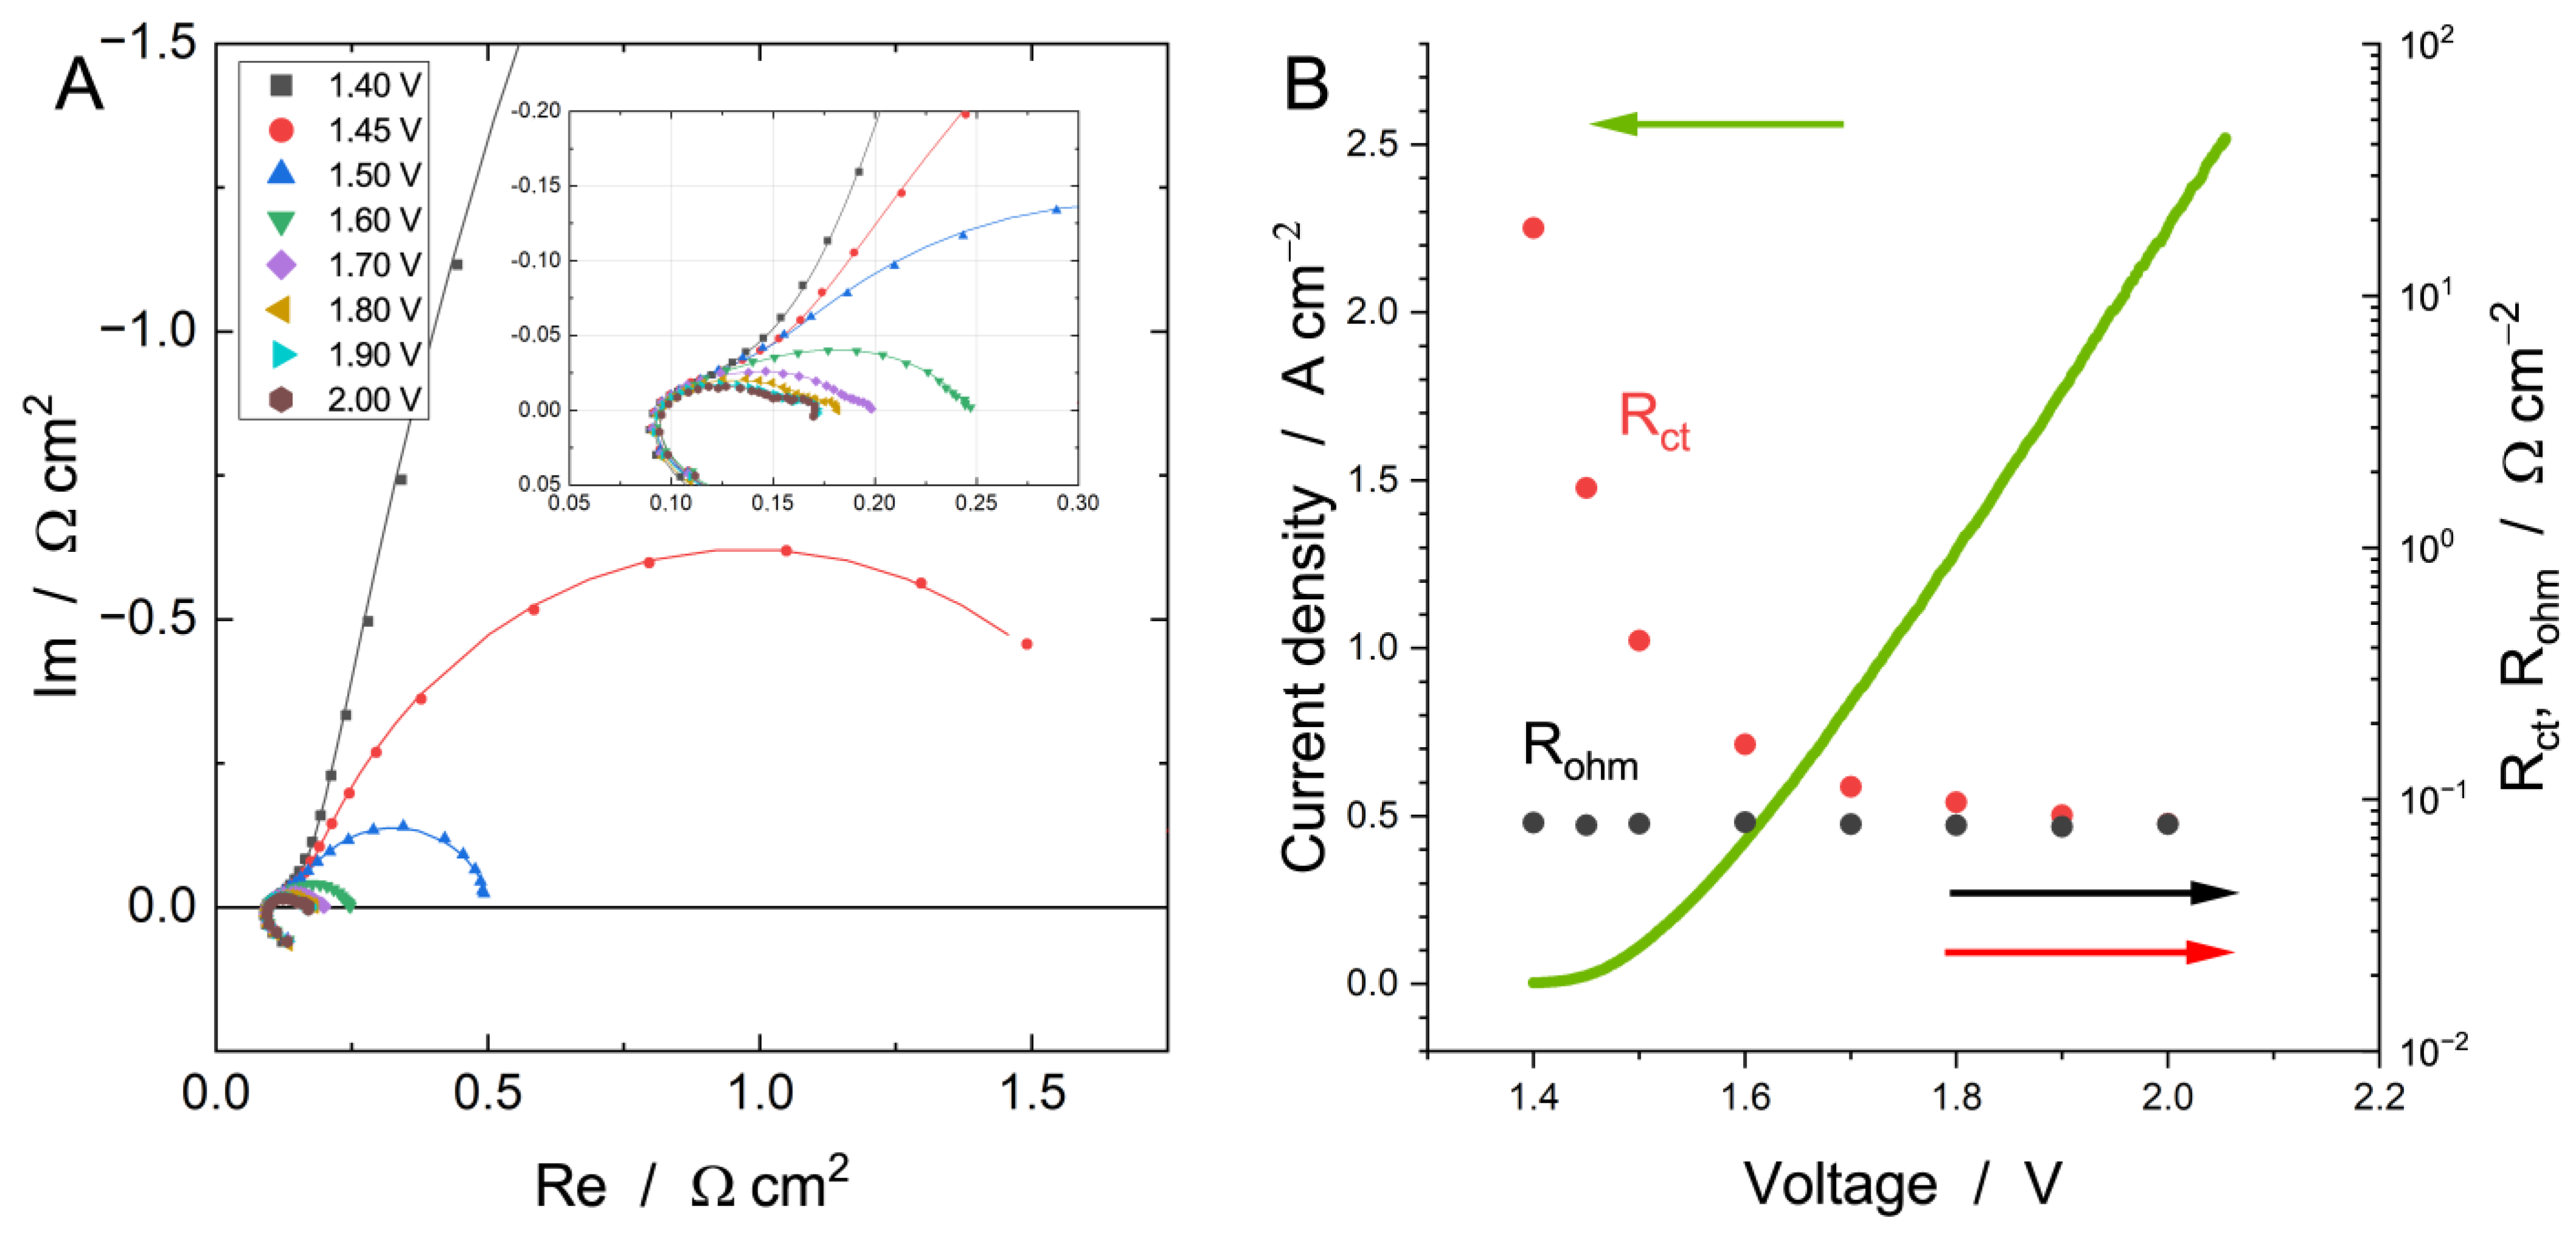
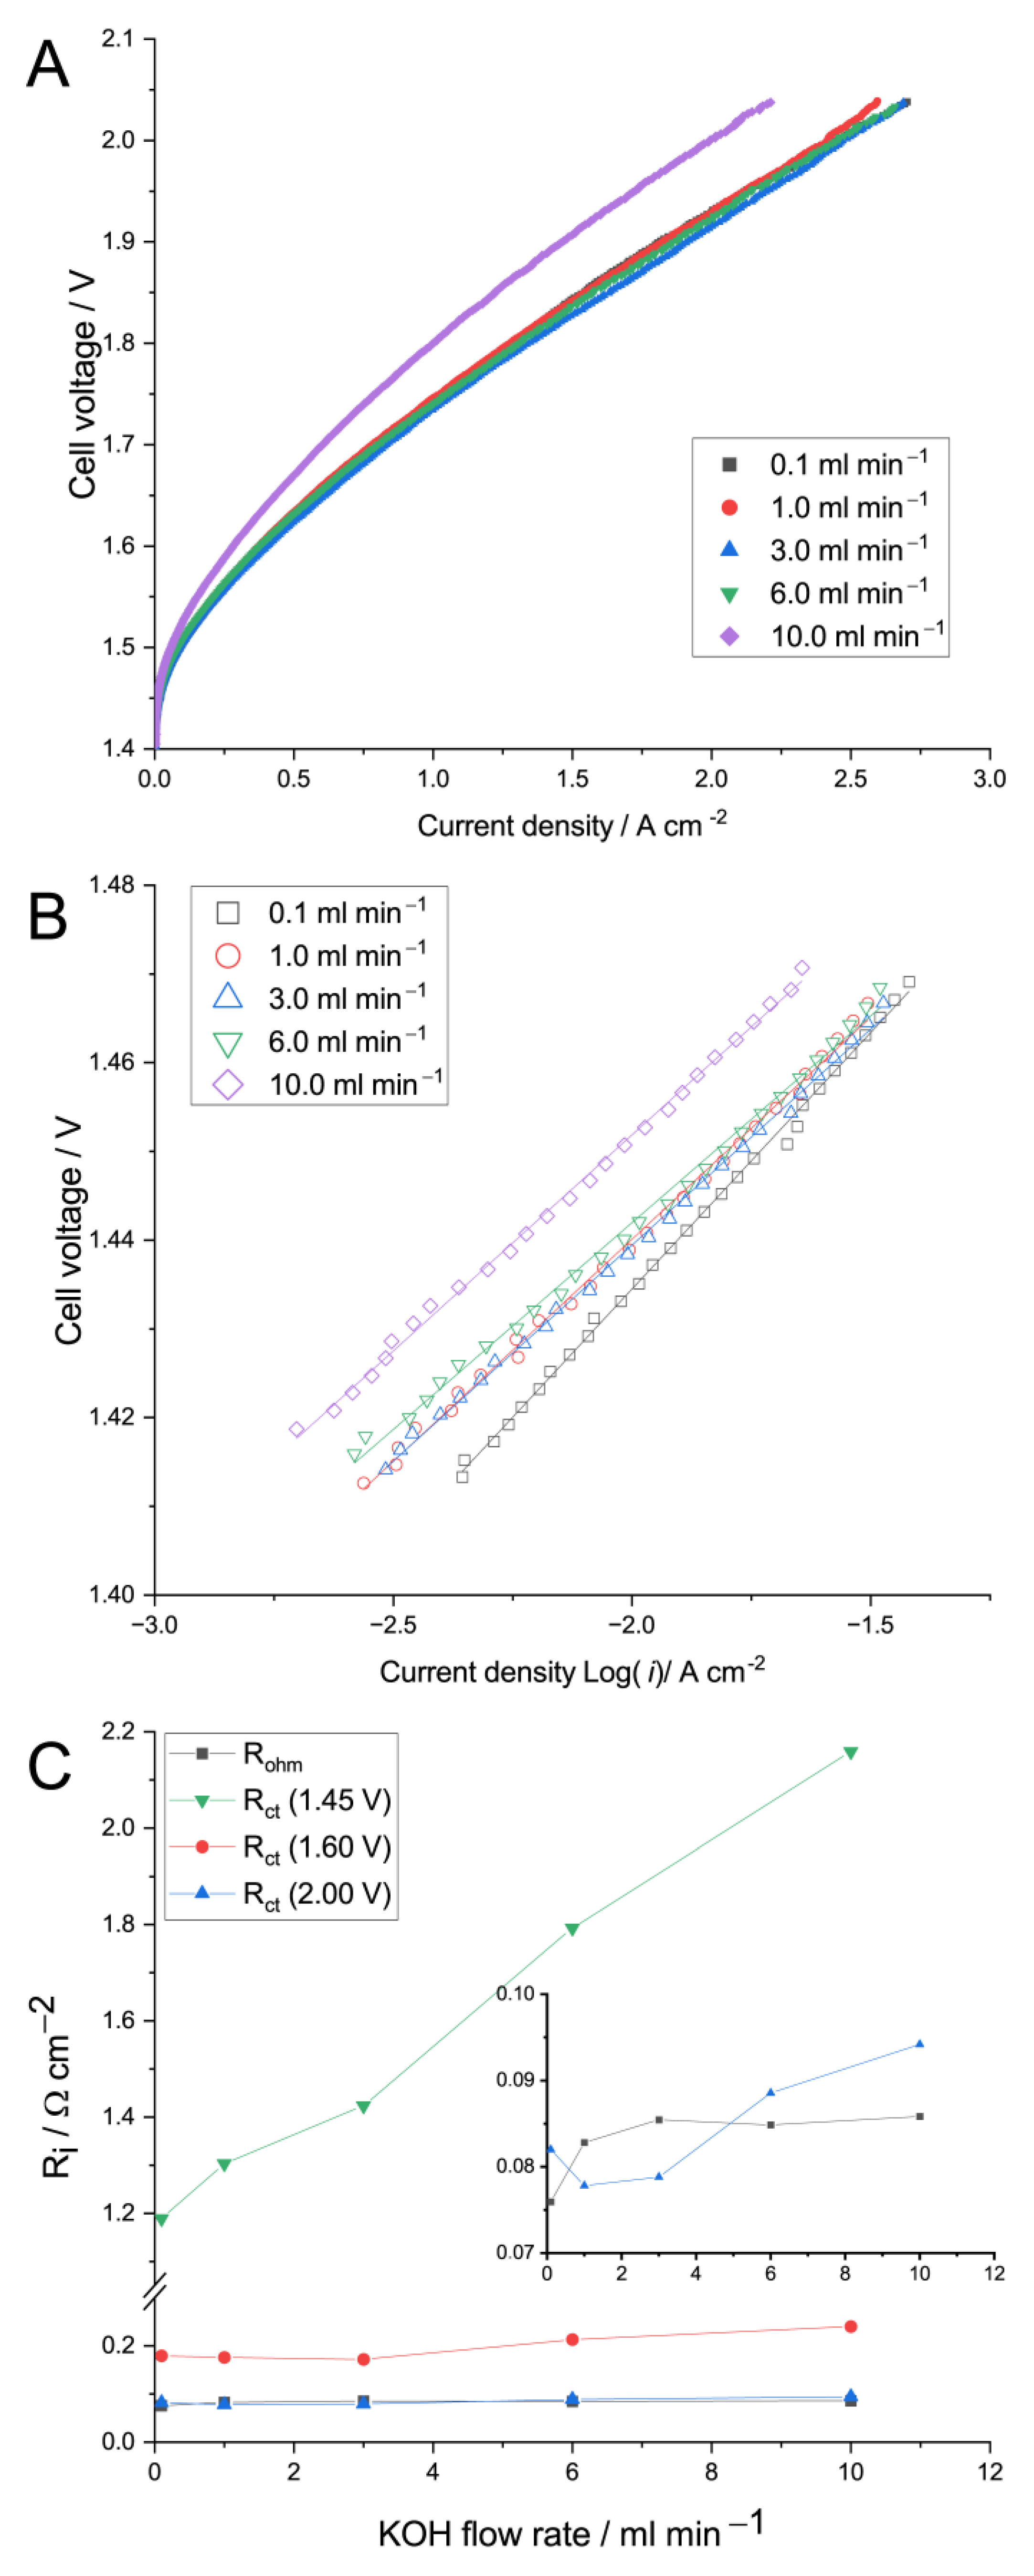
3. Results and Discussion
4. Conclusions
Supplementary Materials
Author Contributions
Funding
Institutional Review Board Statement
Data Availability Statement
Conflicts of Interest
References
- Buttler, A.; Spliethoff, H. Current status of water electrolysis for energy storage, grid balancing and sector coupling via power-to-gas and power-to-liquids: A review. Renew. Sustain. Energy Rev. 2018, 82, 2440–2454. [Google Scholar] [CrossRef]
- Carmo, M.; Fritz, D.L.; Mergel, J.; Stolten, D. A comprehensive review on PEM water electrolysis. Int. J. Hydrog. Energy 2013, 38, 4901–4934. [Google Scholar] [CrossRef]
- Vincent, I.; Bessarabov, D. Low cost hydrogen production by anion exchange membrane electrolysis: A review. Renew. Sustain. Energy Rev. 2018, 81, 1690–1704. [Google Scholar] [CrossRef]
- Miller, H.A.; Bouzek, K.; Hnat, J.; Loos, S.; Bernäcker, C.I.; Weißgärber, T.; Röntzsch, L.; Meier-Haack, J. Green hydrogen from anion exchange membrane water electrolysis: A review of recent developments in critical materials and operating conditions. Sustain. Energy Fuels 2020, 4, 2114–2133. [Google Scholar] [CrossRef]
- Du, N.; Roy, C.; Peach, R.; Turnbull, M.; Thiele, S.; Bock, C. Anion-Exchange Membrane Water Electrolyzers. Chem. Rev. 2022, 122, 11830–11895. [Google Scholar] [CrossRef]
- Ito, H.; Kawaguchi, N.; Someya, S.; Munakata, T.; Miyazaki, N.; Ishida, M.; Nakano, A. Experimental investigation of electrolytic solution for anion exchange membrane water electrolysis. Int. J. Hydrog. Energy 2018, 43, 17030–17039. [Google Scholar] [CrossRef]
- Holzapfel, P.; Bühler, M.; Van Pham, C.; Hegge, F.; Böhm, T.; McLaughlin, D.; Breitwieser, M.; Thiele, S. Directly coated membrane electrode assemblies for proton exchange membrane water electrolysis. Electrochem. Commun. 2020, 110, 106640. [Google Scholar] [CrossRef]
- Ahmed, K.W.; Jang, M.J.; Habibpour, S.; Chen, Z.; Fowler, M. NiFeOx and NiFeCoOx Catalysts for Anion Exchange Membrane Water Electrolysis. Electrochem 2022, 3, 843–861. [Google Scholar] [CrossRef]
- Li, D.; Motz, A.R.; Bae, C.; Fujimoto, C.; Yang, G.; Zhang, F.-Y.; Ayers, K.E.; Kim, Y.S. Durability of anion exchange membrane water electrolyzers. Energy Environ. Sci. 2021, 14, 3393–3419. [Google Scholar] [CrossRef]
- Liu, J.; Kang, Z.; Li, D.; Pak, M.; Alia, S.M.; Fujimoto, C.; Bender, G.; Kim, Y.S.; Weber, A.Z. Elucidating the Role of Hydroxide Electrolyte on Anion-Exchange-Membrane Water Electrolyzer Performance. J. Electrochem. Soc. 2021, 168, 054522. [Google Scholar] [CrossRef]
- Pushkareva, I.V.; Pushkarev, A.S.; Grigoriev, S.A.; Modisha, P.; Bessarabov, D.G. Comparative study of anion exchange membranes for low-cost water electrolysis. Int. J. Hydrog. Energy 2020, 45, 26070–26079. [Google Scholar] [CrossRef]
- Liu, Z.; Sajjad, S.D.; Gao, Y.; Yang, H.; Kaczur, J.J.; Masel, R.I. The effect of membrane on an alkaline water electrolyzer. Int. J. Hydrog. Energy 2017, 42, 29661–29665. [Google Scholar] [CrossRef]
- Vincent, I.; Kruger, A.; Bessarabov, D. Development of efficient membrane electrode assembly for low cost hydrogen production by anion exchange membrane electrolysis. Int. J. Hydrog. Energy 2017, 42, 10752–10761. [Google Scholar] [CrossRef]
- Chen, N.; Paek, S.Y.; Lee, J.Y.; Park, J.H.; Lee, S.Y.; Lee, Y.M. High-performance anion exchange membrane water electrolyzers with a current density of 7.68 A cm−2 and a durability of 1000 hours. Energy Environ. Sci. 2021, 14, 6338–6348. [Google Scholar] [CrossRef]
- Ahn, S.H.; Lee, B.-S.; Choi, I.; Yoo, S.J.; Kim, H.-J.; Cho, E.; Henkensmeier, D.; Nam, S.W.; Kim, S.-K.; Jang, J.H. Development of a membrane electrode assembly for alkaline water electrolysis by direct electrodeposition of nickel on carbon papers. Appl. Catal. B Environ. 2014, 154–155, 197–205. [Google Scholar] [CrossRef]
- Park, J.E.; Kang, S.Y.; Oh, S.-H.; Kim, J.K.; Lim, M.S.; Ahn, C.-Y.; Cho, Y.-H.; Sung, Y.-E. High-performance anion-exchange membrane water electrolysis. Electrochim. Acta 2019, 295, 99–106. [Google Scholar] [CrossRef]
- Liu, H.; Tao, H.B.; Liu, B. Kinetic Insights of Proton Exchange Membrane Water Electrolyzer Obtained by Operando Characterization Methods. J. Phys. Chem. Lett. 2022, 13, 6520–6531. [Google Scholar] [CrossRef]
- Wang, S.; Zhang, J.; Gharbi, O.; Vivier, V.; Gao, M.; Orazem, M.E. Electrochemical impedance spectroscopy. Nat. Rev. Methods Prim. 2021, 1, 41. [Google Scholar] [CrossRef]
- Meddings, N.; Heinrich, M.; Overney, F.; Lee, J.-S.; Ruiz, V.; Napolitano, E.; Seitz, S.; Hinds, G.; Raccichini, R.; Gaberšček, M.; et al. Application of electrochemical impedance spectroscopy to commercial Li-ion cells: A review. J. Power Sources 2020, 480, 228742. [Google Scholar] [CrossRef]
- Sumi, H.; Shimada, H.; Yamaguchi, Y.; Yamaguchi, T.; Fujishiro, Y. Degradation evaluation by distribution of relaxation times analysis for microtubular solid oxide fuel cells. Electrochim. Acta 2020, 339, 135913. [Google Scholar] [CrossRef]
- Nechache, A.; Cassir, M.; Ringuedé, A. Solid oxide electrolysis cell analysis by means of electrochemical impedance spectroscopy: A review. J. Power Sources 2014, 258, 164–181. [Google Scholar] [CrossRef]
- Qu, D.; Wang, G.; Kafle, J.; Harris, J.; Crain, L.; Jin, Z.; Zheng, D. Electrochemical Impedance and its Applications in Energy-Storage Systems. Small Methods 2018, 2, 1700342. [Google Scholar] [CrossRef]
- Vincent, I.; Lee, E.-C.; Kim, H.-M. Comprehensive impedance investigation of low-cost anion exchange membrane electrolysis for large-scale hydrogen production. Sci. Rep. 2021, 11, 293. [Google Scholar] [CrossRef] [PubMed]
- Wang, L.; Weissbach, T.; Reissner, R.; Ansar, A.; Gago, A.S.; Holdcroft, S.; Friedrich, K.A. High Performance Anion Exchange Membrane Electrolysis Using Plasma-Sprayed, Non-Precious-Metal Electrodes. ACS Appl. Energy Mater. 2019, 2, 7903–7912. [Google Scholar] [CrossRef]
- Ciucci, F. Modeling electrochemical impedance spectroscopy. Curr. Opin. Electrochem. 2019, 13, 132–139. [Google Scholar] [CrossRef]
- Tang, Z.; Huang, Q.-A.; Wang, Y.-J.; Zhang, F.; Li, W.; Li, A.; Zhang, L.; Zhang, J. Recent progress in the use of electrochemical impedance spectroscopy for the measurement, monitoring, diagnosis and optimization of proton exchange membrane fuel cell performance. J. Power Sources 2020, 468, 228361. [Google Scholar] [CrossRef]
- Razmjooei, F.; Morawietz, T.; Taghizadeh, E.; Hadjixenophontos, E.; Mues, L.; Gerle, M.; Wood, B.D.; Harms, C.; Gago, A.S.; Ansar, S.A.; et al. Increasing the performance of an anion-exchange membrane electrolyzer operating in pure water with a nickel-based microporous layer. Joule 2021, 5, 1776–1799. [Google Scholar] [CrossRef]
- Cossar, E.; Barnett, A.O.; Seland, F.; Safari, R.; Botton, G.A.; Baranova, E.A. Ionomer content optimization in nickel-iron-based anodes with and without ceria for anion exchange membrane water electrolysis. J. Power Sources 2021, 514, 230563. [Google Scholar] [CrossRef]
- Jang, M.J.; Yang, S.H.; Park, M.G.; Jeong, J.; Cha, M.S.; Shin, S.-H.; Lee, K.H.; Bai, Z.; Chen, Z.; Lee, J.Y.; et al. Efficient and Durable Anion Exchange Membrane Water Electrolysis for a Commercially Available Electrolyzer Stack using Alkaline Electrolyte. ACS Energy Lett. 2022, 7, 2576–2583. [Google Scholar] [CrossRef]
- Siracusano, S.; Trocino, S.; Briguglio, N.; Baglio, V.; Aricò, A. Electrochemical Impedance Spectroscopy as a Diagnostic Tool in Polymer Electrolyte Membrane Electrolysis. Materials 2018, 11, 1368. [Google Scholar] [CrossRef] [Green Version]
- Khataee, A.; Shirole, A.; Jannasch, P.; Krüger, A.; Cornell, A. Anion exchange membrane water electrolysis using AemionTM membranes and nickel electrodes. J. Mater. Chem. A 2022, 10, 16061–16070. [Google Scholar] [CrossRef]
- Dedigama, I.; Angeli, P.; Ayers, K.; Robinson, J.B.; Shearing, P.R.; Tsaoulidis, D.; Brett, D.J.L. In situ diagnostic techniques for characterisation of polymer electrolyte membrane water electrolysers–Flow visualisation and electrochemical impedance spectroscopy. Int. J. Hydrog. Energy 2014, 39, 4468–4482. [Google Scholar] [CrossRef]
- Xiao, J.; Oliveira, A.M.; Wang, L.; Zhao, Y.; Wang, T.; Wang, J.; Setzler, B.P.; Yan, Y. Water-Fed Hydroxide Exchange Membrane Electrolyzer Enabled by a Fluoride-Incorporated Nickel–Iron Oxyhydroxide Oxygen Evolution Electrode. ACS Catal. 2021, 11, 264–270. [Google Scholar] [CrossRef]
- Garcia-Navarro, J.C.; Schulze, M.; Friedrich, K.A. Measuring and modeling mass transport losses in proton exchange membrane water electrolyzers using electrochemical impedance spectroscopy. J. Power Sources 2019, 431, 189–204. [Google Scholar] [CrossRef]
- Kozlova, M.; Butrim, S.; Solovyev, M.; Pushkarev, A.; Pushkareva, I.; Kalinichenko, V.; Akelkina, S.; Grigoriev, S. Structural and Electrochemical Characteristics of Platinum Nanoparticles Supported on Various Carbon Carriers. C 2022, 8, 14. [Google Scholar] [CrossRef]
- Wu, Z.; Vagin, M.; Boyd, R.; Bakhit, B.; Greczynski, G.; Odén, M.; Björk, E.M. Morphology effects on electrocatalysis of anodic water splitting on nickel (II) oxide. Microporous Mesoporous Mater. 2022, 333, 111734. [Google Scholar] [CrossRef]
- Pushkarev, A.S.; Pushkareva, I.V.; Solovyev, M.A.; Prokop, M.; Bystron, T.; Rajagopalan, S.K.; Bouzek, K.; Grigoriev, S.A. On the influence of porous transport layers parameters on the performances of polymer electrolyte membrane water electrolysis cells. Electrochim. Acta 2021, 399, 139436. [Google Scholar] [CrossRef]
- Pushkareva, I.V.; Pushkarev, A.S.; Kalinichenko, V.N.; Chumakov, R.G.; Soloviev, M.A.; Liang, Y.; Millet, P.; Grigoriev, S.A. Reduced Graphene Oxide-Supported Pt-Based Catalysts for PEM Fuel Cells with Enhanced Activity and Stability. Catalysts 2021, 11, 256. [Google Scholar] [CrossRef]
- Hack, J.; Heenan, T.M.M.; Iacoviello, F.; Mansor, N.; Meyer, Q.; Shearing, P.; Brandon, N.; Brett, D.J.L. A Structure and Durability Comparison of Membrane Electrode Assembly Fabrication Methods: Self-Assembled Versus Hot-Pressed. J. Electrochem. Soc. 2018, 165, F3045–F3052. [Google Scholar] [CrossRef]
- Motealleh, B.; Liu, Z.; Masel, R.I.; Sculley, J.P.; Richard Ni, Z.; Meroueh, L. Next-generation anion exchange membrane water electrolyzers operating for commercially relevant lifetimes. Int. J. Hydrog. Energy 2021, 46, 3379–3386. [Google Scholar] [CrossRef]
- Chen, P.; Hu, X. High-Efficiency Anion Exchange Membrane Water Electrolysis Employing Non-Noble Metal Catalysts. Adv. Energy Mater. 2020, 10, 2002285. [Google Scholar] [CrossRef]
- Klotz, D.; Weber, A.; Ivers-Tiffée, E. Practical Guidelines for Reliable Electrochemical Characterization of Solid Oxide Fuel Cells. Electrochim. Acta 2017, 227, 110–126. [Google Scholar] [CrossRef]
- Kobayashi, K.; Suzuki, T.S. Free Analysis and Visualization Programs for Electrochemical Impedance Spectroscopy Coded in Python. Electrochemistry 2021, 89, 218–222. [Google Scholar] [CrossRef]
- Schönleber, M.; Klotz, D.; Ivers-Tiffée, E. A Method for Improving the Robustness of linear Kramers-Kronig Validity Tests. Electrochim. Acta 2014, 131, 20–27. [Google Scholar] [CrossRef]
- Zappen, H.; Fuchs, G.; Gitis, A.; Sauer, D. In-Operando Impedance Spectroscopy and Ultrasonic Measurements during High-Temperature Abuse Experiments on Lithium-Ion Batteries. Batteries 2020, 6, 25. [Google Scholar] [CrossRef]
- Suermann, M.; Bensmann, B.; Hanke-Rauschenbach, R. Degradation of Proton Exchange Membrane (PEM) Water Electrolysis Cells: Looking Beyond the Cell Voltage Increase. J. Electrochem. Soc. 2019, 166, F645–F652. [Google Scholar] [CrossRef]
- Suermann, M.; Pătru, A.; Schmidt, T.J.; Büchi, F.N. High pressure polymer electrolyte water electrolysis: Test bench development and electrochemical analysis. Int. J. Hydrog. Energy 2017, 42, 12076–12086. [Google Scholar] [CrossRef]
- Mérida, W.; Harrington, D.A.; Le Canut, J.M.; McLean, G. Characterisation of proton exchange membrane fuel cell (PEMFC) failures via electrochemical impedance spectroscopy. J. Power Sources 2006, 161, 264–274. [Google Scholar] [CrossRef]
- Shin, E.-C.; Ahn, P.-A.; Seo, H.-H.; Jo, J.-M.; Kim, S.-D.; Woo, S.-K.; Yu, J.H.; Mizusaki, J.; Lee, J.-S. Polarization mechanism of high temperature electrolysis in a Ni–YSZ/YSZ/LSM solid oxide cell by parametric impedance analysis. Solid State Ionics 2013, 232, 80–96. [Google Scholar] [CrossRef]
- Schiefer, A.; Heinzmann, M.; Weber, A. Inductive Low-Frequency Processes in PEMFC-Impedance Spectra. Fuel Cells 2020, 20, 499–506. [Google Scholar] [CrossRef] [Green Version]
- Agilent Impedance Measurement Handbook, 4th ed.; Agilent Technologies, Inc.: Santa Clara, CA, USA, 2009.
- Papakonstantinou, G.; Algara-Siller, G.; Teschner, D.; Vidaković-Koch, T.; Schlögl, R.; Sundmacher, K. Degradation study of a proton exchange membrane water electrolyzer under dynamic operation conditions. Appl. Energy 2020, 280, 115911. [Google Scholar] [CrossRef]
- Pushkarev, A.S.; Pushkareva, I.V.; du Preez, S.P.; Bessarabov, D.G. PGM-free electrocatalytic layer characterization by electrochemical impedance spectroscopy of an anion exchange membrane water electrolyzer with Nafion ionomer as the bonding agent. Catalysts 2023. under review. [Google Scholar]
- Li, N.; Araya, S.S.; Kær, S.K. Investigating low and high load cycling tests as accelerated stress tests for proton exchange membrane water electrolysis. Electrochim. Acta 2021, 370, 137748. [Google Scholar] [CrossRef]
- Córdoba-Torres, P.; Mesquita, T.J.; Devos, O.; Tribollet, B.; Roche, V.; Nogueira, R.P. On the intrinsic coupling between constant-phase element parameters α and Q in electrochemical impedance spectroscopy. Electrochim. Acta 2012, 72, 172–178. [Google Scholar] [CrossRef]
- Villagra, A.; Millet, P. An analysis of PEM water electrolysis cells operating at elevated current densities. Int. J. Hydrog. Energy 2019, 44, 9708–9717. [Google Scholar] [CrossRef]
- Aßmann, P.; Gago, A.S.; Gazdzicki, P.; Friedrich, K.A.; Wark, M. Toward developing accelerated stress tests for proton exchange membrane electrolyzers. Curr. Opin. Electrochem. 2020, 21, 225–233. [Google Scholar] [CrossRef]
- Rozain, C.; Millet, P. Electrochemical characterization of Polymer Electrolyte Membrane Water Electrolysis Cells. Electrochim. Acta 2014, 131, 160–167. [Google Scholar] [CrossRef]
- Ito, H.; Maeda, T.; Nakano, A.; Kato, A.; Yoshida, T. Influence of pore structural properties of current collectors on the performance of proton exchange membrane electrolyzer. Electrochim. Acta 2013, 100, 242–248. [Google Scholar] [CrossRef]
- Lettenmeier, P.; Kolb, S.; Sata, N.; Fallisch, A.; Zielke, L.; Thiele, S.; Gago, A.S.; Friedrich, K.A. Comprehensive investigation of novel pore-graded gas diffusion layers for high-performance and cost-effective proton exchange membrane electrolyzers. Energy Environ. Sci. 2017, 10, 2521–2533. [Google Scholar] [CrossRef]
- Ghoshal, S.; Pivovar, B.S.; Alia, S.M. Evaluating the effect of membrane-ionomer combinations and supporting electrolytes on the performance of cobalt nanoparticle anodes in anion exchange membrane electrolyzers. J. Power Sources 2021, 488, 229433. [Google Scholar] [CrossRef]
- Koshikawa, H.; Murase, H.; Hayashi, T.; Nakajima, K.; Mashiko, H.; Shiraishi, S.; Tsuji, Y. Single Nanometer-Sized NiFe-Layered Double Hydroxides as Anode Catalyst in Anion Exchange Membrane Water Electrolysis Cell with Energy Conversion Efficiency of 74.7% at 1.0 A cm−2. ACS Catal. 2020, 10, 1886–1893. [Google Scholar] [CrossRef]
- Wang, R.; Inoguchi, K.; Ohashi, M.; Someya, S.; Munakata, T.; Ishida, M.; Ito, H. Effect of catalyst distribution and structural properties of anode porous transport electrodes on the performance of anion exchange membrane water electrolysis. Int. J. Hydrog. Energy 2021, 46, 37757–37767. [Google Scholar] [CrossRef]
- Pushkarev, A.S.; Solovyev, M.A.; Grigoriev, S.A.; Pushkareva, I.V.; Voloshin, Y.Z.; Chornenka, N.V.; Belov, A.S.; Millet, P.; Kalinichenko, V.N.; Dedov, A.G. Electrocatalytic hydrogen production using the designed hexaphenanthrene iron, cobalt and ruthenium(II) cage complexes as cathode (pre)catalysts immobilized on carbonaceous substrates. Int. J. Hydrog. Energy 2020, 45, 26206–26216. [Google Scholar] [CrossRef]
- Faid, A.Y.; Xie, L.; Barnett, A.O.; Seland, F.; Kirk, D.; Sunde, S. Effect of anion exchange ionomer content on electrode performance in AEM water electrolysis. Int. J. Hydrog. Energy 2020, 45, 28272–28284. [Google Scholar] [CrossRef]
- Pavel, C.C.; Cecconi, F.; Emiliani, C.; Santiccioli, S.; Scaffidi, A.; Catanorchi, S.; Comotti, M. Highly Efficient Platinum Group Metal Free Based Membrane-Electrode Assembly for Anion Exchange Membrane Water Electrolysis. Angew. Chem. Int. Ed. 2014, 53, 1378–1381. [Google Scholar] [CrossRef]
- Li, D.; Park, E.J.; Zhu, W.; Shi, Q.; Zhou, Y.; Tian, H.; Lin, Y.; Serov, A.; Zulevi, B.; Baca, E.D.; et al. Highly quaternized polystyrene ionomers for high performance anion exchange membrane water electrolysers. Nat. Energy 2020, 5, 378–385. [Google Scholar] [CrossRef]
- Siracusano, S.; Baglio, V.; Grigoriev, S.A.A.; Merlo, L.; Fateev, V.N.N.; Aricò, A.S.S. The influence of iridium chemical oxidation state on the performance and durability of oxygen evolution catalysts in PEM electrolysis. J. Power Sources 2017, 366, 105–114. [Google Scholar] [CrossRef]
- Elsøe, K.; Grahl-Madsen, L.; Scherer, G.G.; Hjelm, J.; Mogensen, M.B. Electrochemical Characterization of a PEMEC Using Impedance Spectroscopy. J. Electrochem. Soc. 2017, 164, F1419–F1426. [Google Scholar] [CrossRef] [Green Version]


Disclaimer/Publisher’s Note: The statements, opinions and data contained in all publications are solely those of the individual author(s) and contributor(s) and not of MDPI and/or the editor(s). MDPI and/or the editor(s) disclaim responsibility for any injury to people or property resulting from any ideas, methods, instructions or products referred to in the content. |
© 2023 by the authors. Licensee MDPI, Basel, Switzerland. This article is an open access article distributed under the terms and conditions of the Creative Commons Attribution (CC BY) license (https://creativecommons.org/licenses/by/4.0/).
Share and Cite
Pushkareva, I.V.; Solovyev, M.A.; Butrim, S.I.; Kozlova, M.V.; Simkin, D.A.; Pushkarev, A.S. On the Operational Conditions’ Effect on the Performance of an Anion Exchange Membrane Water Electrolyzer: Electrochemical Impedance Spectroscopy Study. Membranes 2023, 13, 192. https://doi.org/10.3390/membranes13020192
Pushkareva IV, Solovyev MA, Butrim SI, Kozlova MV, Simkin DA, Pushkarev AS. On the Operational Conditions’ Effect on the Performance of an Anion Exchange Membrane Water Electrolyzer: Electrochemical Impedance Spectroscopy Study. Membranes. 2023; 13(2):192. https://doi.org/10.3390/membranes13020192
Chicago/Turabian StylePushkareva, Irina V., Maksim A. Solovyev, Sergey I. Butrim, Margarita V. Kozlova, Dmitri A. Simkin, and Artem S. Pushkarev. 2023. "On the Operational Conditions’ Effect on the Performance of an Anion Exchange Membrane Water Electrolyzer: Electrochemical Impedance Spectroscopy Study" Membranes 13, no. 2: 192. https://doi.org/10.3390/membranes13020192