
Modification of Cellulose Acetate Microfiltration Membranes Using Graphene Oxide–Polyethyleneimine for Enhanced Dye Rejection
 and
and 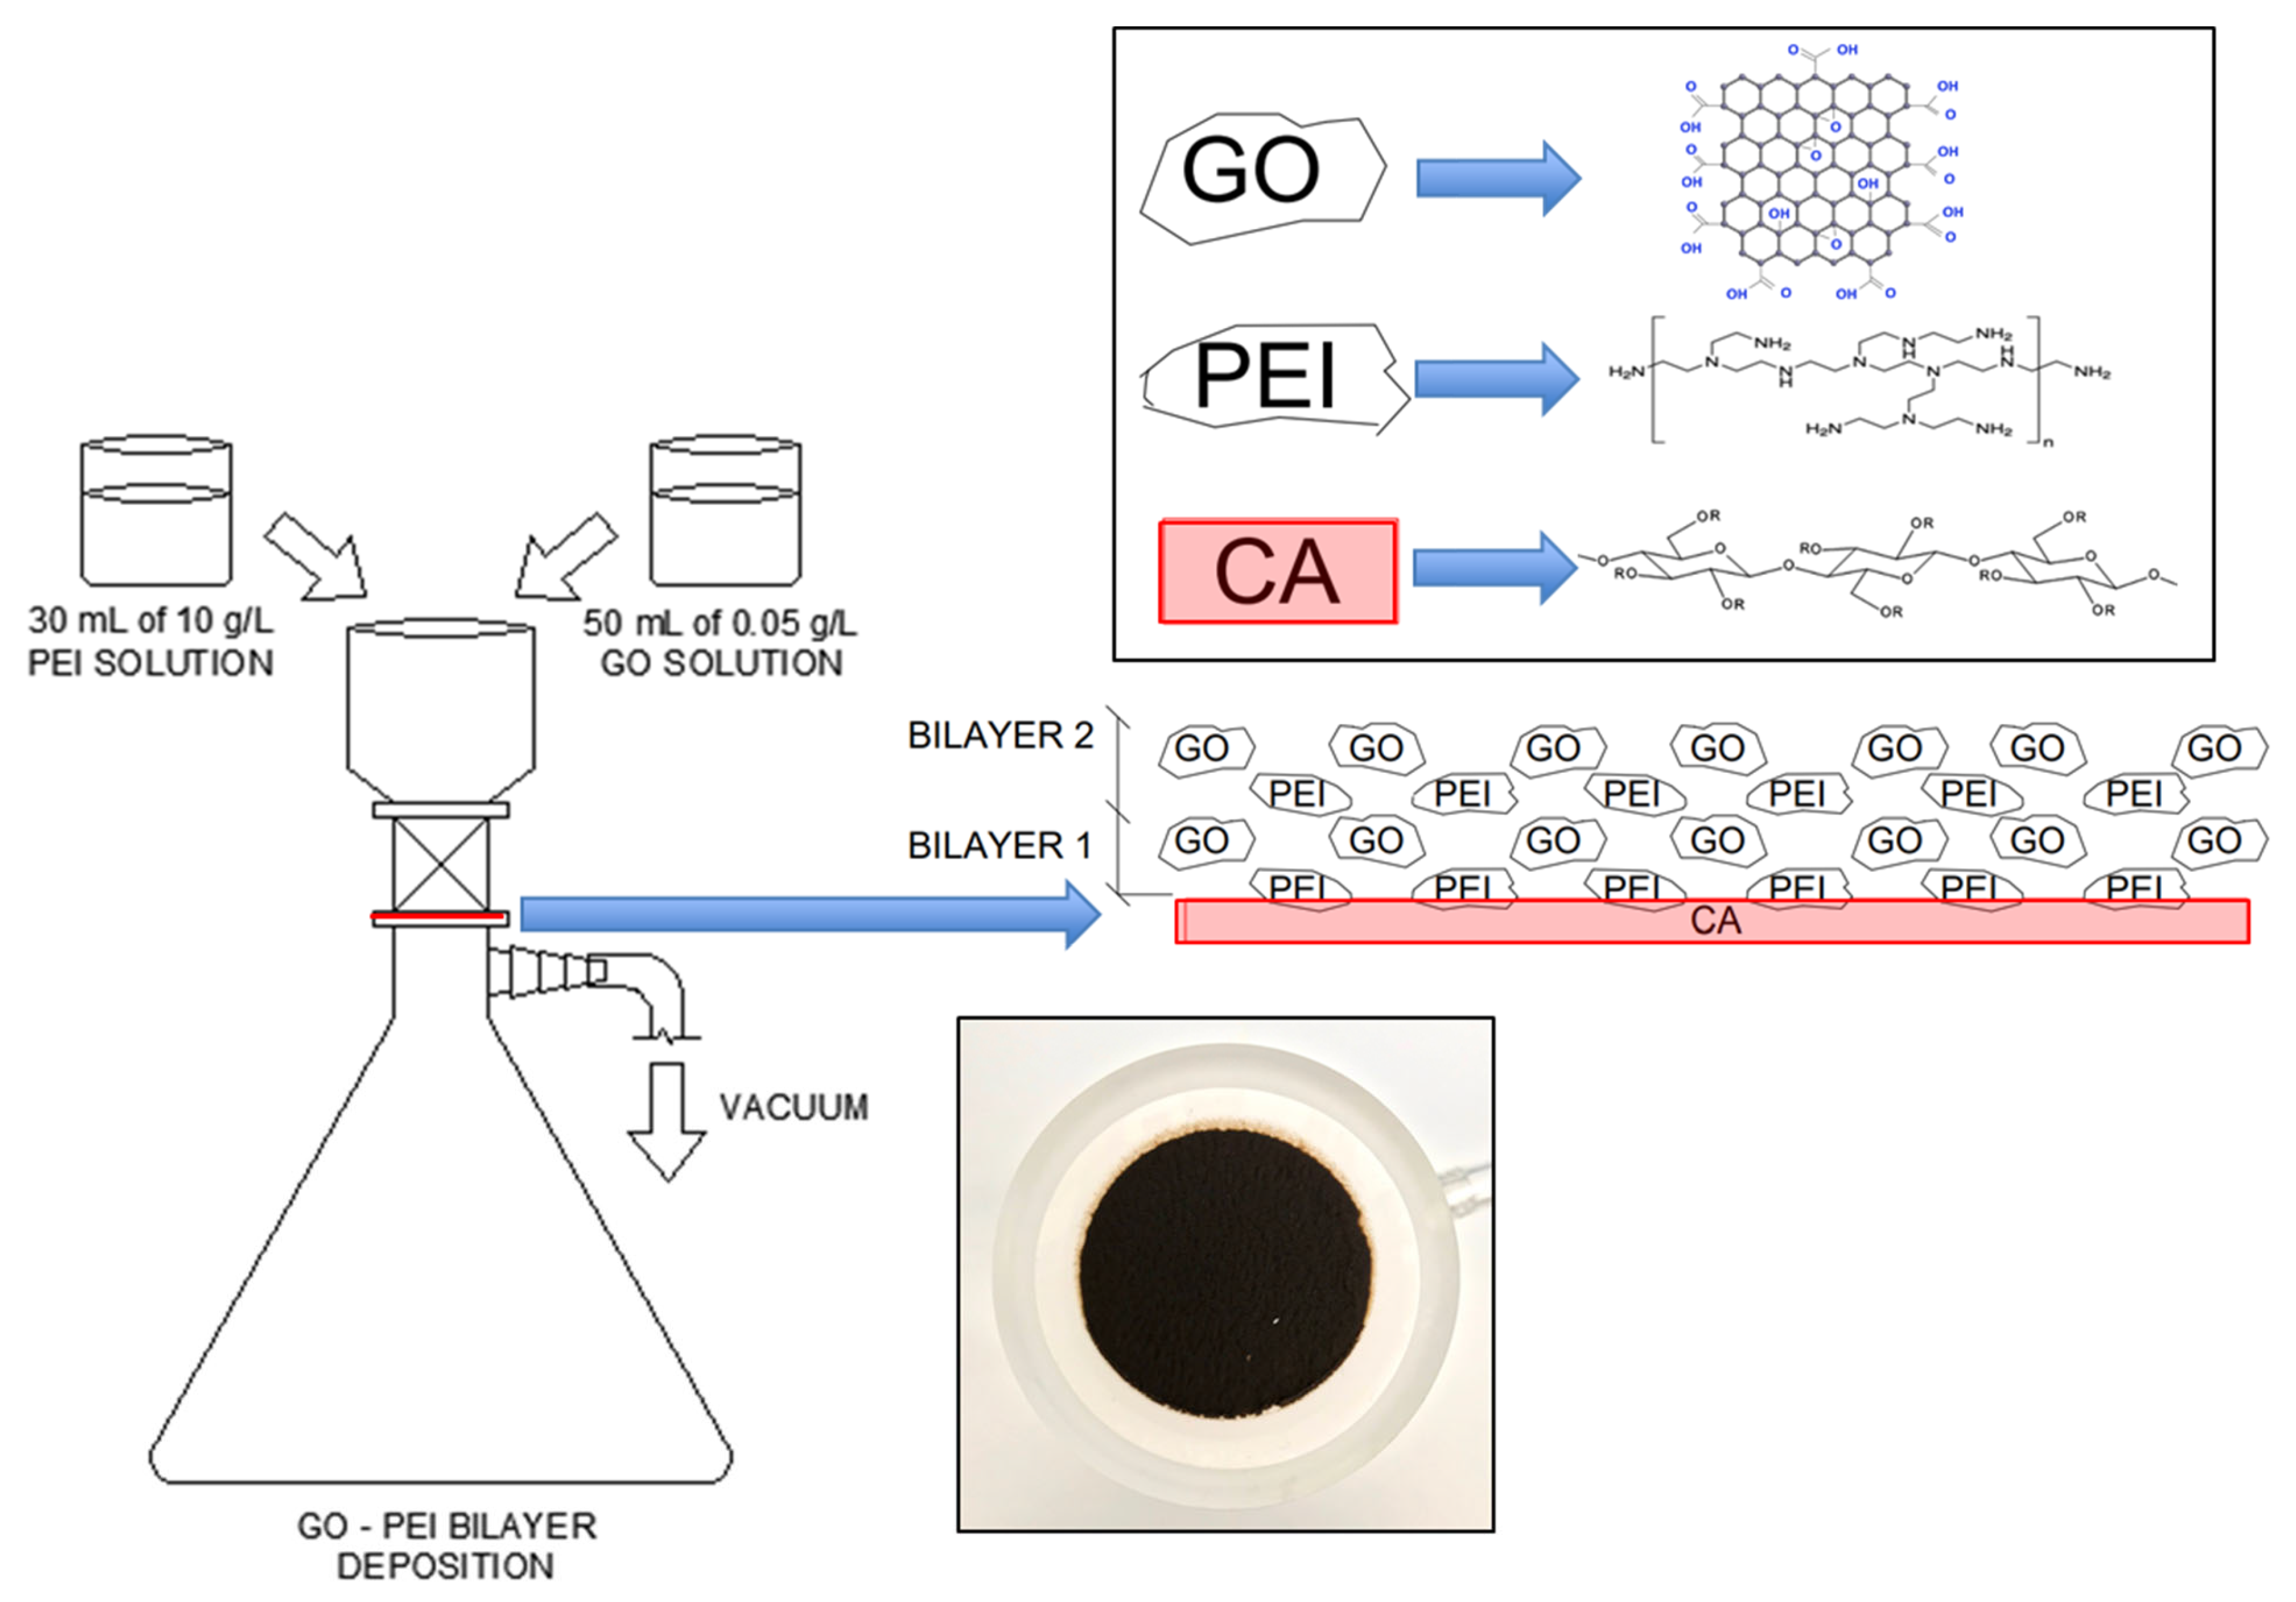
Abstract
:1. Introduction
2. Materials and Methods
2.1. Chemicals and Materials
2.2. Membrane Modification
2.3. Membrane Characterization
2.3.1. Fourier Transform Infrared Spectroscopy, X-ray Diffraction, Field Emission Scanning Electron Microscopy Analysis, and Zeta Potential Measurement
2.3.2. Surface and Thickness Analysis, Water Contact Angle Measurement
2.3.3. Membrane Selectivity, Physical Stress Tests
2.4. Membrane Experiments
2.4.1. Single-Solute Rejection Experiments
2.4.2. Multisolute Rejection Experiments
3. Results and Discussion
3.1. Membrane Characterizations
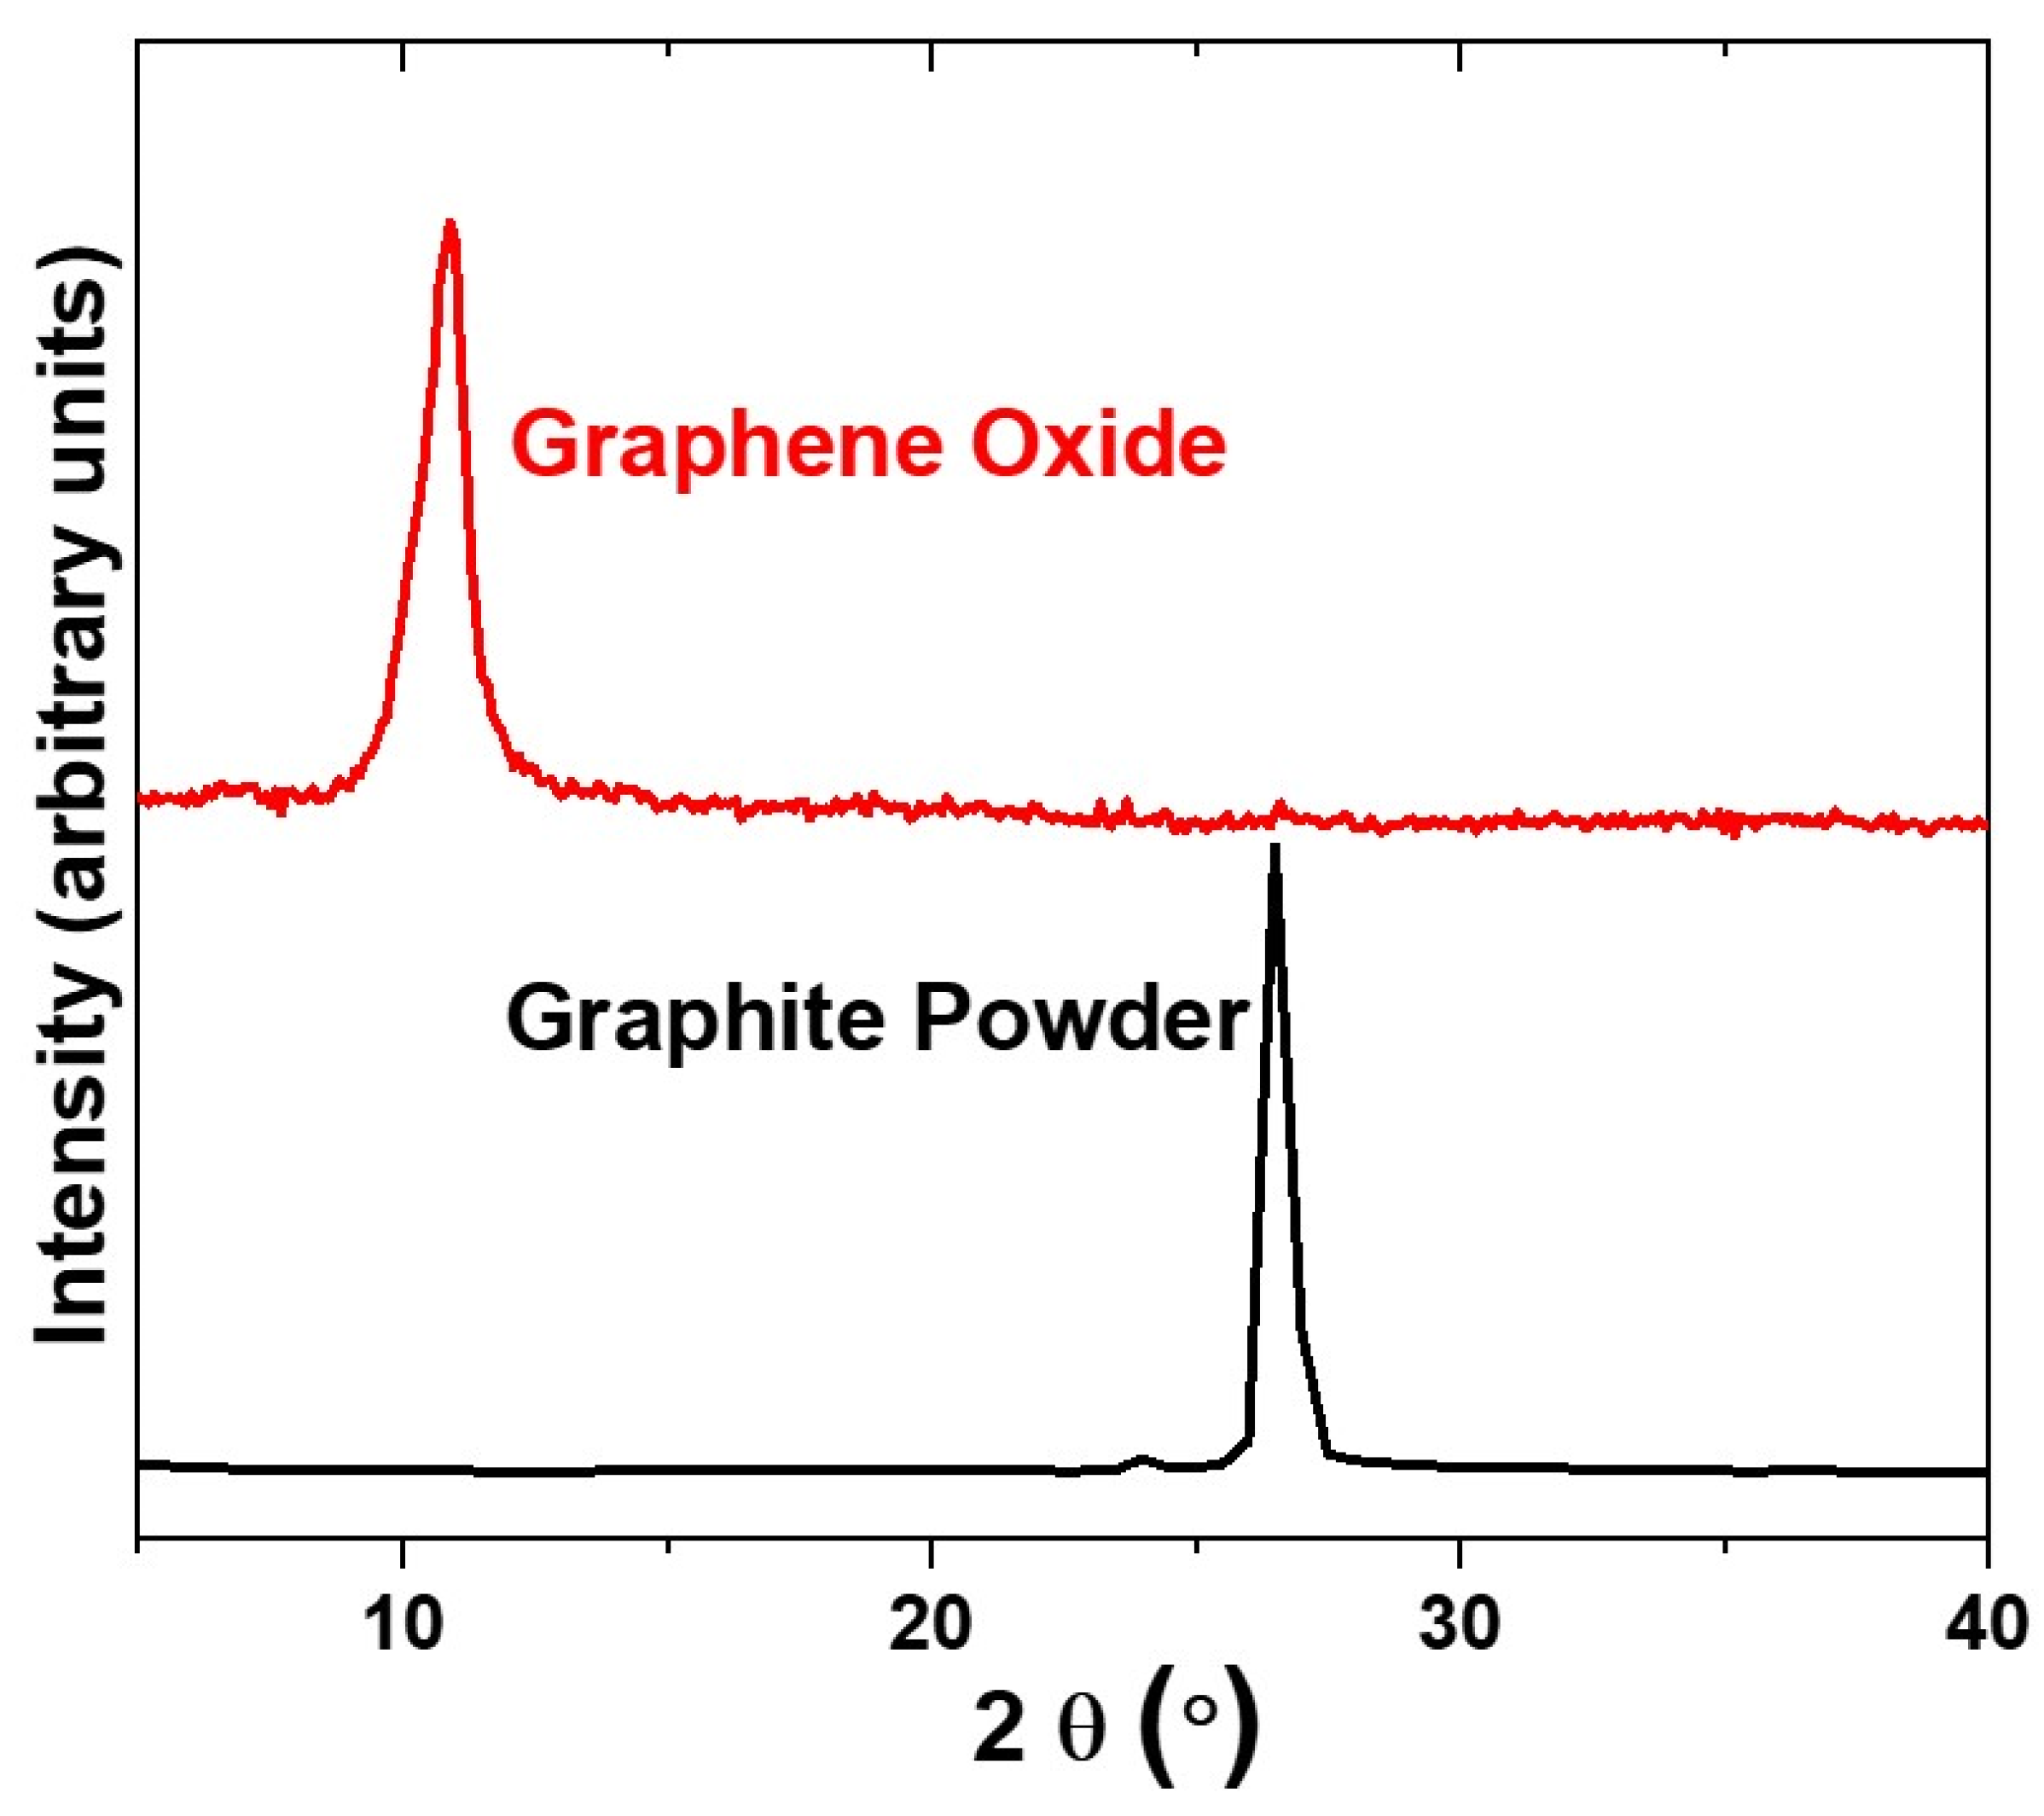
3.1.1. Graphene Oxide Characterizations
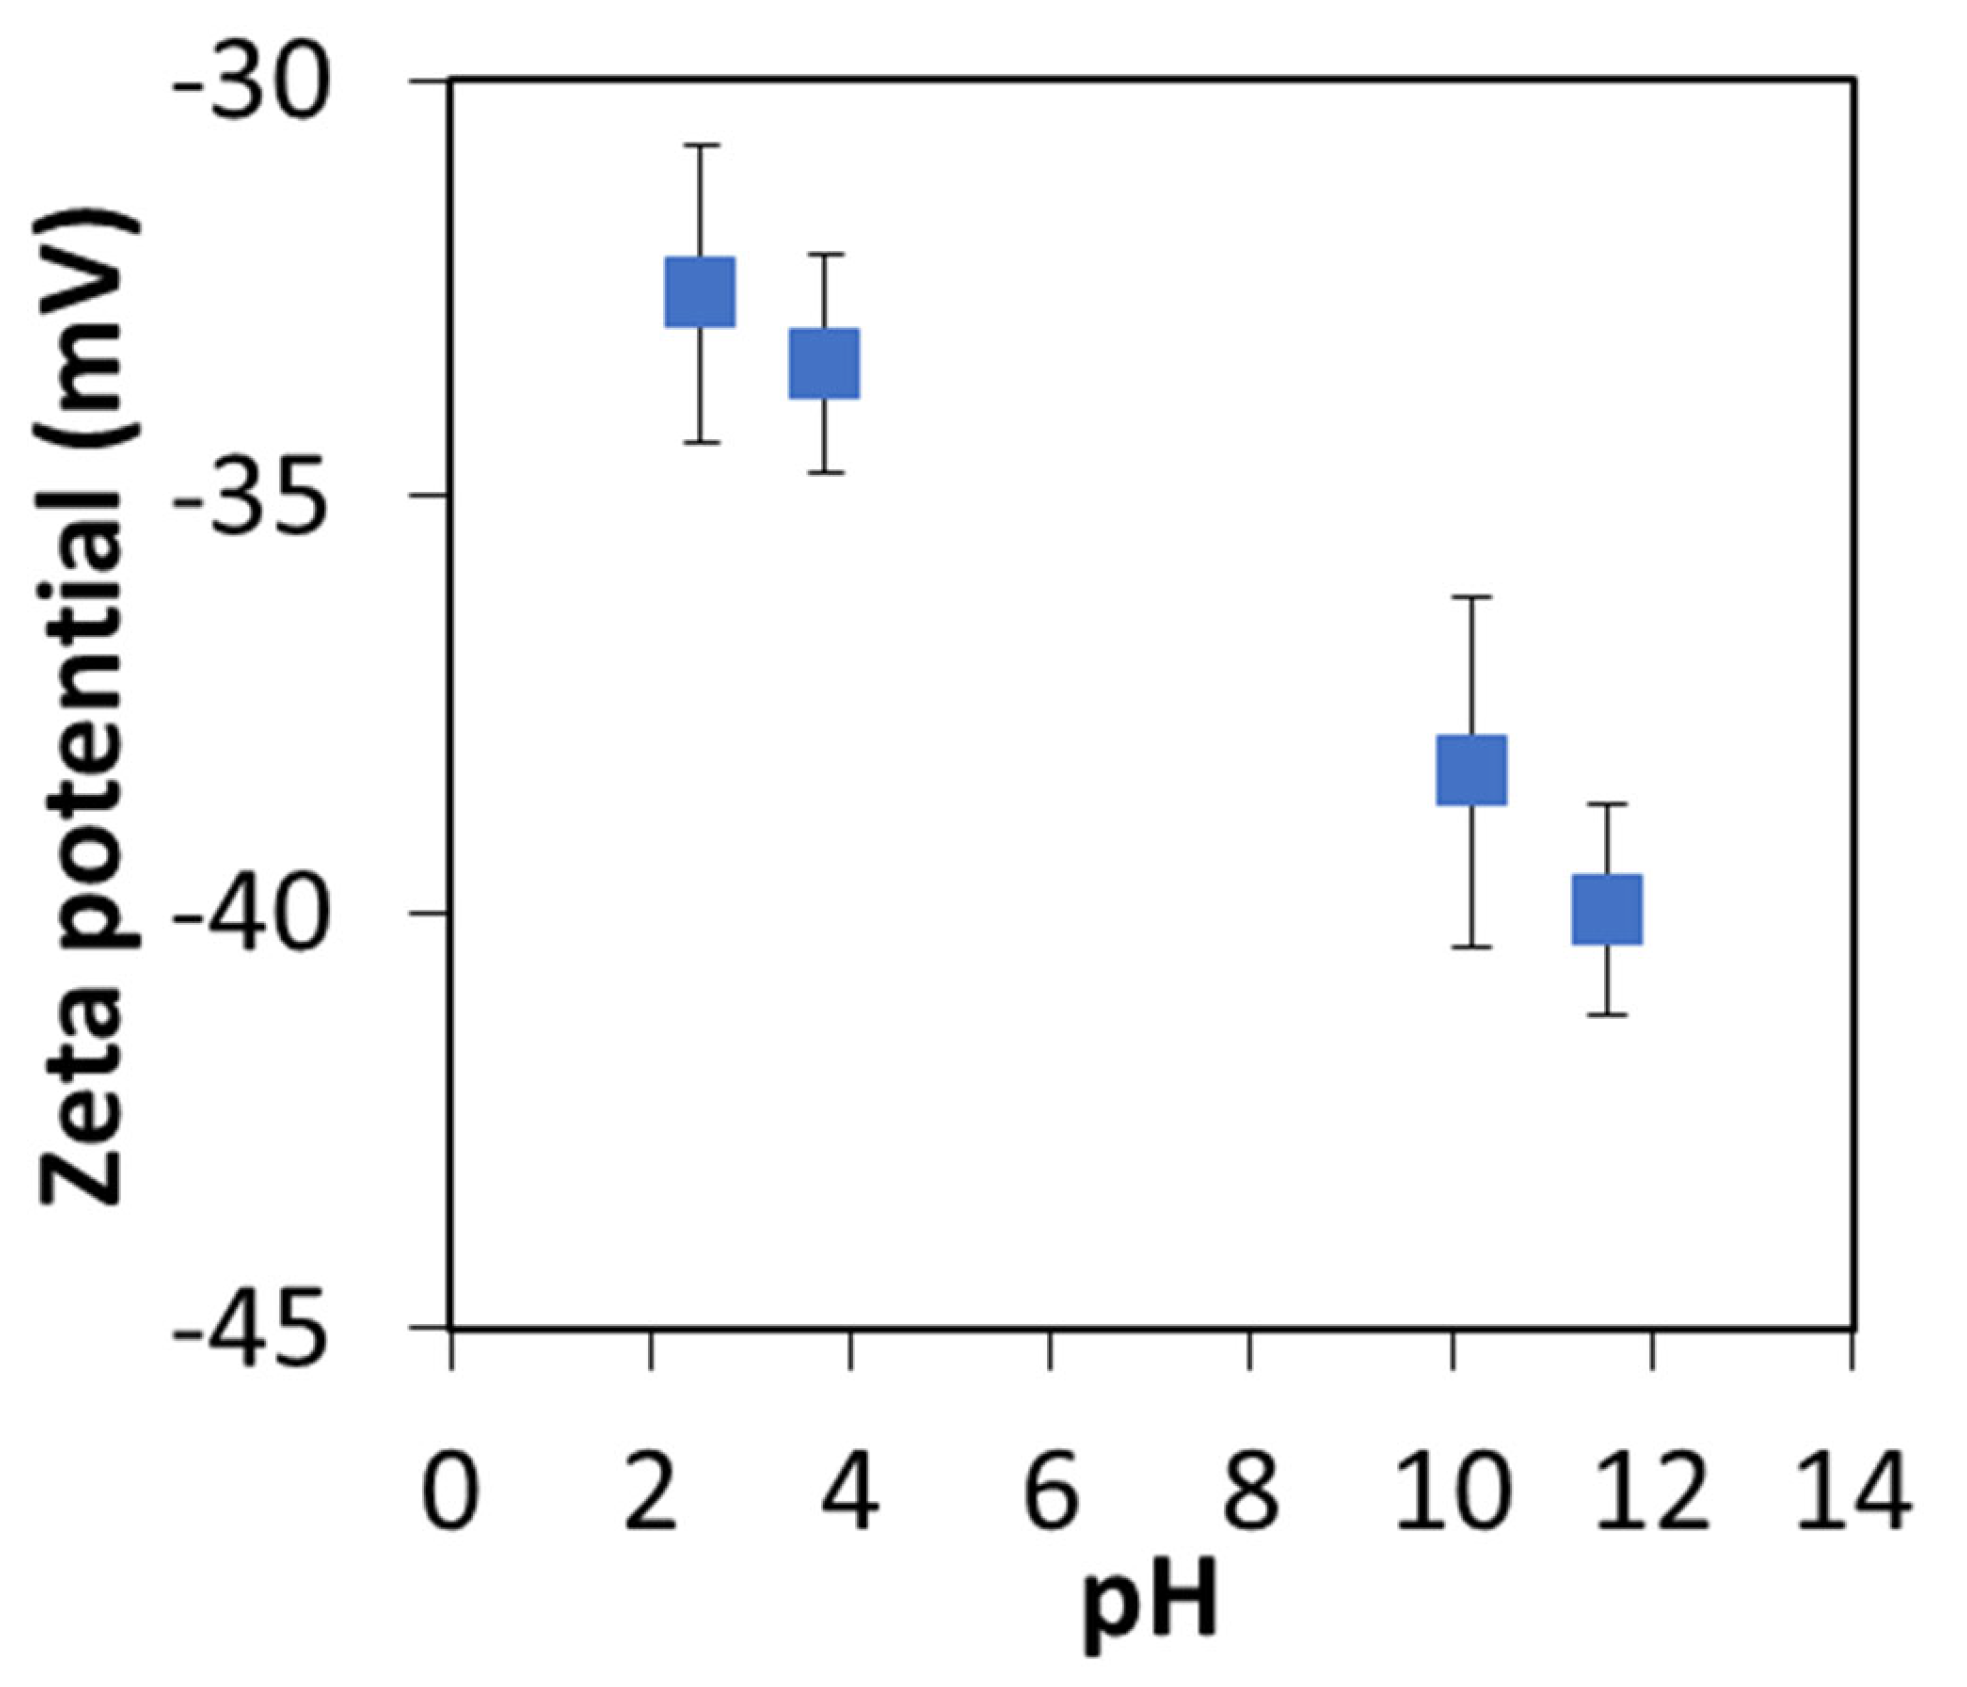
3.1.2. Zeta Potential Measurement
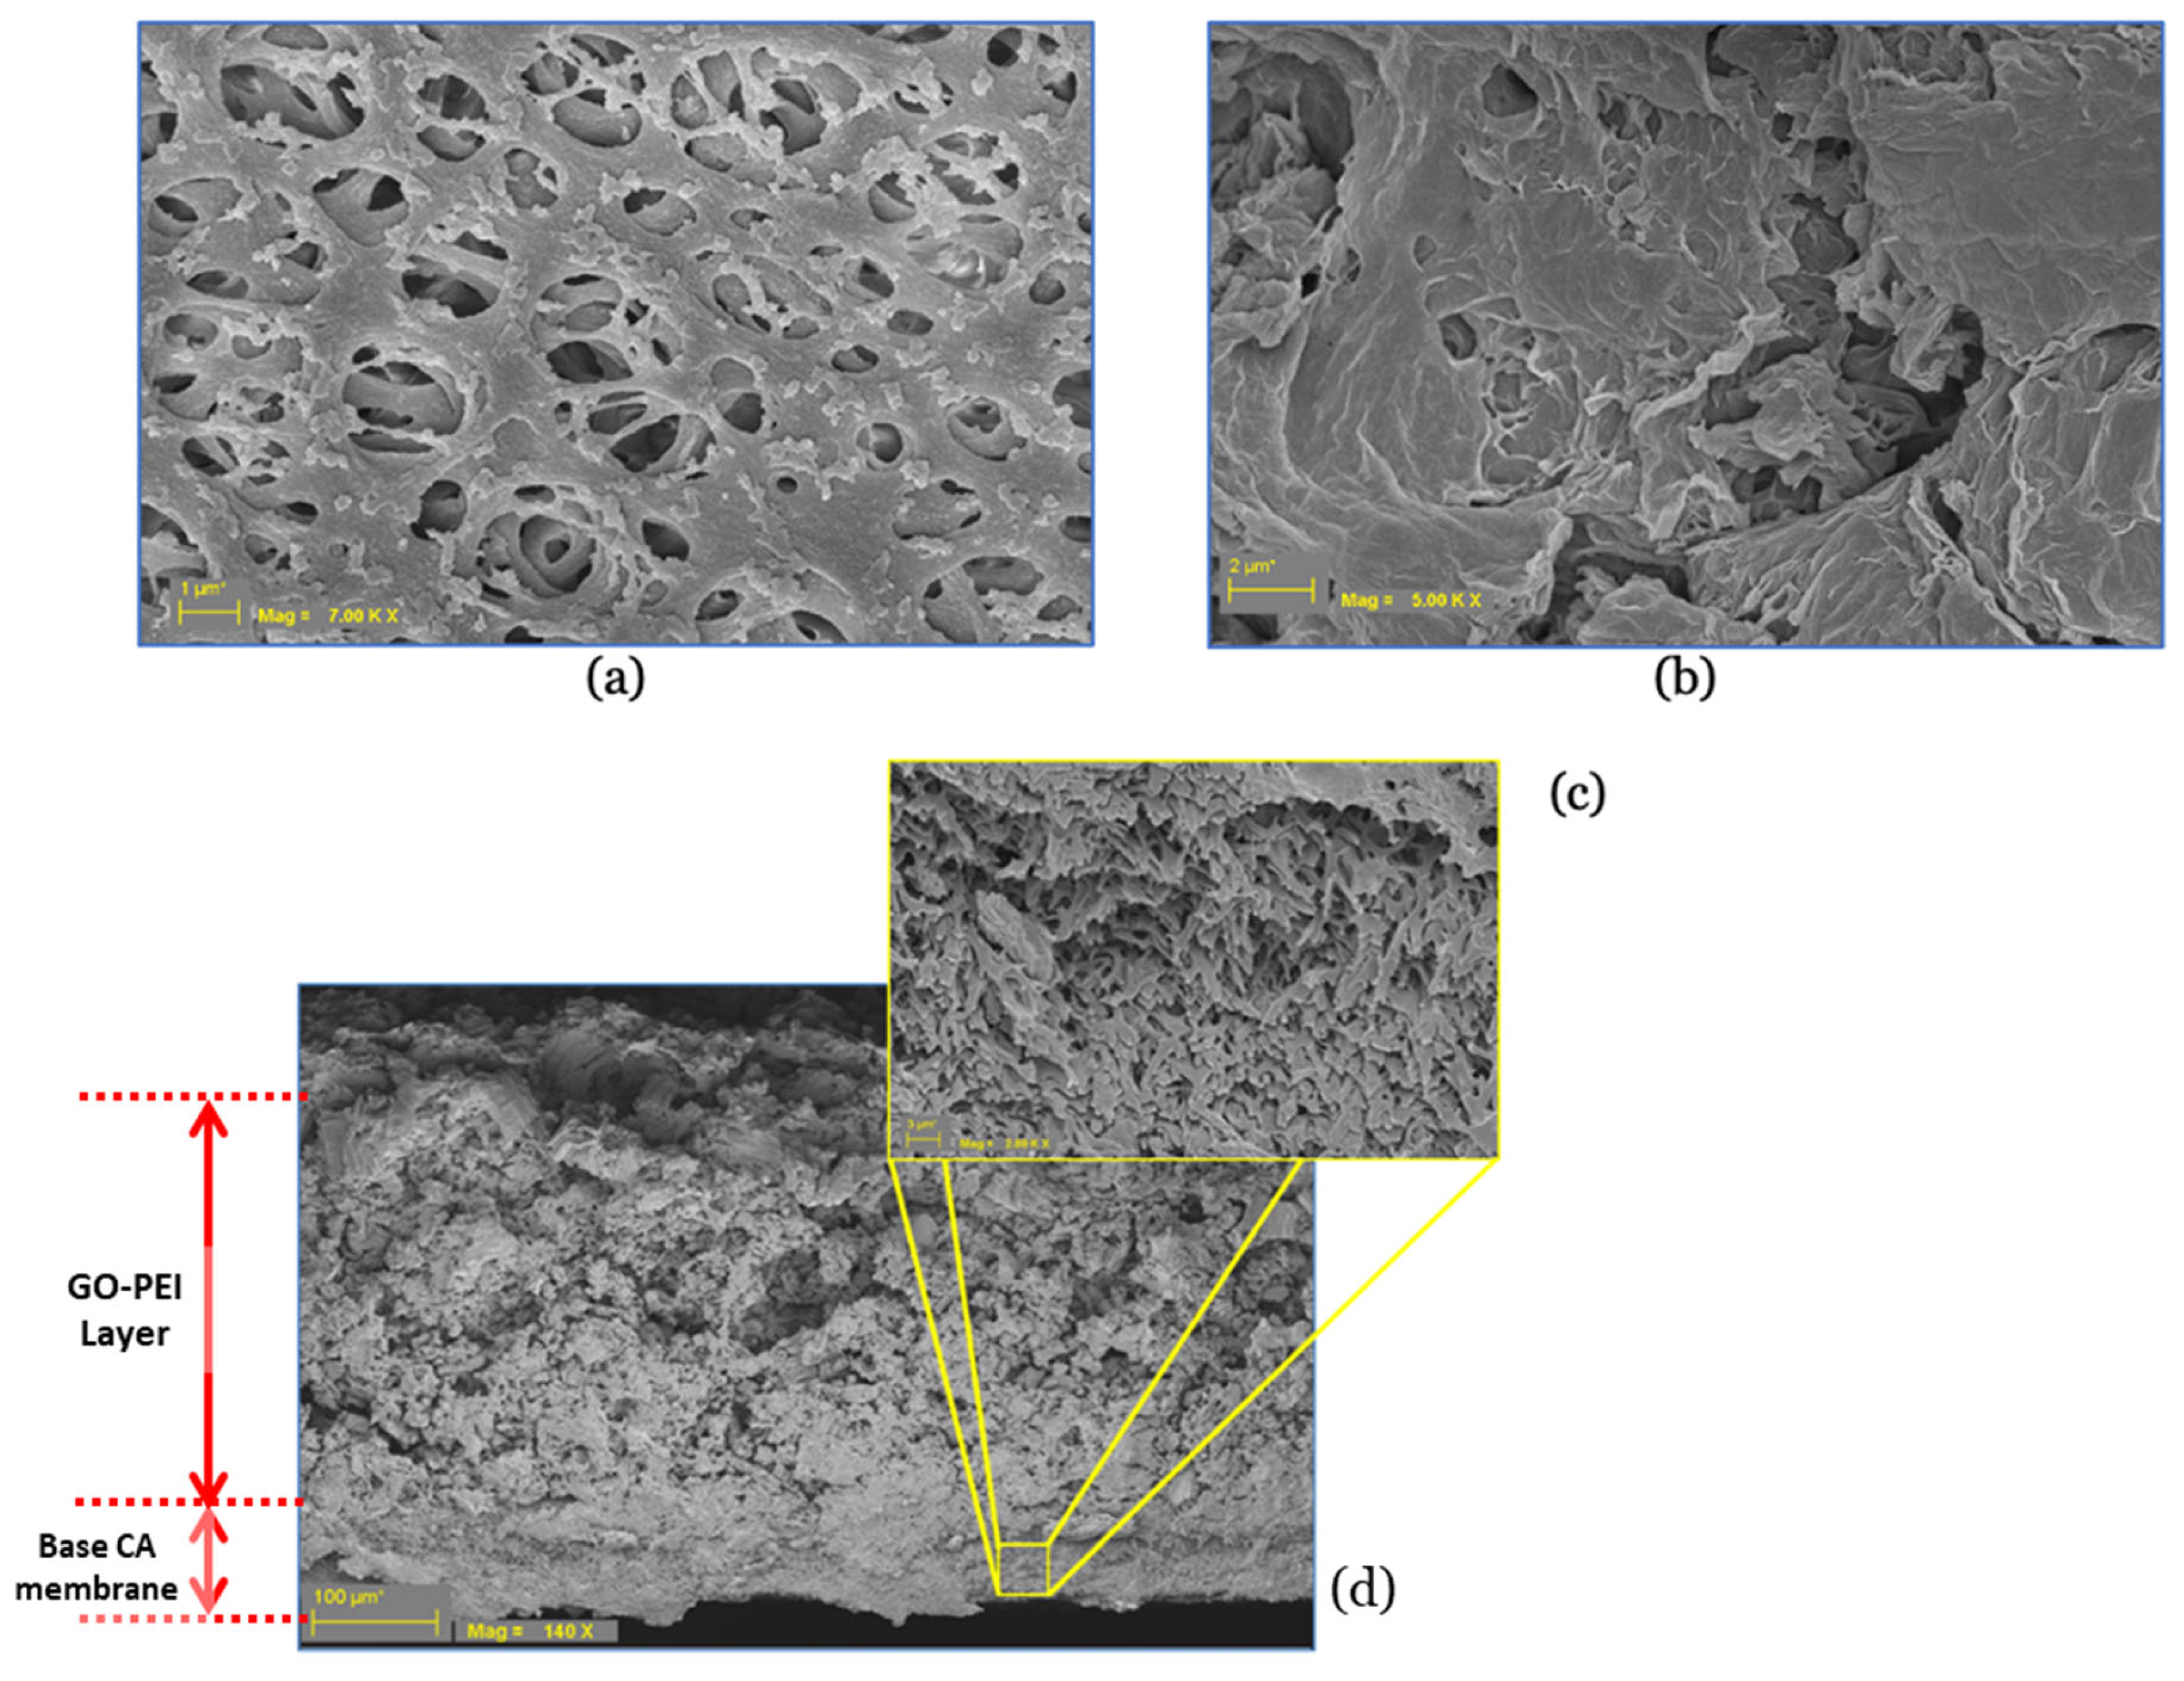
3.1.3. Surface Morphology and Hydrophilicity of GO–PEI-Modified CA Membrane
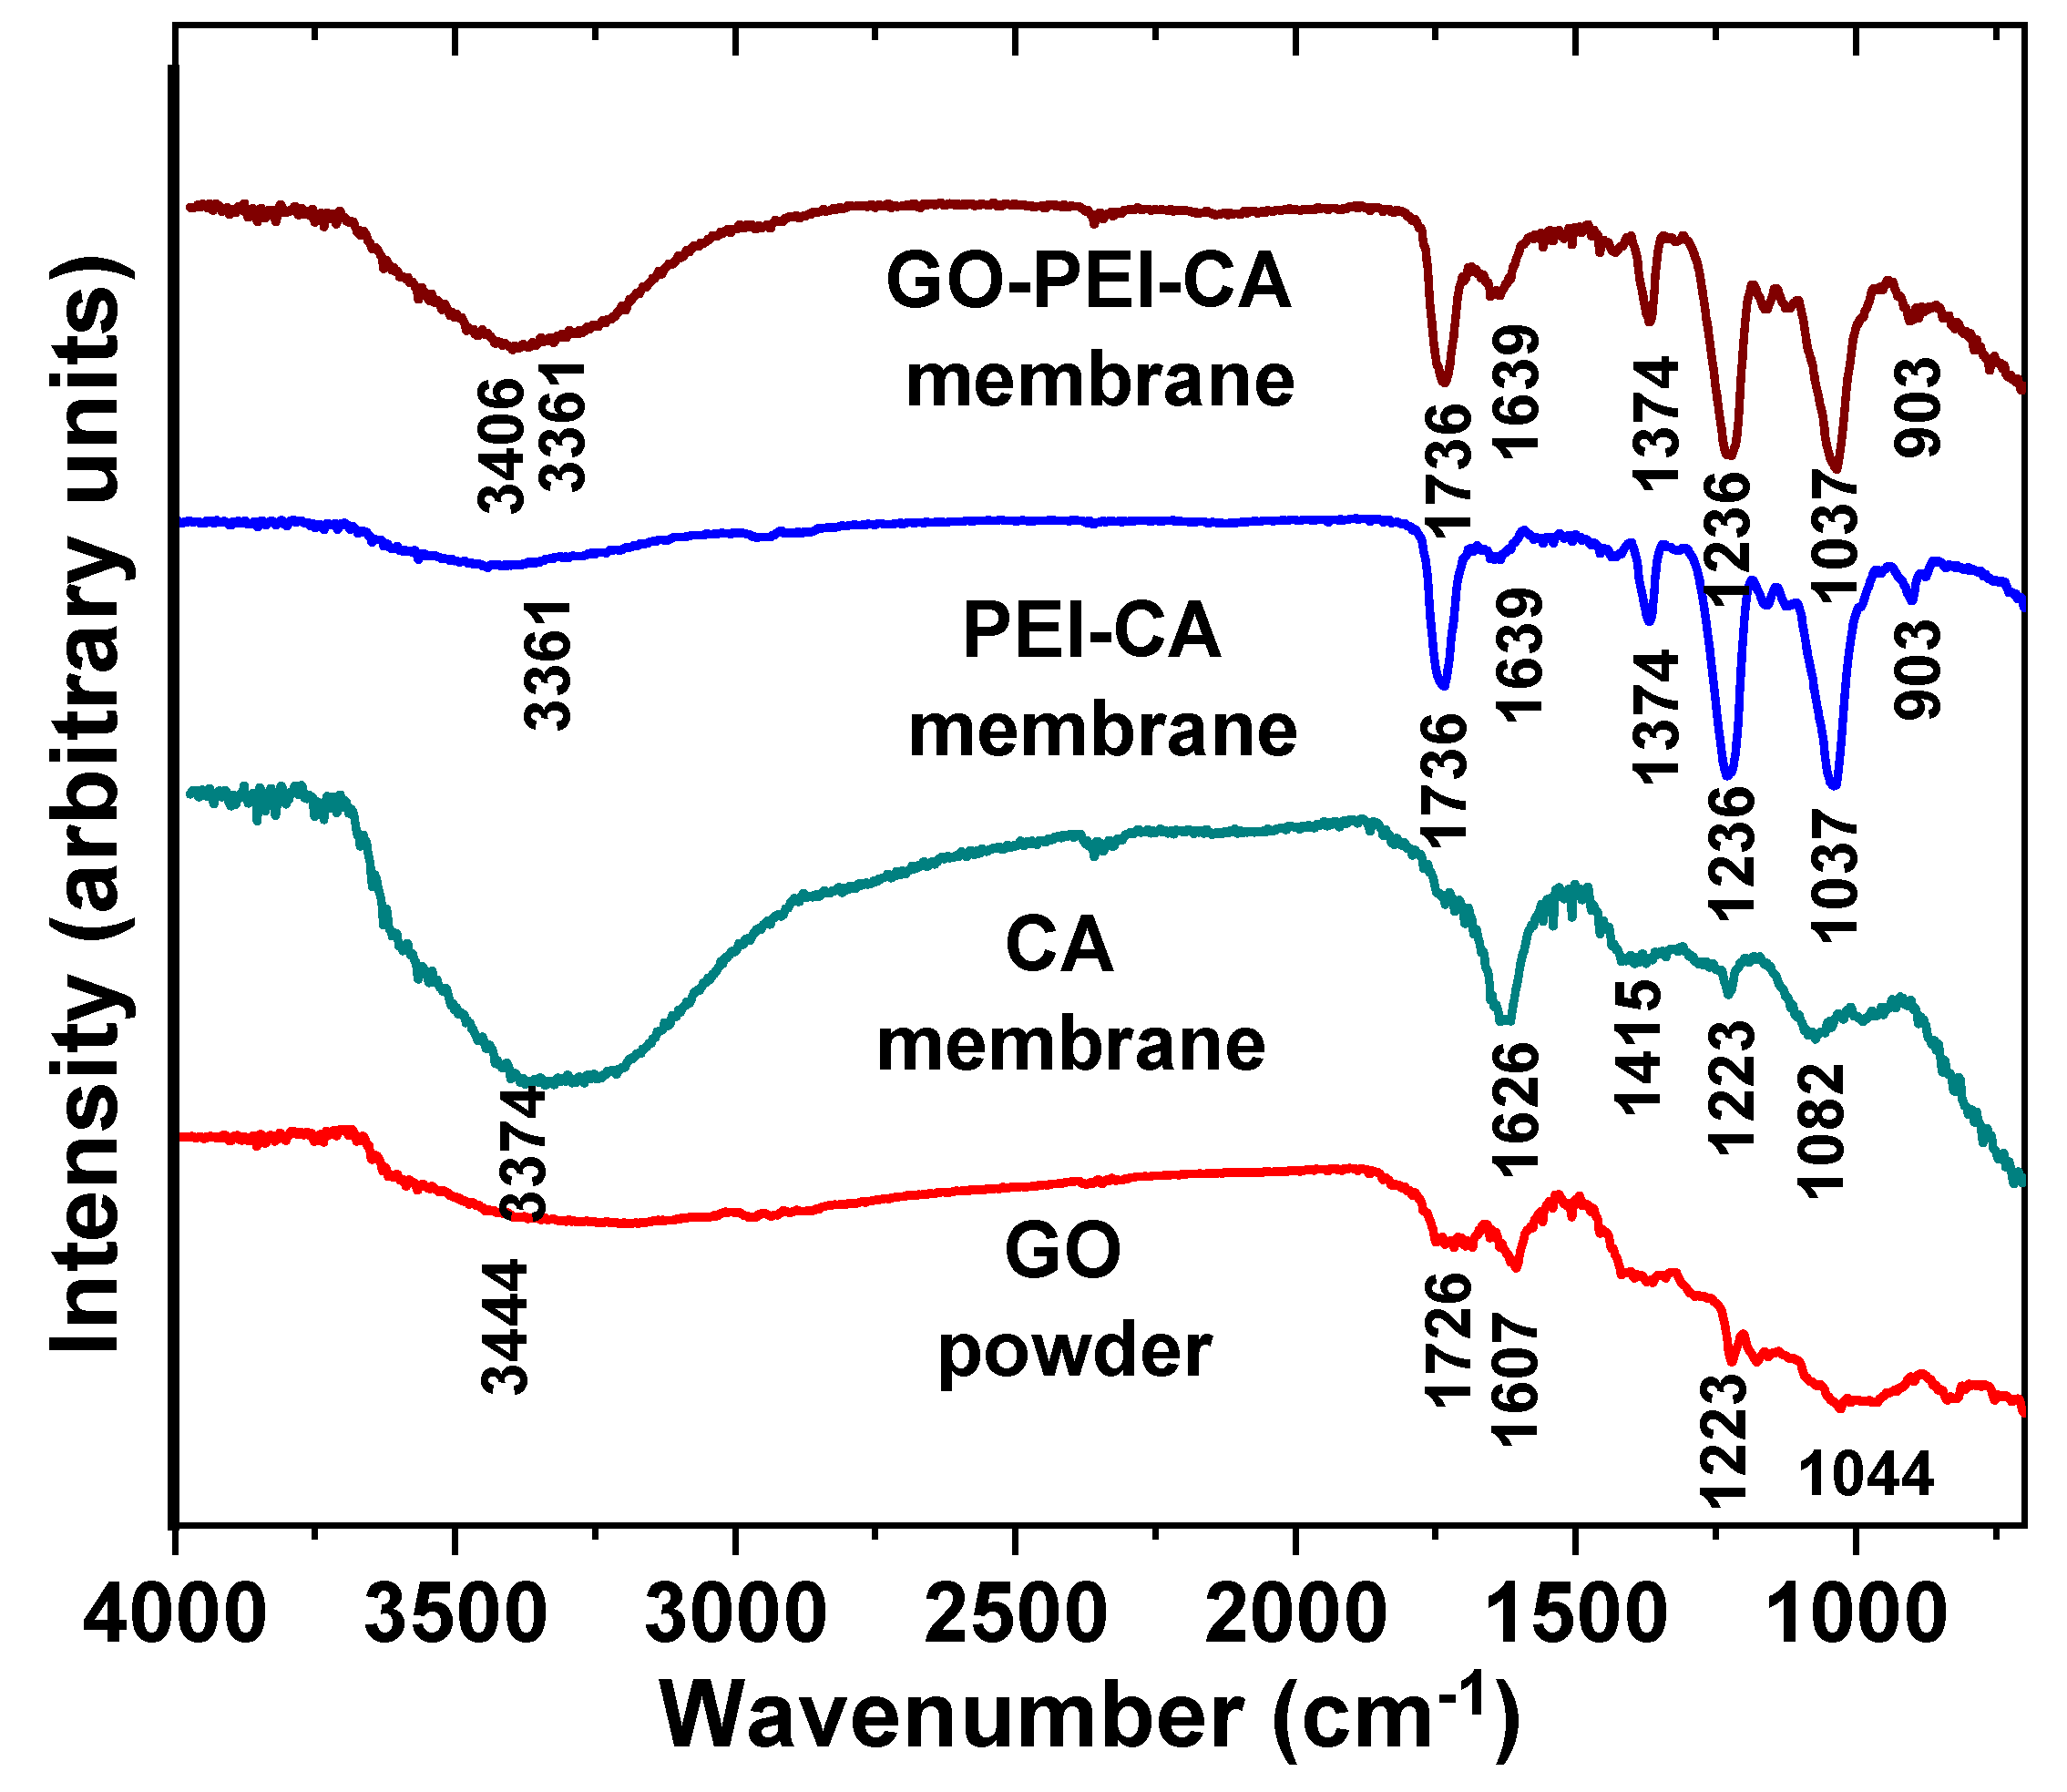
3.1.4. Fourier Transform Infrared (FTIR) Spectroscopy Analysis
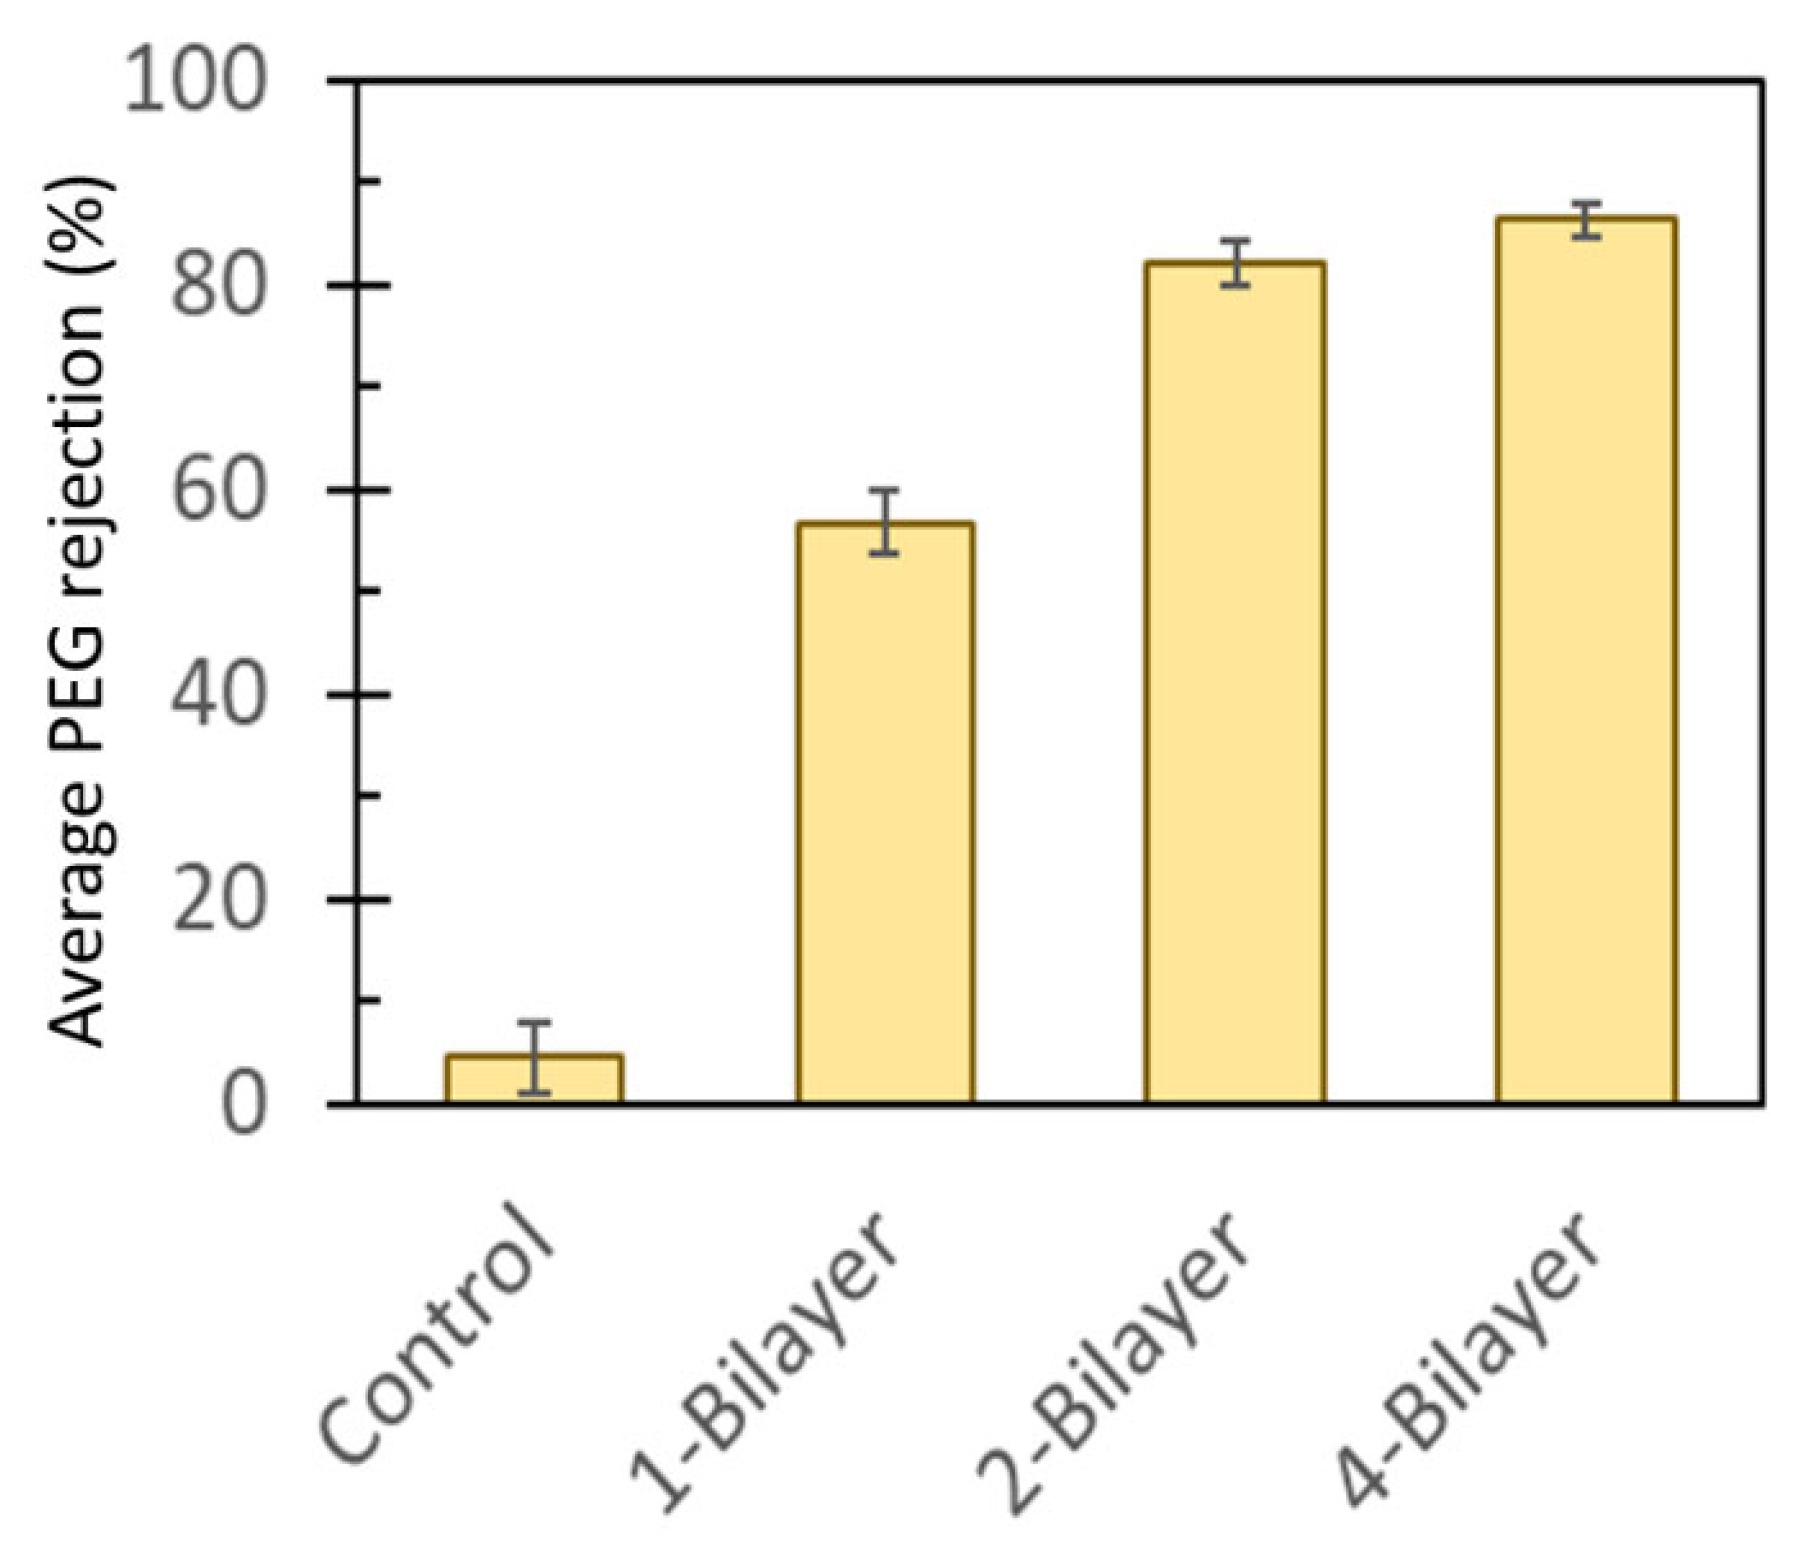
3.2. Selectivity of GO–PEI-Modified CA Membranes
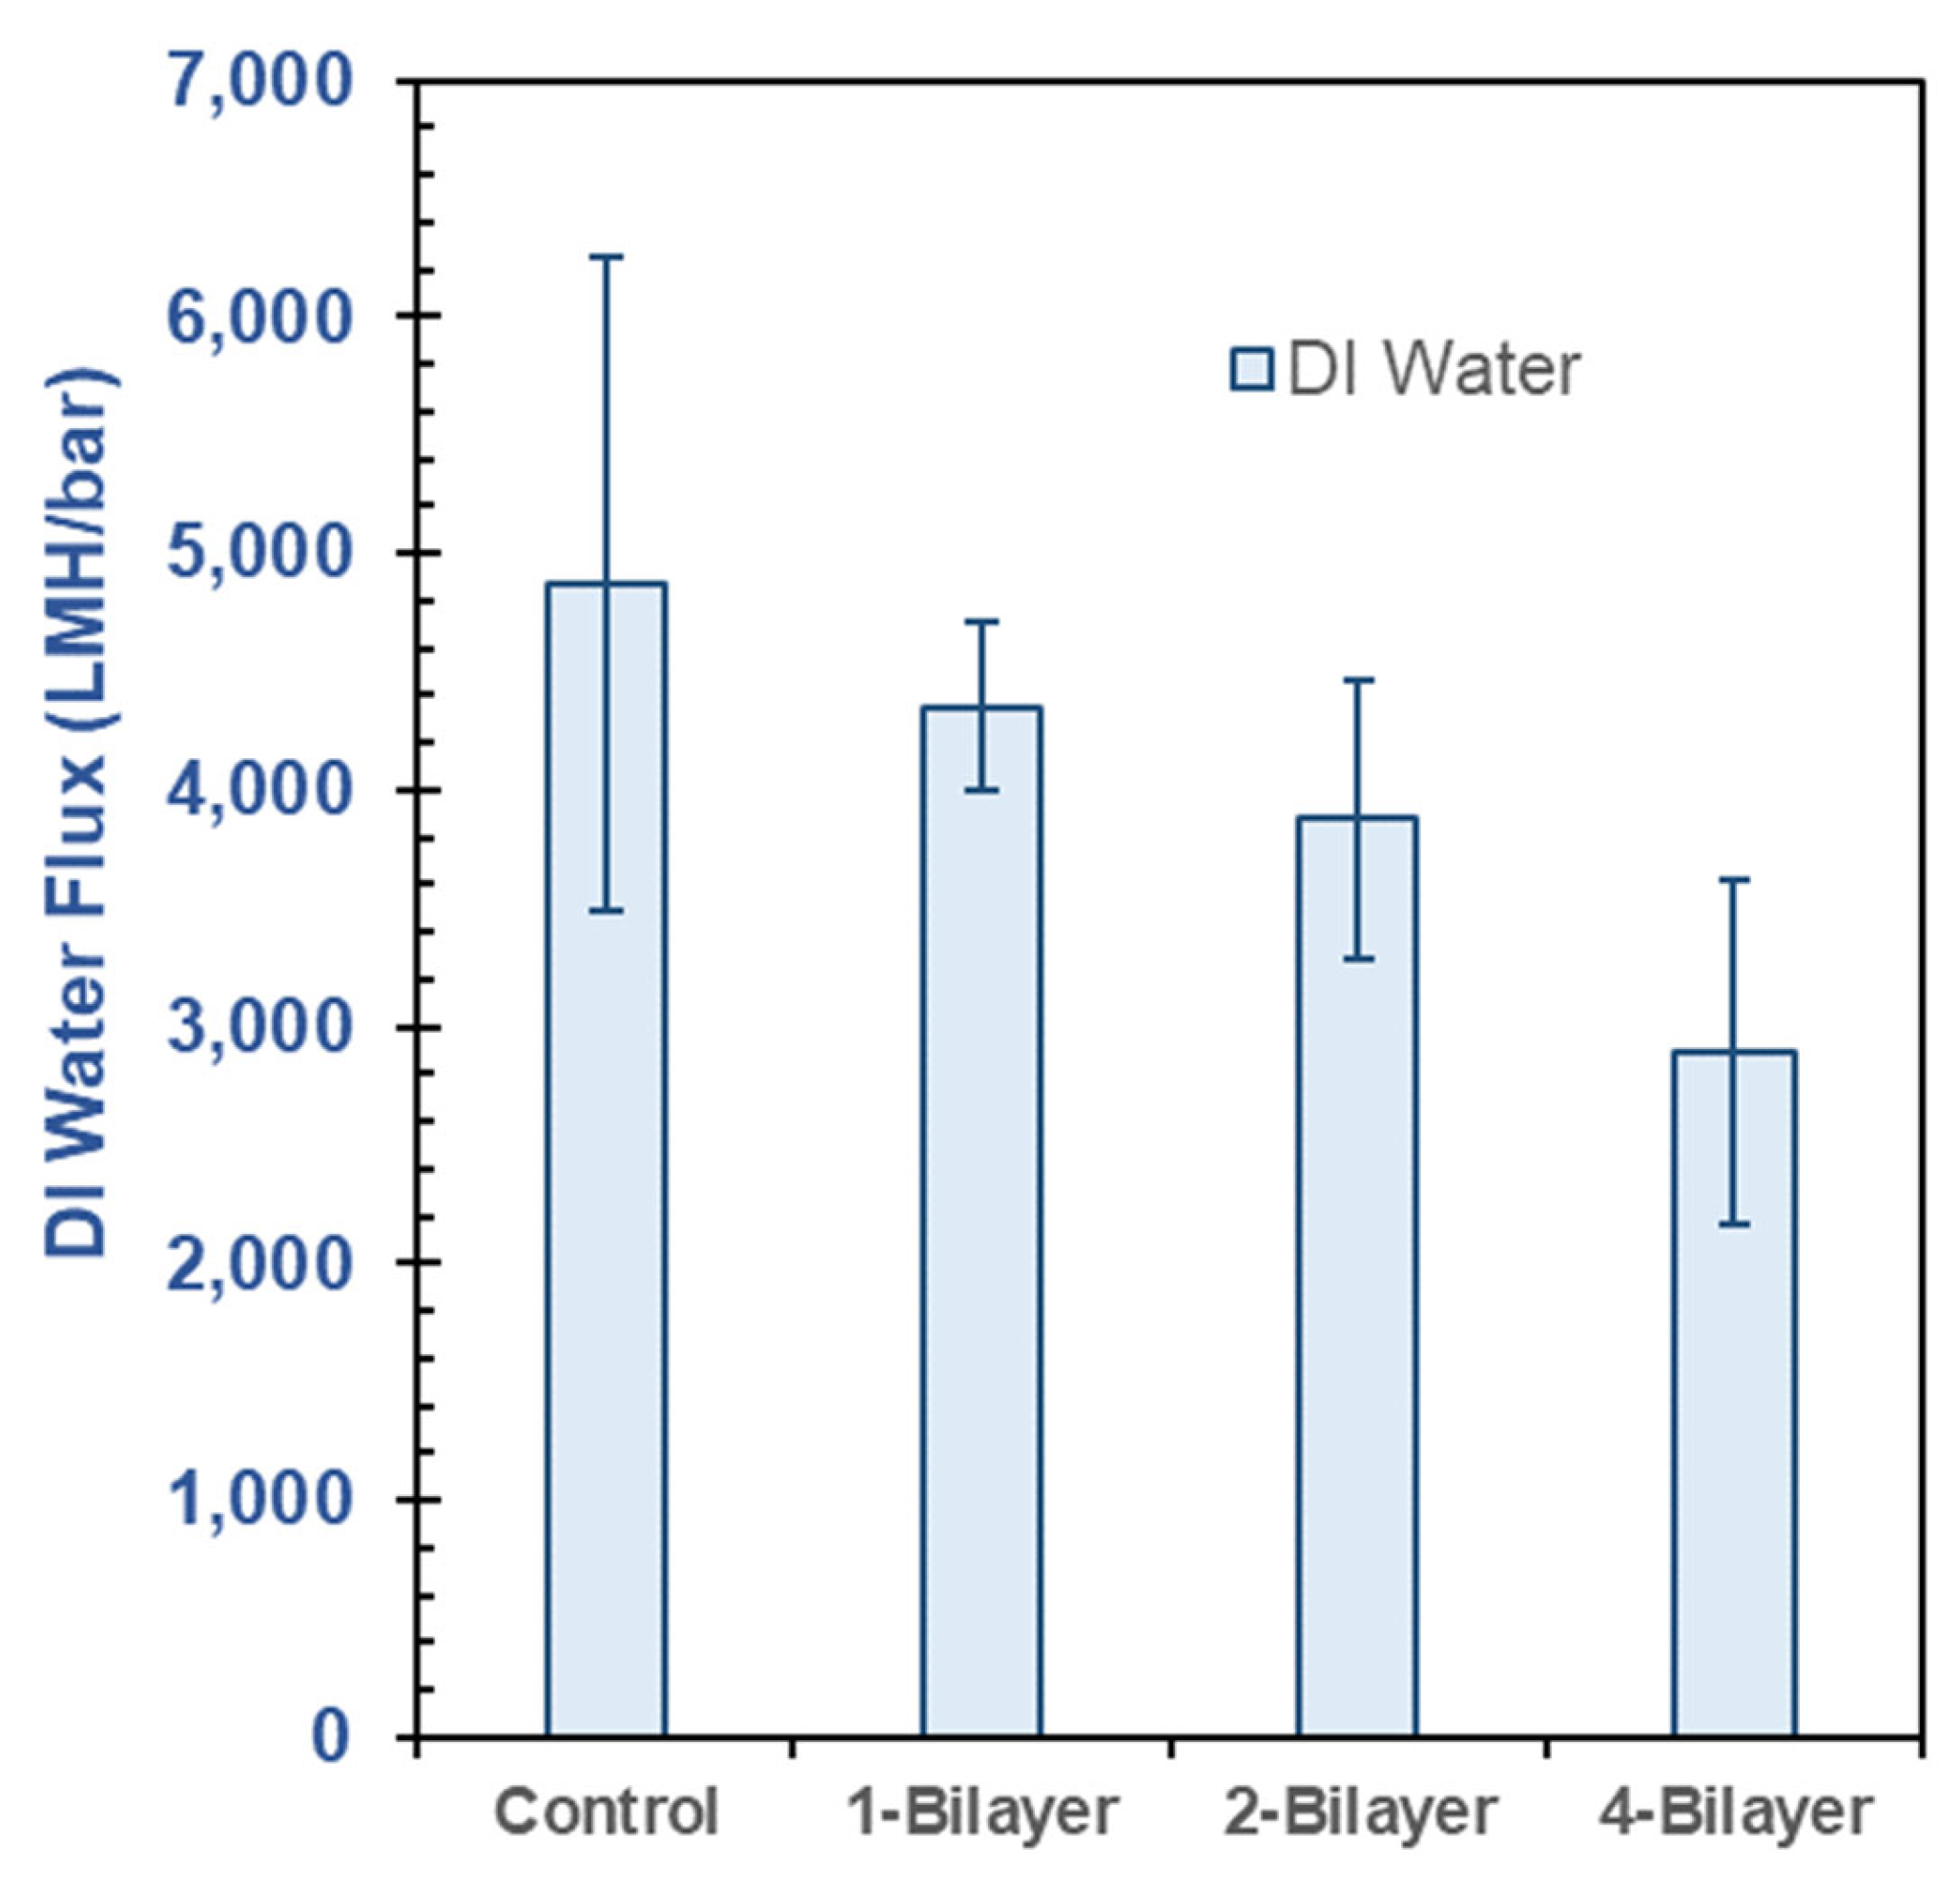
3.3. DI Water Flux in Pristine CA and GO–PEI-Modified CA Membranes
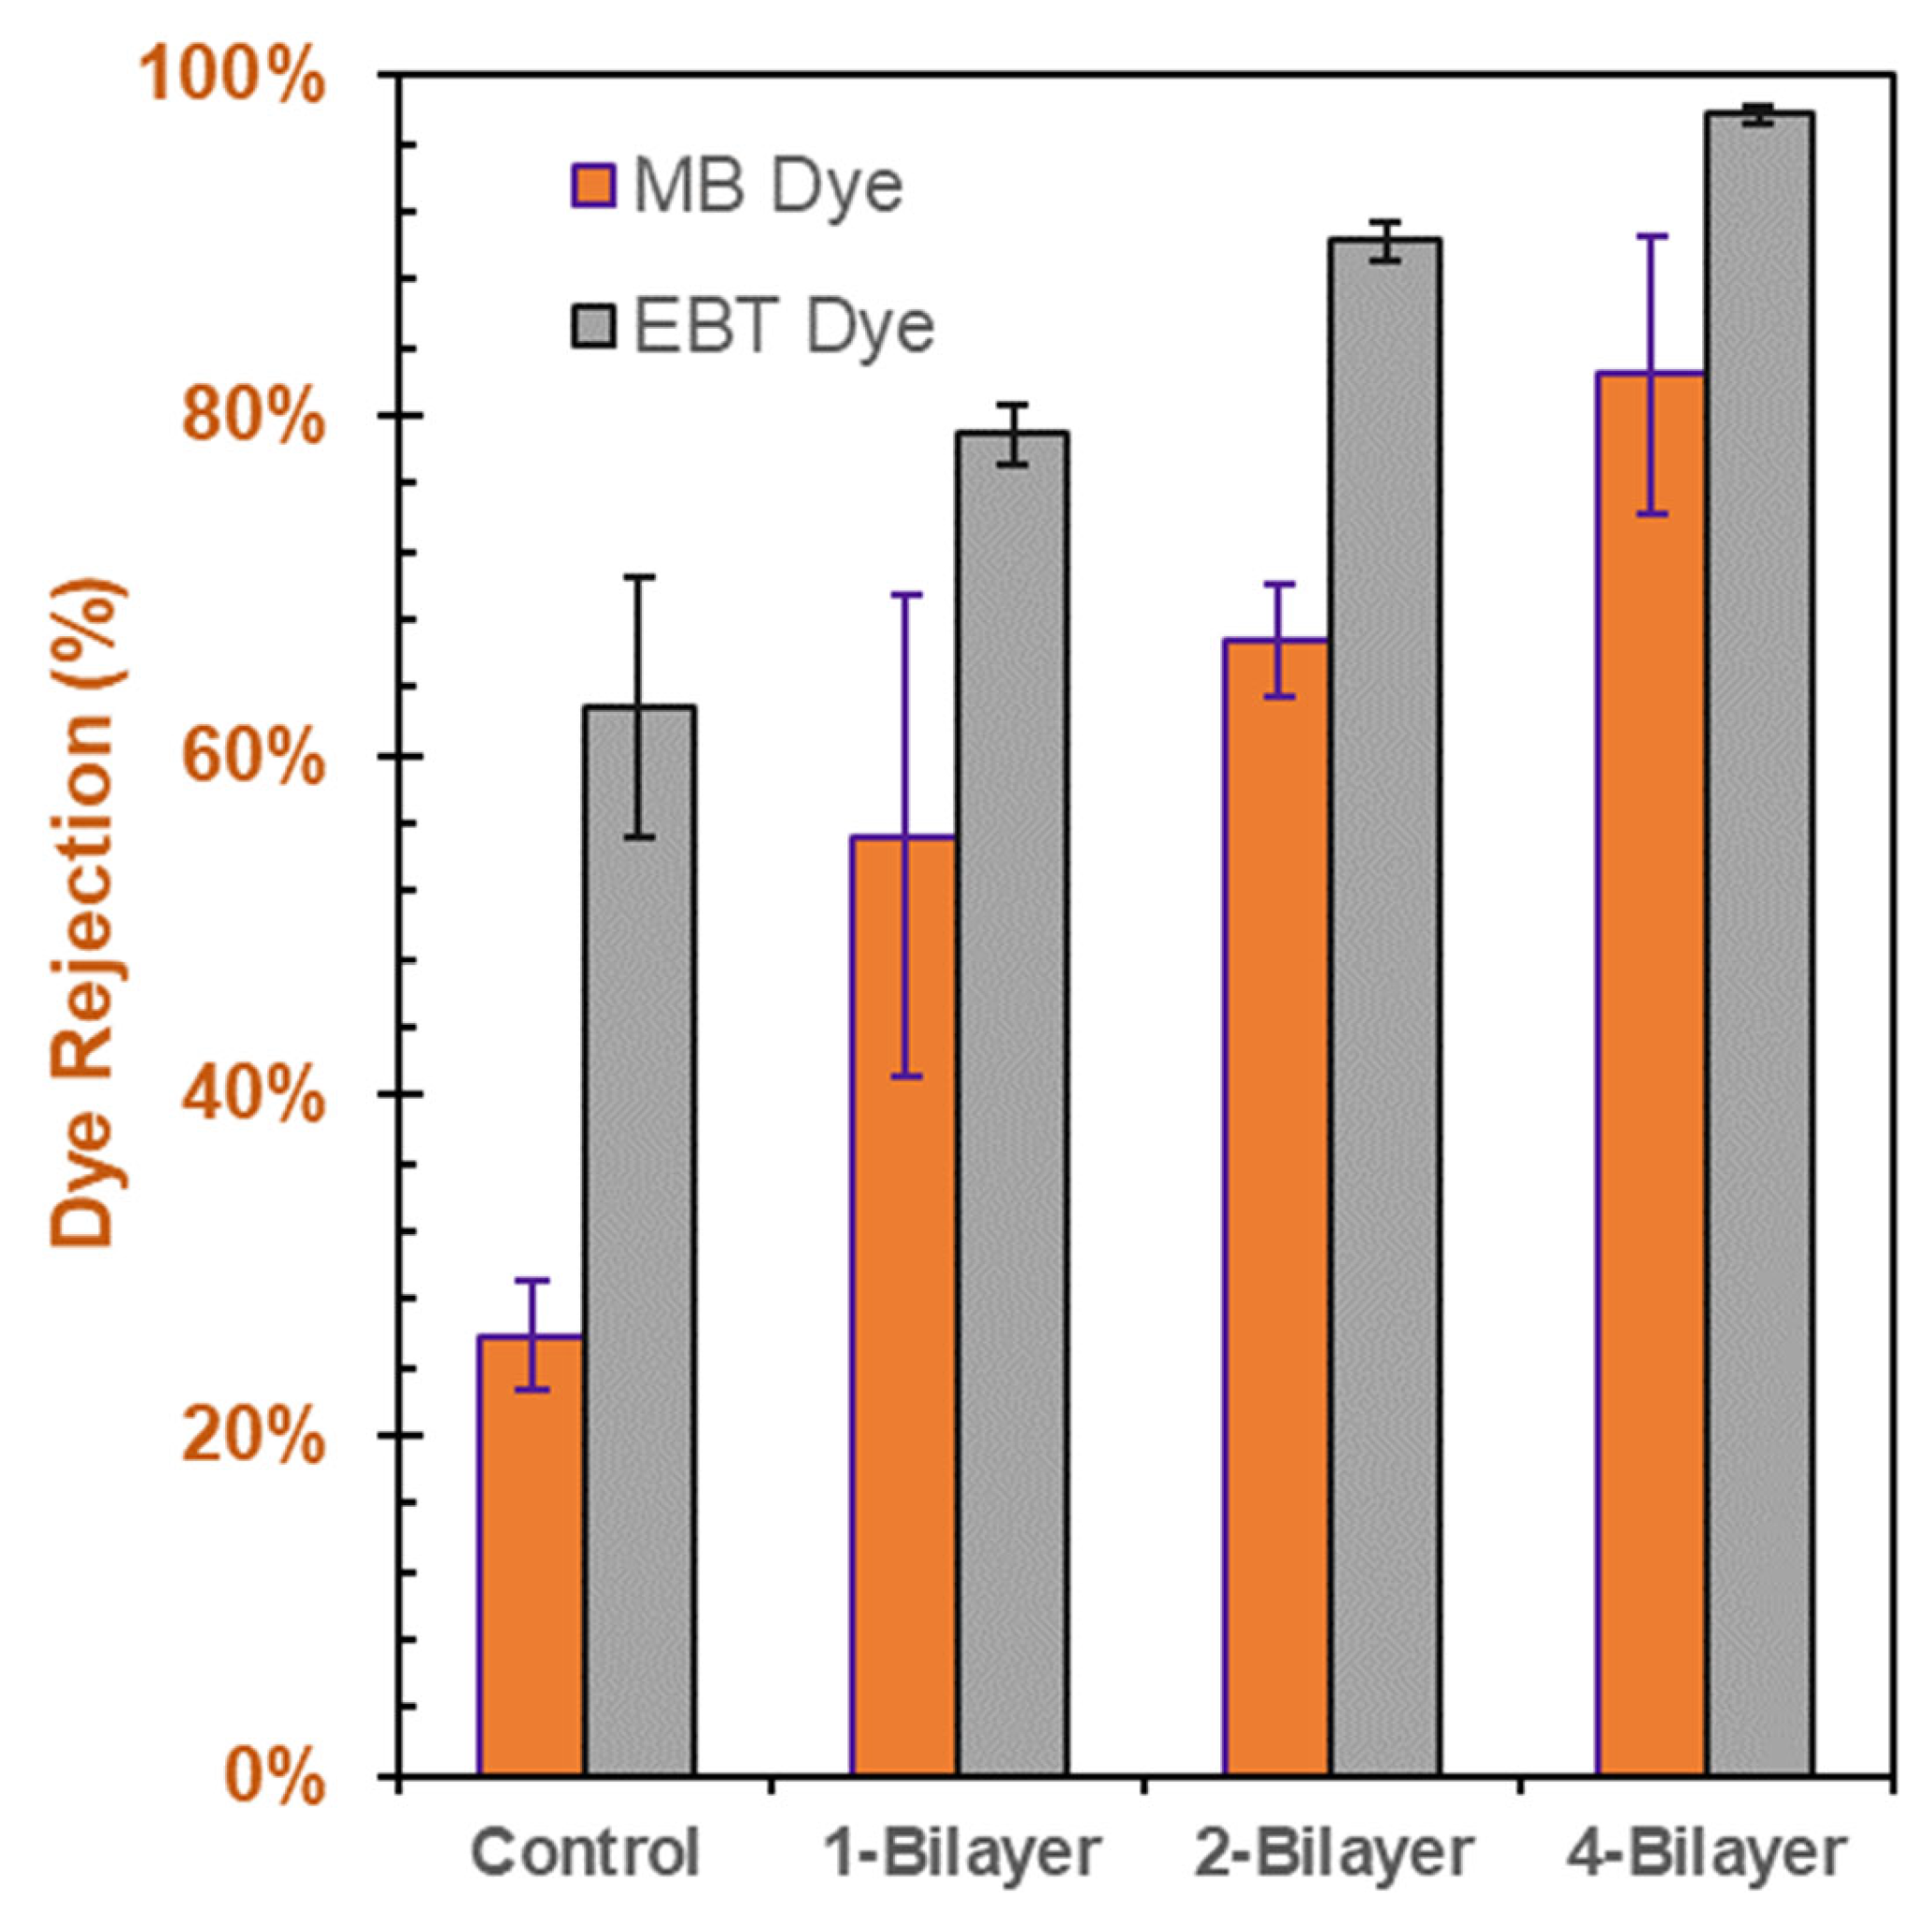
3.4. Individual Dye-Rejection Performance of the Membranes
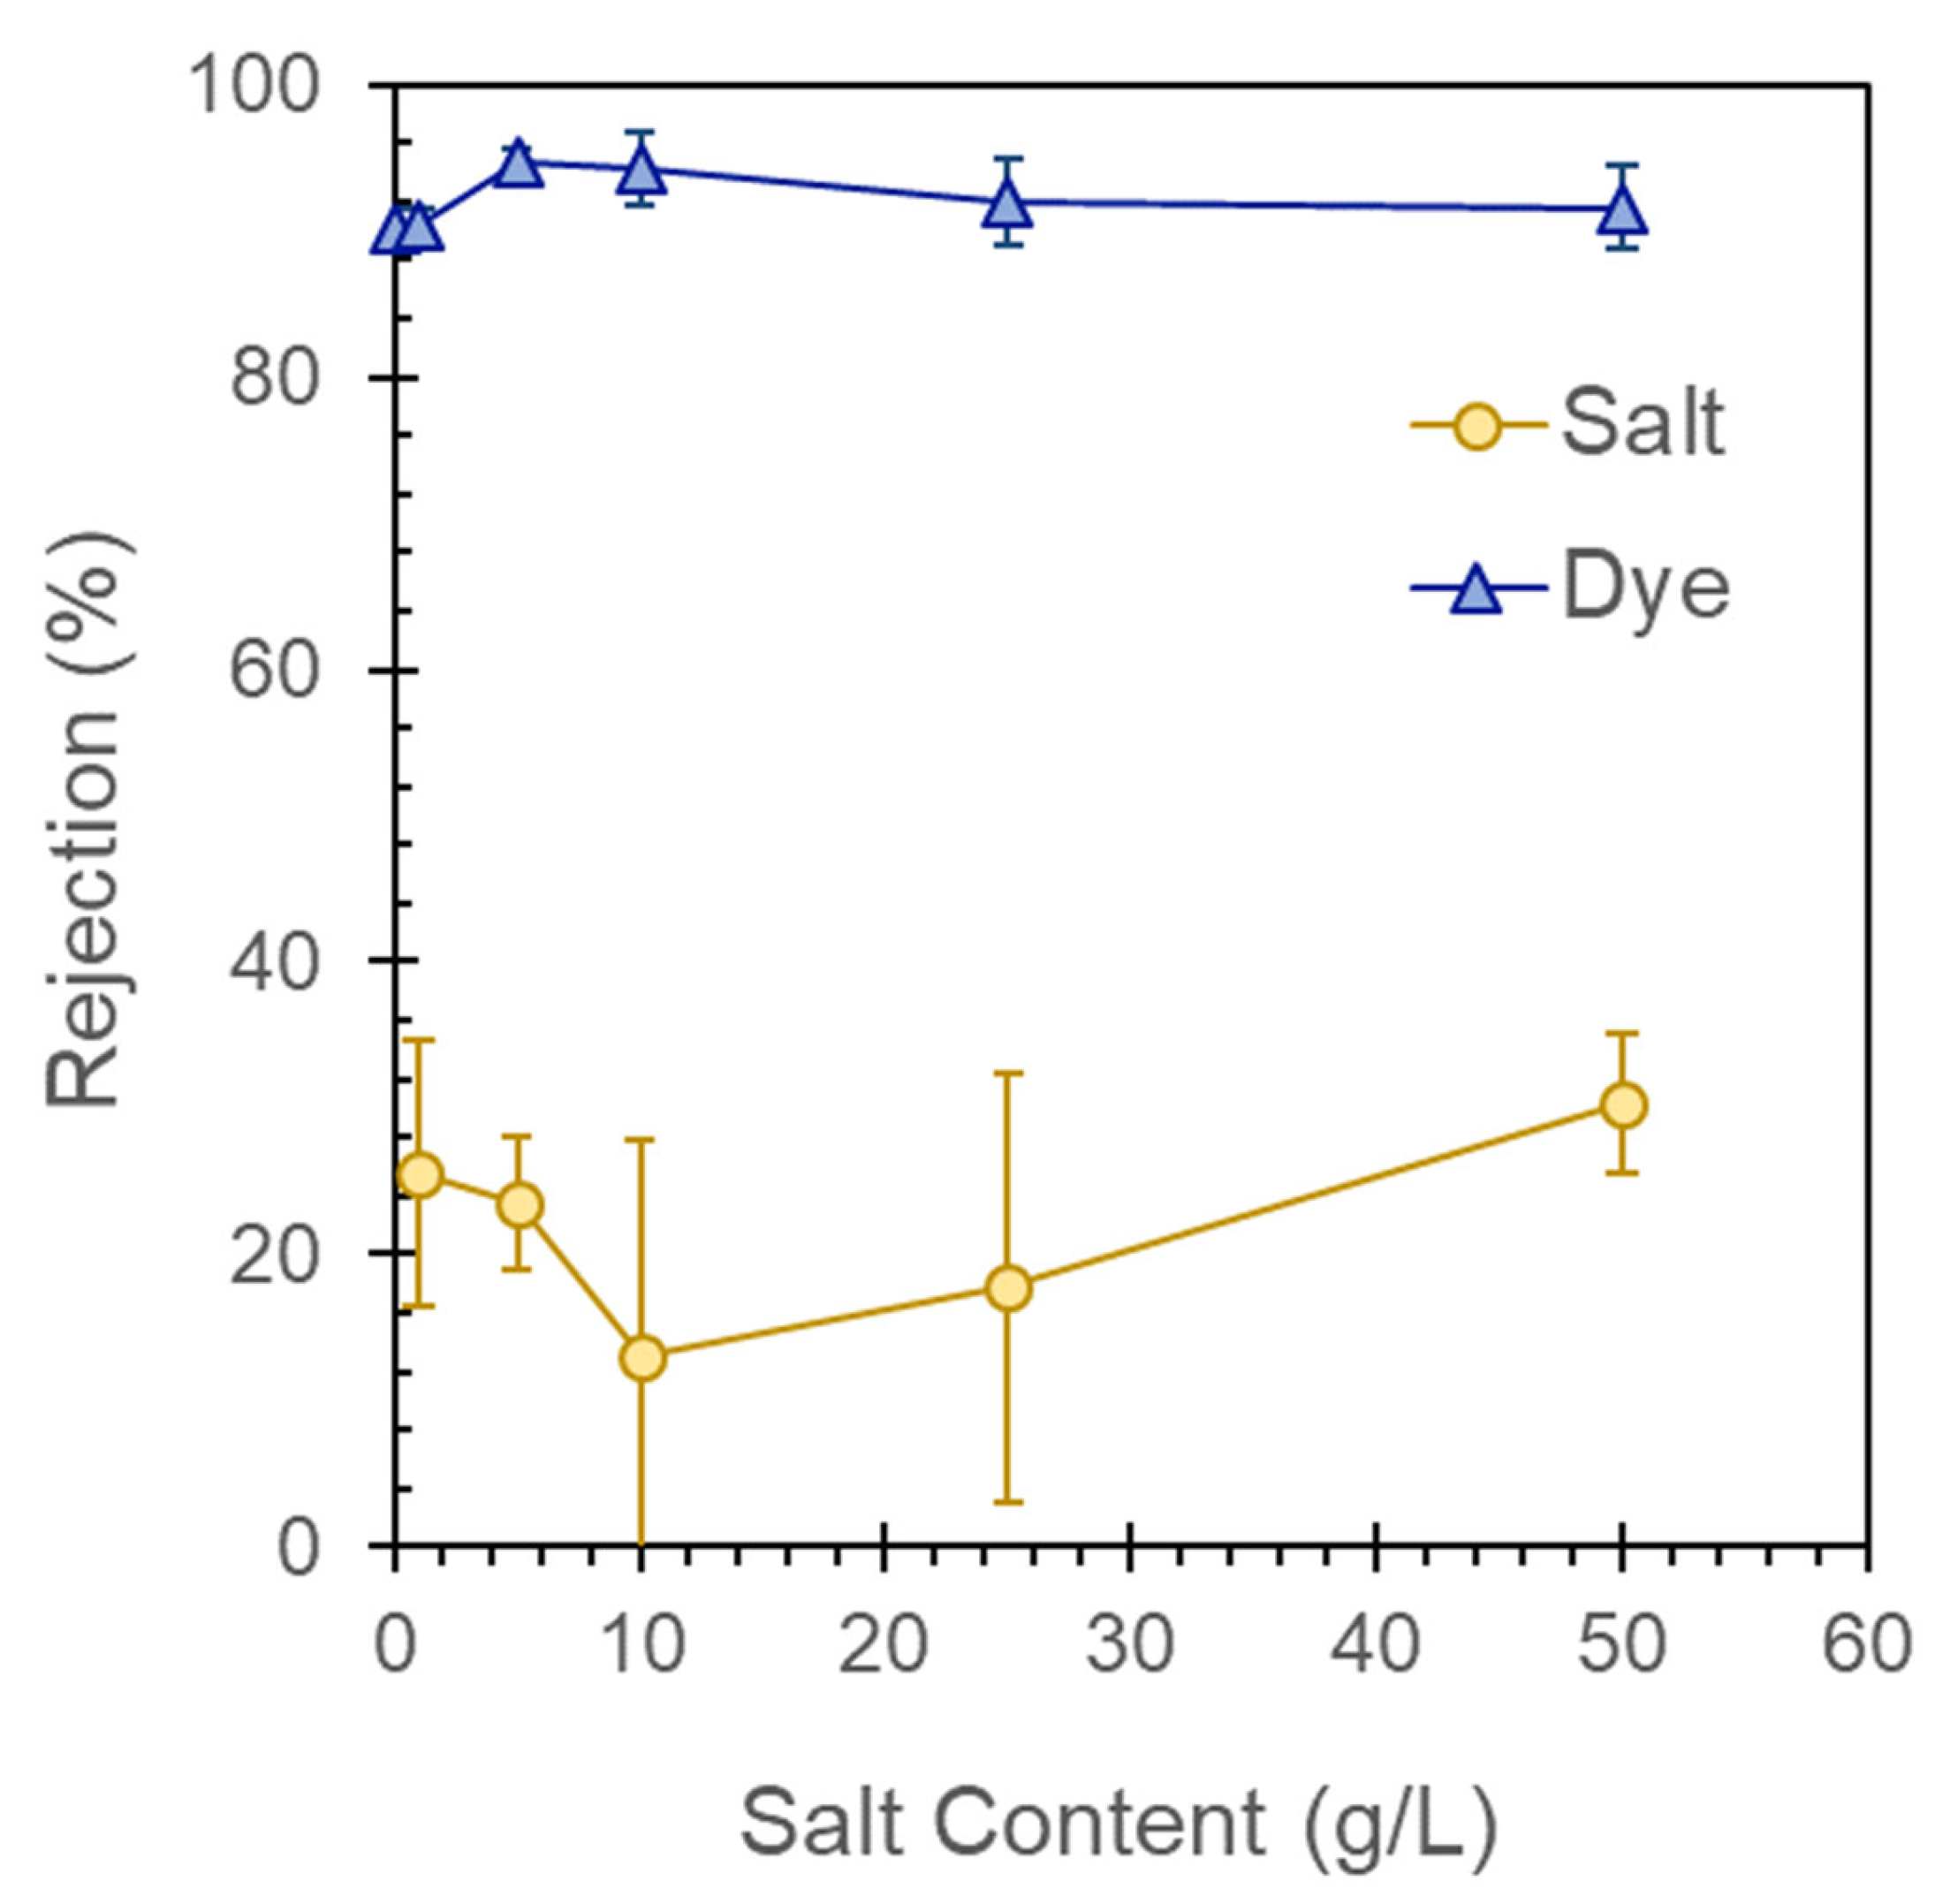
3.5. Influence of Feed-Water Salinity or Dye Concentration on Membrane Performance
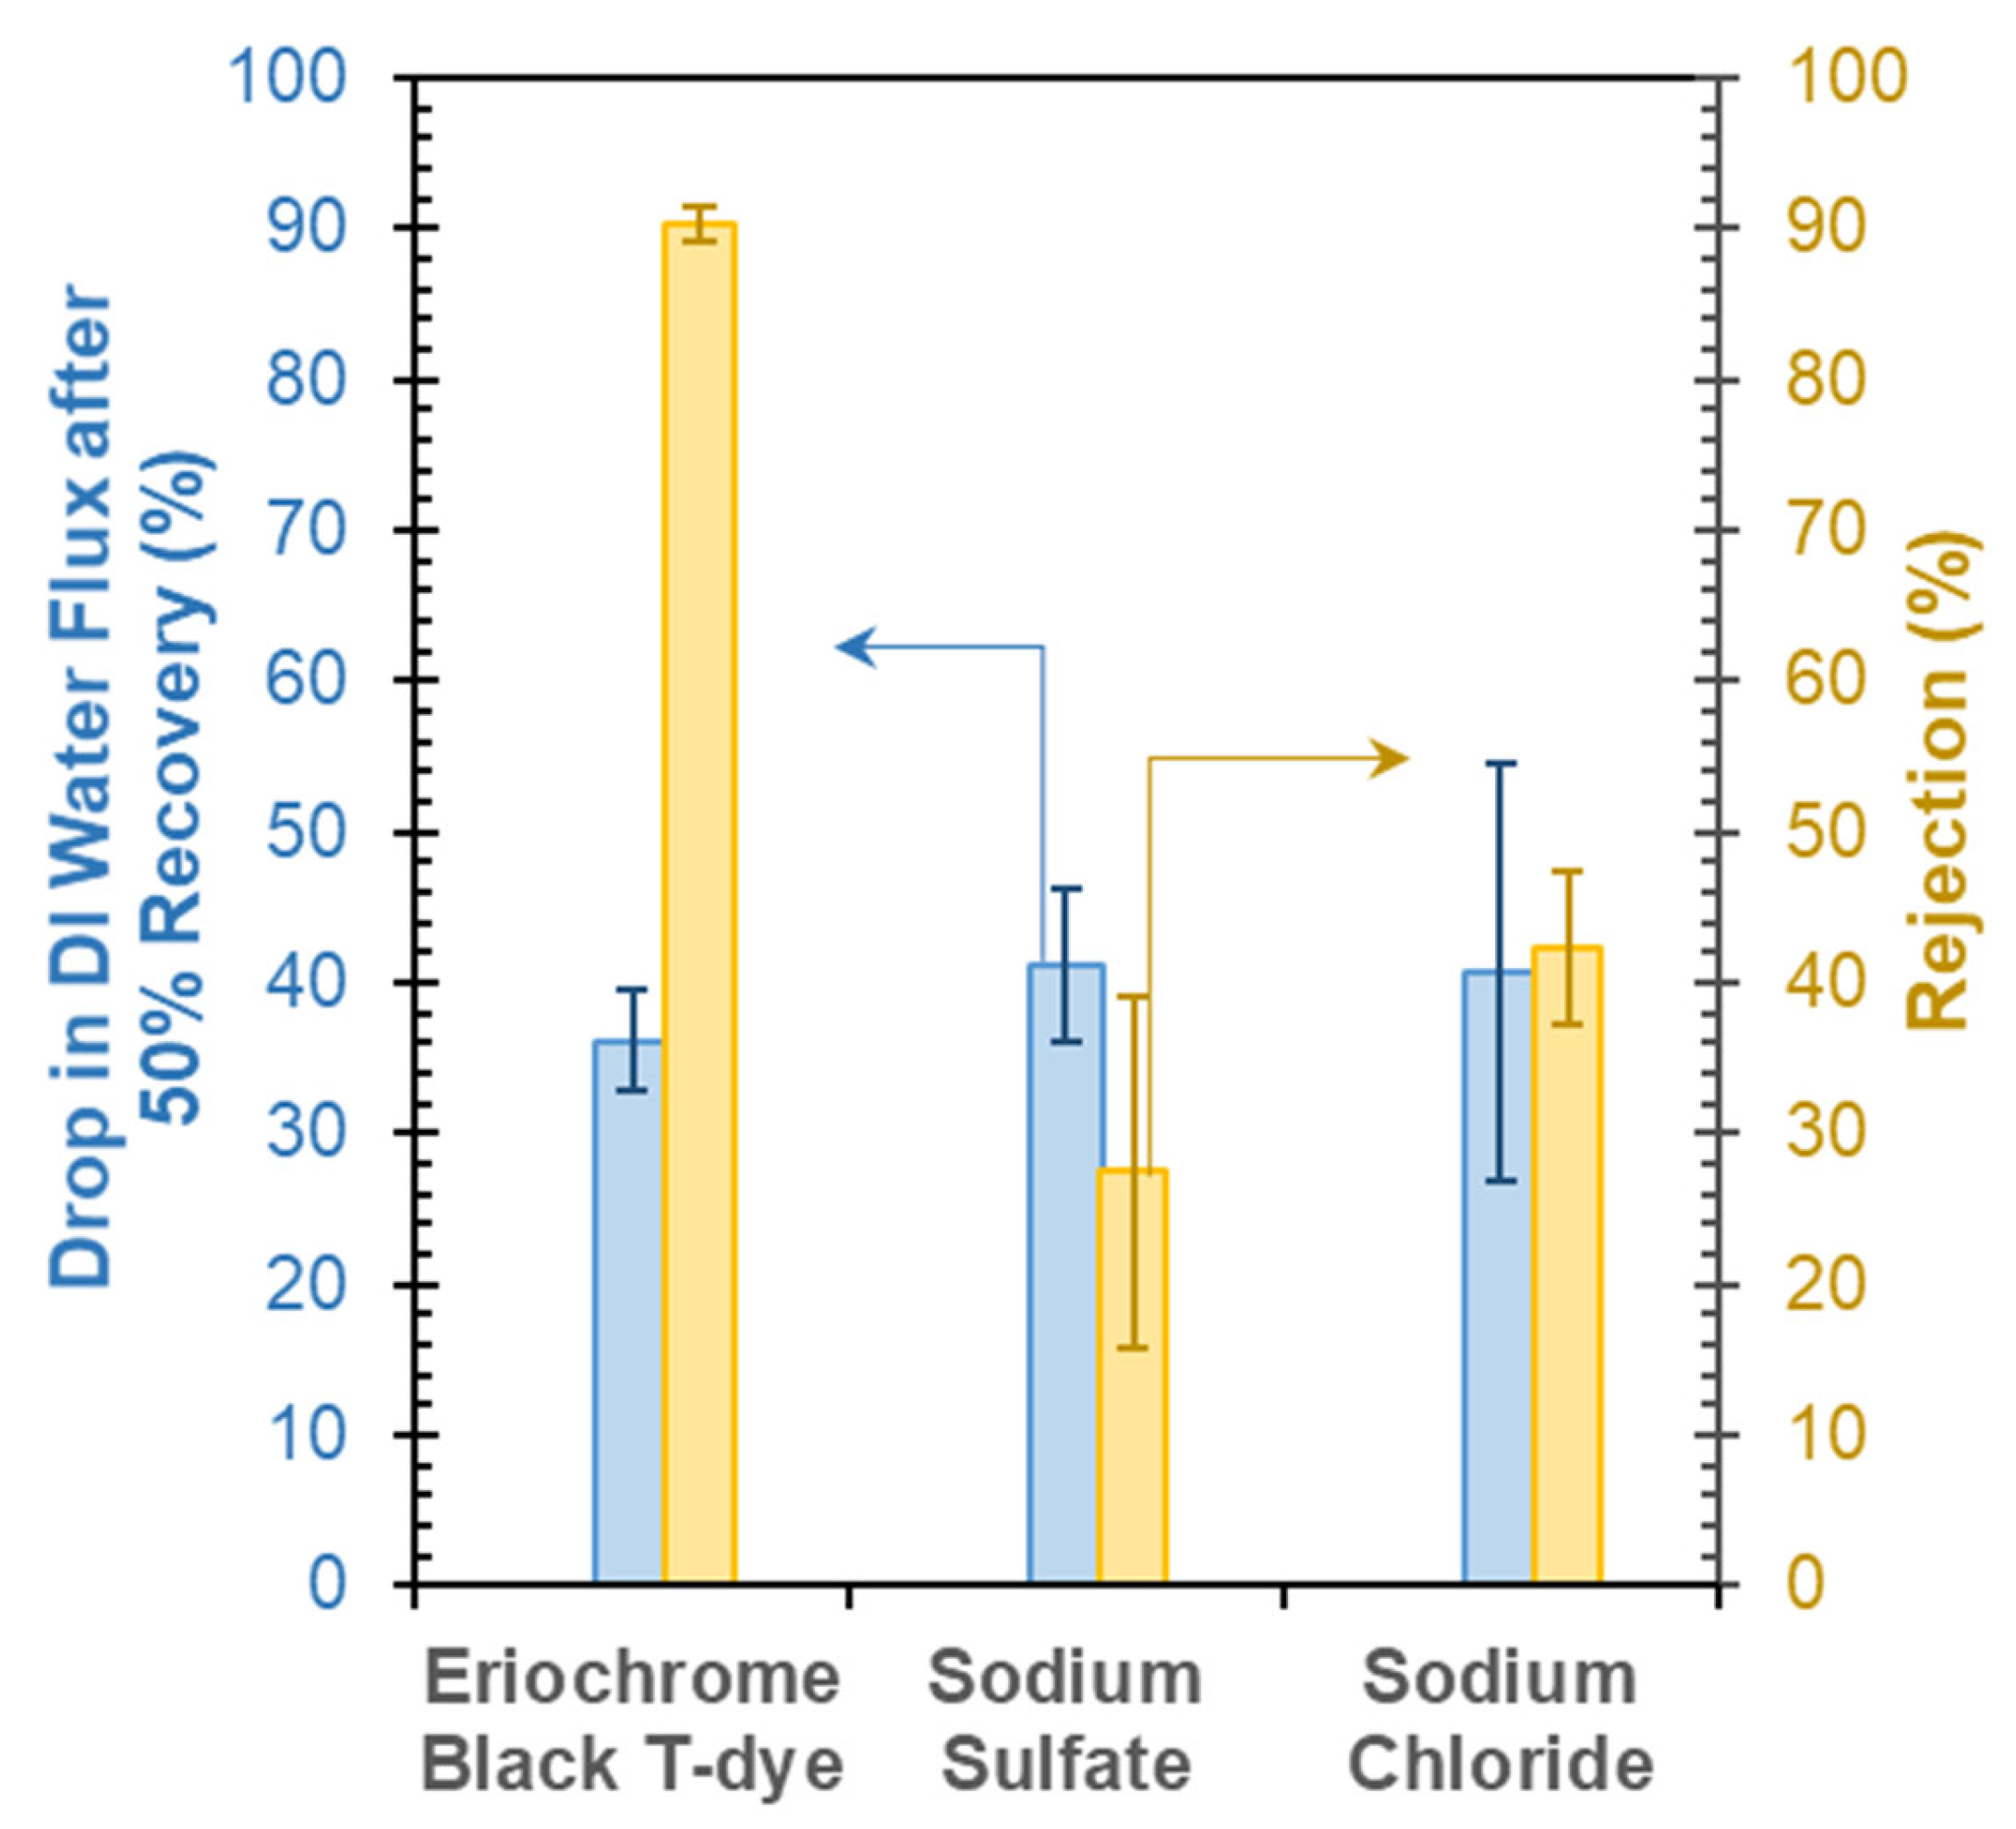
3.6. Influence on Feed-Water Salinity on Dye- and Salt-Rejection Performance
3.7. Membrane Stability under Physical Stress
4. Conclusions
Author Contributions
Funding
Institutional Review Board Statement
Informed Consent Statement
Data Availability Statement
Acknowledgments
Conflicts of Interest
References
- Yaseen, D.A.; Scholz, M. Textile Dye Wastewater Characteristics and Constituents of Synthetic Effluents: A Critical Review. Int. J. Environ. Sci. Technol. 2019, 16, 1193–1226. [Google Scholar] [CrossRef] [Green Version]
- Tavangar, T.; Jalali, K.; Alaei Shahmirzadi, M.A.; Karimi, M. Toward Real Textile Wastewater Treatment: Membrane Fouling Control and Effective Fractionation of Dyes/Inorganic Salts Using a Hybrid Electrocoagulation—Nanofiltration Process. Sep. Purif. Technol. 2019, 216, 115–125. [Google Scholar] [CrossRef]
- Yadav, A.; Mukherji, S.; Garg, A. Removal of Chemical Oxygen Demand and Color from Simulated Textile Wastewater Using a Combination of Chemical/Physicochemical Processes. Ind. Eng. Chem. Res. 2013, 52, 10063–10071. [Google Scholar] [CrossRef]
- Li, Q.; Liao, Z.; Fang, X.; Wang, D.; Xie, J.; Sun, X.; Wang, L.; Li, J. Tannic Acid-Polyethyleneimine Crosslinked Loose Nanofiltration Membrane for Dye/Salt Mixture Separation. J. Memb. Sci. 2019, 584, 324–332. [Google Scholar] [CrossRef]
- House, B. Chapter 13. Tissue Eng. 2020, 175–194. [Google Scholar] [CrossRef]
- Liang, C.Z.; Sun, S.P.; Zhao, B.W.; Chung, T.S. Integration of Nanofiltration Hollow Fiber Membranes with Coagulation-Flocculation to Treat Colored Wastewater from a Dyestuff Manufacturer: A Pilot-Scale Study. Ind. Eng. Chem. Res. 2015, 54, 11159–11166. [Google Scholar] [CrossRef]
- Homem, N.C.; de Camargo Lima Beluci, N.; Amorim, S.; Reis, R.; Vieira, A.M.S.; Vieira, M.F.; Bergamasco, R.; Amorim, M.T.P. Surface Modification of a Polyethersulfone Microfiltration Membrane with Graphene Oxide for Reactive Dyes Removal. Appl. Surf. Sci. 2019, 486, 499–507. [Google Scholar] [CrossRef]
- Gupta, S.K.; Nayunigari, M.K.; Misra, R.; Ansari, F.A.; Dionysiou, D.D.; Maity, A.; Bux, F. Synthesis and Performance Evaluation of a New Polymeric Composite for the Treatment of Textile Wastewater. Ind. Eng. Chem. Res. 2016, 55, 13–20. [Google Scholar] [CrossRef] [Green Version]
- Malik, A.; Akhtar, R.; Grohmann, E. Environmental Deterioration and Human Health: Natural and Anthropogenic Determinants; Springer: Dordrecht, The Netherlands, 2014. [Google Scholar] [CrossRef]
- Abid, M.F.; Zablouk, M.A.; Abid-Alameer, A.M. Experimental Study of Dye Removal from Industrial Wastewater by Membrane Technologies of Reverse Osmosis and Nanofiltration. J. Environ. Health Sci. Eng. 2012, 9, 1–9. [Google Scholar] [CrossRef] [Green Version]
- Vadivelan, V.; Kumar, K.V. Equilibrium, Kinetics, Mechanism, and Process Design for the Sorption of Methylene Blue onto Rice Husk. J. Colloid Interface Sci. 2005, 286, 90–100. [Google Scholar] [CrossRef]
- Kellner-Rogers, J.S.; Taylor, J.K.; Masud, A.M.; Aich, N.; Pinto, A.H. Kinetic and Thermodynamic Study of Methylene Blue Adsorption onto Chitosan: Insights about Metachromasy Occurrence on Wastewater Remediation. Energy Ecol. Environ. 2019, 4, 85–102. [Google Scholar] [CrossRef]
- De, I.; Pahuja, M.; ud din Wani, H.M.; Dey, A.; Dube, T.; Ghosh, R.; Kankan, N.; Mishra, J.; Panda, J.J.; Maruyama, T.; et al. In-Vitro Toxicity Assessment of a Textile Dye Eriochrome Black T and Its Nano-Photocatalytic Degradation through an Innovative Approach Using Mf-NGr-CNTs-SnO2 Heterostructures. Ecotoxicol. Environ. Saf. 2022, 243, 113985. [Google Scholar] [CrossRef]
- Herschy, R.W. Guidelines for Drinking-Water Quality. In Encyclopedia of Lakes and Reservoirs; Bengtsson, L., Herschy, R.W., Fairbridge, R.W., Eds.; Springer: Dordrecht, The Netherlands. [CrossRef]
- Shu, H.Y.; Hsieh, W.P. Treatment of Dye Manufacturing Plant Effluent Using an Annular UV/H2O2 Reactor with Multi-UV Lamps. Sep. Purif. Technol. 2006, 51, 379–386. [Google Scholar] [CrossRef]
- Karadag, D.; Tok, S.; Akgul, E.; Ulucan, K.; Evden, H.; Kaya, M.A. Combining Adsorption and Coagulation for the Treatment of Azo and Anthraquinone Dyes from Aqueous Solution. Ind. Eng. Chem. Res. 2006, 45, 3969–3973. [Google Scholar] [CrossRef]
- Jing, G.; Ren, S.; Pooley, S.; Sun, W.; Kowalczuk, P.B.; Gao, Z. Electrocoagulation for Industrial Wastewater Treatment: An Updated Review. Environ. Sci. Water Res. Technol. 2021, 7, 1177–1196. [Google Scholar] [CrossRef]
- Dharupaneedi, S.P.; Nataraj, S.K.; Nadagouda, M.; Reddy, K.R.; Shukla, S.S.; Aminabhavi, T.M. Membrane-Based Separation of Potential Emerging Pollutants. Sep. Purif. Technol. 2019, 210, 850–866. [Google Scholar] [CrossRef]
- Thiruvenkatachari, R.; Francis, M.; Cunnington, M.; Su, S. Application of Integrated Forward and Reverse Osmosis for Coal Mine Wastewater Desalination. Sep. Purif. Technol. 2016, 163, 181–188. [Google Scholar] [CrossRef]
- Khanzada, N.K.; Khan, S.J.; Davies, P.A. Performance Evaluation of Reverse Osmosis (RO) Pre-Treatment Technologies for in-Land Brackish Water Treatment. Desalination 2017, 406, 44–50. [Google Scholar] [CrossRef] [Green Version]
- Chon, K.; Cho, J.; Kim, S.J.; Jang, A. The Role of a Combined Coagulation and Disk Filtration Process as a Pre-Treatment to Microfiltration and Reverse Osmosis Membranes in a Municipal Wastewater Pilot Plant. Chemosphere 2014, 117, 20–26. [Google Scholar] [CrossRef]
- Lim, M.Y.; Choi, Y.S.; Kim, J.; Kim, K.; Shin, H.; Kim, J.J.; Shin, D.M.; Lee, J.C. Cross-Linked Graphene Oxide Membrane Having High Ion Selectivity and Antibacterial Activity Prepared Using Tannic Acid-Functionalized Graphene Oxide and Polyethyleneimine. J. Memb. Sci. 2017, 521, 1–9. [Google Scholar] [CrossRef]
- Nan, Q.; Li, P.; Cao, B. Fabrication of Positively Charged Nanofiltration Membrane via the Layer-by-Layer Assembly of Graphene Oxide and Polyethylenimine for Desalination. Appl. Surf. Sci. 2016, 387, 521–528. [Google Scholar] [CrossRef]
- Ming, C.; Xiaomin, X.; Philippe, S.; Luc, F. Extensive Review about Industrial and Laboratory Dynamic Filtration Modules: Scientific Production, Configurations and Performances. Sep. Purif. Technol. 2021, 265, 293. [Google Scholar] [CrossRef]
- Wang, J.M.; Jin, Q.Q.; Zhang, Y.Y.; Fang, H.C.; Xia, H.M. Reducing the Membrane Fouling in Cross-Flow Filtration Using a Facile Fluidic Oscillator. Sep. Purif. Technol. 2021, 272, 118854. [Google Scholar] [CrossRef]
- Murkes, J. Fundamentals of Crossflow Filtration. Sep. Purif. Methods 1990, 19, 1–29. [Google Scholar] [CrossRef]
- Mah, S.K.; Chang, C.C.H.; Wu, T.Y.; Chai, S.P. The Study of Reverse Osmosis on Glycerin Solution Filtration: Dead-End and Crossflow Filtrations, Transport Mechanism, Rejection and Permeability Investigations. Desalination 2014, 352, 66–81. [Google Scholar] [CrossRef]
- Huang, N.M.; Lim, H.N.; Chia, C.H.; Yarmo, M.A.; Muhamad, M.R. Simple Room-Temperature Preparation of High-Yield Large Area Graphene Oxide. Int. J. Nanomed. 2011, 6, 3443–3448. [Google Scholar] [CrossRef] [Green Version]
- Omi, F.R.; Choudhury, M.R.; Anwar, N.; Bakr, A.R.; Rahaman, M.S. Highly Conductive Ultrafiltration Membrane via Vacuum Filtration Assisted Layer-by-Layer Deposition of Functionalized Carbon Nanotubes. Ind. Eng. Chem. Res. 2017, 56, 8474–8484. [Google Scholar] [CrossRef]
- Guerrero-Contreras, J.; Caballero-Briones, F. Graphene Oxide Powders with Different Oxidation Degree, Prepared by Synthesis Variations of the Hummers Method. Mater. Chem. Phys. 2015, 153, 209–220. [Google Scholar] [CrossRef]
- Krishnamoorthy, K.; Veerapandian, M.; Yun, K.; Kim, S.J. The Chemical and Structural Analysis of Graphene Oxide with Different Degrees of Oxidation. Carbon 2013, 53, 38–49. [Google Scholar] [CrossRef]
- Law, K.-Y. Definitions for Hydrophilicity, Hydrophobicity, and Superhydrophobicity: Getting the Basics Right. J. Phys. Chem. Lett. 2014, 5, 686–688. [Google Scholar] [CrossRef]
- Shao, Q.; Qian, Y.; Wu, P.; Zhang, H.; Cai, C. Graphene Oxide-Induced Conformation Changes of Glucose Oxidase Studied by Infrared Spectroscopy. Colloids Surf. B Biointerfaces 2013, 109, 115–120. [Google Scholar] [CrossRef]
- Lucena, M.d.C.C.; De Alencar, A.E.V.; Mazzeto, S.E.; Soares, S.d.A. The Effect of Additives on the Thermal Degradation of Cellulose Acetate. Polym. Degrad. Stab. 2003, 80, 149–155. [Google Scholar] [CrossRef]
- Khanam, N.; Mikoryak, C.; Draper, R.K.; Balkus, K.J. Electrospun Linear Polyethyleneimine Scaffolds for Cell Growth. Acta Biomater. 2007, 3, 1050–1059. [Google Scholar] [CrossRef]
- Sahito, I.A.; Sun, K.C.; Arbab, A.A.; Qadir, M.B.; Jeong, S.H. Integrating High Electrical Conductivity and Photocatalytic Activity in Cotton Fabric by Cationizing for Enriched Coating of Negatively Charged Graphene Oxide. Carbohydr. Polym. 2015, 130, 299–306. [Google Scholar] [CrossRef]


Disclaimer/Publisher’s Note: The statements, opinions and data contained in all publications are solely those of the individual author(s) and contributor(s) and not of MDPI and/or the editor(s). MDPI and/or the editor(s) disclaim responsibility for any injury to people or property resulting from any ideas, methods, instructions or products referred to in the content. |
© 2023 by the authors. Licensee MDPI, Basel, Switzerland. This article is an open access article distributed under the terms and conditions of the Creative Commons Attribution (CC BY) license (https://creativecommons.org/licenses/by/4.0/).
Share and Cite
Ong, M.D.; Vasquez, I.; Alvarez, B.; Cho, D.R.; Williams, M.B.; Vincent, D., Jr.; Ali, M.A.; Aich, N.; Pinto, A.H.; Choudhury, M.R. Modification of Cellulose Acetate Microfiltration Membranes Using Graphene Oxide–Polyethyleneimine for Enhanced Dye Rejection. Membranes 2023, 13, 143. https://doi.org/10.3390/membranes13020143
Ong MD, Vasquez I, Alvarez B, Cho DR, Williams MB, Vincent D Jr., Ali MA, Aich N, Pinto AH, Choudhury MR. Modification of Cellulose Acetate Microfiltration Membranes Using Graphene Oxide–Polyethyleneimine for Enhanced Dye Rejection. Membranes. 2023; 13(2):143. https://doi.org/10.3390/membranes13020143
Chicago/Turabian StyleOng, Maria Dominique, Isabel Vasquez, Brandon Alvarez, Dylan R. Cho, Malik B. Williams, Donovan Vincent, Jr., Md. Arafat Ali, Nirupam Aich, Alexandre H. Pinto, and Mahbuboor Rahman Choudhury. 2023. "Modification of Cellulose Acetate Microfiltration Membranes Using Graphene Oxide–Polyethyleneimine for Enhanced Dye Rejection" Membranes 13, no. 2: 143. https://doi.org/10.3390/membranes13020143