
Polymer Electrolytes Based on Na-Nafion Plasticized by Binary Mixture of Ethylene Carbonate and Sulfolane

 , , ,
, , ,
Abstract
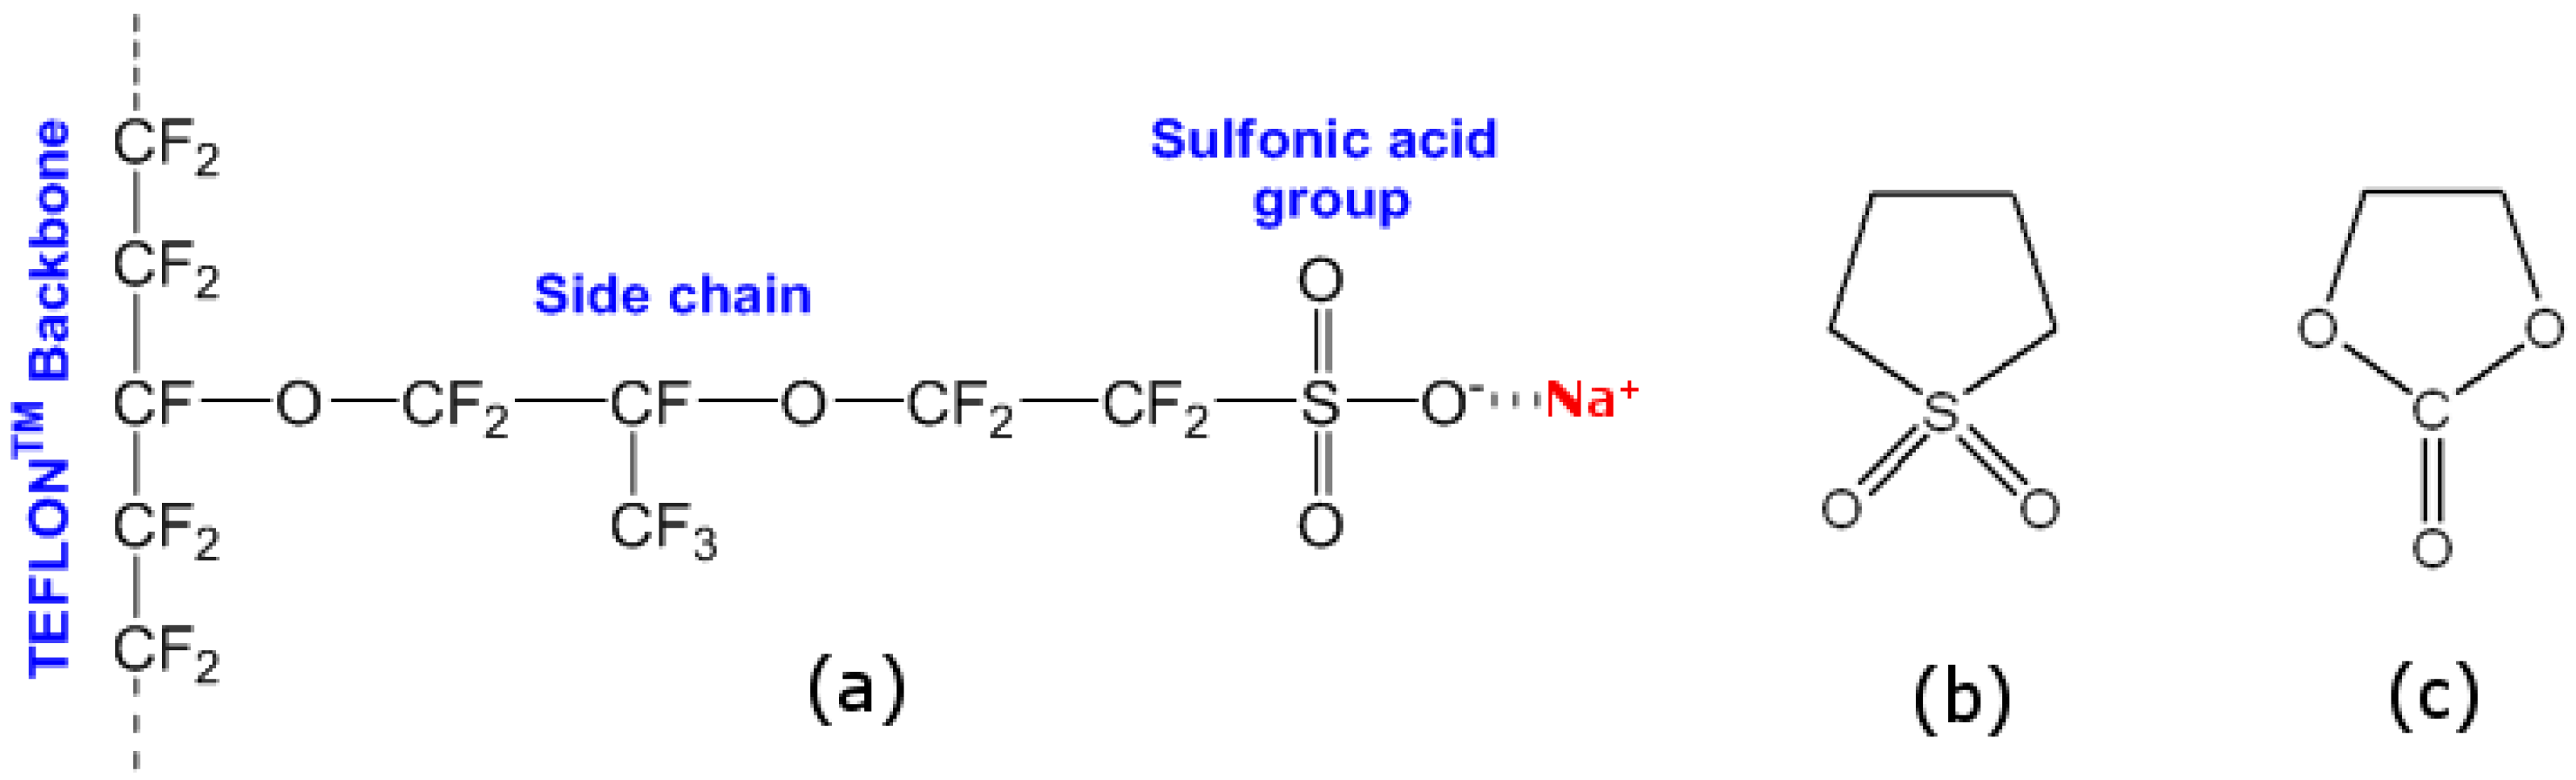
:1. Introduction
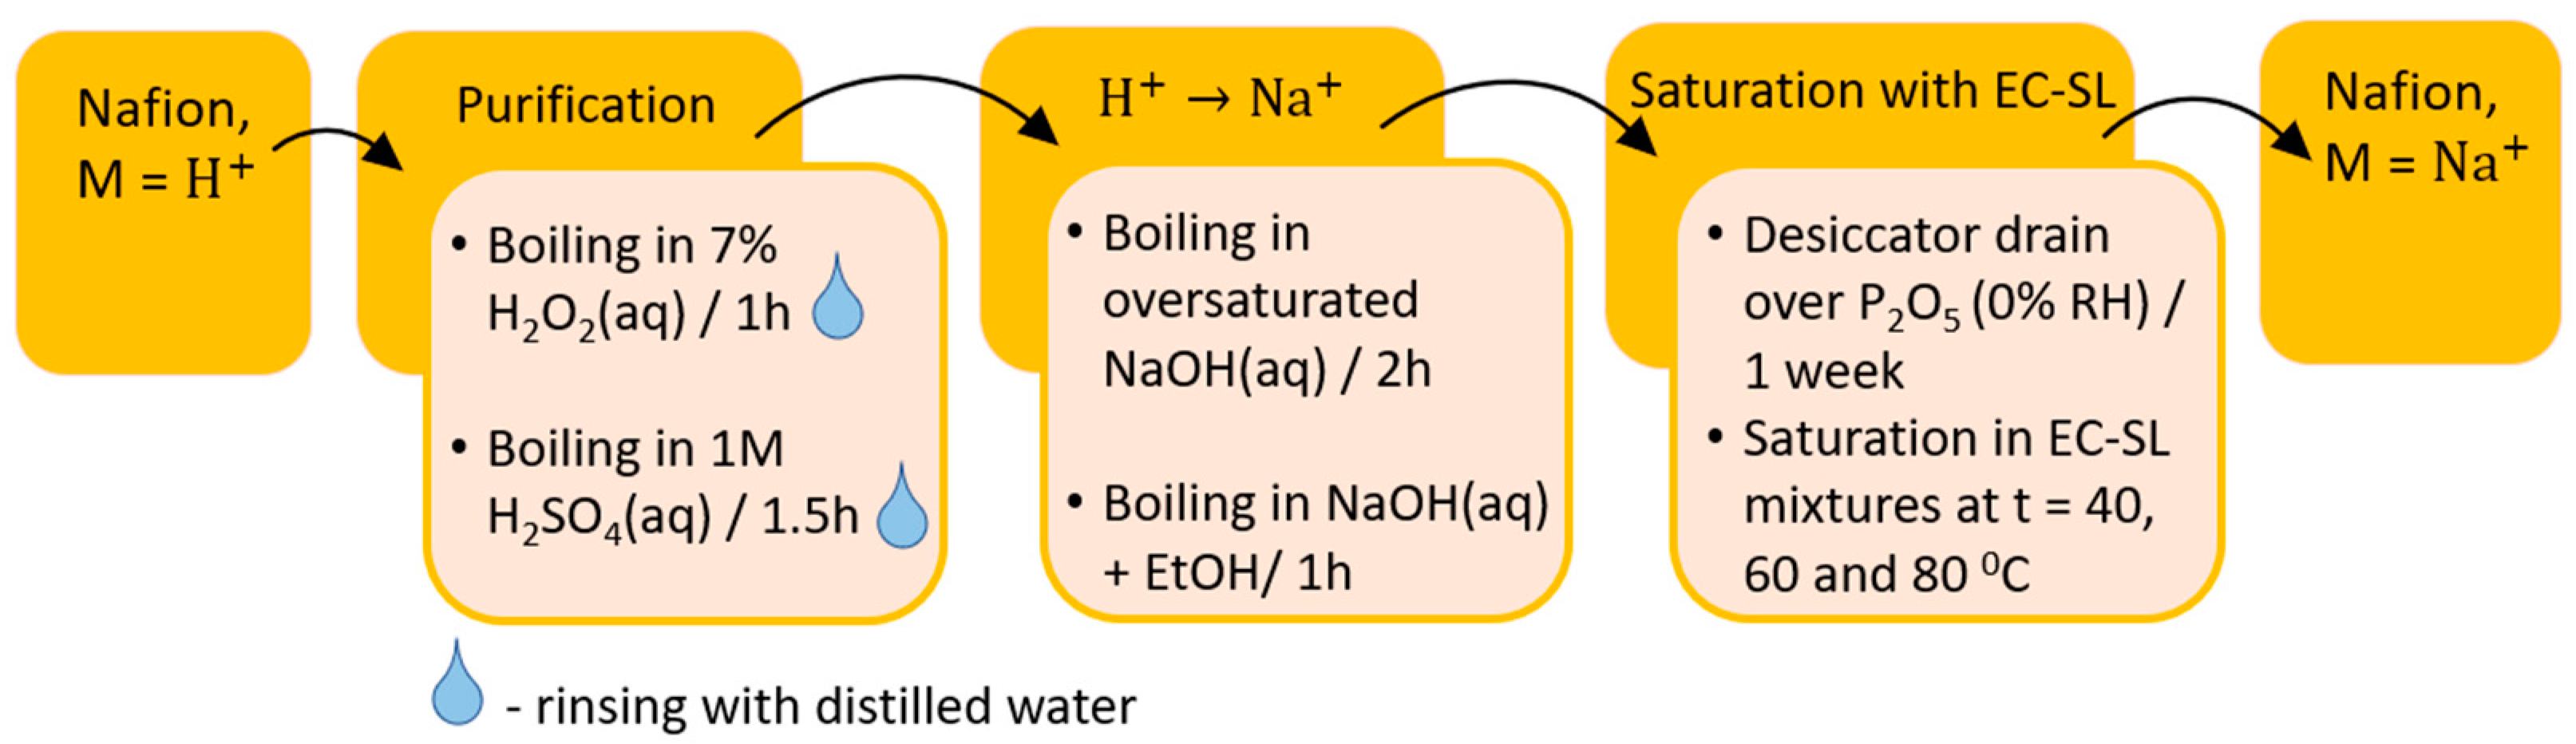
2. Materials and Methods
2.1. Membrane Preparation
2.2. Binary Plasticizer Preparation
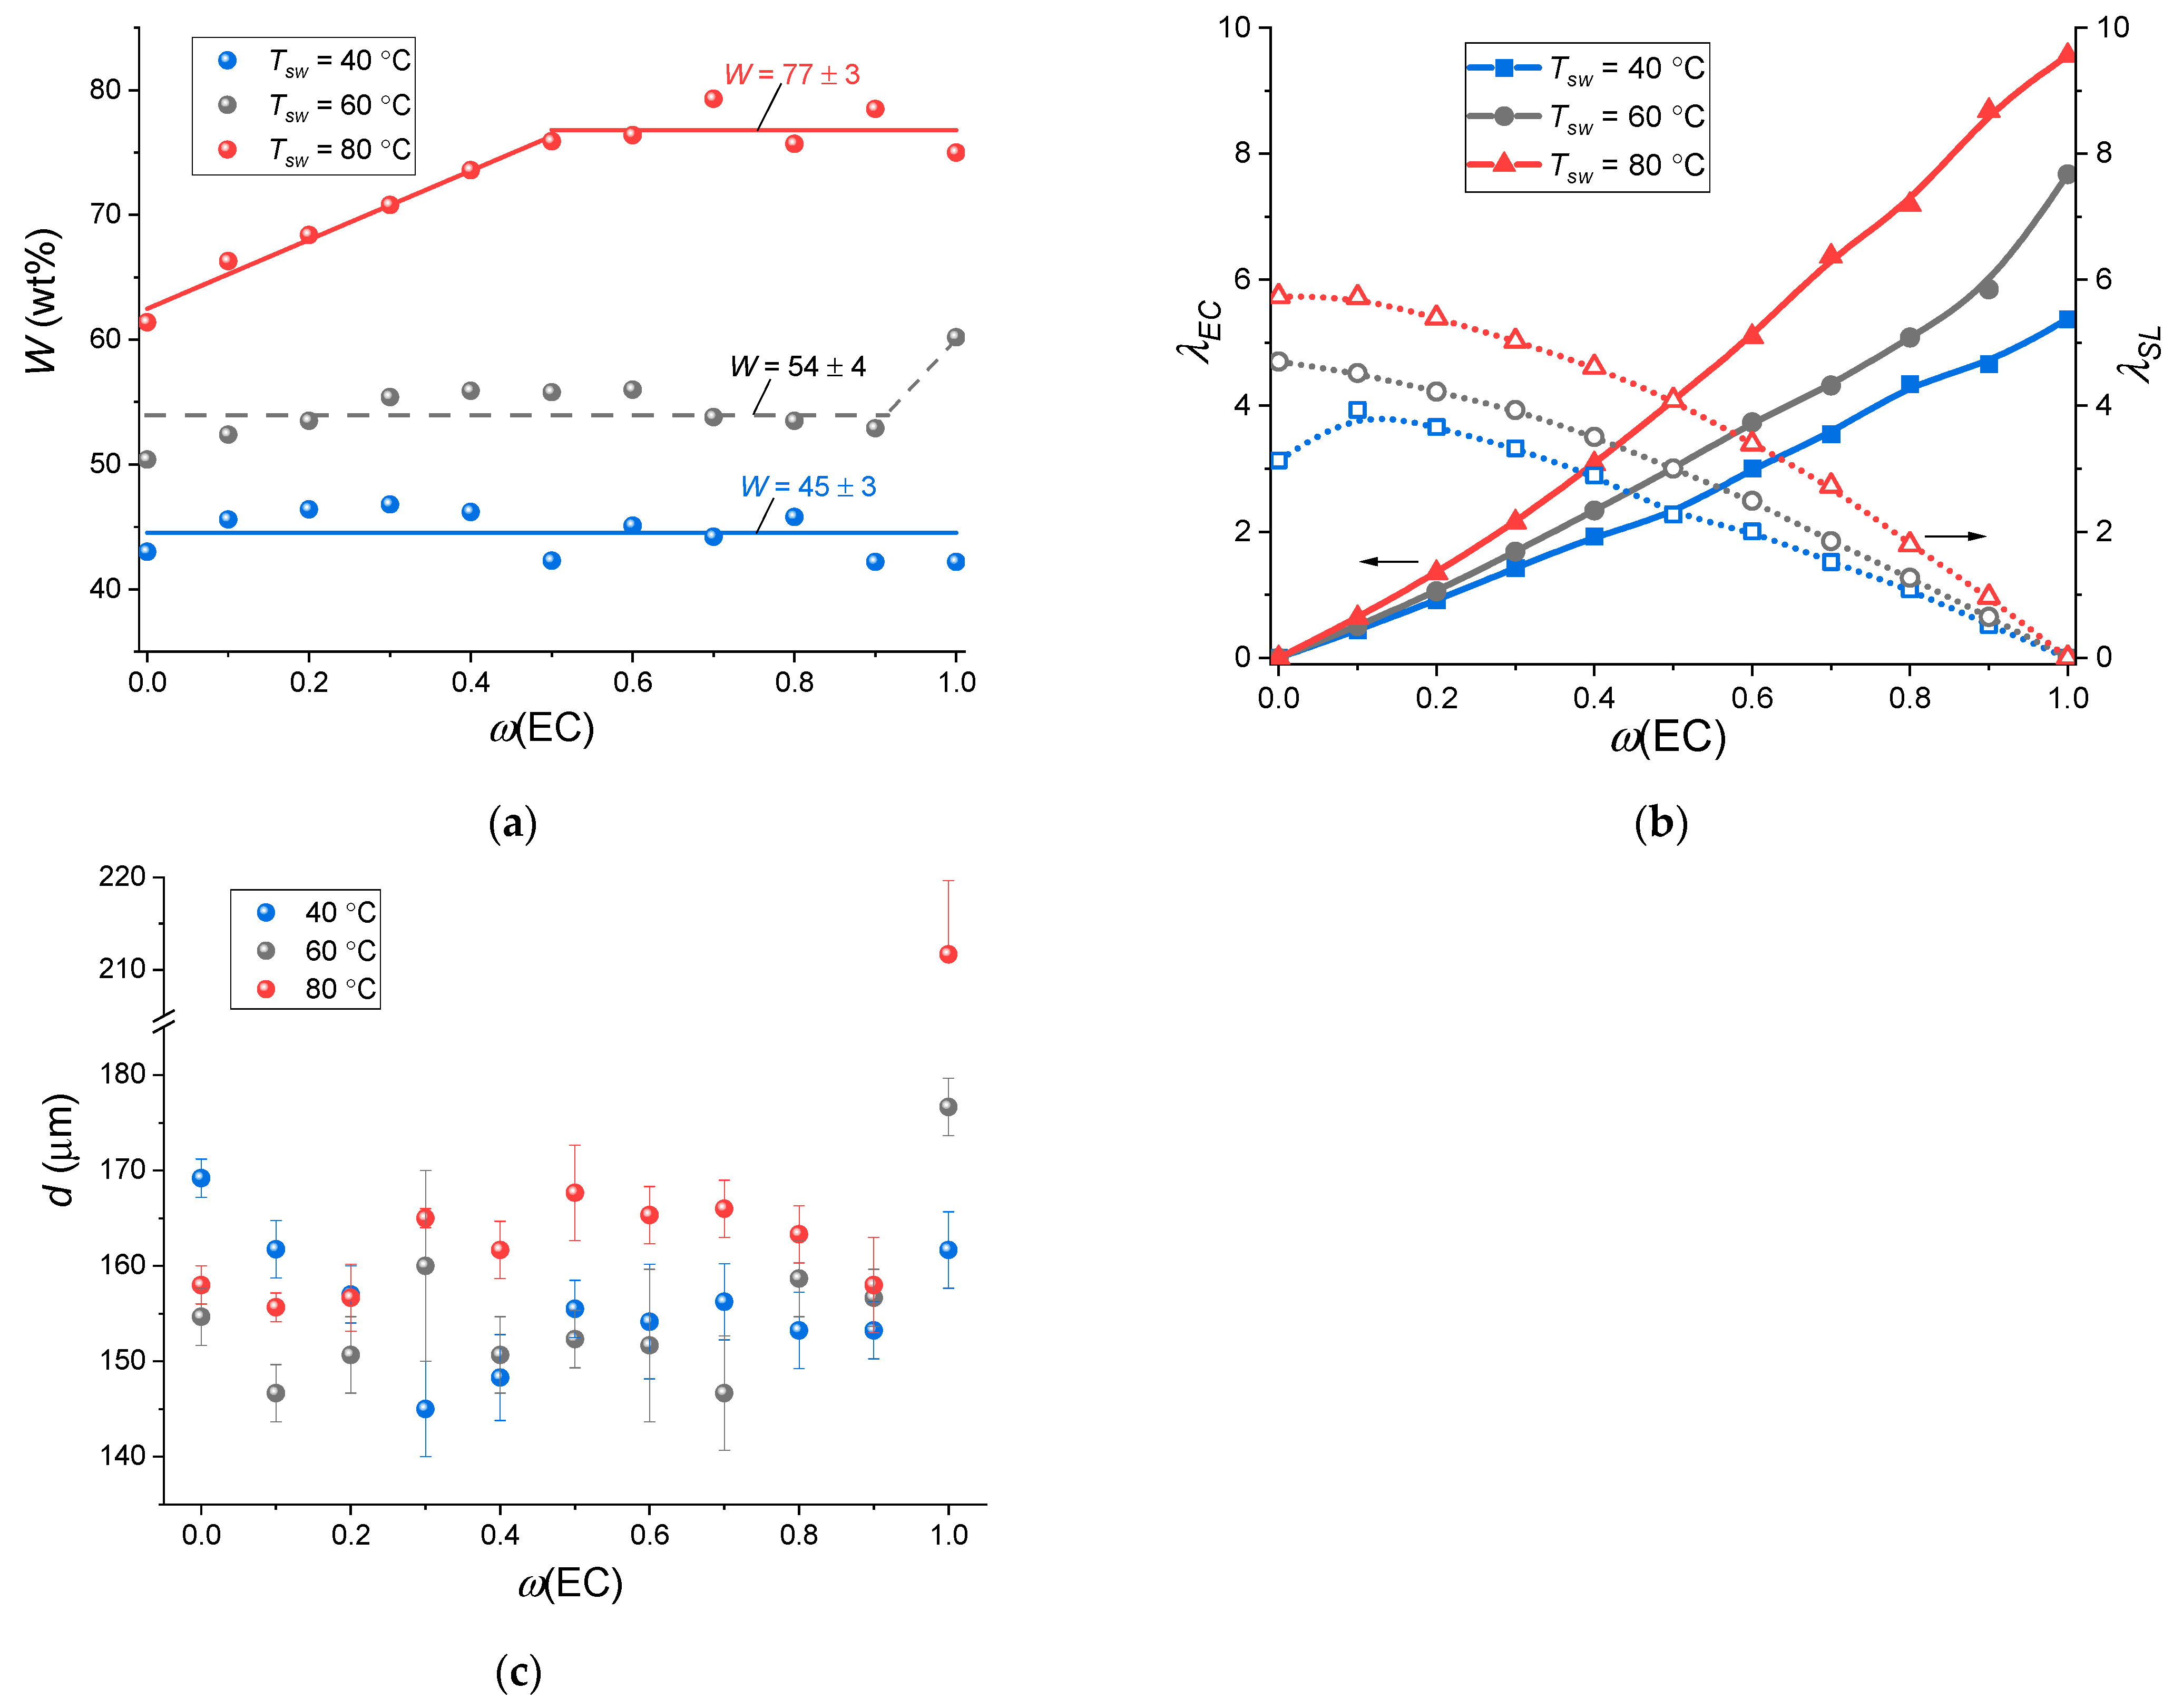
2.3. Membrane Swelling
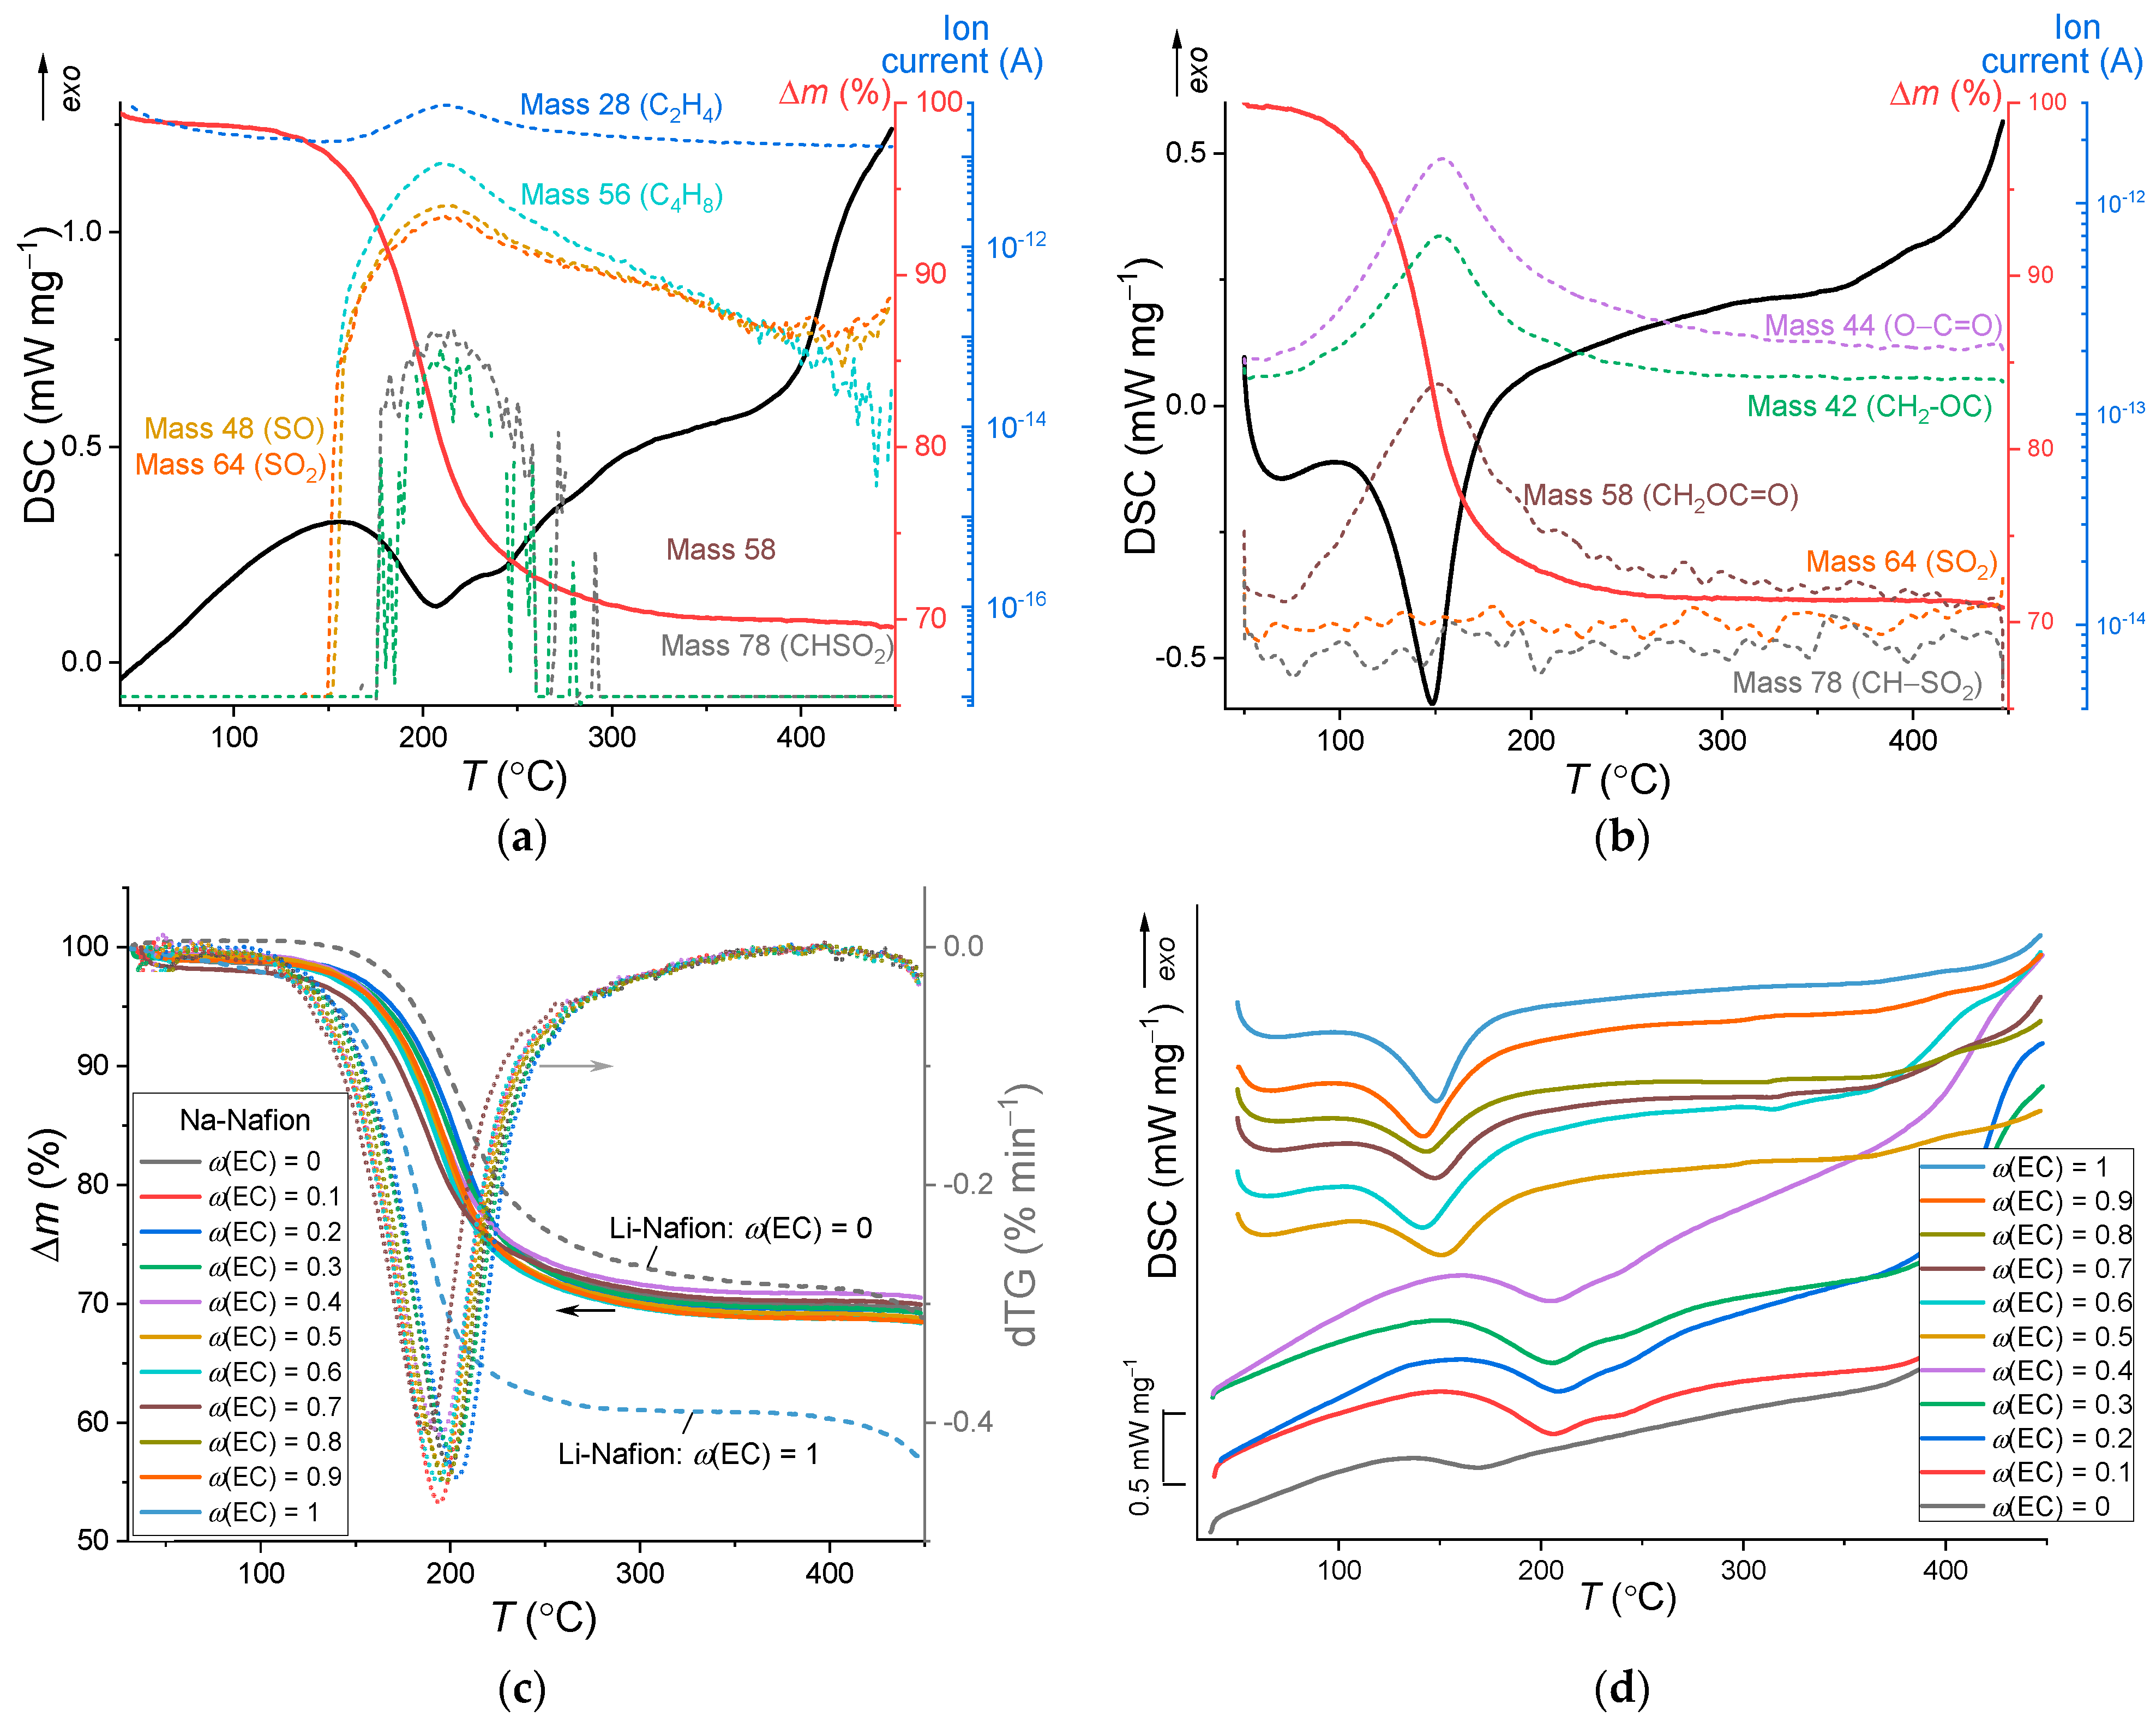
2.4. Thermal Stability
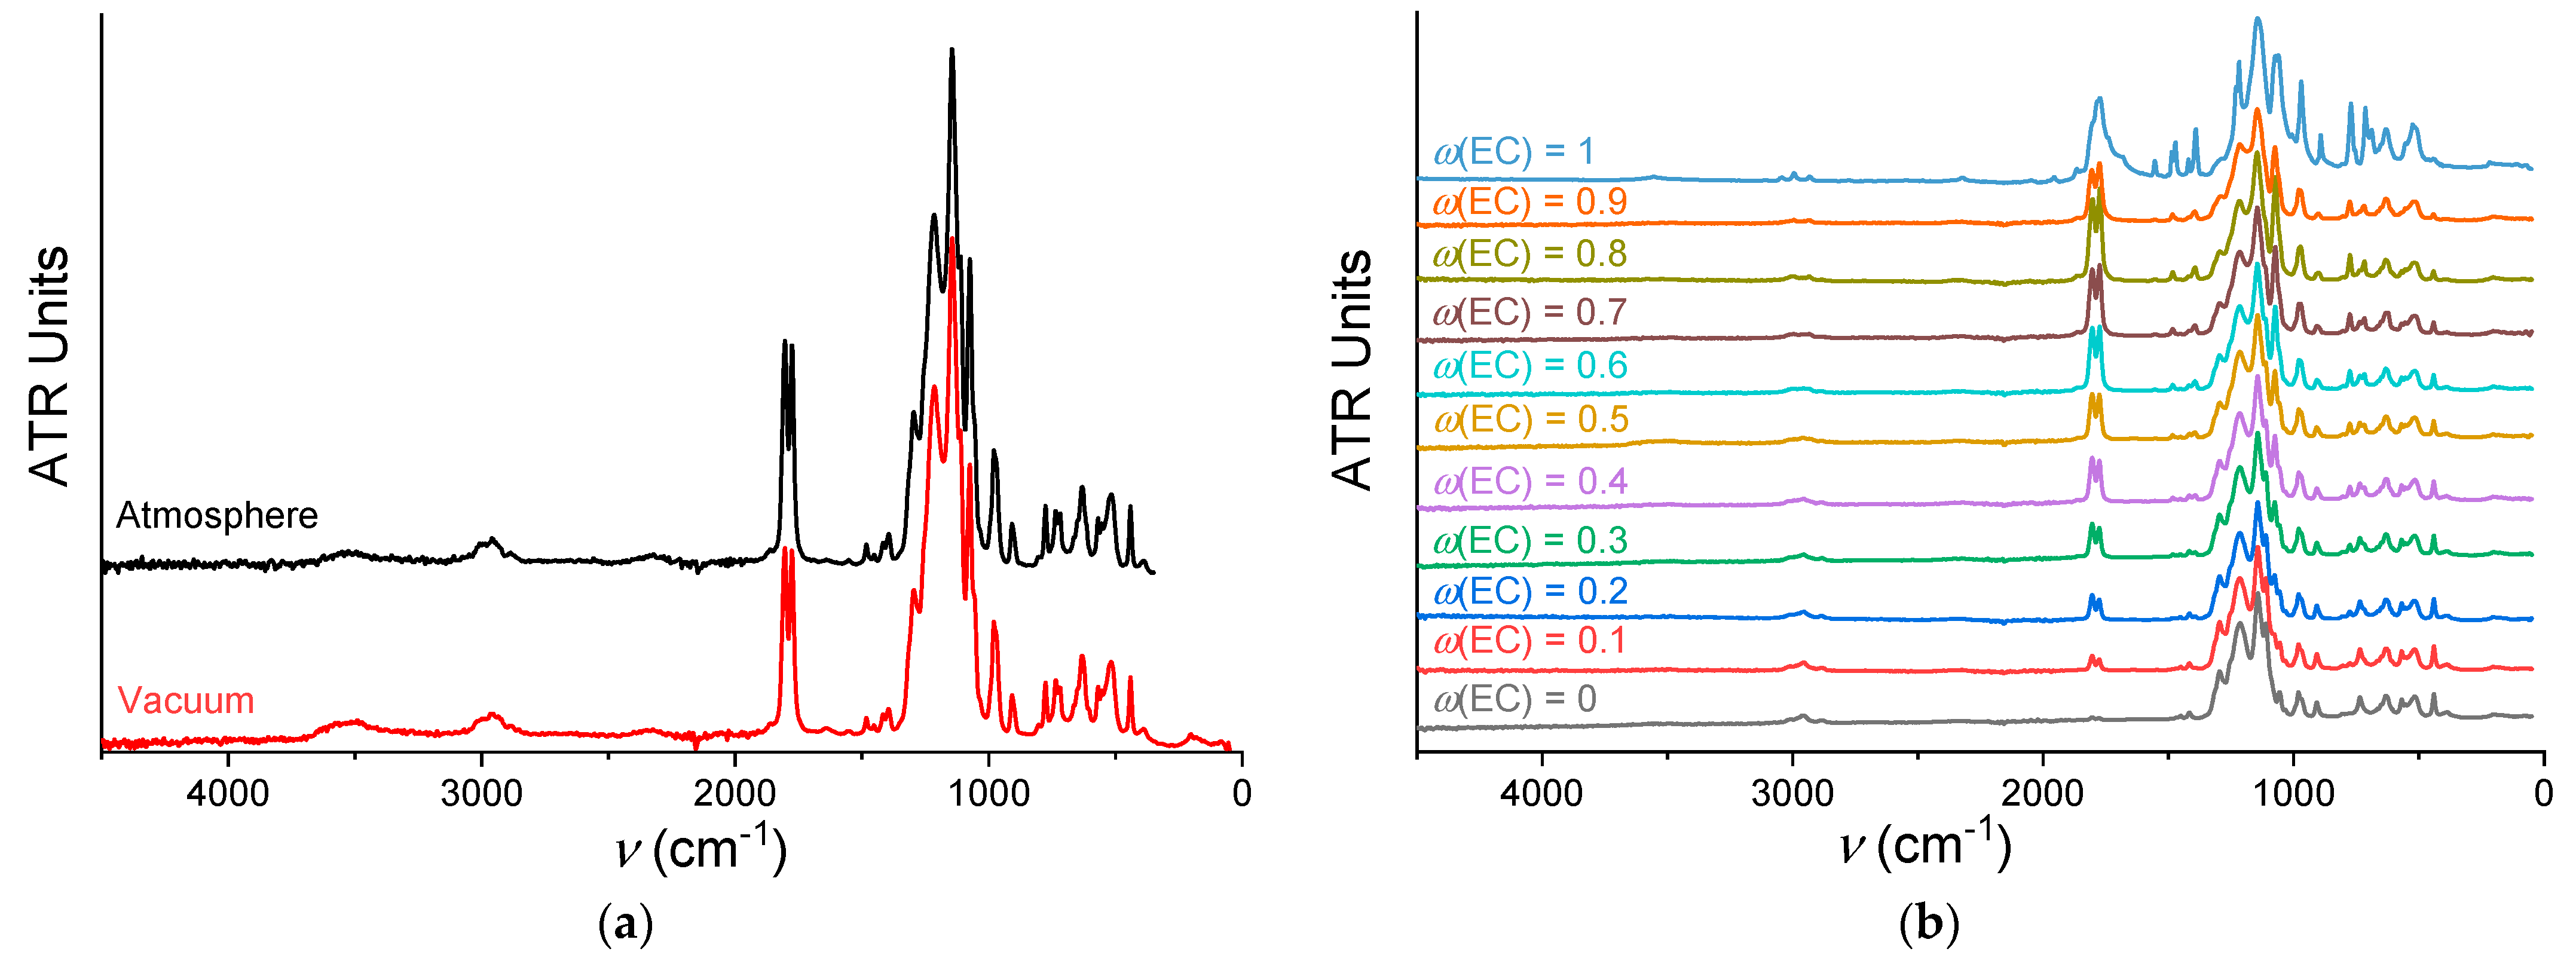
2.5. IR Spectroscopy
2.6. AC Conductivity Measurements
3. Results and Discussion
3.1. Solvent Uptake
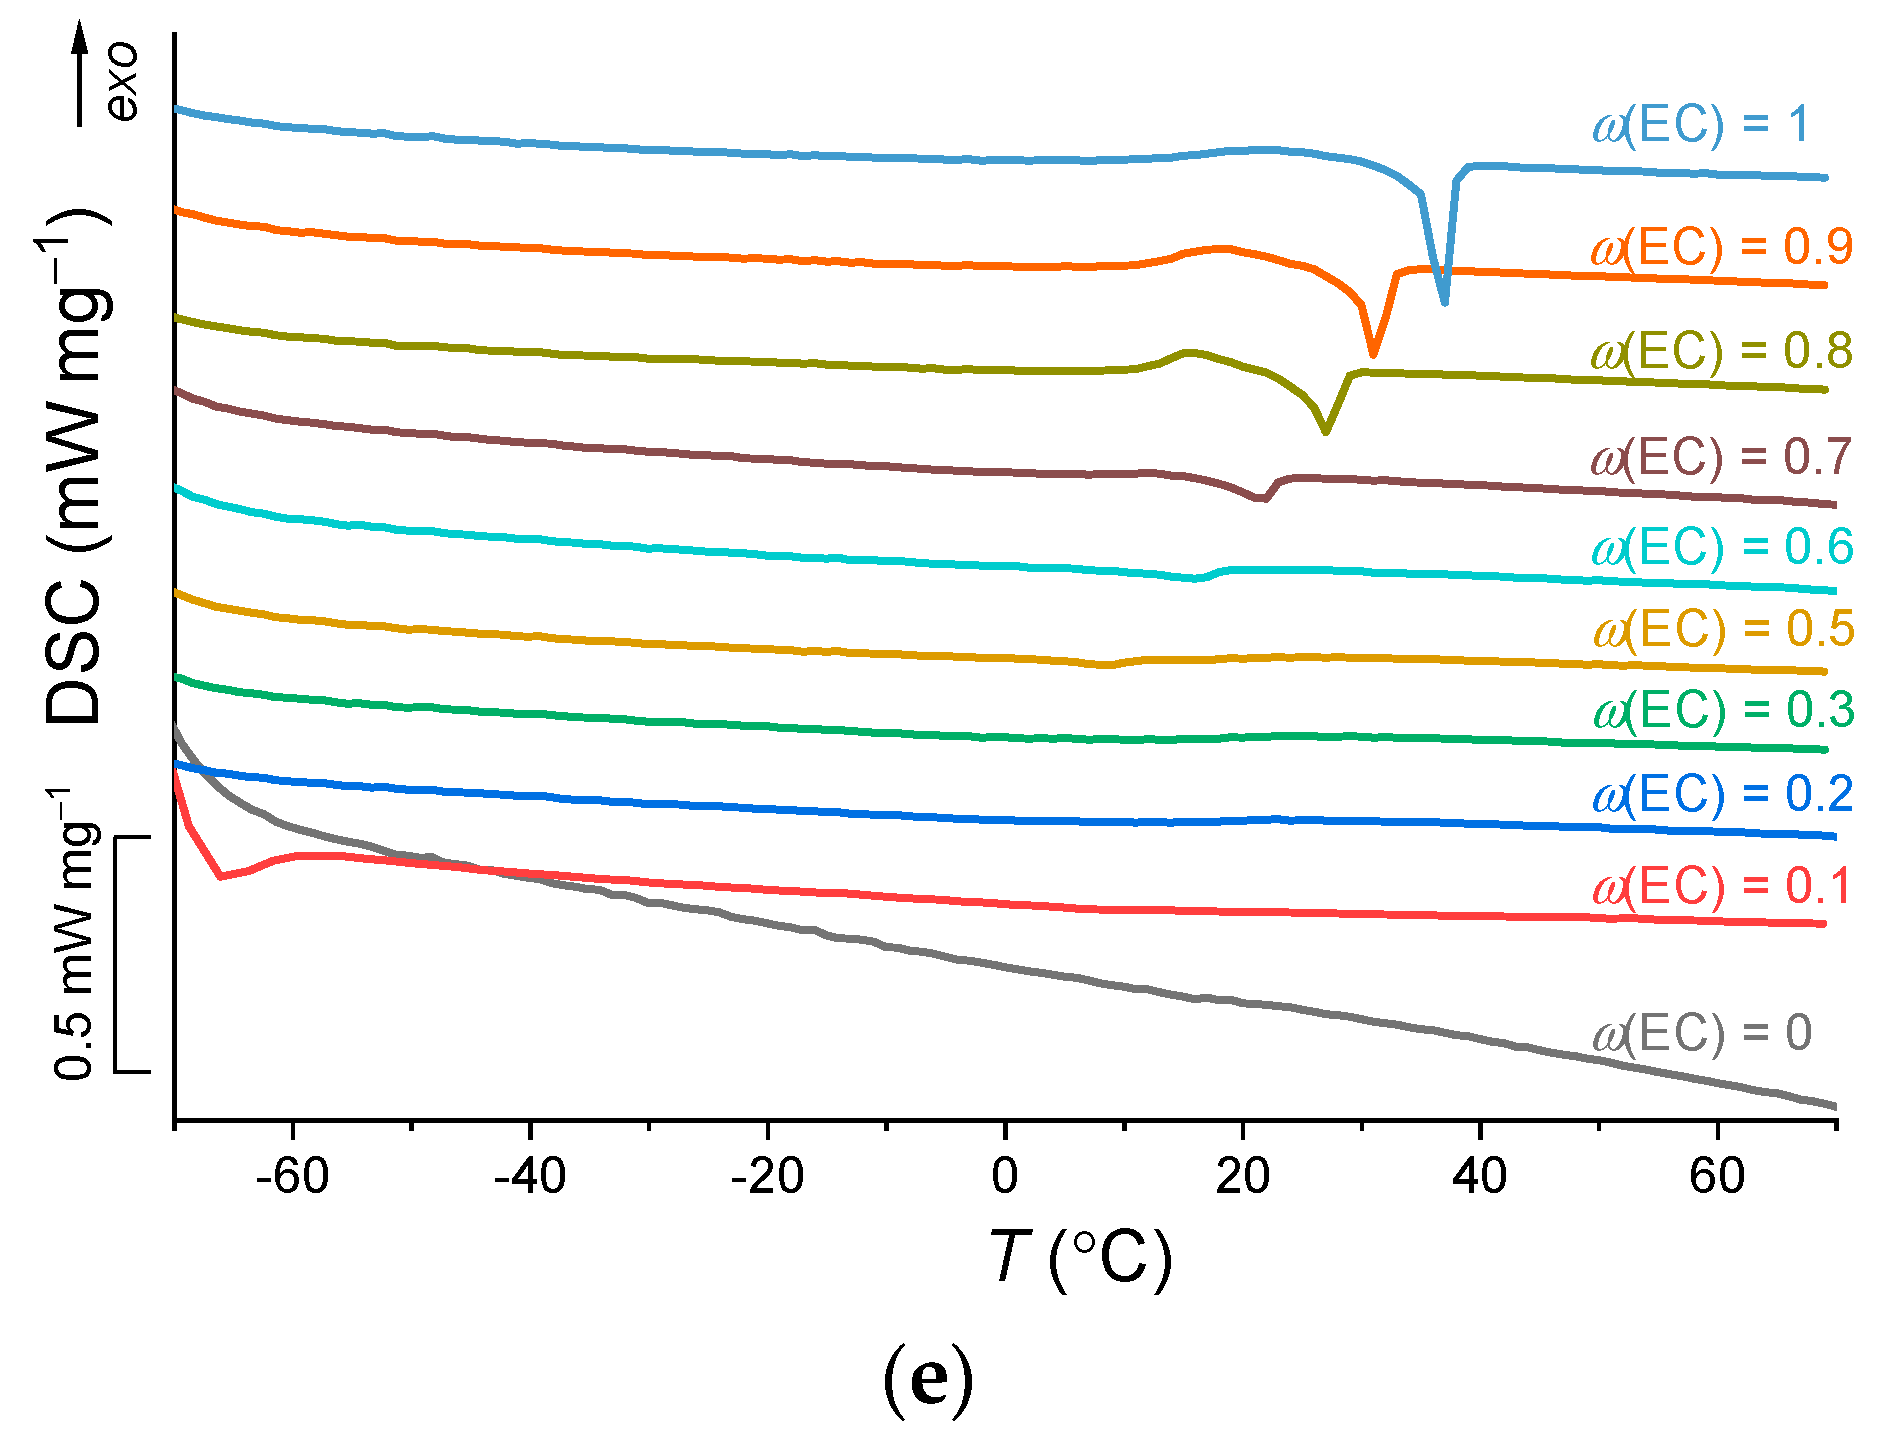
3.2. Thermal Stability
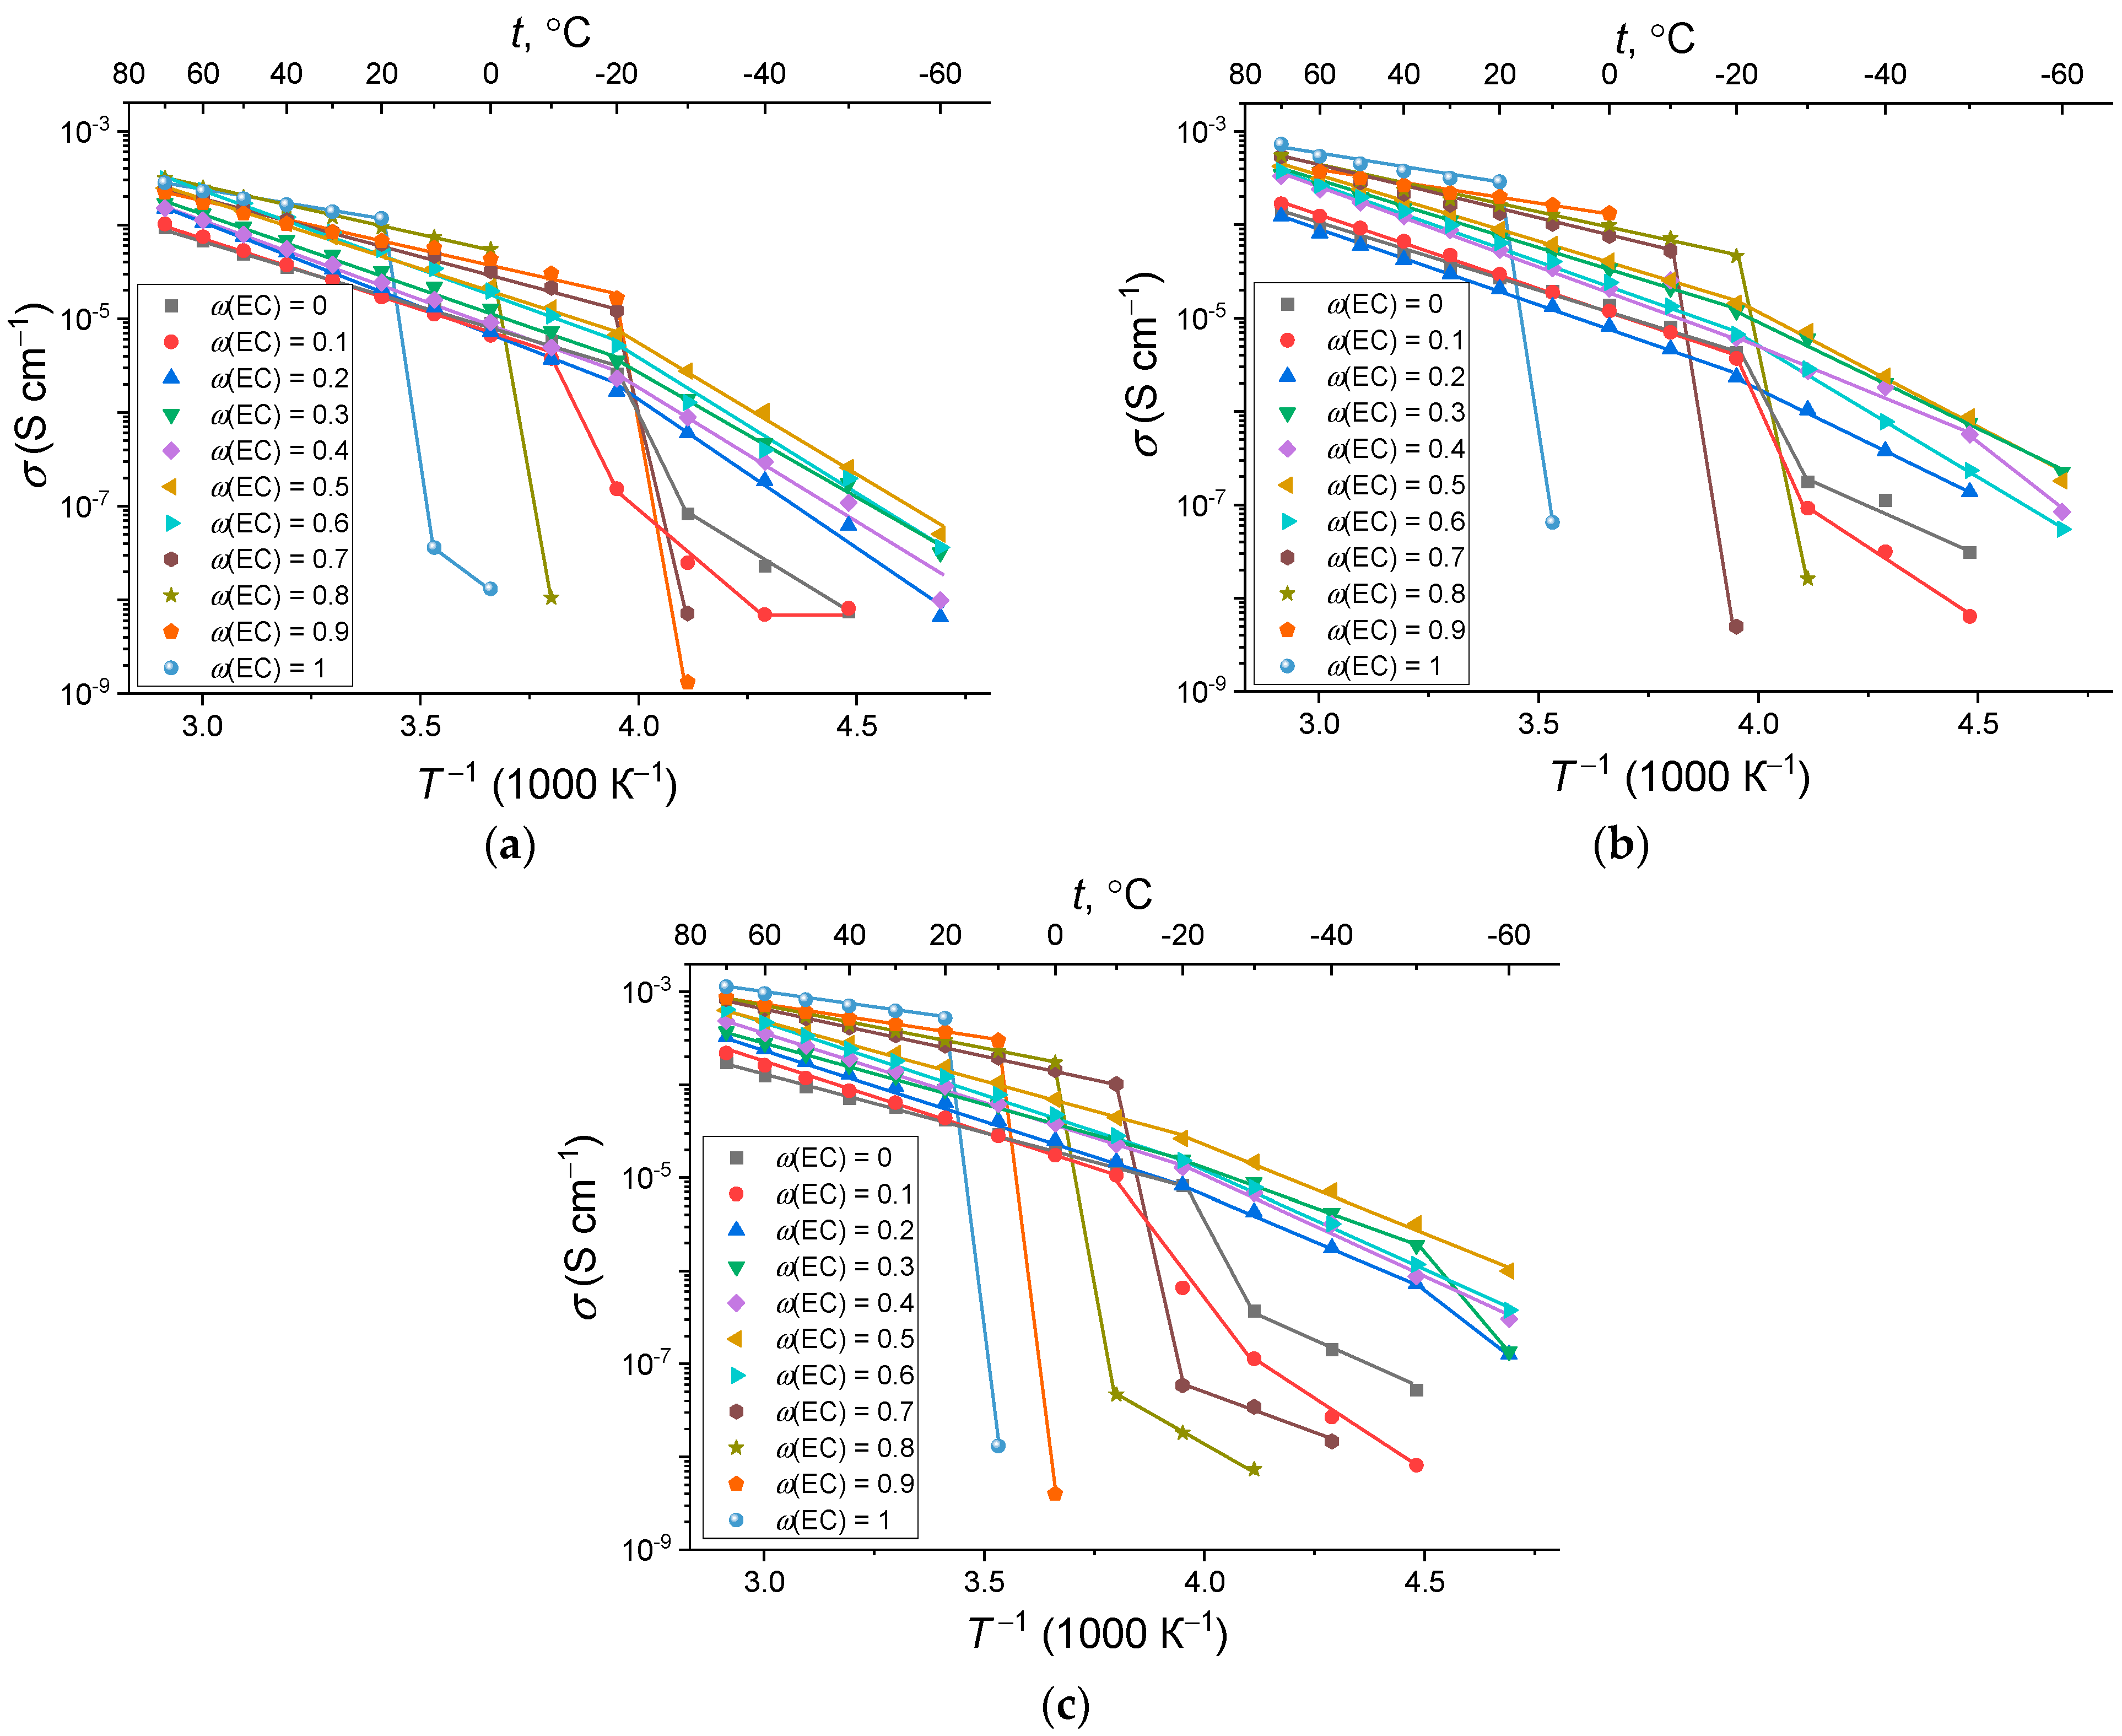
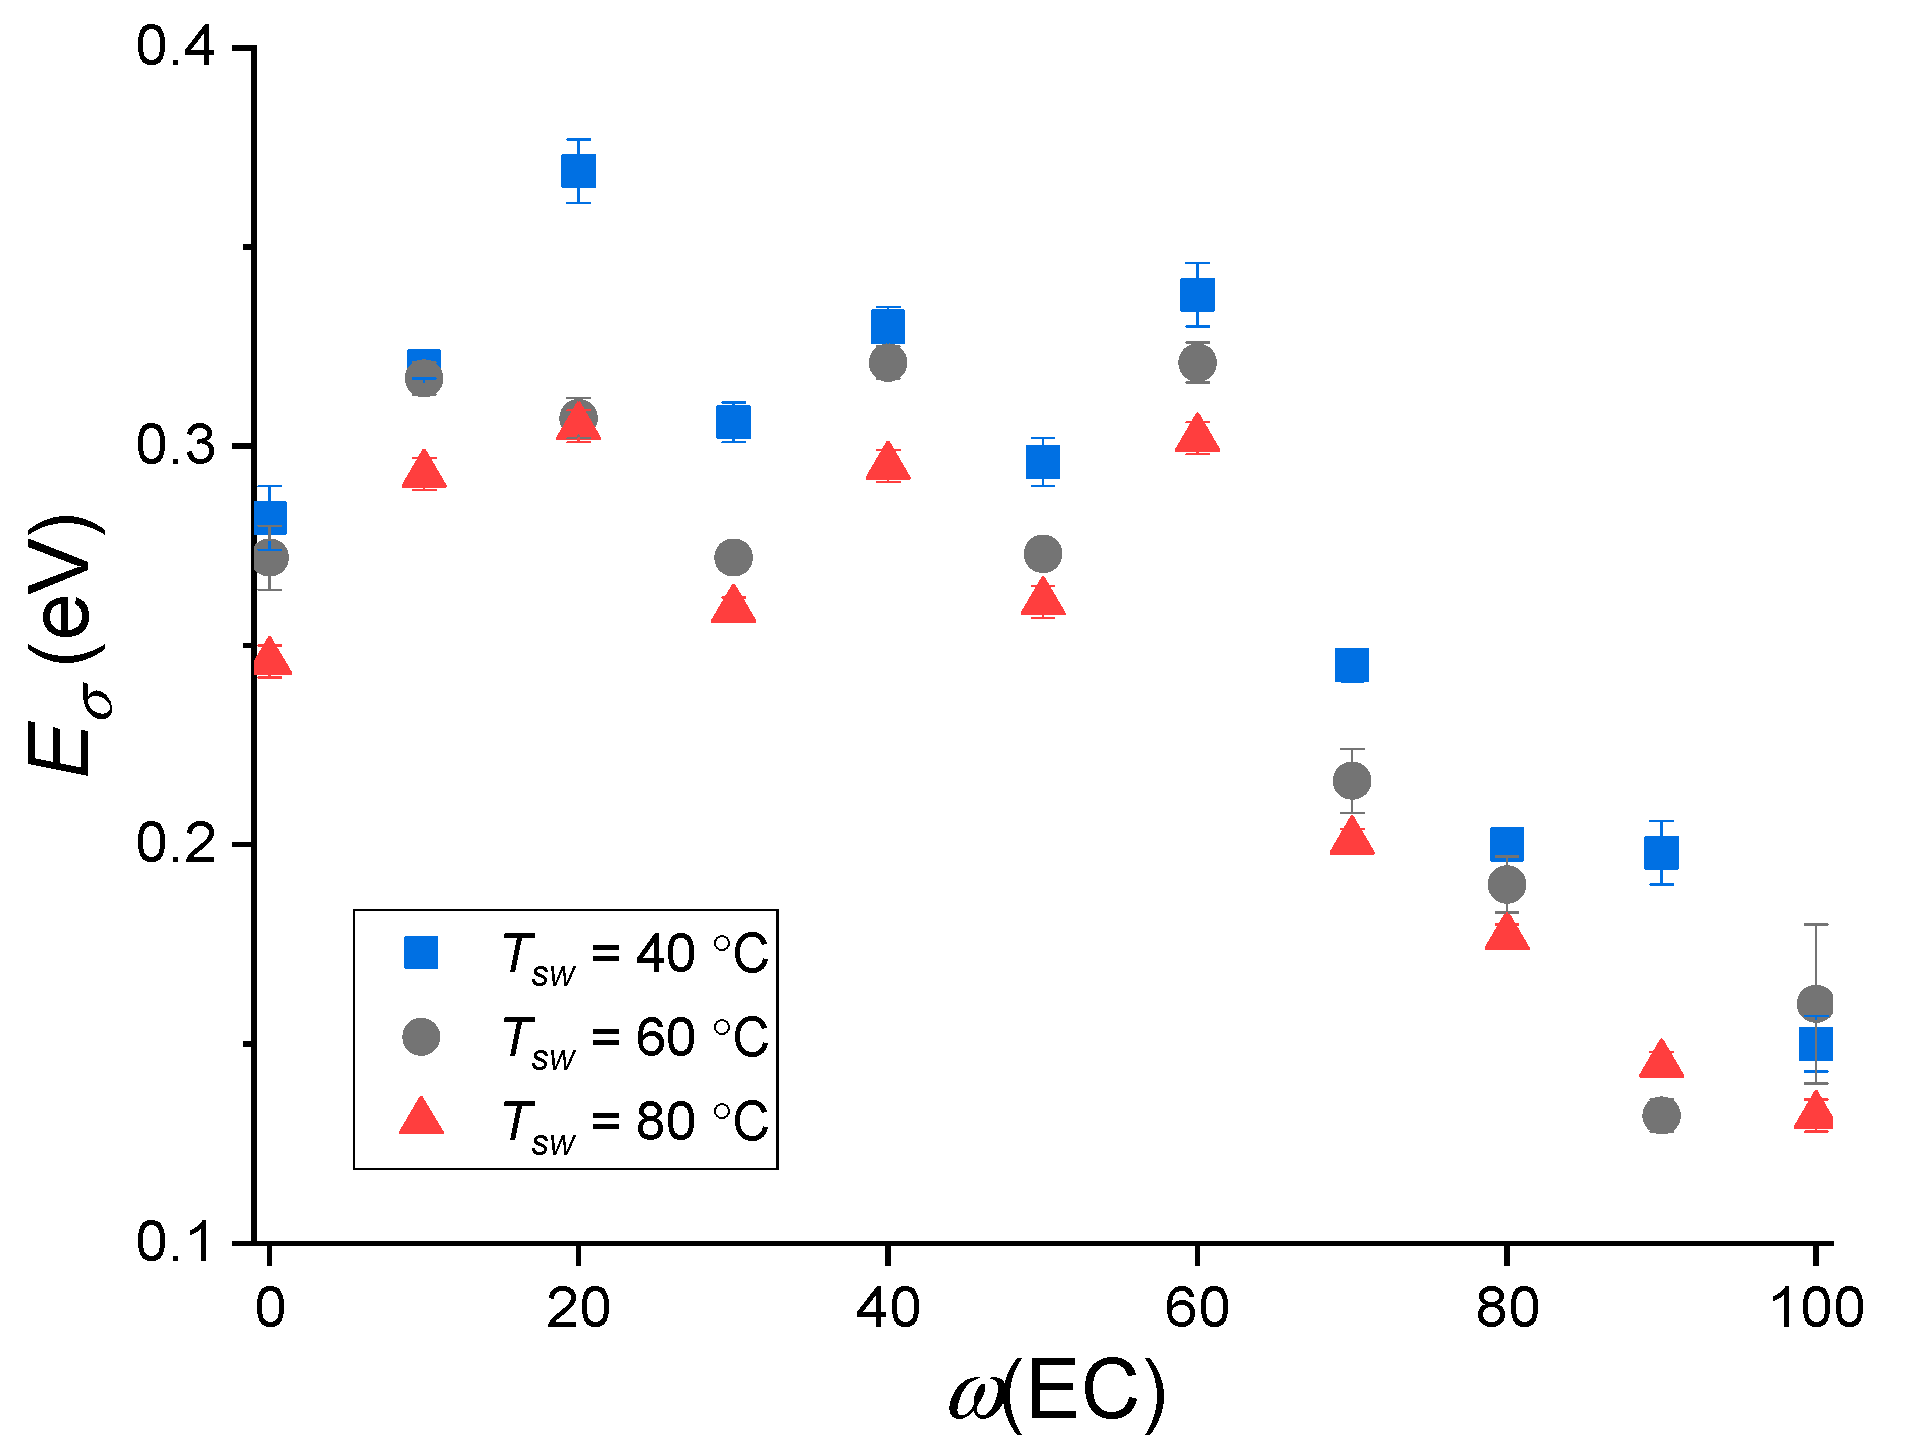
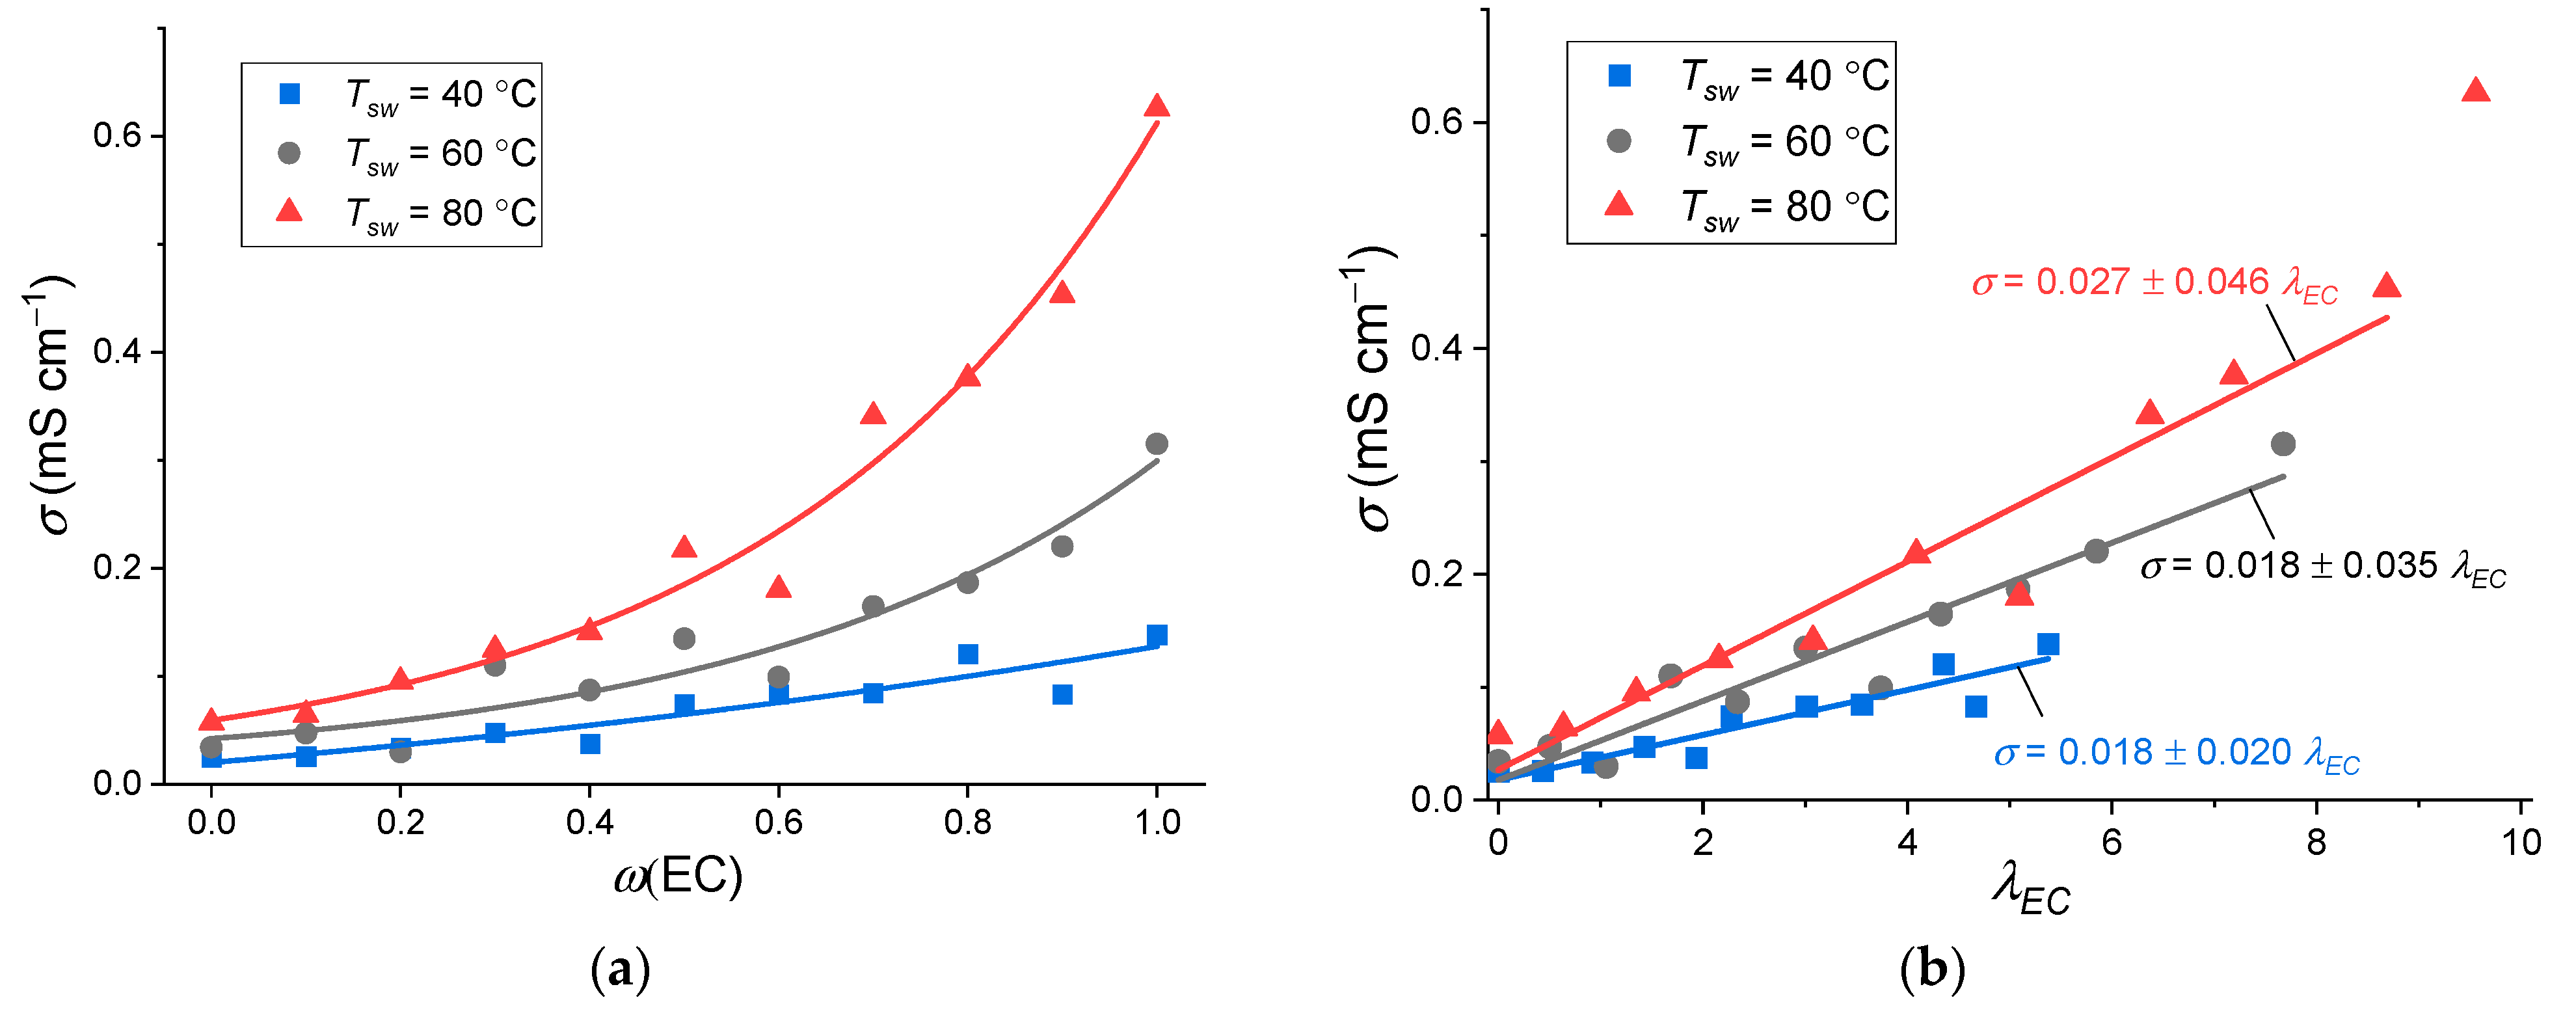
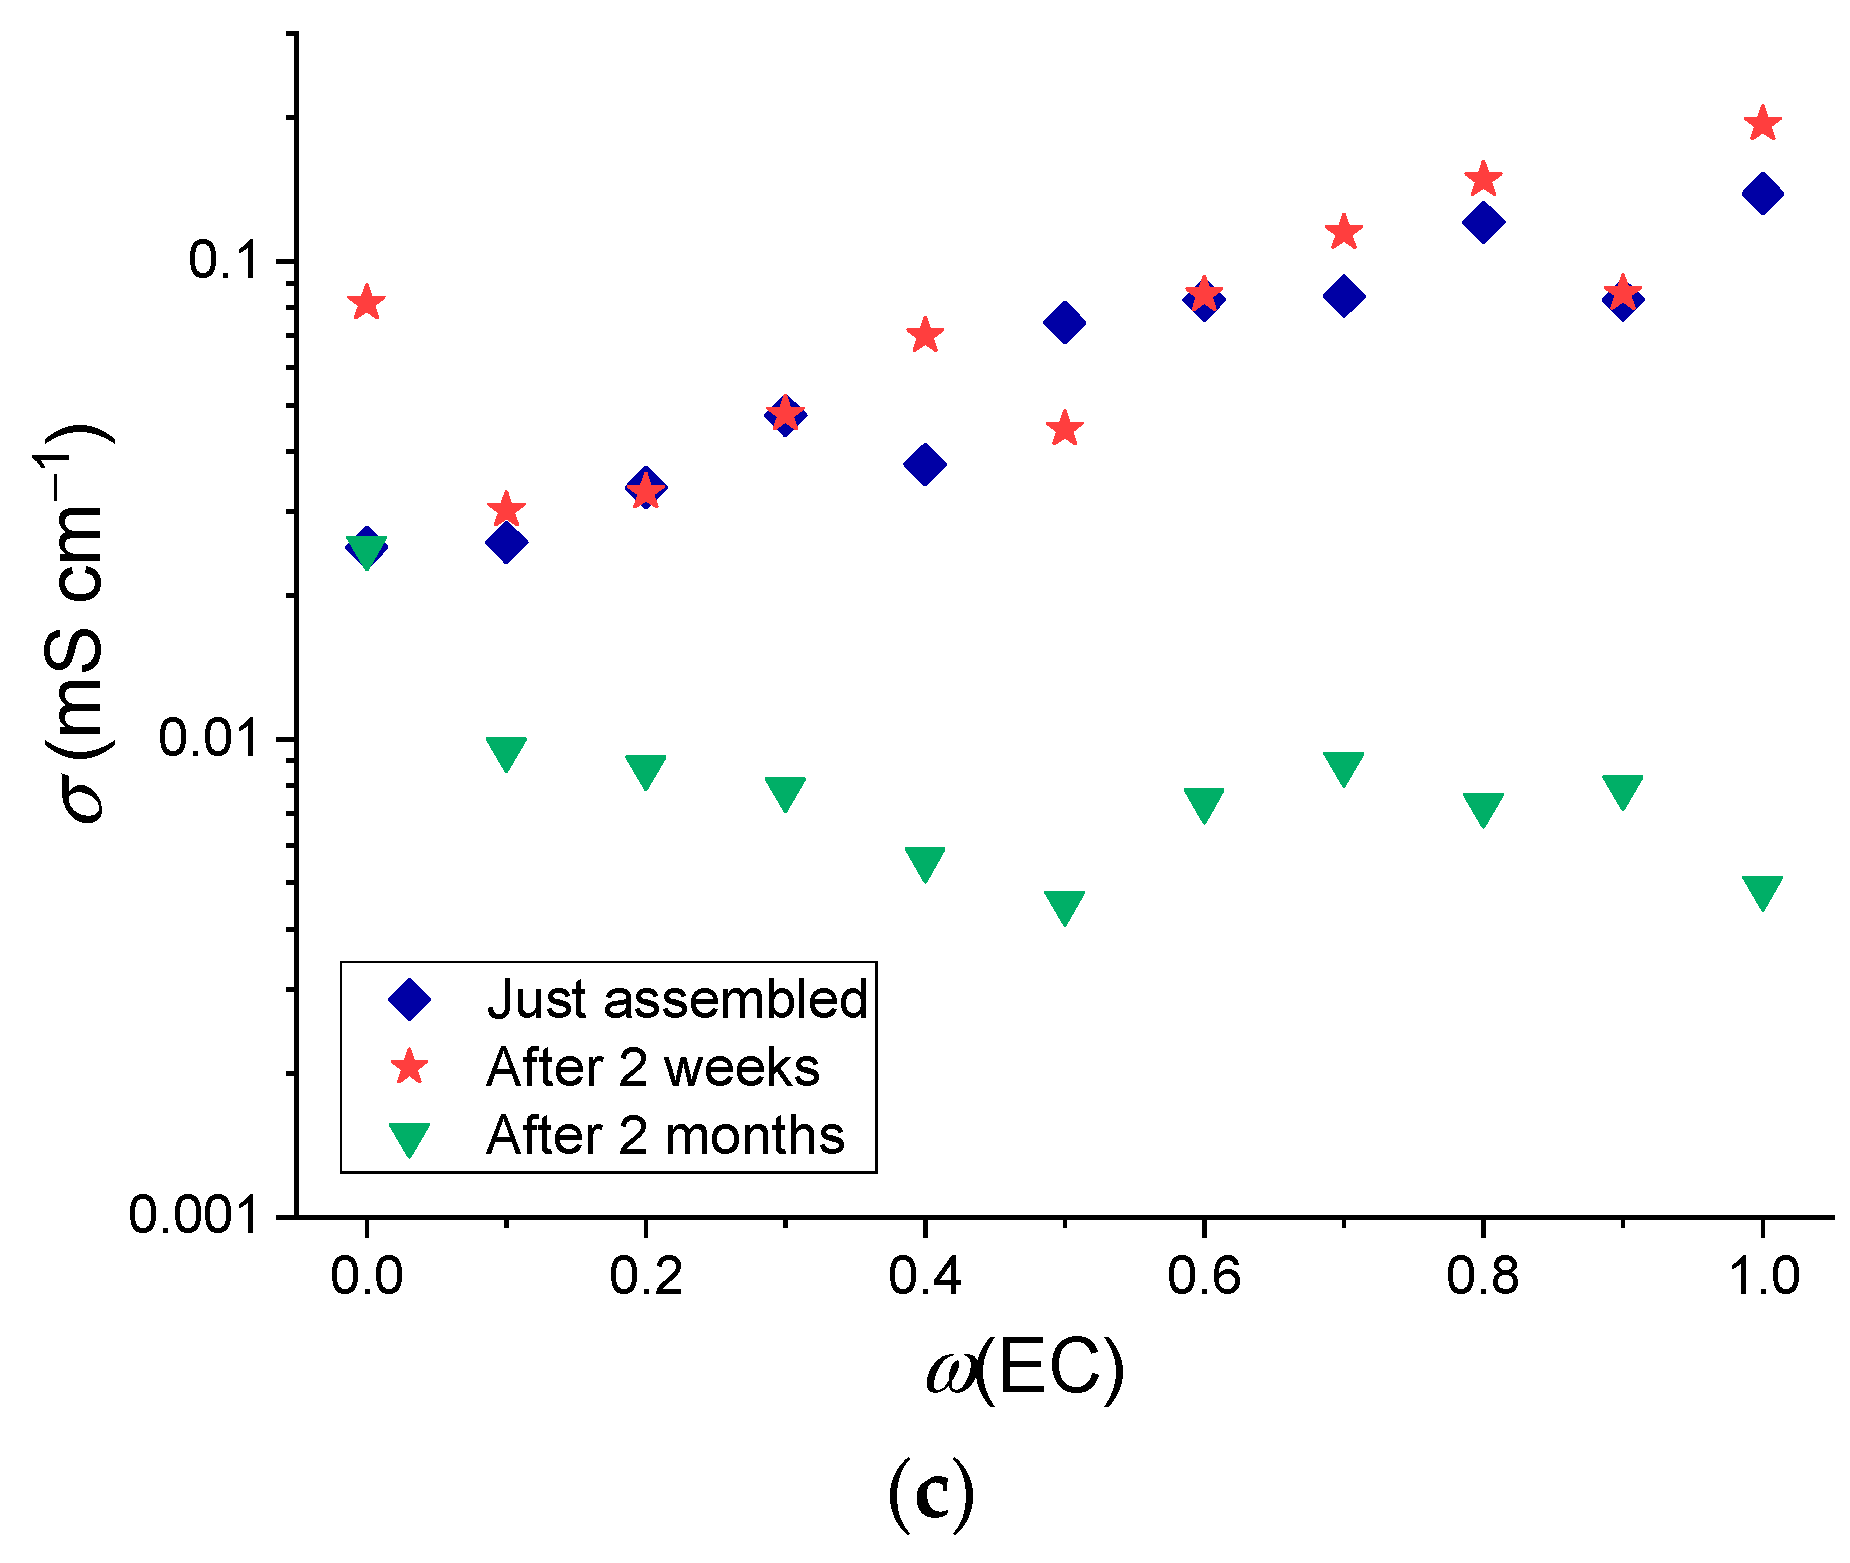
3.3. Ionic Conductivity
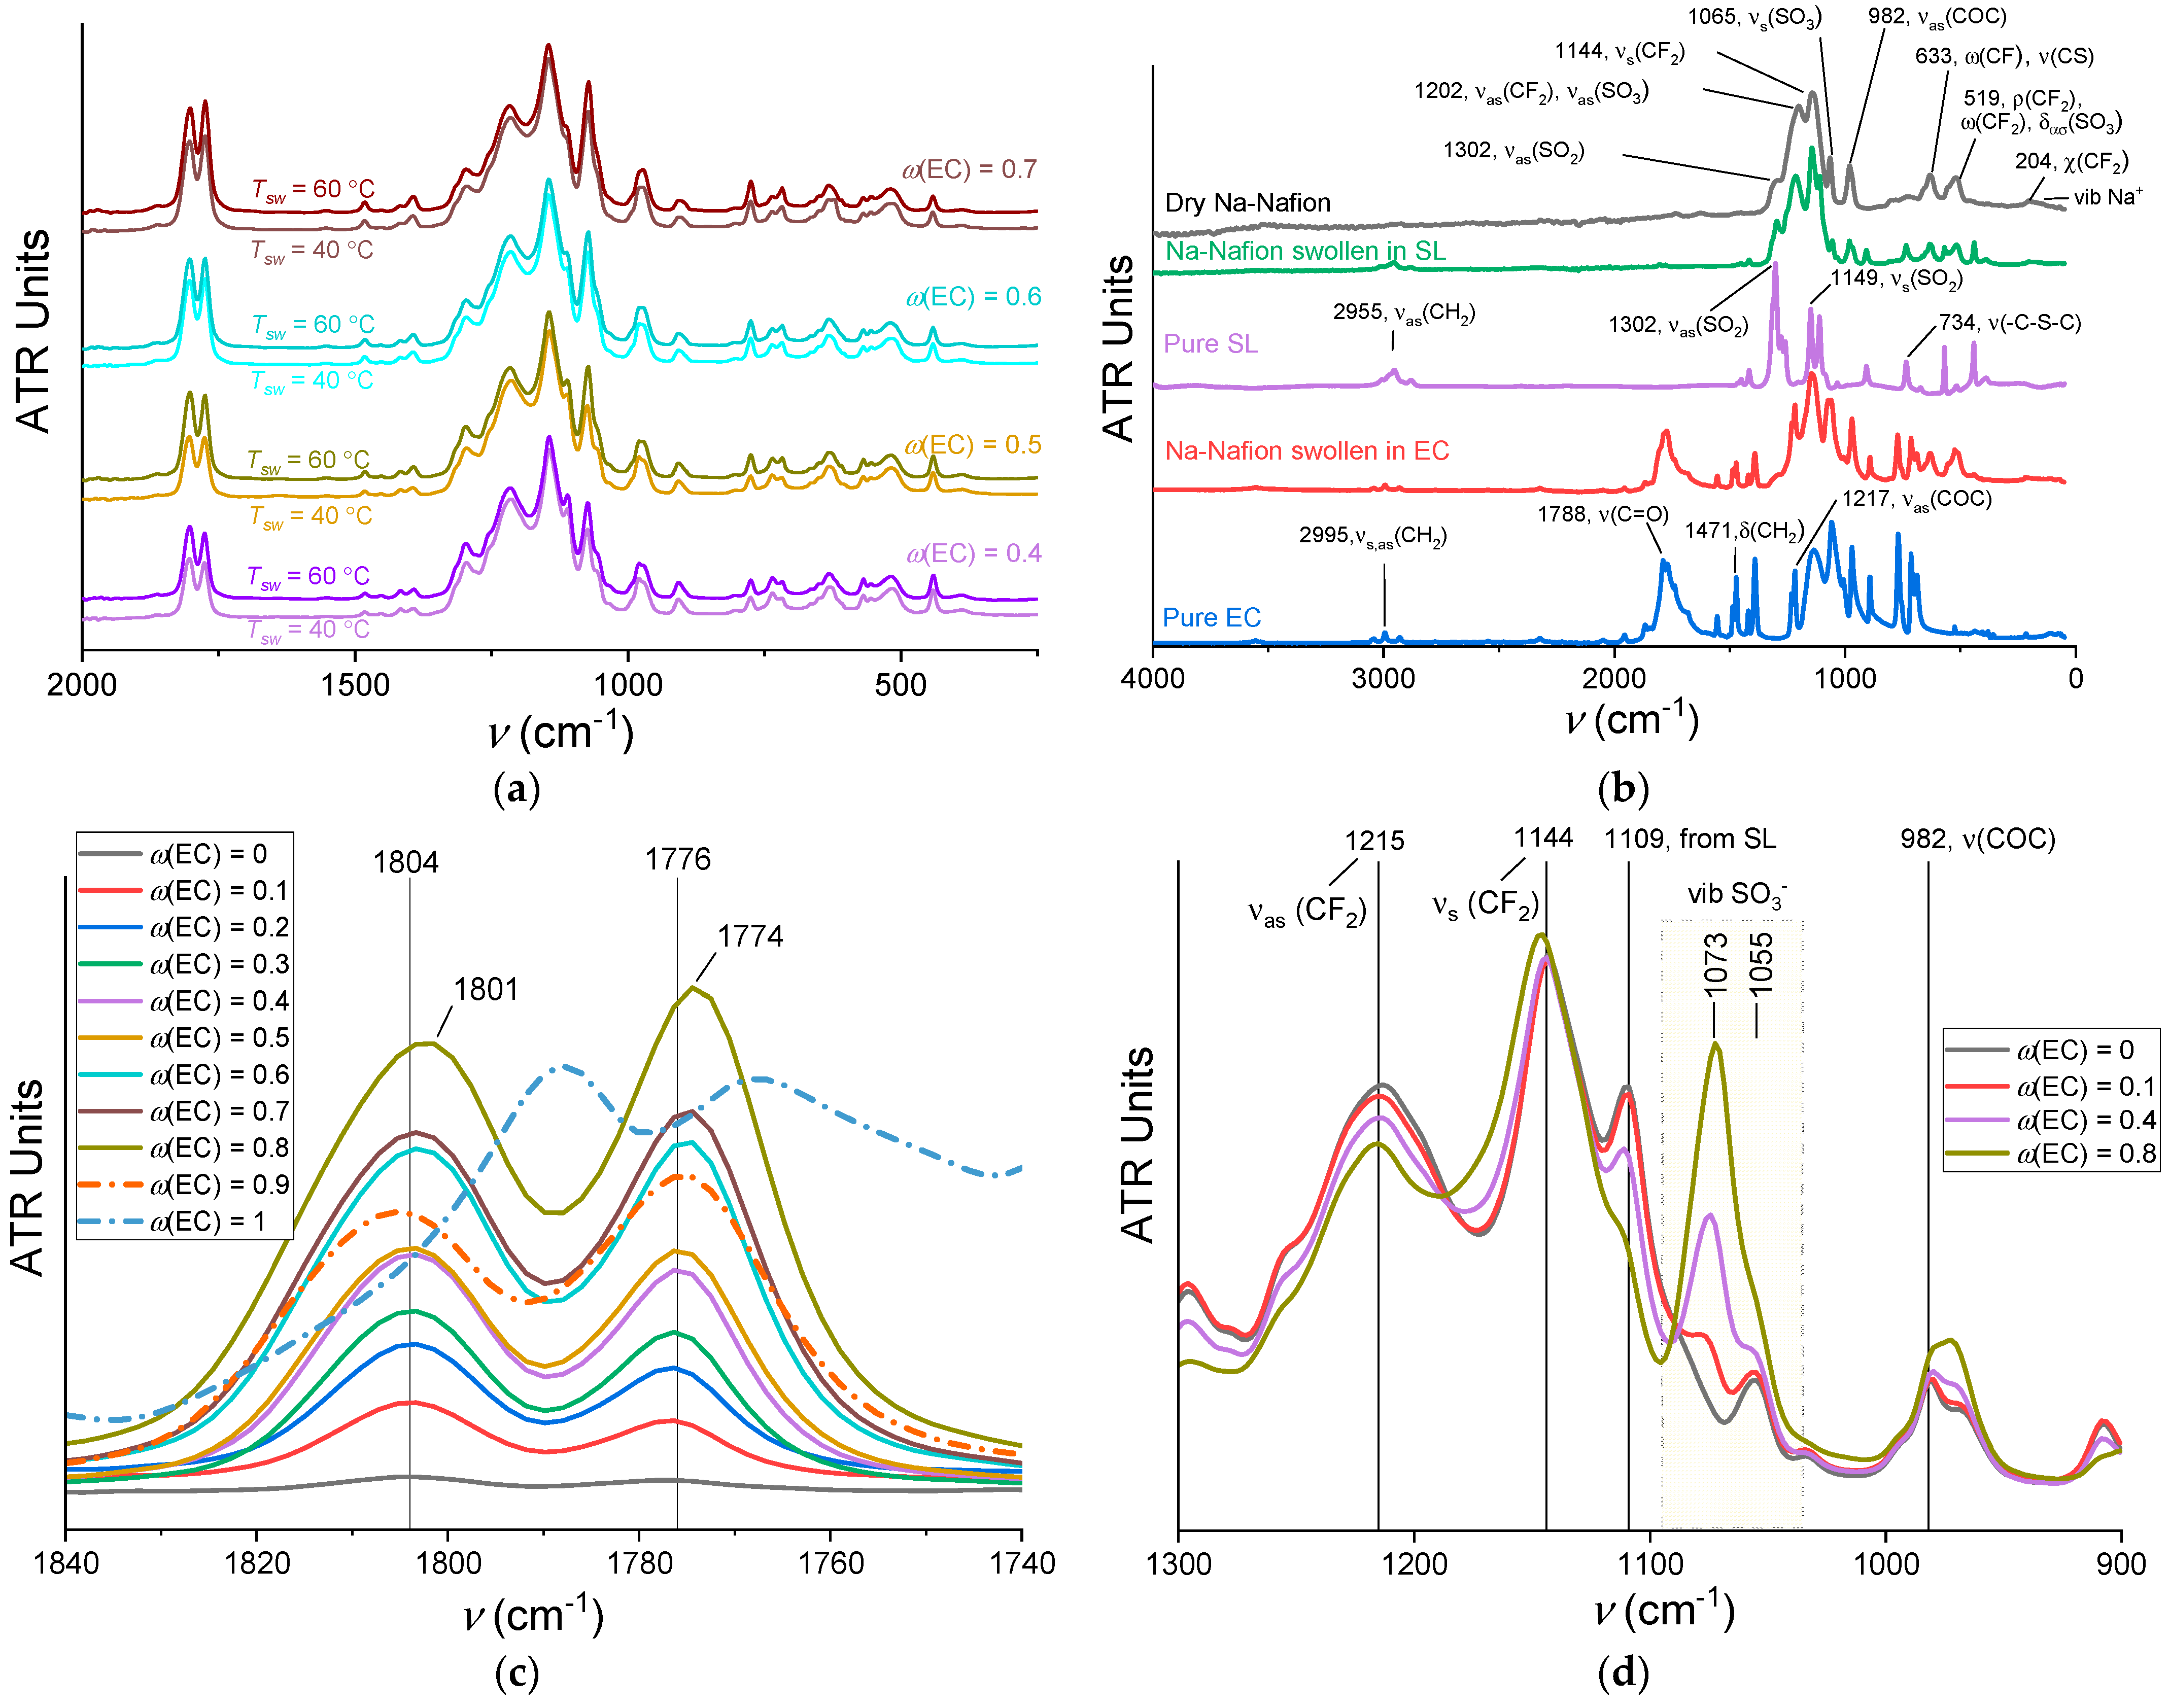
3.4. Intermolecular Interactions
4. Conclusions
Author Contributions
Funding
Institutional Review Board Statement
Informed Consent Statement
Data Availability Statement
Conflicts of Interest
References
- Vignarooban, K.; Kushagra, R.; Elango, A.; Badami, P.; Mellander, B.E.; Xu, X.; Tucker, T.G.; Nam, C.; Kannan, A.M. Current Trends and Future Challenges of Electrolytes for Sodium-Ion Batteries. Int. J. Hydrog. Energy 2016, 41, 2829–2846. [Google Scholar] [CrossRef]
- Ponrouch, A.; Monti, D.; Boschin, A.; Steen, B.; Johansson, P.; Palacín, M.R. Non-Aqueous Electrolytes for Sodium-Ion Batteries. J. Mater. Chem. A 2015, 3, 22–42. [Google Scholar] [CrossRef]
- Lithium Price Forecast: Will the Price Keep Its Bull Run? Available online: https://capital.com/lithium-price-forecast (accessed on 2 August 2022).
- Faradion. Available online: https://faradion.co.uk (accessed on 2 August 2022).
- Eshetu, G.G.; Elia, G.A.; Armand, M.; Forsyth, M.; Komaba, S.; Rojo, T.; Passerini, S. Electrolytes and Interphases in Sodium-Based Rechargeable Batteries: Recent Advances and Perspectives. Adv. Energy Mater. 2020, 10, 2000093. [Google Scholar] [CrossRef]
- Kusoglu, A.; Weber, A.Z. New Insights into Perfluorinated Sulfonic-Acid Ionomers. Chem. Rev. 2017, 117, 987–1104. [Google Scholar] [CrossRef] [PubMed]
- Sanginov, E.A.; Borisevich, S.S.; Kayumov, R.R.; Istomina, A.S.; Evshchik, E.Y.; Reznitskikh, O.G.; Yaroslavtseva, T.V.; Melnikova, T.I.; Dobrovolsky, Y.A.; Bushkova, O.V. Lithiated Nafion Plasticised by a Mixture of Ethylene Carbonate and Sulfolane. Electrochim. Acta 2021, 373, 137914. [Google Scholar] [CrossRef]
- Zhu, L.Y.; Li, Y.C.; Liu, J.; He, J.; Wang, L.Y.; Lei, J. Du Recent Developments in High-Performance Nafion Membranes for Hydrogen Fuel Cells Applications. Pet. Sci. 2021, 19, 1371–1381. [Google Scholar] [CrossRef]
- Ng, W.W.; Thiam, H.S.; Pang, Y.L.; Chong, K.C.; Lai, S.O. A State-of-Art on the Development of Nafion-Based Membrane for Performance Improvement in Direct Methanol Fuel Cells. Membranes 2022, 12, 506. [Google Scholar] [CrossRef]
- Ramirez-Nava, J.; Martínez-Castrejón, M.; García-Mesino, R.L.; López-Díaz, J.A.; Talavera-Mendoza, O.; Sarmiento-Villagrana, A.; Rojano, F.; Hernández-Flores, G. The Implications of Membranes Used as Separators in Microbial Fuel Cells. Membranes 2021, 11, 738. [Google Scholar] [CrossRef]
- Fernihough, O.; Ismail, M.S.; El-kharouf, A. Intermediate Temperature PEFC’s with Nafion® 211 Membrane Electrolytes: An Experimental and Numerical Study. Membranes 2022, 12, 430. [Google Scholar] [CrossRef]
- Li, J.; Liu, J.; Xu, W.; Long, J.; Huang, W.; He, Z.; Liu, S.; Zhang, Y. A Sulfonated Polyimide/Nafion Blend Membrane with High Proton Selectivity and Remarkable Stability for Vanadium Redox Flow Battery. Membranes 2021, 11, 946. [Google Scholar] [CrossRef]
- Jiang, B.; Wu, L.; Yu, L.; Qiu, X.; Xi, J. A Comparative Study of Nafion Series Membranes for Vanadium Redox Flow Batteries. J. Membr. Sci. 2016, 510, 18–26. [Google Scholar] [CrossRef]
- Gao, J.; Sun, C.; Xu, L.; Chen, J.; Wang, C.; Guo, D.; Chen, H. Lithiated Nafion as Polymer Electrolyte for Solid-State Lithium Sulfur Batteries Using Carbon-Sulfur Composite Cathode. J. Power Sources 2018, 382, 179–189. [Google Scholar] [CrossRef]
- Cao, C.; Wang, H.; Liu, W.; Liao, X.; Li, L. Nafion Membranes as Electrolyte and Separator for Sodium-Ion Battery. Int. J. Hydrog. Energy 2014, 39, 16110–16115. [Google Scholar] [CrossRef]
- Liang, H.Y.; Qiu, X.P.; Zhang, S.C.; Zhu, W.T.; Chen, L.Q. Study of Lithiated Nafion Ionomer for Lithium Batteries. J. Appl. Electrochem. 2004, 34, 1211–1214. [Google Scholar] [CrossRef]
- Nicotera, I.; Simari, C.; Agostini, M.; Enotiadis, A.; Brutti, S. A Novel Li+-Nafion-Sulfonated Graphene Oxide Membrane as Single Lithium-Ion Conducting Polymer Electrolyte for Lithium Batteries. J. Phys. Chem. C 2019, 123, 27406–27416. [Google Scholar] [CrossRef]
- Voropaeva, D.Y.; Novikova, S.A.; Yaroslavtsev, A.B. Polymer Electrolytes for Metal-Ion Batteries. Russ. Chem. Rev. 2020, 89, 1132–1155. [Google Scholar] [CrossRef]
- Esposito, E.; Minotti, A.; Fontananova, E.; Longo, M.; Jansen, J.C.; Figoli, A. Green H2 Production by Water Electrolysis Using Cation Exchange Membrane: Insights on Activation and Ohmic Polarization Phenomena. Membranes 2022, 12, 15. [Google Scholar] [CrossRef]
- Ahmad Kamaroddin, M.F.; Sabli, N.; Tuan Abdullah, T.A.; Siajam, S.I.; Abdullah, L.C.; Abdul Jalil, A.; Ahmad, A. Membrane-Based Electrolysis for Hydrogen Production: A Review. Membranes 2021, 11, 810. [Google Scholar] [CrossRef] [PubMed]
- Van Der Wal, P.D.; De Rooij, N.F.; Koudelka-Hep, M. Extremely Stable Nafion Based Carbon Monoxide Sensor. Sens. Actuators B Chem. 1996, 35, 119–123. [Google Scholar] [CrossRef]
- Velayutham, G.; Ramesh, C.; Murugesan, N.; Manivannan, V.; Dhathathreyan, K.S.; Periaswami, G. Nafion Based Amperometric Hydrogen Sensor. Ionics 2004, 10, 63–67. [Google Scholar] [CrossRef]
- Zhang, H.; Li, C.; Piszcz, M.; Coya, E.; Rojo, T.; Rodriguez-Martinez, L.M.; Armand, M.; Zhou, Z. Single Lithium-Ion Conducting Solid Polymer Electrolytes: Advances and Perspectives. Chem. Soc. Rev. 2017, 46, 797–815. [Google Scholar] [CrossRef] [PubMed]
- Doyle, M.; Fuller, T.F.; Newman, J. The Importance of the Lithium Ion Transference Number in Lithium/Polymer Cells. Electrochim. Acta 1994, 39, 2073–2081. [Google Scholar] [CrossRef]
- Kayumov, R.R.; Shmygleva, L.V.; Evshchik, E.Y.; Sanginov, E.A.; Popov, N.A.; Bushkova, O.V.; Dobrovolsky, Y.A. Conductivity of Lithium-Conducting Nafion Membranes Plasticized by Binary and Ternary Mixtures in the Sulfolan–Ethylene Carbonate–Diglyme System. Russ. J. Electrochem. 2021, 57, 911–920. [Google Scholar] [CrossRef]
- Doyle, M.; Lewittes, M.E.; Roelofs, M.G.; Perusich, S.A.; Lowrey, R.E. Relationship between Ionic Conductivity of Perfluorinated Ionomeric Membranes and Nonaqueous Solvent Properties. J. Membr. Sci. 2001, 184, 257–273. [Google Scholar] [CrossRef]
- Sanginov, E.A.; Kayumov, R.R.; Shmygleva, L.V.; Lesnichaya, V.A.; Karelin, A.I.; Dobrovolsky, Y.A. Study of the Transport of Alkali Metal Ions in a Nonaqueous Polymer Electrolyte Based on Nafion. Solid State Ion. 2017, 300, 26–31. [Google Scholar] [CrossRef]
- Sanginov, E.A.; Evshchik, E.Y.; Kayumov, R.R.; Dobrovol’skii, Y.A. Lithium-Ion Conductivity of the Nafion Membrane Swollen in Organic Solvents. Russ. J. Electrochem. 2015, 51, 986–990. [Google Scholar] [CrossRef]
- Voropaeva, D.Y.; Novikova, S.A.; Kulova, T.L.; Yaroslavtsev, A.B. Solvation and Sodium Conductivity of Nonaqueous Polymer Electrolytes Based on Nafion-117 Membranes and Polar Aprotic Solvents. Solid State Ionics 2018, 324, 28–32. [Google Scholar] [CrossRef]
- Ding, M.S.; Xu, K.; Jow, T.R. Liquid-Solid Phase Diagrams of Binary Carbonates for Lithium Batteries. J. Electrochem. Soc. 2000, 147, 1688–1694. [Google Scholar] [CrossRef]
- Reznitskikh, O.G.; Istomina, A.S.; Borisevich, S.S.; Evshchik, E.Y.; Sanginov, E.A.; Bushkova, O.V.; Dobrovolsky, Y.A. Phase Diagram of Ethylene Carbonate–Sulfolane System. Russ. J. Phys. Chem. A 2021, 95, 1121–1127. [Google Scholar] [CrossRef]
- Istomina, A.S.; Yaroslavtseva, T.V.; Reznitskikh, O.G.; Kayumov, R.R.; Shmygleva, L.V.; Sanginov, E.A.; Dobrovolsky, Y.A.; Bushkova, O.V. Li-Nafion Membrane Plasticised with Ethylene Carbonate/Sulfolane: Influence of Mixing Temperature on the Physicochemical Properties. Polymers 2021, 13, 1150. [Google Scholar] [CrossRef] [PubMed]
- Kulova, T.; Skundin, A.; Chekannikov, A.; Novikova, S.; Voropaeva, D.; Yaroslavtsev, A. Sodium Rechargeable Batteries with Electrolytes Based on Nafion Membranes Intercalated by Mixtures of Organic Solvents. Batteries 2018, 4, 61. [Google Scholar] [CrossRef]
- Simari, C.; Tuccillo, M.; Brutti, S.; Nicotera, I. Sodiated Nafion Membranes for Sodium Metal Aprotic Batteries. Electrochim. Acta 2022, 410, 139936. [Google Scholar] [CrossRef]
- Gebel, G.; Aldebert, P.; Pineri, M. Swelling Study of Perfluorosulphonated Ionomer Membranes. Polymer 1993, 34, 333–339. [Google Scholar] [CrossRef]
- Kayumov, R.R.; Sanginov, E.A.; Shmygleva, L.V.; Radaeva, A.P.; Karelin, A.I.; Zyubin, A.S.; Zyubina, T.S.; Anokhin, D.V.; Ivanov, D.A.; Dobrovolsky, Y.A. Ammonium Form of Nafion Plasticized by Dimethyl Sulfoxide. J. Electrochem. Soc. 2019, 166, F3216–F3226. [Google Scholar] [CrossRef]
- De Almeida, S.H.; Kawano, Y. Thermal Behavior of Nafion Membranes. J. Therm. Anal. Calorim. 1999, 58, 569–577. [Google Scholar] [CrossRef]
- Feldheim, D.L.; Lawson, D.R.; Martin, C.R. Influence of the Sulfonate Countercation on the Thermal Stability of Nafion Perfluorosulfonate Membranes. J. Polym. Sci. Part B Polym. Phys. 1993, 31, 953–957. [Google Scholar] [CrossRef]
- Johnson, P.H. The Properties of Ethylene Carbonate and Its Use in Electrochemical Applications: A Literature Review; Lawrence Berkeley National Laboratory: Berkley, CA, USA, 1985. [Google Scholar]
- Pokorný, V.; Štejfa, V.; Fulem, M.; Červinka, C.; Růžička, K. Vapor Pressures and Thermophysical Properties of Ethylene Carbonate, Propylene Carbonate, γ-Valerolactone, and γ-Butyrolactone. J. Chem. Eng. Data 2017, 62, 4174–4186. [Google Scholar] [CrossRef]
- Thompson, E.L.; Capehart, T.W.; Fuller, T.J.; Jorne, J. Investigation of Low-Temperature Proton Transport in Nafion Using Direct Current Conductivity and Differential Scanning Calorimetry. J. Electrochem. Soc. 2006, 153, A2351. [Google Scholar] [CrossRef]
- Lue, S.J.; Shieh, S.J. Water States in Perfluorosulfonic Acid Membranes Using Differential Scanning Calorimetry. J. Macromol. Sci. Part B Phys. 2009, 48, 114–127. [Google Scholar] [CrossRef]
- Gruger, A.; Régis, A.; Schmatko, T.; Colomban, P. Nanostructure of Nafion® Membranes at Different States of Hydration: An IR and Raman Study. Vib. Spectrosc. 2001, 26, 215–225. [Google Scholar] [CrossRef]
- Karelin, A.I.; Kayumov, R.R.; Sanginov, E.A.; Dobrovolsky, Y.A. FTIR Spectroscopic Study of the Complex Formation between H+ and DMSO in Nafion. Spectrochim. Acta Part A Mol. Biomol. Spectrosc. 2017, 178, 94–104. [Google Scholar] [CrossRef]
- Karelin, A.I.; Kayumov, R.R.; Sanginov, E.A.; Dobrovolsky, Y.A. Structure of Lithium Ion-Conducting Polymer Membranes Based on Nafion Plasticized with Dimethylsulfoxide. Pet. Chem. 2016, 56, 1020–1026. [Google Scholar] [CrossRef]
- Bawagan, A.D.O.; Hamrock, S.J.; Schaberg, M.; Yousef, I.; Ritter, E.; Schade, U. Far-Infrared Studies on Nafion and Perfluoroimide Acid (PFIA) and Their Alkali Salts. Vib. Spectrosc. 2014, 75, 213–217. [Google Scholar] [CrossRef]
- Mattera, V.D.; Risen, W.M. Far-Infrared Study of Ionic Interactions in Poly(Styrene Sulfonic Acid) Ionomers. J. Polym. Sci. Part A-2 Polym. Phys. 1984, 22, 67–77. [Google Scholar] [CrossRef]
- Liu, Q.; Wu, F.; Mu, D.; Wu, B. A Theoretical Study on Na+ Solvation in Carbonate Ester and Ether Solvents for Sodium-Ion Batteries. Phys. Chem. Chem. Phys. 2020, 22, 2164–2175. [Google Scholar] [CrossRef]
- Pham, T.A.; Kweon, K.E.; Samanta, A.; Lordi, V.; Pask, J.E. Solvation and Dynamics of Sodium and Potassium in Ethylene Carbonate from Ab Initio Molecular Dynamics Simulations. J. Phys. Chem. C 2017, 121, 21913–21920. [Google Scholar] [CrossRef]
- Okoshi, M.; Yamada, Y.; Yamada, A.; Nakai, H. Theoretical Analysis on De-Solvation of Lithium, Sodium, and Magnesium Cations to Organic Electrolyte Solvents. J. Electrochem. Soc. 2013, 160, A2160–A2165. [Google Scholar] [CrossRef]


| ω(EC) | Tph, °C | ΔHcalc, J g−1 | ΔHexp, J g−1 | ωF, % | λECF | λNONF |
|---|---|---|---|---|---|---|
| 1 | 36.4 | 151.1 | 15.6 | 10.3 | 0.56 | 4.8 |
| 0.9 | 31.5 | 150.7 | 9.5 | 6.3 | 0.29 | 4.9 |
| 0.8 | 27.4 | 150.3 | 7.1 | 4.7 | 0.21 | 5.1 |
| 0.7 | 21.6 | 149.8 | 4.1 | 2.7 | 0.10 | 5.0 |
| 0.6 | 16.4 | 149.3 | 2.9 | 2.0 | 0.06 | 4.9 |
| 0.5 | 9.1 | 148.6 | 1.7 | 1.2 | 0.03 | 4.5 |
Publisher’s Note: MDPI stays neutral with regard to jurisdictional claims in published maps and institutional affiliations. |
© 2022 by the authors. Licensee MDPI, Basel, Switzerland. This article is an open access article distributed under the terms and conditions of the Creative Commons Attribution (CC BY) license (https://creativecommons.org/licenses/by/4.0/).
Share and Cite
Krupina, A.A.; Kayumov, R.R.; Nechaev, G.V.; Lapshin, A.N.; Shmygleva, L.V. Polymer Electrolytes Based on Na-Nafion Plasticized by Binary Mixture of Ethylene Carbonate and Sulfolane. Membranes 2022, 12, 840. https://doi.org/10.3390/membranes12090840
Krupina AA, Kayumov RR, Nechaev GV, Lapshin AN, Shmygleva LV. Polymer Electrolytes Based on Na-Nafion Plasticized by Binary Mixture of Ethylene Carbonate and Sulfolane. Membranes. 2022; 12(9):840. https://doi.org/10.3390/membranes12090840
Chicago/Turabian StyleKrupina, Anna A., Ruslan R. Kayumov, Grigory V. Nechaev, Alexander N. Lapshin, and Lyubov V. Shmygleva. 2022. "Polymer Electrolytes Based on Na-Nafion Plasticized by Binary Mixture of Ethylene Carbonate and Sulfolane" Membranes 12, no. 9: 840. https://doi.org/10.3390/membranes12090840