
Biophysical Characterization of Membrane Proteins Embedded in Nanodiscs Using Fluorescence Correlation Spectroscopy

 , , ,
, , ,
Abstract
:1. Isolation of Membrane Proteins
2. Nanodiscs as a Membrane Mimetic
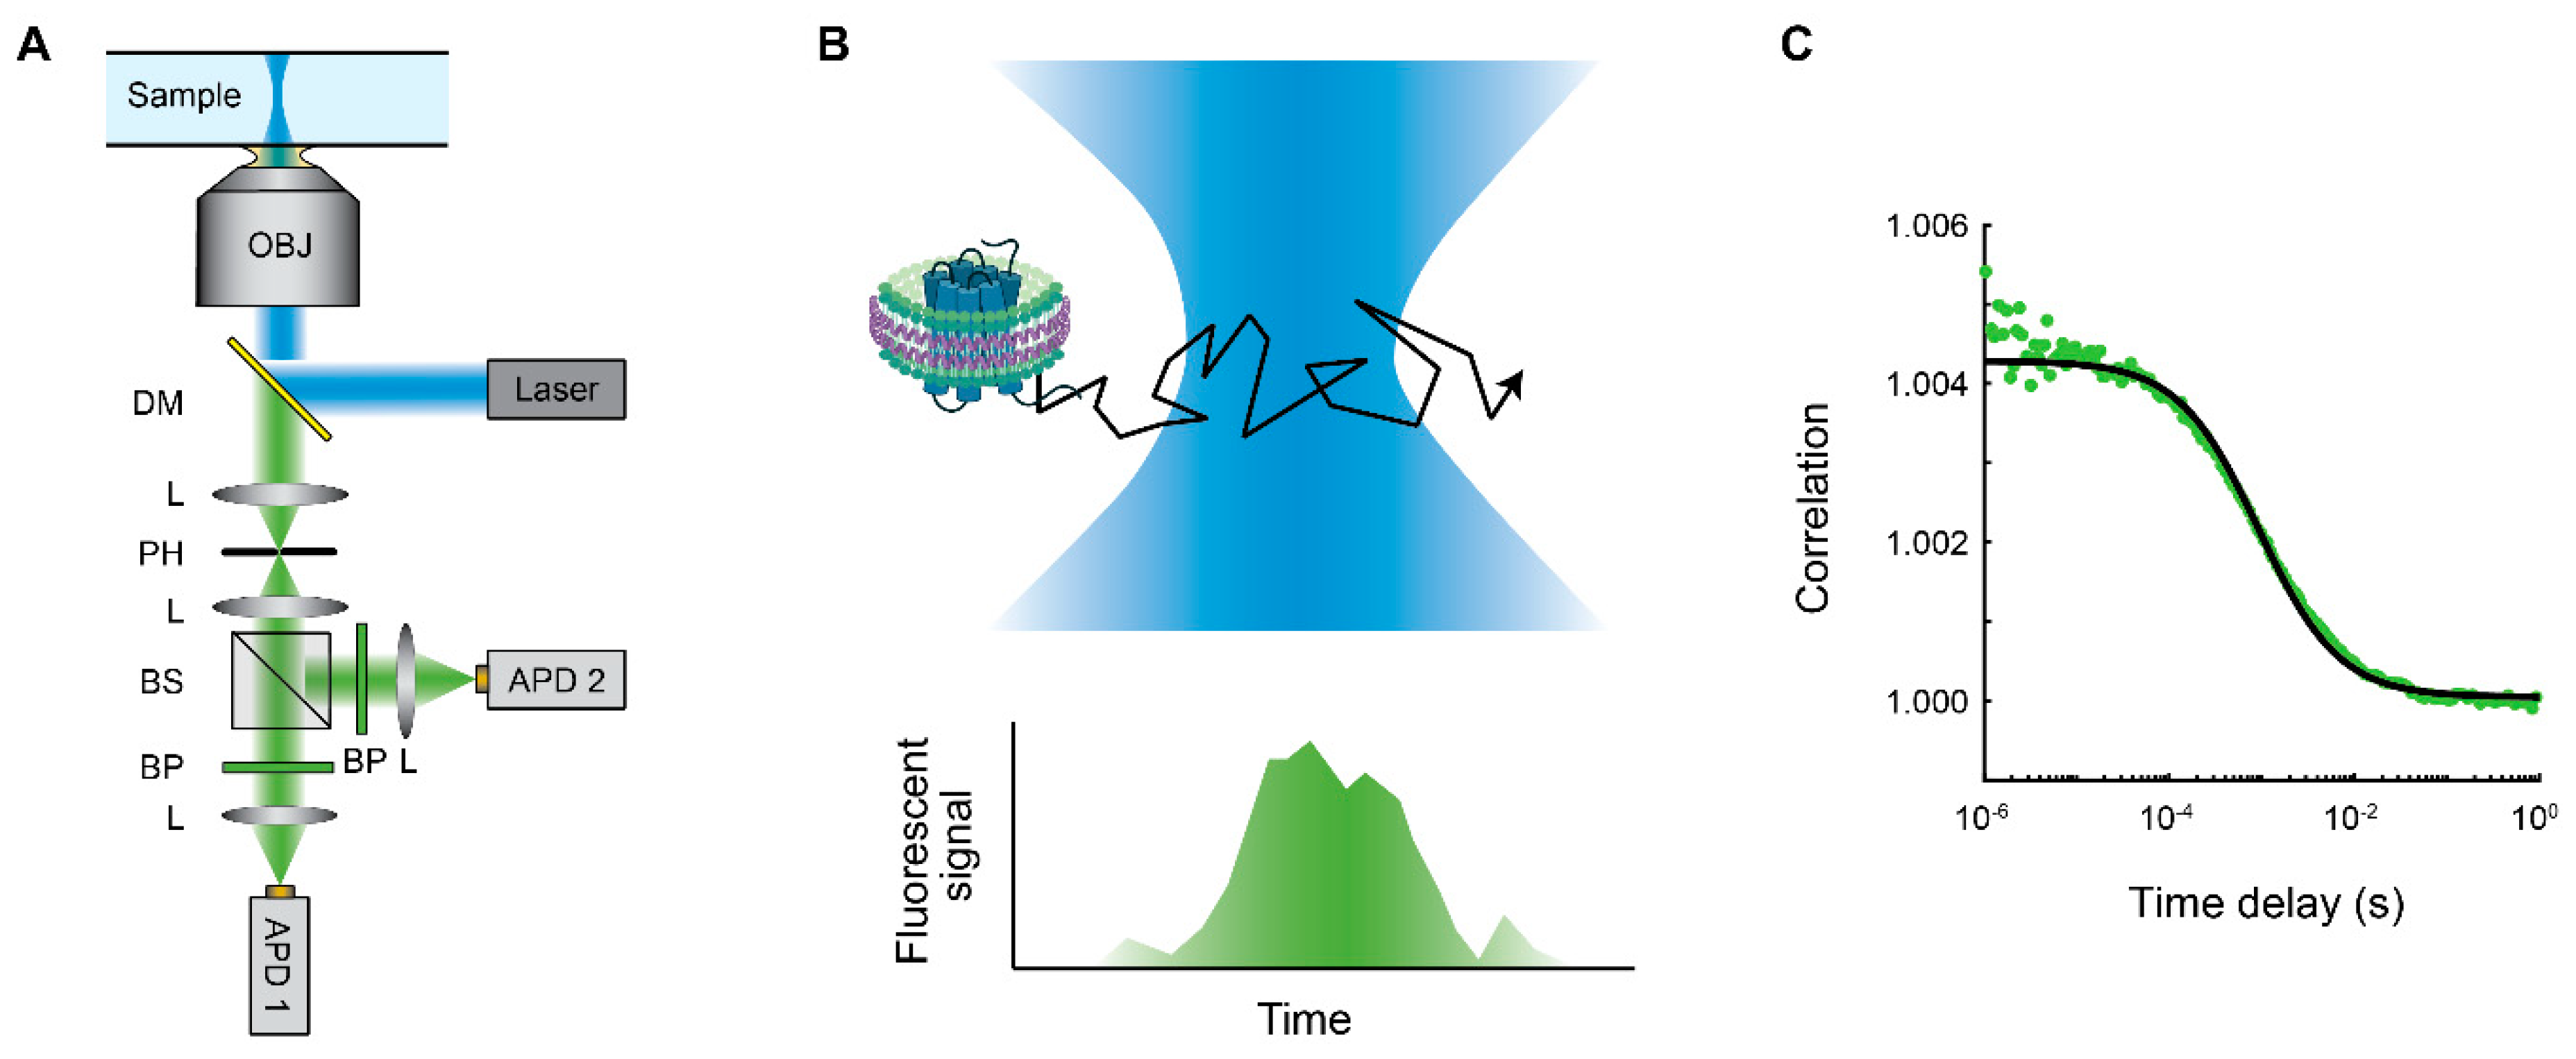
3. Fluorescence Correlation Spectroscopy
4. FCS Measurements of Membrane Proteins Embedded in Nanodiscs
5. Summary and Future Directions
Author Contributions
Funding
Institutional Review Board Statement
Informed Consent Statement
Data Availability Statement
Acknowledgments
Conflicts of Interest
References
- Almén, M.S.; Nordström, K.J.V.; Fredriksson, R.; Schiöth, H.B. Mapping the human membrane proteome: A majority of the human membrane proteins can be classified according to function and evolutionary origin. BMC Biol. 2009, 7, 50. [Google Scholar] [CrossRef] [PubMed] [Green Version]
- RCSB Protein Data Bank. Available online: https://www.rcsb.org/stats/growth/growth-protein (accessed on 19 January 2022).
- Rouck, J.E.; Krapf, J.E.; Roy, J.; Huff, H.C.; Das, A. Recent advances in nanodisc technology for membrane protein studies (2012–2017). FEBS Lett. 2017, 591, 2057–2088. [Google Scholar] [CrossRef] [PubMed] [Green Version]
- McGregor, C.-L.; Chen, L.; Pomroy, N.C.; Hwang, P.; Go, S.; Chakrabartty, A.; Privé, G.G. Lipopeptide detergents designed for the structural study of membrane proteins. Nat. Biotechnol. 2003, 21, 171–176. [Google Scholar] [CrossRef] [PubMed]
- Schafmeister, C.E.; Miercke, L.J.W.; Stroud, R.M. Structure at 2.5 Å of a Designed Peptide that Maintains Solubility of Membrane Proteins. Science 1993, 262, 734–738. [Google Scholar] [CrossRef] [PubMed]
- Tao, H.; Lee, S.C.; Moeller, A.; Roy, R.S.; Siu, F.Y.; Zimmermann, J.; Stevens, R.C.; Potter, C.S.; Carragher, B.; Zhang, Q. Engineered nanostructured β-sheet peptides protect membrane proteins. Nat. Methods 2013, 10, 759–761. [Google Scholar] [CrossRef] [Green Version]
- Zhao, X.; Nagai, Y.; Reeves, P.J.; Kiley, P.; Khorana, H.G.; Zhang, S. Designer short peptide surfactants stabilize G protein-coupled receptor bovine rhodopsin. Proc. Natl. Acad. Sci. USA 2006, 103, 17707–17712. [Google Scholar] [CrossRef] [Green Version]
- Tribet, C.; Audebert, R.; Popot, J.-L. Amphipols: Polymers that keep membrane proteins soluble in aqueous solutions. Proc. Natl. Acad. Sci. USA 1996, 93, 15047–15050. [Google Scholar] [CrossRef] [Green Version]
- Chae, P.S.; Rasmussen, S.G.F.; Rana, R.R.; Gotfryd, K.; Chandra, R.; Goren, M.A.; Kruse, A.C.; Nurva, S.; Loland, C.J.; Pierre, Y.; et al. Maltose–neopentyl glycol (MNG) amphiphiles for solubilization, stabilization and crystallization of membrane proteins. Nat. Methods 2010, 7, 1003–1008. [Google Scholar] [CrossRef] [Green Version]
- Mizrachi, D.; Chen, Y.; Liu, J.; Peng, H.-M.; Ke, A.; Pollack, L.; Turner, R.J.; Auchus, R.J.; Delisa, M.P. Making water-soluble integral membrane proteins in vivo using an amphipathic protein fusion strategy. Nat. Commun. 2015, 6, 6826. [Google Scholar] [CrossRef] [Green Version]
- Klöpfer, K.; Hagn, F. Beyond detergent micelles: The advantages and applications of non-micellar and lipid-based membrane mimetics for solution-state NMR. Prog. Nucl. Magn. Reson. Spectrosc. 2019, 114–115, 271–283. [Google Scholar] [CrossRef] [Green Version]
- Warschawski, D.E.; Arnold, A.; Beaugrand, M.; Gravel, A.; Chartrand, É.; Marcotte, I. Choosing membrane mimetics for NMR structural studies of transmembrane proteins. Biochim. Biophys. Acta (BBA)-Biomembr. 2011, 1808, 1957–1974. [Google Scholar] [CrossRef] [PubMed] [Green Version]
- Girard, P.; Pécréaux, J.; Lenoir, G.; Falson, P.; Rigaud, J.-L.; Bassereau, P. A New Method for the Reconstitution of Membrane Proteins into Giant Unilamellar Vesicles. Biophys. J. 2004, 87, 419–429. [Google Scholar] [CrossRef] [PubMed] [Green Version]
- Jesorka, A.; Orwar, O. Liposomes: Technologies and Analytical Applications. Annu. Rev. Anal. Chem. 2008, 1, 801–832. [Google Scholar] [CrossRef] [PubMed]
- Venetië, R.; Leunissen-Bijvelt, J.; Verkleij, A.J.; Ververgaert, P.H.J.T. Size determination of sonicated vesicles by freeze-fracture electron microscopy, using the spray-freezing method. J. Microsc. 1980, 118, 401–408. [Google Scholar] [CrossRef]
- Rideau, E.; Dimova, R.; Schwille, P.; Wurm, F.R.; Landfester, K. Liposomes and polymersomes: A comparative review towards cell mimicking. Chem. Soc. Rev. 2018, 47, 8572–8610. [Google Scholar] [CrossRef] [Green Version]
- Litschel, T.; Schwille, P. Protein Reconstitution Inside Giant Unilamellar Vesicles. Annu. Rev. Biophys. 2021, 50, 525–548. [Google Scholar] [CrossRef]
- Denisov, I.G.; Sligar, S.G. Nanodiscs in Membrane Biochemistry and Biophysics. Chem. Rev. 2017, 117, 4669–4713. [Google Scholar] [CrossRef]
- Ritchie, T.K.; Grinkova, Y.V.; Bayburt, T.H.; Denisov, I.G.; Zolnerciks, J.K.; Atkins, W.M.; Sligar, S.G. Methods in Enzymology; Düzgünes, N., Ed.; Academic Press: Cambridge, MA, USA, 2009; Volume 464, pp. 211–231. [Google Scholar]
- He, W.; Luo, J.; Bourguet, F.; Xing, L.; Yi, S.K.; Gao, T.; Blanchette, C.; Henderson, P.T.; Kuhn, E.; Malfatti, M.; et al. Controlling the diameter, monodispersity, and solubility of ApoA1 nanolipoprotein particles using telodendrimer chemistry. Protein Sci. 2013, 22, 1078–1086. [Google Scholar] [CrossRef] [Green Version]
- Bayburt, T.H.; Sligar, S.G. Self-assembly of single integral membrane proteins into soluble nanoscale phospholipid bilayers. Protein Sci. 2003, 12, 2476–2481. [Google Scholar] [CrossRef] [Green Version]
- Dominik, P.K.; Borowska, M.T.; Dalmas, O.; Kim, S.S.; Perozo, E.; Keenan, R.; Kossiakoff, A.A. Conformational Chaperones for Structural Studies of Membrane Proteins Using Antibody Phage Display with Nanodiscs. Structure 2016, 24, 300–309. [Google Scholar] [CrossRef] [Green Version]
- Goluch, E.D.; Shaw, A.W.; Sligar, S.G.; Liu, C. Microfluidic patterning of nanodisc lipid bilayers and multiplexed analysis of protein interaction. Lab Chip 2008, 8, 1723–1728. [Google Scholar] [CrossRef]
- Haruyama, T.; Sugano, Y.; Kodera, N.; Uchihashi, T.; Ando, T.; Tanaka, Y.; Konno, H.; Tsukazaki, T. Single-Unit Imaging of Membrane Protein-Embedded Nanodiscs from Two Oriented Sides by High-Speed Atomic Force Microscopy. Structure 2019, 27, 152–160.e3. [Google Scholar] [CrossRef] [Green Version]
- Fischer, N.O.; Rasley, A.; Corzett, M.; Hwang, M.H.; Hoeprich, P.D.; Blanchette, C.D. Colocalized Delivery of Adjuvant and Antigen Using Nanolipoprotein Particles Enhances the Immune Response to Recombinant Antigens. J. Am. Chem. Soc. 2013, 135, 2044–2047. [Google Scholar] [CrossRef] [PubMed]
- Blanchette, C.D.; Fischer, N.O.; Corzett, M.; Bench, G.; Hoeprich, P.D. Kinetic Analysis of His-Tagged Protein Binding to Nickel-Chelating Nanolipoprotein Particles. Bioconjugate Chem. 2010, 21, 1321–1330. [Google Scholar] [CrossRef] [PubMed]
- Fischer, N.; Infante, E.; Ishikawa, T.; Blanchette, C.D.; Bourne, N.; Hoeprich, P.D.; Mason, P.W. Conjugation to Nickel-Chelating Nanolipoprotein Particles Increases the Potency and Efficacy of Subunit Vaccines to Prevent West Nile Encephalitis. Bioconjugate Chem. 2010, 21, 1018–1022. [Google Scholar] [CrossRef] [PubMed] [Green Version]
- Fischer, N.O.; Blanchette, C.D.; Chromy, B.A.; Kuhn, E.A.; Segelke, B.W.; Corzett, M.; Bench, G.; Mason, P.W.; Hoeprich, P.D. Immobilization of His-Tagged Proteins on Nickel-Chelating Nanolipoprotein Particles. Bioconjugate Chem. 2009, 20, 460–465. [Google Scholar] [CrossRef]
- Horsey, A.J.; Briggs, D.A.; Holliday, N.D.; Briddon, S.J.; Kerr, I.D. Application of fluorescence correlation spectroscopy to study substrate binding in styrene maleic acid lipid copolymer encapsulated ABCG2. Biochim. Biophys. Acta (BBA)-Biomembr. 2020, 1862, 183218. [Google Scholar] [CrossRef]
- Knowles, T.J.; Finka, R.; Smith, C.; Lin, Y.-P.; Dafforn, T.; Overduin, M. Membrane Proteins Solubilized Intact in Lipid Containing Nanoparticles Bounded by Styrene Maleic Acid Copolymer. J. Am. Chem. Soc. 2009, 131, 7484–7485. [Google Scholar] [CrossRef]
- Dörr, J.M.; Koorengevel, M.C.; Schäfer, M.; Prokofyev, A.V.; Scheidelaar, S.; van der Cruijsen, E.A.W.; Dafforn, T.R.; Baldus, M.; Killian, J.A. Detergent-free isolation, characterization, and functional reconstitution of a tetrameric K + channel: The power of native nanodiscs. Proc. Natl. Acad. Sci. USA 2014, 111, 18607–18612. [Google Scholar] [CrossRef] [Green Version]
- Pollock, N.L.; Lee, S.C.; Patel, J.; Gulamhussein, A.A.; Rothnie, A.J. Structure and function of membrane proteins encapsulated in a polymer-bound lipid bilayer. Biochim. Biophys. Acta (BBA)-Biomembr. 2018, 1860, 809–817. [Google Scholar] [CrossRef]
- Long, A.R.; O’Brien, C.C.; Malhotra, K.; Schwall, C.T.; Albert, A.D.; Watts, A.; Alder, N.N. A detergent-free strategy for the reconstitution of active enzyme complexes from native biological membranes into nanoscale discs. BMC Biotechnol. 2013, 13, 41. [Google Scholar] [CrossRef] [PubMed] [Green Version]
- Brown, C.J.; Trieber, C.; Overduin, M. Structural biology of endogenous membrane protein assemblies in native nanodiscs. Curr. Opin. Struct. Biol. 2021, 69, 70–77. [Google Scholar] [CrossRef]
- Logez, C.; Damian, M.; Legros, C.; Dupré, C.; Guéry, M.; Mary, S.; Wagner, R.; M’Kadmi, C.; Nosjean, O.; Fould, B.; et al. Detergent-free Isolation of Functional G Protein-Coupled Receptors into Nanometric Lipid Particles. Biochemistry 2016, 55, 38–48. [Google Scholar] [CrossRef]
- Günsel, U.; Hagn, F. Lipid Nanodiscs for High-Resolution NMR Studies of Membrane Proteins. Chem. Rev. accepted. 2021. [Google Scholar] [CrossRef] [PubMed]
- Bayburt, T.H.; Grinkova, Y.V.; Sligar, S.G. Self-Assembly of Discoidal Phospholipid Bilayer Nanoparticles with Membrane Scaffold Proteins. Nano Lett. 2002, 2, 853–856. [Google Scholar] [CrossRef]
- Bayburt, T.H.; Sligar, S.G. Membrane protein assembly into Nanodiscs. FEBS Lett. 2010, 584, 1721–1727. [Google Scholar] [CrossRef] [PubMed] [Green Version]
- Nasr, M.L.; Baptista, D.; Strauss, M.; Sun, Z.-Y.J.; Grigoriu, S.; Huser, S.; Plückthun, A.; Hagn, F.; Walz, S.H.T.; Hogle, J.M.; et al. Covalently circularized nanodiscs for studying membrane proteins and viral entry. Nat. Methods 2017, 14, 49–52. [Google Scholar] [CrossRef] [PubMed]
- Nasr, M.L.; Wagner, G. Covalently circularized nanodiscs; challenges and applications. Curr. Opin. Struct. Biol. 2018, 51, 129–134. [Google Scholar] [CrossRef]
- Cappuccio, J.A.; Hinz, A.K.; Kuhn, E.A.; Fletcher, J.E.; Arroyo, E.S.; Henderson, P.T.; Blanchette, C.D.; Walsworth, V.L.; Corzett, M.H.; Law, R.J.; et al. Cell-Free Expression for Nanolipoprotein Particles: Building a High-Throughput Membrane Protein Solubility Platform. Methods Mol. Biol. 2009, 498, 273–295. [Google Scholar] [CrossRef]
- Cappuccio, J.A.; Blanchette, C.D.; Sulchek, T.A.; Arroyo, E.S.; Kralj, J.M.; Hinz, A.K.; Kuhn, E.A.; Chromy, B.A.; Segelke, B.W.; Rothschild, K.; et al. Cell-free Co-expression of Functional Membrane Proteins and Apolipoprotein, Forming Soluble Nanolipoprotein Particles. Mol. Cell. Proteom. 2008, 7, 2246–2253. [Google Scholar] [CrossRef] [Green Version]
- Roos, C.; Kai, L.; Proverbio, D.; Ghoshdastider, U.; Filipek, S.; Dötsch, V.; Bernhard, F. Co-translational association of cell-free expressed membrane proteins with supplied lipid bilayers. Mol. Membr. Biol. 2013, 30, 75–89. [Google Scholar] [CrossRef] [PubMed]
- Coleman, M.A.; Cappuccio, J.A.; Blanchette, C.D.; Gao, T.; Arroyo, E.S.; Hinz, A.K.; Bourguet, F.A.; Segelke, B.; Hoeprich, P.D.; Huser, T.; et al. Expression and Association of the Yersinia pestis Translocon Proteins, YopB and YopD, Are Facilitated by Nanolipoprotein Particles. PLoS ONE 2016, 11, e0150166. [Google Scholar] [CrossRef] [PubMed]
- Gao, T.; Petrlova, J.; He, W.; Huser, T.; Kudlick, W.; Voss, J.; Coleman, M.A. Characterization of De Novo Synthesized GPCRs Supported in Nanolipoprotein Discs. PLoS ONE 2012, 7, e44911. [Google Scholar] [CrossRef] [PubMed] [Green Version]
- Dathe, A.; Sielaff, H.; Heitkamp, T.; Börsch, M.; Pérez, I.; Westphal, A.; Reuter, S.; Mrowka, R. Observing monomer: Dimer transitions of neurotensin receptors 1 in single SMALPs by homoFRET and in an ABELtrap. In Single Molecule Spectroscopy and Superresolution Imaging XII; SPIE: Bellingham, WA, USA, 2019; Volume 10884, pp. 47–57. [Google Scholar] [CrossRef] [Green Version]
- Gao, T.; Blanchette, C.D.; He, W.; Bourguet, F.; Ly, S.; Katzen, F.; Kudlicki, W.A.; Henderson, P.T.; Laurence, T.A.; Huser, T.; et al. Characterizing diffusion dynamics of a membrane protein associated with nanolipoproteins using fluorescence correlation spectroscopy. Protein Sci. 2011, 20, 437–447. [Google Scholar] [CrossRef] [PubMed] [Green Version]
- Quinn, S.D.; Srinivasan, S.; Gordon, J.; He, W.; Carraway, K.L.; Coleman, M.A.; Schlau-Cohen, G.S. Single-Molecule Fluorescence Detection of the Epidermal Growth Factor Receptor in Membrane Discs. Biochemistry 2019, 58, 286–294. [Google Scholar] [CrossRef]
- Unger, L.; Ronco-Campaña, A.; Kitchen, P.; Bill, R.M.; Rothnie, A.J. Biological insights from SMA-extracted proteins. Biochem. Soc. Trans. 2021, 49, 1349–1359. [Google Scholar] [CrossRef]
- Simon, K.S.; Pollock, N.L.; Lee, S.C. Membrane protein nanoparticles: The shape of things to come. Biochem. Soc. Trans. 2018, 46, 1495–1504. [Google Scholar] [CrossRef]
- Oluwole, A.O.; Danielczak, B.; Meister, P.-D.D.A.; Babalola, J.O.; Vargas, C.; Keller, S. Solubilization of Membrane Proteins into Functional Lipid-Bilayer Nanodiscs Using a Diisobutylene/Maleic Acid Copolymer. Angew. Chem. Int. Ed. 2017, 56, 1919–1924. [Google Scholar] [CrossRef] [Green Version]
- Gulamhussein, A.A.; Uddin, R.; Tighe, B.J.; Poyner, D.R.; Rothnie, A.J. A comparison of SMA (styrene maleic acid) and DIBMA (di-isobutylene maleic acid) for membrane protein purification. Biochim. Biophys. Acta (BBA)-Biomembr. 2020, 1862, 183281. [Google Scholar] [CrossRef]
- Lee, S.C.; Knowles, T.; Postis, V.; Jamshad, M.; Parslow, R.A.; Lin, Y.-P.; Goldman, A.; Sridhar, T.J.K.P.; Overduin, M.; Muench, S.P.; et al. A method for detergent-free isolation of membrane proteins in their local lipid environment. Nat. Protoc. 2016, 11, 1149–1162. [Google Scholar] [CrossRef] [Green Version]
- Esmaili, M.; Overduin, M. Membrane biology visualized in nanometer-sized discs formed by styrene maleic acid polymers. Biochim. Biophys. Acta (BBA)-Biomembr. 2018, 1860, 257–263. [Google Scholar] [CrossRef] [PubMed]
- Juarez, J.F.B.; Harper, A.J.; Judge, P.J.; Tonge, S.R.; Watts, A. From polymer chemistry to structural biology: The development of SMA and related amphipathic polymers for membrane protein extraction and solubilisation. Chem. Phys. Lipids 2019, 221, 167–175. [Google Scholar] [CrossRef] [PubMed]
- Jamshad, M.; Charlton, J.; Lin, Y.-P.; Routledge, S.; Bawa, Z.; Knowles, T.; Overduin, M.; Dekker, N.; Dafforn, T.; Bill, R.; et al. G-protein coupled receptor solubilization and purification for biophysical analysis and functional studies, in the total absence of detergent. Biosci. Rep. 2015, 35, e00188. [Google Scholar] [CrossRef] [PubMed]
- Ravula, T.; Hardin, N.Z.; Ramamoorthy, A. Polymer nanodiscs: Advantages and limitations. Chem. Phys. Lipids 2019, 219, 45–49. [Google Scholar] [CrossRef]
- Flores, S.M.; Toca-Herrera, J.L. The new future of scanning probe microscopy: Combining atomic force microscopy with other surface-sensitive techniques, optical microscopy and fluorescence techniques. Nanoscale 2009, 1, 40–49. [Google Scholar] [CrossRef]
- Magde, D.; Elson, E.; Webb, W.W. Thermodynamic Fluctuations in a Reacting System—Measurement by Fluorescence Correlation Spectroscopy. Phys. Rev. Lett. 1972, 29, 705–708. [Google Scholar] [CrossRef]
- Eigen, M.; Rigler, R. Sorting single molecules: Application to diagnostics and evolutionary biotechnology. Proc. Natl. Acad. Sci. USA 1994, 91, 5740–5747. [Google Scholar] [CrossRef] [Green Version]
- Schwille, P.; Haustein, E. Fluorescence Correlation Spectroscopy: An Introduction to its Concepts and Applications; Biophysical Society: Rockville, MD, USA, 2002. [Google Scholar]
- Chenette, E.J. FCS and FRAP: Illuminating cellular processes. Nat. Cell Biol. 2009, 11, S13–S14. [Google Scholar] [CrossRef]
- Koppel, D.; Axelrod, D.; Schlessinger, J.; Elson, E.; Webb, W. Dynamics of fluorescence marker concentration as a probe of mobility. Biophys. J. 1976, 16, 1315–1329. [Google Scholar] [CrossRef] [Green Version]
- Roy, R.; Hohng, S.; Ha, T. A practical guide to single-molecule FRET. Nat. Methods 2008, 5, 507–516. [Google Scholar] [CrossRef]
- Sasmal, D.K.; Pulido, L.E.; Kasal, S.; Huang, J. Single-molecule fluorescence resonance energy transfer in molecular biology. Nanoscale 2016, 8, 19928–19944. [Google Scholar] [CrossRef] [Green Version]
- Mazal, H.; Haran, G. Single-molecule FRET methods to study the dynamics of proteins at work. Curr. Opin. Biomed. Eng. 2019, 12, 8–17. [Google Scholar] [CrossRef] [PubMed]
- Krainer, G.; Keller, S.; Schlierf, M. Structural dynamics of membrane-protein folding from single-molecule FRET. Curr. Opin. Struct. Biol. 2019, 58, 124–137. [Google Scholar] [CrossRef] [PubMed]
- Briddon, S.; Kilpatrick, L.E.; Hill, S.J. Studying GPCR Pharmacology in Membrane Microdomains: Fluorescence Correlation Spectroscopy Comes of Age. Trends Pharmacol. Sci. 2018, 39, 158–174. [Google Scholar] [CrossRef] [PubMed]
- Briddon, S.; Hill, S. Pharmacology under the microscope: The use of fluorescence correlation spectroscopy to determine the properties of ligand–receptor complexes. Trends Pharmacol. Sci. 2007, 28, 637–645. [Google Scholar] [CrossRef] [PubMed] [Green Version]
- Bacia, K.; Kim, S.A.; Schwille, P. Fluorescence cross-correlation spectroscopy in living cells. Nat. Methods 2006, 3, 83–89. [Google Scholar] [CrossRef]
- Kim, S.A.; Heinze, K.G.; Schwille, P. Fluorescence correlation spectroscopy in living cells. Nat. Methods 2007, 4, 963–973. [Google Scholar] [CrossRef]
- Meseth, U.; Wohland, T.; Rigler, R.; Vogel, H. Resolution of Fluorescence Correlation Measurements. Biophys. J. 1999, 76, 1619–1631. [Google Scholar] [CrossRef] [Green Version]
- Widengren, J.; Mets, U.; Rigler, R. Fluorescence correlation spectroscopy of triplet states in solution: A theoretical and experimental study. J. Phys. Chem. 1995, 99, 13368–13379. [Google Scholar] [CrossRef]
- Schwille, P.; Meyer-Almes, F.; Rigler, R. Dual-color fluorescence cross-correlation spectroscopy for multicomponent diffusional analysis in solution. Biophys. J. 1997, 72, 1878–1886. [Google Scholar] [CrossRef] [Green Version]
- Kapanidis, A.N.; Laurence, T.A.; Lee, N.K.; Margeat, E.; Kong, A.X.; Weiss, S. Alternating-Laser Excitation of Single Molecules. Accounts Chem. Res. 2005, 38, 523–533. [Google Scholar] [CrossRef] [PubMed]
- Müller, B.K.; Zaychikov, E.; Bräuchle, C.; Lamb, D.C. Pulsed Interleaved Excitation. Biophys. J. 2005, 89, 3508–3522. [Google Scholar] [CrossRef] [PubMed] [Green Version]
- Miller, A.E.; Hollars, C.W.; Lane, S.M.; Laurence, T.A. Fluorescence Cross-Correlation Spectroscopy as a Universal Method for Protein Detection with Low False Positives. Anal. Chem. 2009, 81, 5614–5622. [Google Scholar] [CrossRef] [PubMed]
- Ruan, Q.; Cheng, M.A.; Levi, M.; Gratton, E.; Mantulin, W.W. Spatial-Temporal Studies of Membrane Dynamics: Scanning Fluorescence Correlation Spectroscopy (SFCS). Biophys. J. 2004, 87, 1260–1267. [Google Scholar] [CrossRef] [PubMed] [Green Version]
- Krieger, J.W.; Singh, A.P.; Bag, N.; Garbe, C.S.; Saunders, T.; Langowski, J.; Wohland, T. Imaging fluorescence (cross-) correlation spectroscopy in live cells and organisms. Nat. Protoc. 2015, 10, 1948–1974. [Google Scholar] [CrossRef]
- Brown, C.M.; Dalal, R.B.; Hebert, B.; Digman, M.A.; Horwitz, A.R.; Gratton, E. Raster image correlation spectroscopy (RICS) for measuring fast protein dynamics and concentrations with a commercial laser scanning confocal microscope. J. Microsc. 2008, 229, 78–91. [Google Scholar] [CrossRef] [Green Version]
- Ries, J.; Schwille, P. Fluorescence correlation spectroscopy. BioEssays 2012, 34, 361–368. [Google Scholar] [CrossRef]
- Enderlein, J.; Gregor, I.; Patra, D.; Dertinger, T.; Kaupp, U.B. Performance of Fluorescence Correlation Spectroscopy for Measuring Diffusion and Concentration. ChemPhysChem 2005, 6, 2324–2336. [Google Scholar] [CrossRef]
- Kahya, N.; Schwille, P. Fluorescence correlation studies of lipid domains in model membranes (Review). Mol. Membr. Biol. 2006, 23, 29–39. [Google Scholar] [CrossRef]
- Chiantia, S.; Ries, J.; Schwille, P. Fluorescence correlation spectroscopy in membrane structure elucidation. Biochim. Biophys. Acta (BBA)-Biomembr. 2009, 1788, 225–233. [Google Scholar] [CrossRef] [Green Version]
- Hernández-Rocamora, V.M.; Reija, B.; García, C.; Natale, P.; Alfonso, C.; Minton, A.P.; Zorrilla, S.; Rivas, G.; Vicente, M. Dynamic Interaction of the Escherichia coli Cell Division ZipA and FtsZ Proteins Evidenced in Nanodiscs. J. Biol. Chem. 2012, 287, 30097–30104. [Google Scholar] [CrossRef] [PubMed] [Green Version]
- Wu, Z.C.; de Keyzer, J.; Kedrov, A.; Driessen, A.J. Competitive Binding of the SecA ATPase and Ribosomes to the SecYEG Translocon. J. Biol. Chem. 2012, 287, 7885–7895. [Google Scholar] [CrossRef] [PubMed] [Green Version]
- Kedrov, A.; Sustarsic, M.; de Keyzer, J.; Caumanns, J.J.; Wu, Z.C.; Driessen, A.J. Elucidating the Native Architecture of the YidC: Ribosome Complex. J. Mol. Biol. 2013, 425, 4112–4124. [Google Scholar] [CrossRef] [Green Version]
- Geng, Y.; Kedrov, A.; Caumanns, J.J.; Crevenna, A.; Lamb, D.; Beckmann, R.; Driessen, A.J.M. Role of the Cytosolic Loop C2 and the C Terminus of YidC in Ribosome Binding and Insertion Activity. J. Biol. Chem. 2015, 290, 17250–17261. [Google Scholar] [CrossRef] [Green Version]
- Ly, S.; Bourguet, F.; Fischer, N.O.; Lau, E.Y.; Coleman, M.A.; Laurence, T.A. Quantifying Interactions of a Membrane Protein Embedded in a Lipid Nanodisc using Fluorescence Correlation Spectroscopy. Biophys. J. 2014, 106, L05–L08. [Google Scholar] [CrossRef] [PubMed] [Green Version]
- Li, M.J.; Nath, A.; Atkins, W. Differential Coupling of Binding, ATP Hydrolysis, and Transport of Fluorescent Probes with P-Glycoprotein in Lipid Nanodiscs. Biochemistry 2017, 56, 2506–2517. [Google Scholar] [CrossRef] [Green Version]
- Grime, R.L.; Goulding, J.; Uddin, R.; Stoddart, L.A.; Hill, S.J.; Poyner, D.R.; Briddon, S.J.; Wheatley, M. Single molecule binding of a ligand to a G-protein-coupled receptor in real time using fluorescence correlation spectroscopy, rendered possible by nano-encapsulation in styrene maleic acid lipid particles. Nanoscale 2020, 12, 11518–11525. [Google Scholar] [CrossRef] [PubMed]
- Voskoboynikova, N.; Karlova, M.; Kurre, R.; Mulkidjanian, A.; Shaitan, K.; Sokolova, O.; Steinhoff, H.-J.; Heinisch, J. A Three-Dimensional Model of the Yeast Transmembrane Sensor Wsc1 Obtained by SMA-Based Detergent-Free Purification and Transmission Electron Microscopy. J. Fungi 2021, 7, 118. [Google Scholar] [CrossRef]
- Xu, L.; Öjemyr, L.N.; Bergstrand, J.; Brzezinski, P.; Widengren, J. Protonation Dynamics on Lipid Nanodiscs: Influence of the Membrane Surface Area and External Buffers. Biophys. J. 2016, 110, 1993–2003. [Google Scholar] [CrossRef] [Green Version]
- Harayama, T.; Riezman, H. Understanding the diversity of membrane lipid composition. Nat. Rev. Mol. Cell Biol. 2018, 19, 281–296. [Google Scholar] [CrossRef]
- Stillwell, W. An Introduction to Biological Membranes: Composition, Structure and Function; Elsevier: Amsterdam, The Netherlands, 2016. [Google Scholar]
- Dawaliby, R.; Trubbia, C.; Delporte, C.; Masureel, M.; Van Antwerpen, P.; Kobilka, B.B.K.; Govaerts, C. Allosteric regulation of G protein–coupled receptor activity by phospholipids. Nat. Chem. Biol. 2016, 12, 35–39. [Google Scholar] [CrossRef]
- Inagaki, S.; Ghirlando, R.; White, J.F.; Gvozdenovic-Jeremic, J.; Northup, J.K.; Grisshammer, R. Modulation of the Interaction between Neurotensin Receptor NTS1 and Gq Protein by Lipid. J. Mol. Biol. 2012, 417, 95–111. [Google Scholar] [CrossRef] [PubMed] [Green Version]
- Zocher, M.; Zhang, C.; Rasmussen, S.G.F.; Kobilka, B.K.; Müller, D.J. Cholesterol increases kinetic, energetic, and mechanical stability of the human β 2 -adrenergic receptor. Proc. Natl. Acad. Sci. USA 2012, 109, E3463–E3472. [Google Scholar] [CrossRef] [PubMed] [Green Version]
- Gutierrez, M.G.; Mansfield, K.S.; Malmstadt, N. The Functional Activity of the Human Serotonin 5-HT 1A Receptor Is Controlled by Lipid Bilayer Composition. Biophys. J. 2016, 110, 2486–2495. [Google Scholar] [CrossRef] [PubMed] [Green Version]
- Yoshida, K.; Nagatoishi, S.; Kuroda, D.; Suzuki, N.; Murata, T.; Tsumoto, K. Phospholipid Membrane Fluidity Alters Ligand Binding Activity of a G Protein-Coupled Receptor by Shifting the Conformational Equilibrium. Biochemistry 2019, 58, 504–508. [Google Scholar] [CrossRef] [PubMed]
- Rosholm, K.R.; Leijnse, N.; Mantsiou, A.; Tkach, V.; Pedersen, S.L.; Wirth, V.F.; Oddershede, L.B.; Jensen, K.; Martinez, K.; Hatzakis, N.S.; et al. Membrane curvature regulates ligand-specific membrane sorting of GPCRs in living cells. Nat. Chem. Biol. 2017, 13, 724–729. [Google Scholar] [CrossRef]
- Wootten, D.; Christopoulos, A.; Marti-Solano, M.; Babu, M.M.; Sexton, P.M. Mechanisms of signalling and biased agonism in G protein-coupled receptors. Nat. Rev. Mol. Cell Biol. 2018, 19, 638–653. [Google Scholar] [CrossRef]
- Marrink, S.J.; Corradi, V.; Souza, P.C.; Ingólfsson, H.I.; Tieleman, D.P.; Sansom, M.S. Computational Modeling of Realistic Cell Membranes. Chem. Rev. 2019, 119, 6184–6226. [Google Scholar] [CrossRef] [Green Version]
- Shahane, G.; Ding, W.; Palaiokostas, M.; Orsi, M. Physical properties of model biological lipid bilayers: Insights from all-atom molecular dynamics simulations. J. Mol. Model. 2019, 25, 76. [Google Scholar] [CrossRef] [Green Version]
- Ingólfsson, H.I.; Bhatia, H.; Zeppelin, T.; Bennett, W.F.D.; Carpenter, K.A.; Hsu, P.-C.; Dharuman, G.; Bremer, P.-T.; Schiøtt, B.; Lightstone, F.C.; et al. Capturing biologically complex tissue-specific membranes at different levels of compositional complexity. J. Phys. Chem. B 2020, 124, 7819–7829. [Google Scholar] [CrossRef]
- Ingólfsson, H.I.; Carpenter, T.S.; Bhatia, H.; Bremer, P.-T.; Marrink, S.J.; Lightstone, F.C. Computational Lipidomics of the Neuronal Plasma Membrane. Biophys. J. 2017, 113, 2271–2280. [Google Scholar] [CrossRef] [PubMed] [Green Version]
- Ingólfsson, H.I.; Melo, M.N.; van Eerden, F.J.; Arnarez, C.; Lopez, C.A.; Wassenaar, T.A.; Periole, X.; de Vries, A.H.; Tieleman, D.P.; Marrink, S.J. Lipid Organization of the Plasma Membrane. J. Am. Chem. Soc. 2014, 136, 14554–14559. [Google Scholar] [CrossRef] [PubMed]
- Laurence, T.A.; Ly, S.; Bourguet, F.; Fischer, N.O.; Coleman, M.A. Fluorescence Correlation Spectroscopy at Micromolar Concentrations without Optical Nanoconfinement. J. Phys. Chem. B 2014, 118, 9662–9667. [Google Scholar] [CrossRef] [PubMed]
- Schneider, F.; Hernandez-Varas, P.; Lagerholm, B.C.; Shrestha, D.; Sezgin, E.; Roberti, M.J.; Ossato, G.; Hecht, F.; Eggeling, C.; Urbančič, I. High photon count rates improve the quality of super-resolution fluorescence fluctuation spectroscopy. J. Phys. D: Appl. Phys. 2020, 53, 164003. [Google Scholar] [CrossRef] [PubMed]


| Membrane Protein | Species | Expression and Assembly System | Nanodisc Type | Fluorescent Label | Diffusion Characteristic (FCS) | Reference |
|---|---|---|---|---|---|---|
| Bacteriorhodopsin (bR) | H. salinarum | Cell-free co-translation | DMPC + ApoΔ49A1 | BODIPY-lysine during translation | τD = 0.35 ms | Gao et al., 2011 [47] |
| ZipA | E. coli | Proteins from E. coli, then mixed with lipids | E. coli lipid extract + MSP1D1 | Lissamine rhodamine B on lipids | D = 32 ± 4 µm2/s | Hernandez-Rocamora et al., 2012 [85] |
| SecYEG | E. coli | Proteins from E. coli, then mixed with lipids | DOPC, DOPE, DOPG, CL + MSP1D1 | Alexa Fluor 488 on protein | D = 27 ± 3 µm2/s | Wu et al., 2012 [86] |
| YidC | E. coli | Proteins from E. coli, then mixed with lipids | DOPC, DOPE, DOPG, CL + MSP1D1 | Alexa Fluor 488 or Atto 647N on protein | D = 31 ± 2 µm2/s | Kedrov et al., 2013 [87] |
| YidC | E. coli | Proteins from E. coli, then mixed with lipids | DOPC, DOPE, DOPG + MSP1D1 | Alexa Fluor 488 on protein | D = 39 ± 2 µm2/s | Geng et al., 2015 [88] |
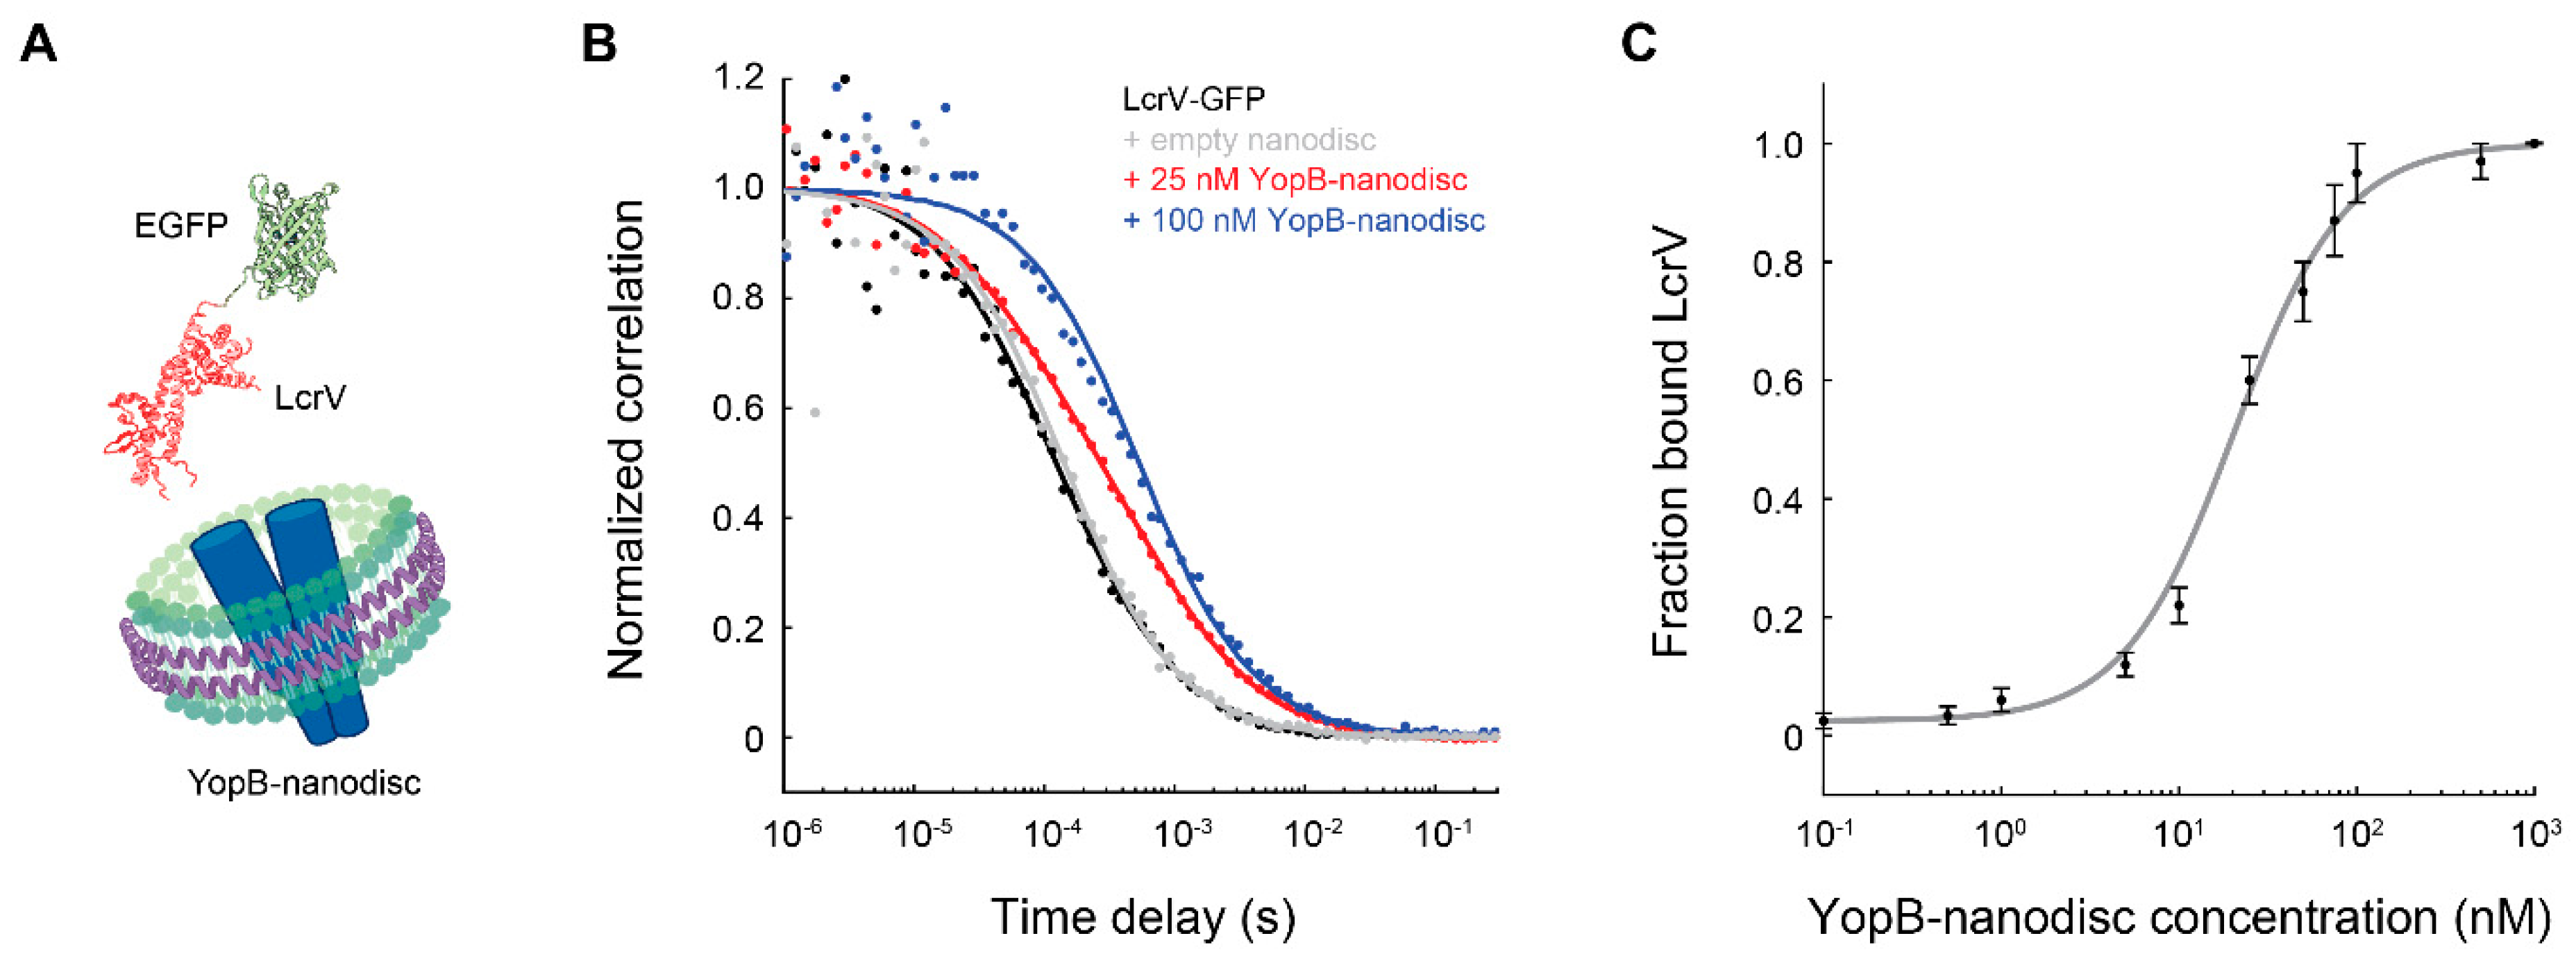
| YopB | Y. pestis | Cell-free co-translation | DMPC + ApoΔ49A1 | Binding to LcrV-GFP | τD = 0.63 ± 0.06 ms | Ly et al., 2014 [89] |
| Epidermal growth factor receptor (EGFR) | H. sapiens | Cell-free co-translation | DMPC + ApoΔ49A1 | SNAP fusion construct labeled with SNAP surface 594 | τD = 0.167 ± 0.002 ms | Quinn et al., 2019 [48] |
| ABCB1/P-glycoprotein | M. musculus | Membrane protein from P. pastoris, MSP from E. coli, then mixed with lipids | DMPC + MSP1D1 | Binding to small BODIPY-linked ligands | τD = 3.0 ± 0.2 ms | Li et al., 2017 [90] |
| ABCG2/BCRP (breast cancer resistance protein) | H. sapiens | HEK293T expression, then native membrane extraction by SMA | SMALP | GFP fusion construct | D = 31 ± 4 µm2/s (likely dimer) | Horsey et al., 2020 [29] |
| Neurokinin-1 receptor (NK1R) | H. sapiens | Cell-free co-translation | DMPC + ApoΔ49A1 | GFP fusion construct | τD = 0.51 ± 0.37 ms | Gao et al., 2012 [45] |
| Adenosine A2A receptor (A2AR) | H. sapiens | P. pastoris expression, then native membrane extraction by SMA | SMALP | Binding to small red BODIPY-linked ligand | τD = 0.63 ± 0.02 ms D = 30 ± 4 µm2/s | Grime et al., 2020 [91] |
| Neurotensin receptor 1 (NTSR1) | H. sapiens | HEK293T expression, then native membrane extraction by SMA | SMALP | mRuby fusion construct | τD = 5.88 ms D = 16 µm2/s (broad size distribution and large residuals noted) | Dathe et al., 2019 [46] |
| Wsc1 | S. cerevisiae | S. cerevisiae expression, then native membrane extraction by SMA | SMALP | GFP fusion construct | D = 50 ± 4.6 µm2/s | Voskoboynikova et al., 2021 [92] |
| Cytochrome c oxidase (CytcO) | R. sphaeroides | Membrane protein from R. sphaeroides, MSP from E. coli, then mixed with lipids | DOPG + MSP1D1 or MSP1E3D1 | Fluorescein on lipids or protein | Xu et al., 2016 [93] |
Publisher’s Note: MDPI stays neutral with regard to jurisdictional claims in published maps and institutional affiliations. |
© 2022 by the authors. Licensee MDPI, Basel, Switzerland. This article is an open access article distributed under the terms and conditions of the Creative Commons Attribution (CC BY) license (https://creativecommons.org/licenses/by/4.0/).
Share and Cite
Laurence, M.J.; Carpenter, T.S.; Laurence, T.A.; Coleman, M.A.; Shelby, M.; Liu, C. Biophysical Characterization of Membrane Proteins Embedded in Nanodiscs Using Fluorescence Correlation Spectroscopy. Membranes 2022, 12, 392. https://doi.org/10.3390/membranes12040392
Laurence MJ, Carpenter TS, Laurence TA, Coleman MA, Shelby M, Liu C. Biophysical Characterization of Membrane Proteins Embedded in Nanodiscs Using Fluorescence Correlation Spectroscopy. Membranes. 2022; 12(4):392. https://doi.org/10.3390/membranes12040392
Chicago/Turabian StyleLaurence, Matthew J., Timothy S. Carpenter, Ted A. Laurence, Matthew A. Coleman, Megan Shelby, and Chao Liu. 2022. "Biophysical Characterization of Membrane Proteins Embedded in Nanodiscs Using Fluorescence Correlation Spectroscopy" Membranes 12, no. 4: 392. https://doi.org/10.3390/membranes12040392