Article

Hydrogen Separation and Purification from Various Gas Mixtures by Means of Electrochemical Membrane Technology in the Temperature Range 100–160 °C

by
Leandri Vermaak
1,*,
Hein W. J. P. Neomagus
2 and
Dmitri G. Bessarabov
1,*
1
HySA Infrastructure Centre of Competence, Faculty of Engineering, Potchefstroom Campus, North-West University, Potchefstroom 2520, South Africa
2
Centre of Excellence in Carbon Based Fuels, Faculty of Engineering, School of Chemical and Minerals Engineering, Potchefstroom Campus, North-West University, Potchefstroom 2520, South Africa
*
Authors to whom correspondence should be addressed.
Membranes 2021, 11(4), 282; https://doi.org/10.3390/membranes11040282
Submission received: 16 March 2021 / Revised: 31 March 2021 / Accepted: 1 April 2021 / Published: 10 April 2021
(This article belongs to the Special Issue Electrically Conductive Membranes)

Abstract

:
This paper reports on an experimental evaluation of the hydrogen separation performance in a proton exchange membrane system with Pt-Co/C as the anode electrocatalyst. The recovery of hydrogen from H2/CO2, H2/CH4, and H2/NH3 gas mixtures were determined in the temperature range of 100–160 °C. The effects of both the impurity concentration and cell temperature on the separation performance of the cell and membrane were further examined. The electrochemical properties and performance of the cell were determined by means of polarization curves, limiting current density, open-circuit voltage, hydrogen permeability, hydrogen selectivity, hydrogen purity, and cell efficiencies (current, voltage, and power efficiencies) as performance parameters. High purity hydrogen (>99.9%) was obtained from a low purity feed (20% H2) after hydrogen was separated from H2/CH4 mixtures. Hydrogen purities of 98–99.5% and 96–99.5% were achieved for 10% and 50% CO2 in the feed, respectively. Moreover, the use of proton exchange membranes for electrochemical hydrogen separation was unsuccessful in separating hydrogen-rich streams containing NH3; the membrane underwent irreversible damage.

1. Introduction

Hydrogen shows great potential regarding future energy prospects, especially in the potential low-carbon energy system known as ‘the hydrogen economy’. Some of the benefits that promote hydrogen as an energy carrier include the following. Hydrogen is the most abundant element in the universe; it is the lightest element with the highest energy content among all the existing fuels [1,2]; it is a highly efficient and clean energy carrier [3], with only water as a by-product at conversion to energy [2,3]; and, furthermore, hydrogen lends itself to a variety of storage methods (e.g., gaseous, liquid [2,4]). Hydrogen could increase renewable energy usage, to a large extent, due to its ability to allow flexible storage of intermittent renewable energy [5]. For this reason, hydrogen is seen as a key solution to the global climate change [2], with the global ambition to maintain the increase in the average global temperature to <2 °C above pre-industrial levels, as stated by the Paris Agreement of 2015 [6].
Among other technologies that use hydrogen, specifically for mobility applications, proton exchange membrane (PEM) fuel cells (FCs) are attracting the most attention due to their favorable operational characteristics, such as quiet operation, near-zero emissions, high power densities, high conversion efficiencies, etc. [7]. However, for effective operation, high-purity hydrogen (>99.97%) is required [8].
Currently, large-scale hydrogen production is commonly carried out by means of steam methane reforming, coal gasification, or partial oxidation of hydrocarbons [9,10,11]. Although not widely implemented, there are several small-scale hydrogen production methods, including partial oxidation of biomass, electrolysis and auto-thermal processes, and small-scale steam methanol reformers [9,12]. However, both large- and small-scale hydrogen production methods produce hydrogen-rich streams commonly accompanied by impurities such CO2, CO, N2, and CH4, among others [13,14,15,16,17] (e.g., steam methane reforming (CO, CO2, CH4), dry shifted syngas (N2, CO, CO2, CH4, H2S), hot shifted syngas (N2, CO, H2S) [18,19]).
There are now several technological approaches being used to extract and purify hydrogen from gas mixtures, utilizing various characteristics of hydrogen under different industrial conditions. Common approaches for hydrogen recovery include adsorbing the impurities (pressure swing adsorption (PSA)), condensing the impurities (cryogenic distillation) or by using hydrogen-selective membranes [13,16,20,21]. See Table 1.
Although PSA and cryogenic distillation technologies are both commercial processes, multiple units are required and, in some instances, supplementary wash columns are required to remove CO and CO2 [13]. Pressure-driven membrane processes are considered to be better candidates for hydrogen production because they are not as energy intensive and they yield high-purity hydrogen [25]. However, even though membrane technologies are advantageous over the other purification methods mentioned, they commonly depend on high-pressure feed streams, and hydrogen embrittlement is often experienced [13].
As an alternative to pressure-driven membranes, electrochemical membrane technology based on PEMs has been utilized for hydrogen separation and it has been used to effectively recover hydrogen from H2/N2, H2/CO2/CO, and H2/CH4 hydrogen-rich gas mixtures [26]. Electrochemical hydrogen separation (EHS) offers several advantages over its competitors [27,28], including high-purity hydrogen from one-step operation [29], simultaneous hydrogen compression and separation is possible, as well as hydrogen separation is achieved at low cell voltages with a high separation efficiency [30]. An additional benefit of this electrochemical method is that CO2, if present in the feed, is concentrated, and it can be captured and stored without the requirement for any further treatment, thus, reducing greenhouse gas emissions [26,30].
Perfluorinated sulfonic acid (PFSA) membranes (mainly Nafion-based), typically operated at 60–80 °C, are mostly used as PEMs due to their high proton conductivity, mechanical integrity, and chemical stability [13]. However, one major challenge of Nafion membranes include the complex water management of the membrane [13]. Furthermore, swelling-induced stresses could result from water adsorption of the membrane [31]. Another major disadvantage is deactivation of the electrocatalyst (mainly based on Pt) when small amounts of CO (10–1000 ppm) are present [13,14], which results in a significant performance drop of the electrochemical cell [14].
High-temperature (HT)-PEMs (operating temperatures: 100–200 °C) doped with phosphoric acid (PA) have been developed to overcome the limitations associated with low-temperature (LT) PSFA membranes [32,33,34]. HT PA-doped PEMs conduct protons well, even in anhydrous conditions, which eliminates the requirement of pre-humidifying the feed stream [35]. Some other advantages include their fast electrode kinetics, enhanced mass transport, higher tolerance to impurities such as CO (up to 3 vol.%), and better sustainability [13,36,37,38]. Recent advances in other HT membranes, specifically for fuel cells, have been made [39,40,41]. These include, for example, phosphonated poly(pentafluorostyrene) for fuel cells and fuel cells based on quaternary ammonium-biphosphate ion pairs. A comparison of the properties of typical HT and LT PEMs can be found in Reference [32]. In terms of EHS, limited information is currently available on HT PEMs separation compared to LT separation (Nafion membranes) [42].
In the present work, hydrogen was separated from various concentrations of H2/CH4, H2/CO2 and H2/NH3 mixtures at higher temperatures of 120–160 °C. The gas mixtures were chosen based on their industrial relevance in processes related to syngas, the water–gas shift reaction, the power-to-gas (P2G) concept, and ammonia production. A HT-PEM (TPS®-based) was selected as the commercially available membrane choice due to the higher operating temperatures of these membranes compared to the PBI membranes of the same supplier (Advent technologies, Inc., Cambridge, MA, USA). To understand, and evaluate, the characteristics of the membrane, polarization curves and electrochemical impedance spectroscopy (EIS) were used. An in-line gas chromatograph (GC) was used to evaluate the separation performance of the membrane. This was done by measuring the composition of the permeate stream and comparing it with the composition of the feed stream, using the hydrogen selectivity parameter.

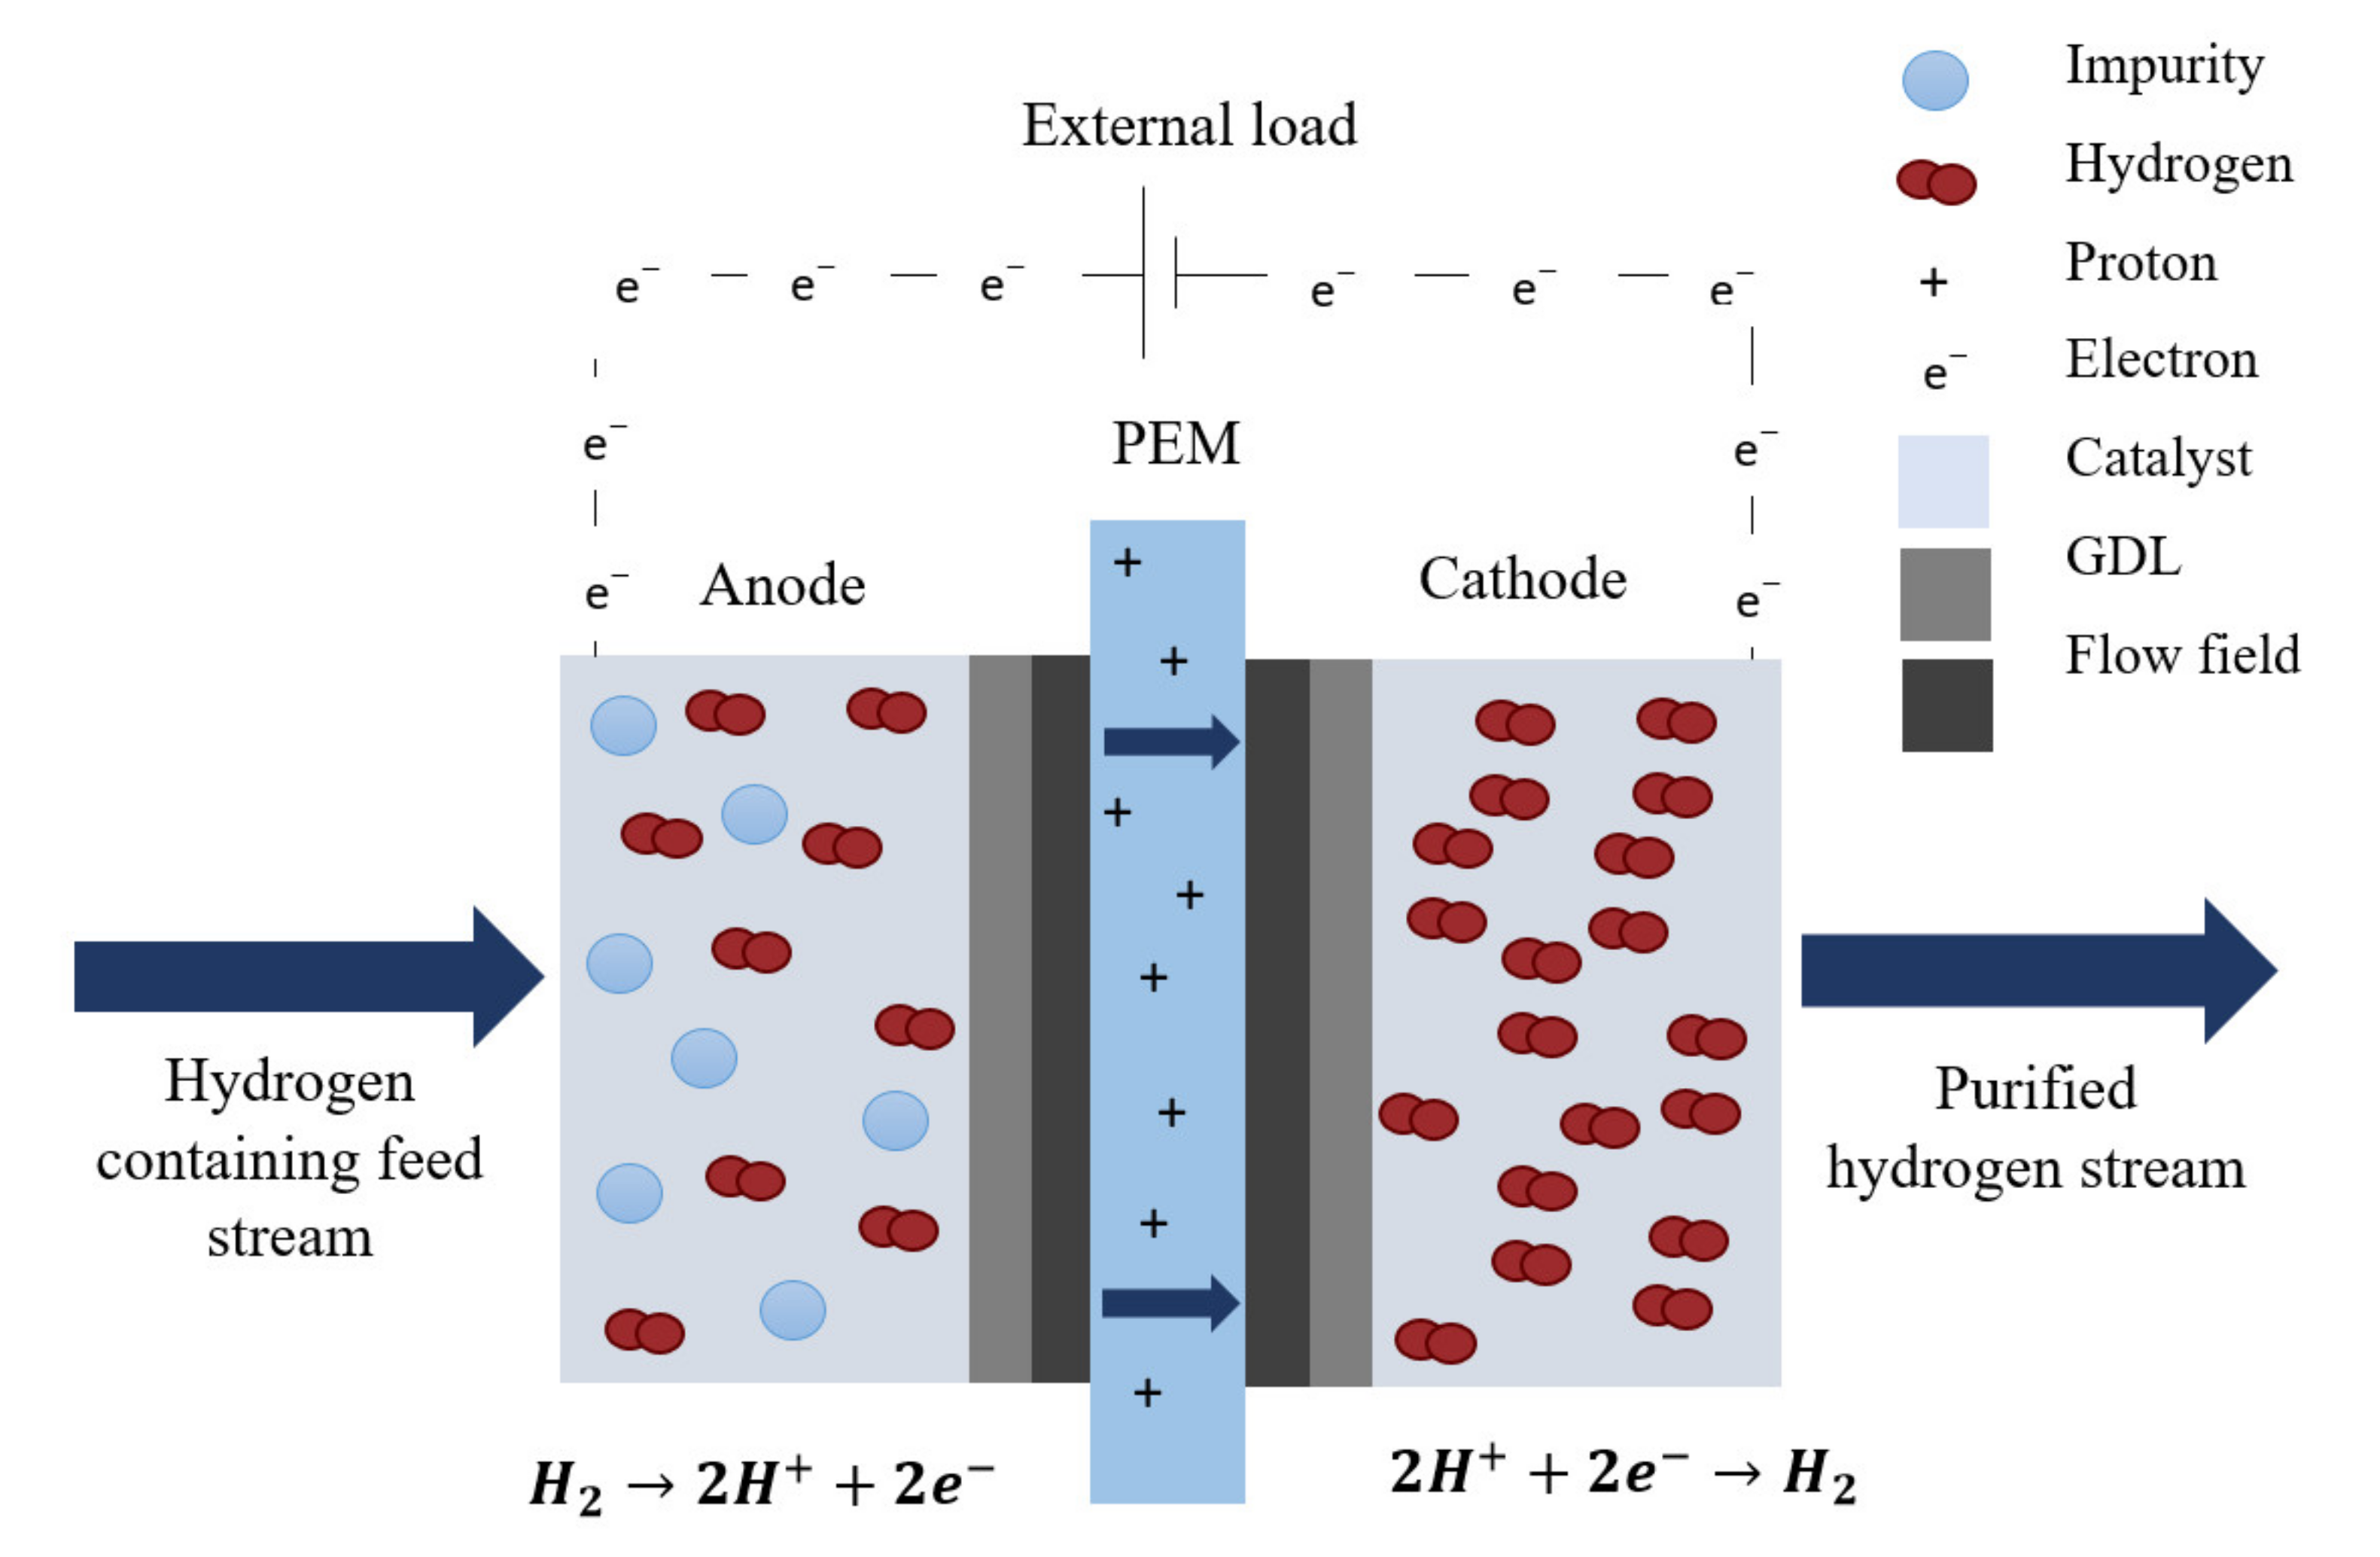
2. Working Principle

An electrochemical hydrogen separator (EHS), illustrated in Figure 1, is principally based on the following mechanism: a molecular gaseous hydrogen-containing gas stream is fed, at low pressure, at the anode side of the PEM electrochemical cell. When the hydrogen makes contact with the anode electrode, hydrogen is oxidized into protons and electrons, facilitated by a Pt-based catalyst. Hydrogen is then selectively transported, in the form of protons, through the PEM to the cathode compartment and the electrons then complete an electrical circuit. Finally, the protons and electrons are combined at the cathode compartment to form gaseous hydrogen. This reaction can be carried out at high pressure to improve the specific volumetric energy density of hydrogen, for storage purposes.
The hydrogen oxidation reaction does not occur spontaneously and an external load (DC power source) is required to drive the electrochemical reaction (electrolytic mode) [44]. However, minimal power is required to operate the cell, as the oxidation and reduction reactions of hydrogen are facile and nearly Nernstian/Faradic in their electrochemical behavior. Unlike conventional membrane purification systems that rely on pressure or concentration differentials to bring about separation, an EHS generates hydrogen at a rate dependent on the applied current, I (A). This is defined by Faraday’s law:
m ˙ = M I n F
where depicts the hydrogen flow rate, normally in g s−1 or g min−1, n is the number of electrons, F depicts the Faraday constant (96,485 C mol−1) and M is the molecular weight (g mol−1).

3. Materials and Methods

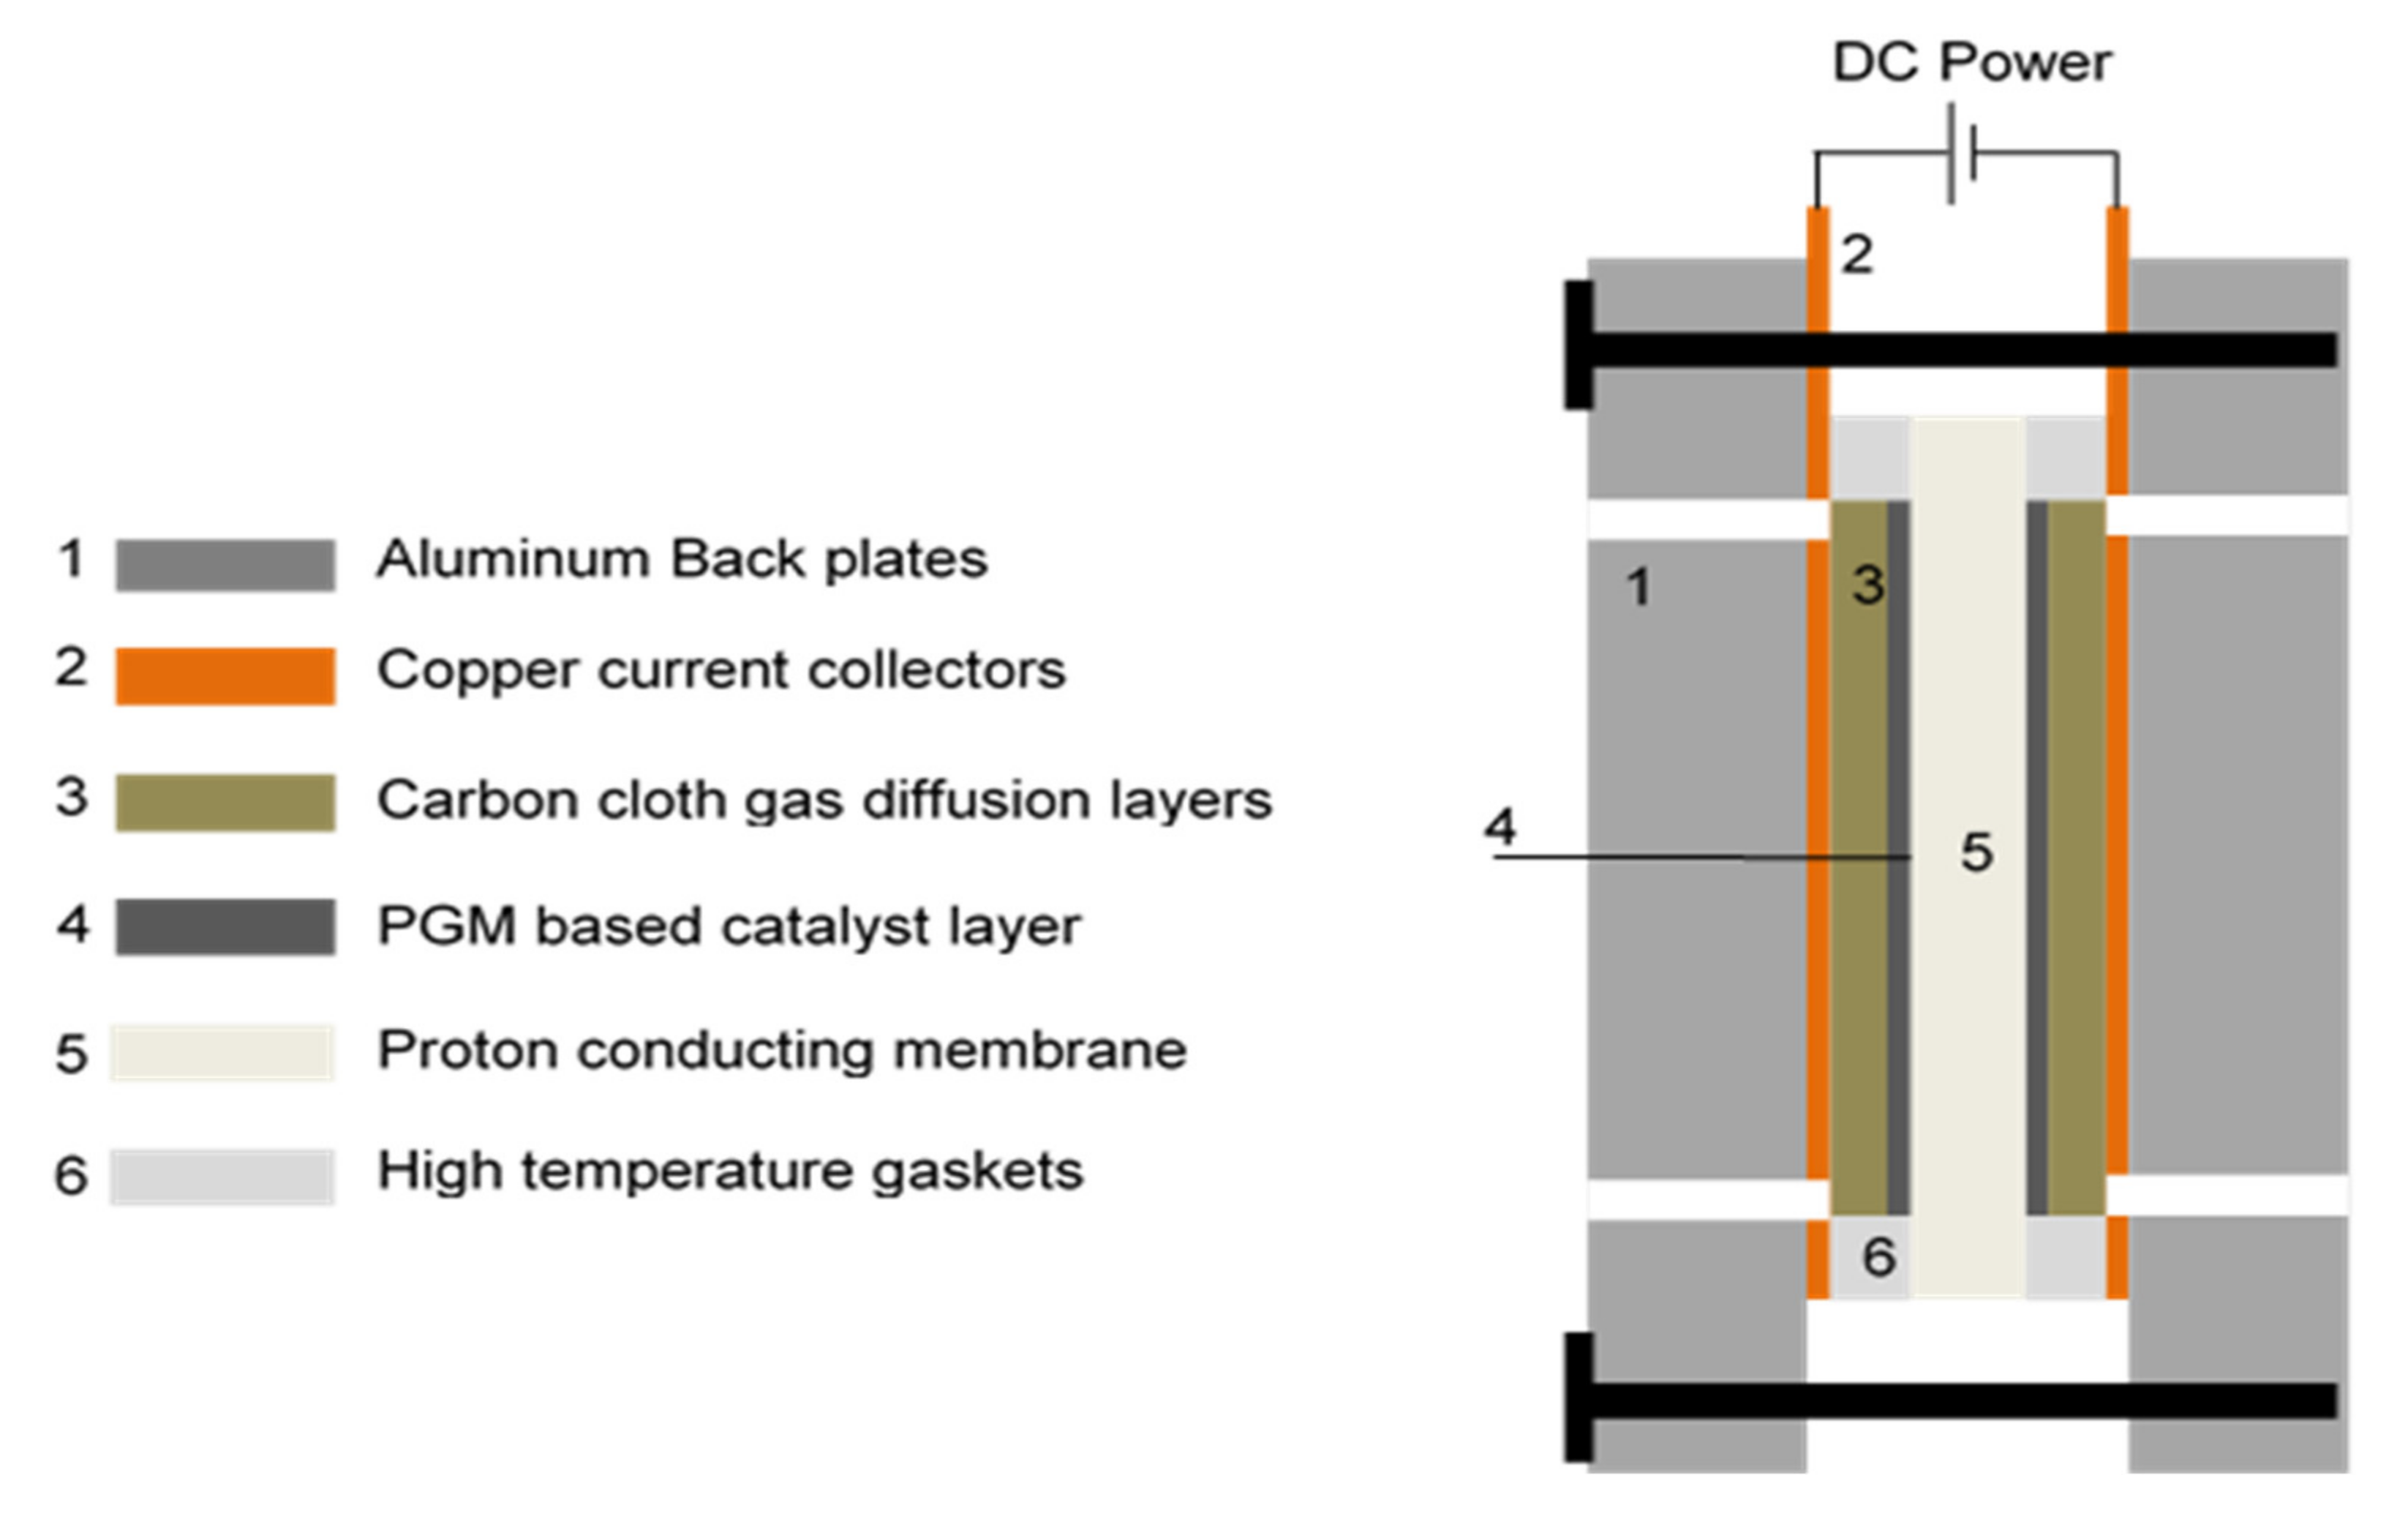
3.1. Experimental Set-Up: Cell and Membrane Electrode Assembly

Experiments were carried out using an off-the-shelf electrochemical cell with a square active area of 25 cm2 (Fuel Cell Technologies, Inc., Albuquerque, NM, USA). See Figure 2. The cell consisted of a catalyst coated proton-conducting membrane, which was placed between two pieces of carbon cloth, acting as gas diffusion layers (GDLs), and Ti flow fields. The cell was sealed with HT PFA gaskets (used to compress the membrane electrode assembly (MEA)). The cell was assembled with aluminium back plates and compressed using a torque wrench to ensure a uniform pressure distribution over the compressed MEA and to minimize the electrochemical and thermal resistance of the GDLs. The assembly torque for the 8 bolts was 6 Nm. The MEA consisted of carbon supported platinum (Pt/C) as the cathode catalyst and a bimetallic carbon supported platinum-cobalt (Pt-Co/C) as the anode catalyst, and a TPS®-based PEM (supplied by Advent Technologies, Inc., Cambridge, MA, USA). The total catalyst loading was 1.8 mg cm−2 (specified by Advent Technologies, Inc., Cambridge, MA, USA).
The properties of the TPS-based membranes used in the experiments can be found in Table 2.
An external DC power supply was connected to the bus plates of the electrochemical cell and the system was operated in constant current mode. The current and voltage were recorded with an electronic load, attached to a computer, making use of LabVIEW software. The cell temperature was controlled by two FIREROD® (Watlow, St. Louis, MO, USA) heating rods, one at the anode side and one at the cathode side, with incorporation of a K-type thermocouple (anode side) and PID controller (DCL-33A). Furthermore, the cell was enclosed in a heat insulation jacket to reduce heat losses. The temperature at the centre of the anode back plate was taken as the cell temperature. The permeate volumetric flow rate was measured using a soap flow meter and the composition of the permeate was determined with an in-line gas chromatograph (GC) (SRI 8610C-GC; SRI Instruments, Torrance, CA, USA). See GC and bubble flow meter set-up in Figure 3.

3.2. Characterization Methods Used

3.2.1. Polarization Curve Measurements

The hydrogen flow rate was kept constant at 100 mLn/min throughout all the experiments (as described below). Polarization curves were drawn, starting at 0 A cm2, and then increasing the current density with a step change of 0.02 A cm2 every 10 min. The voltage output for each current density setting was recorded every 5 Sections (performed in constant current mode). This was done until a limiting current was reached or until the voltage limit (1.1 V) was reached, after which the run was terminated. The volumetric flow rate of the permeate was recorded for all current density values, making use of a soap flow meter, in order to determine the current efficiency.

3.2.2. Electrochemical Impedance Spectroscopy Measurements

To determine the resistance of the MEA, in situ EIS was performed in constant current/galvanostatic mode (1 A), frequency range 100 kHz to 0.1 Hz, at 120–160 °C in hydrogen pumping mode. For feed streams containing impurities, the hydrogen flow rate was kept constant at 100 mLn/min H2. The AC current amplitude was a standard 10% of the applied direct current [14]. A Nyquist plot was generated of the impedance spectrum.

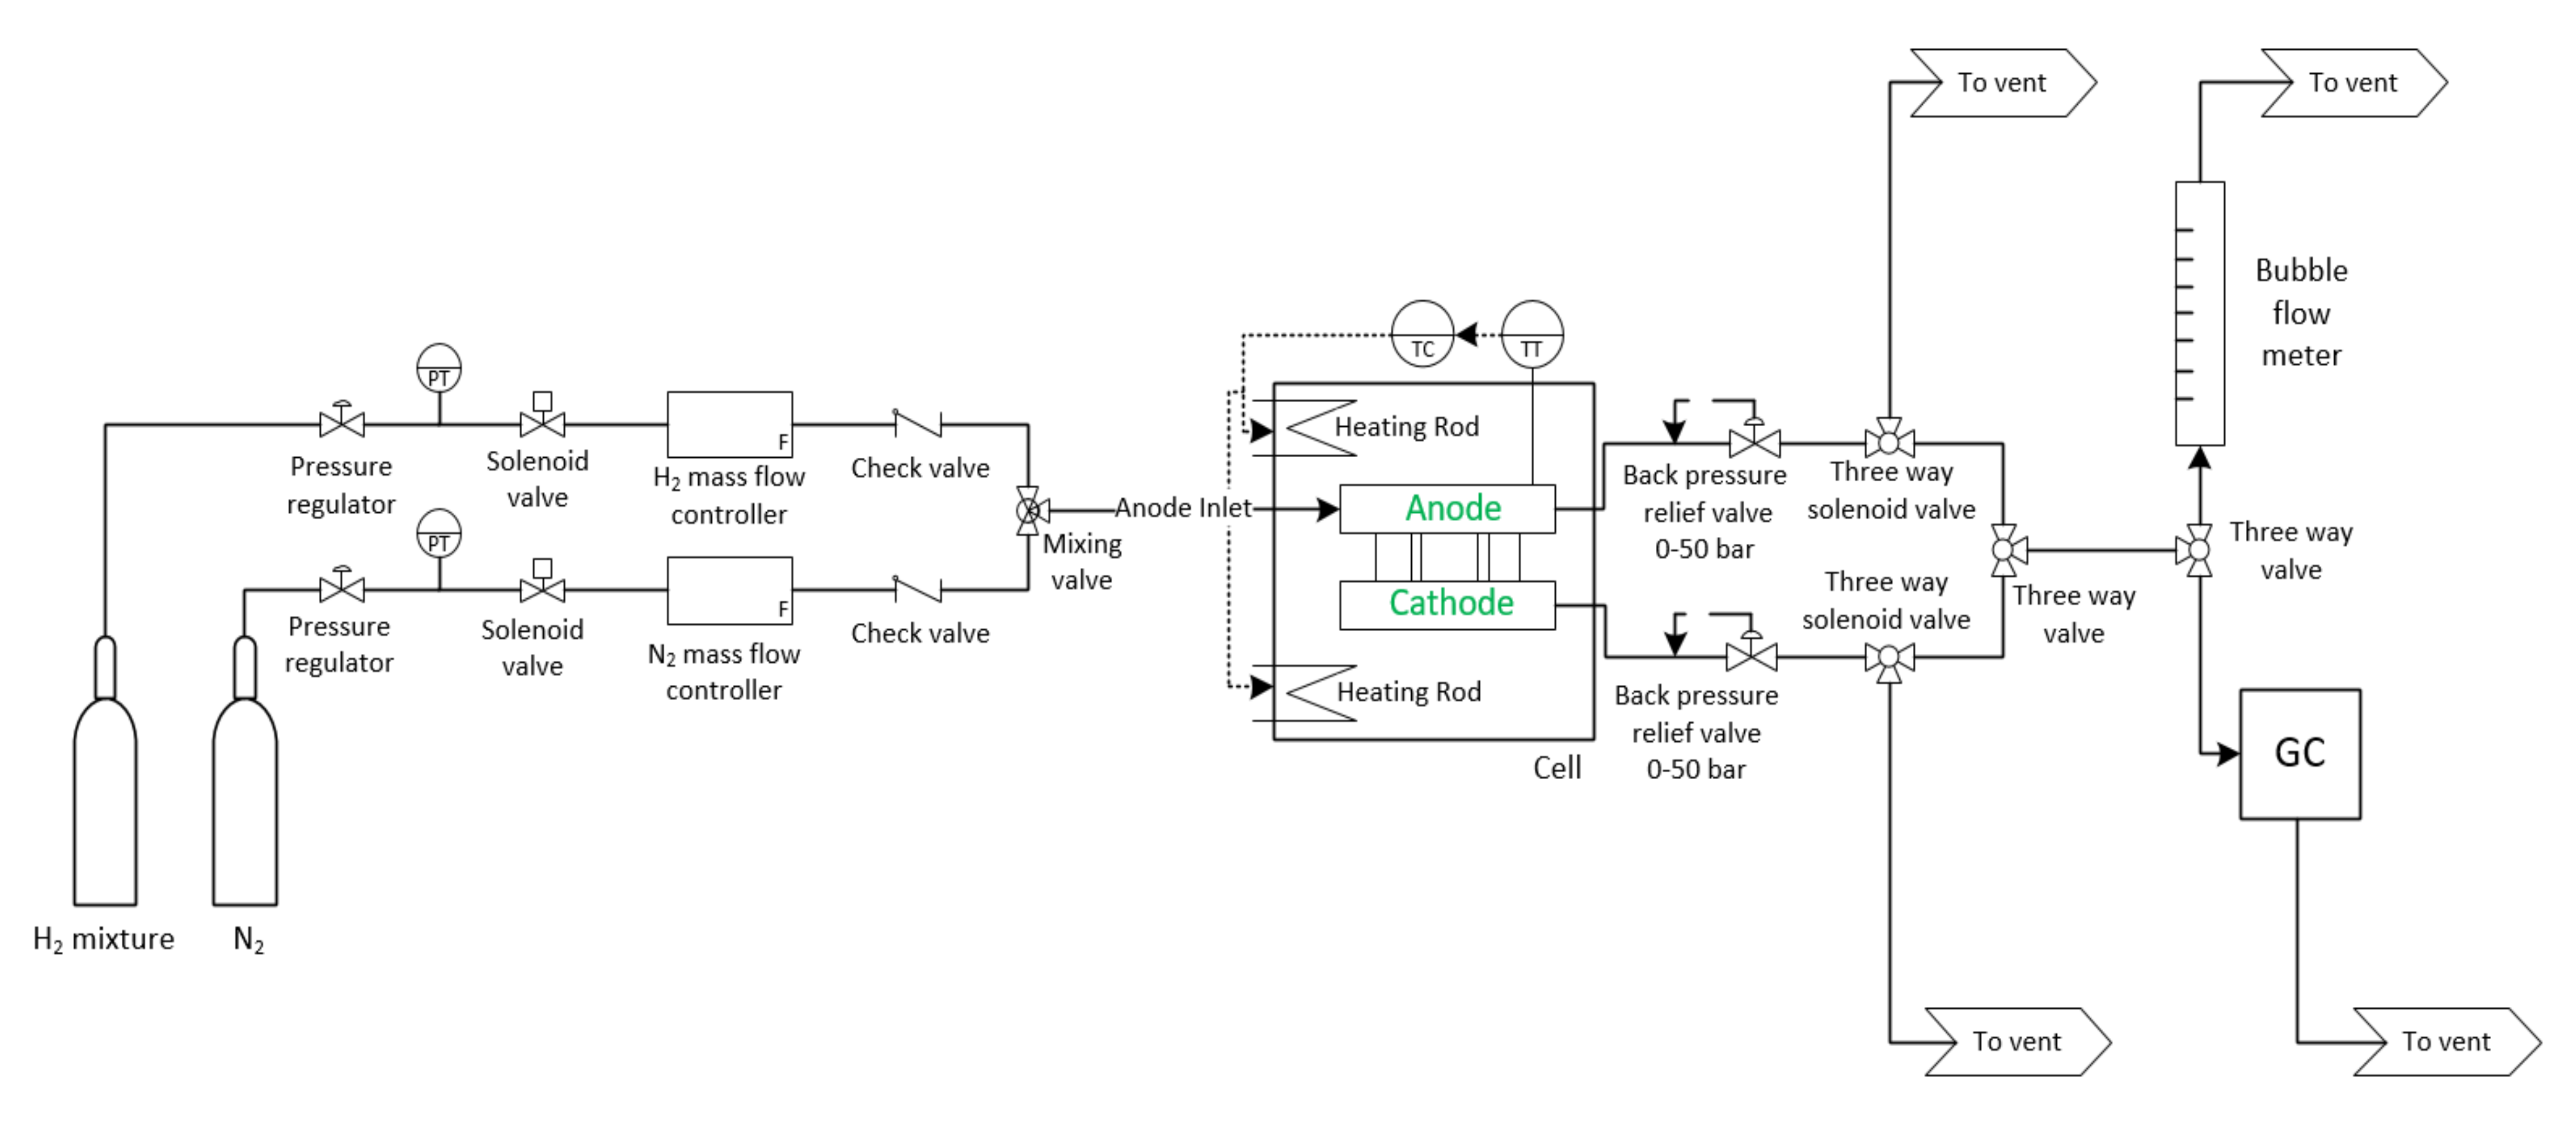
3.3. Experimental Procedure

All experiments were carried out at atmospheric pressure (~86 kPa), where the cell operating temperature was varied between 120 and 160 °C. All experiments were conducted in hysteretic order as per assessment of the performance deterioration during experimentation. All the flow rates herein reported are given in normal millilitres per minute (mLn/min), with 0 °C and 1 bar taken as reference.
Preliminary tests performed with pure hydrogen showed that the thermal cycles (heating and cooling of the cell), which lead to the expansion and contraction of the cell components, could cause the assembly bolts to loosen. Therefore, once a thermal cycle is complete and the cell is cooled down, the assembly torque on the bolts was reinsured. This procedure was applied after each thermal cycle.
The experimental tests were organized as follow. First, as a basic characterization step, the cell was operated using pure hydrogen. The effect of temperature on the performance of the cell was investigated by varying the temperature between 120 and 160 °C, in 20 °C steps. Polarization curves and EIS graphs were drawn for data at each temperature. After the pure hydrogen tests, the separation experiments were performed. A constant hydrogen flow rate of 100 mLn/min was maintained throughout. The gas mixtures were tested in the following order: H2/CH4, H2/CO2, and then the H2/NH3 gas mixture, starting at the lowest impurity mixtures and moving towards the higher impurity concentrations.

4. Results and Discussion

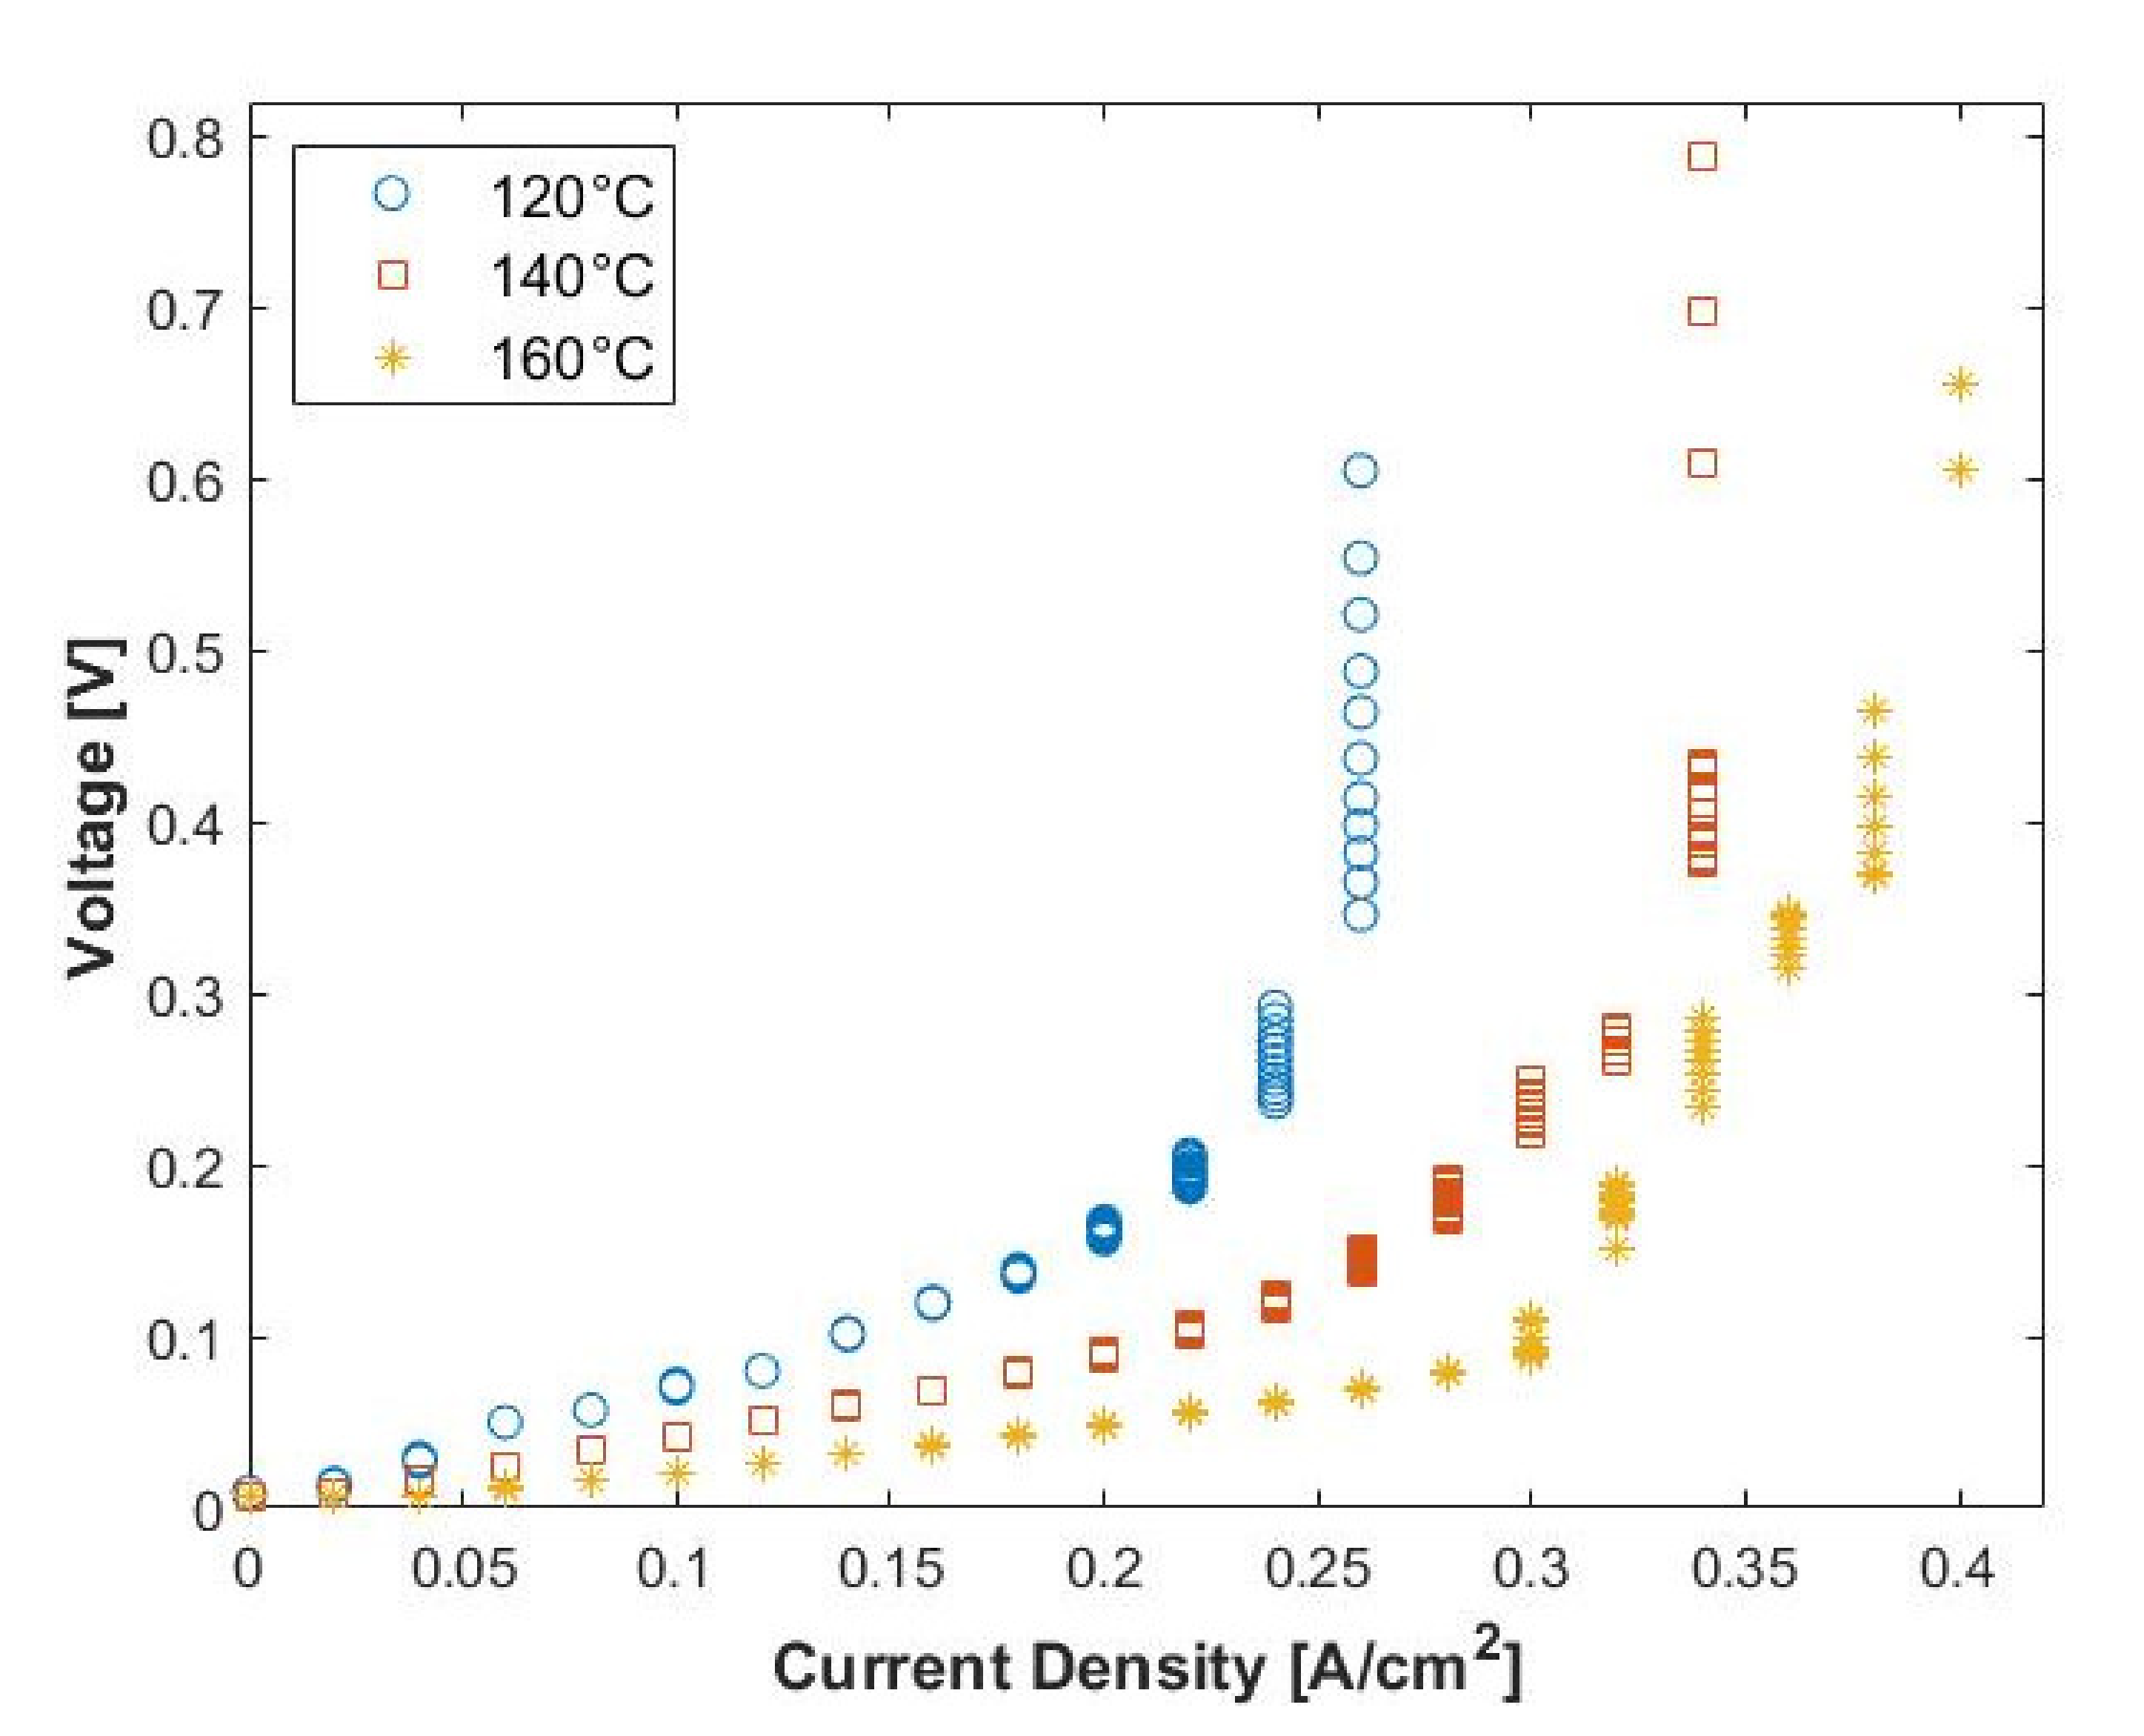
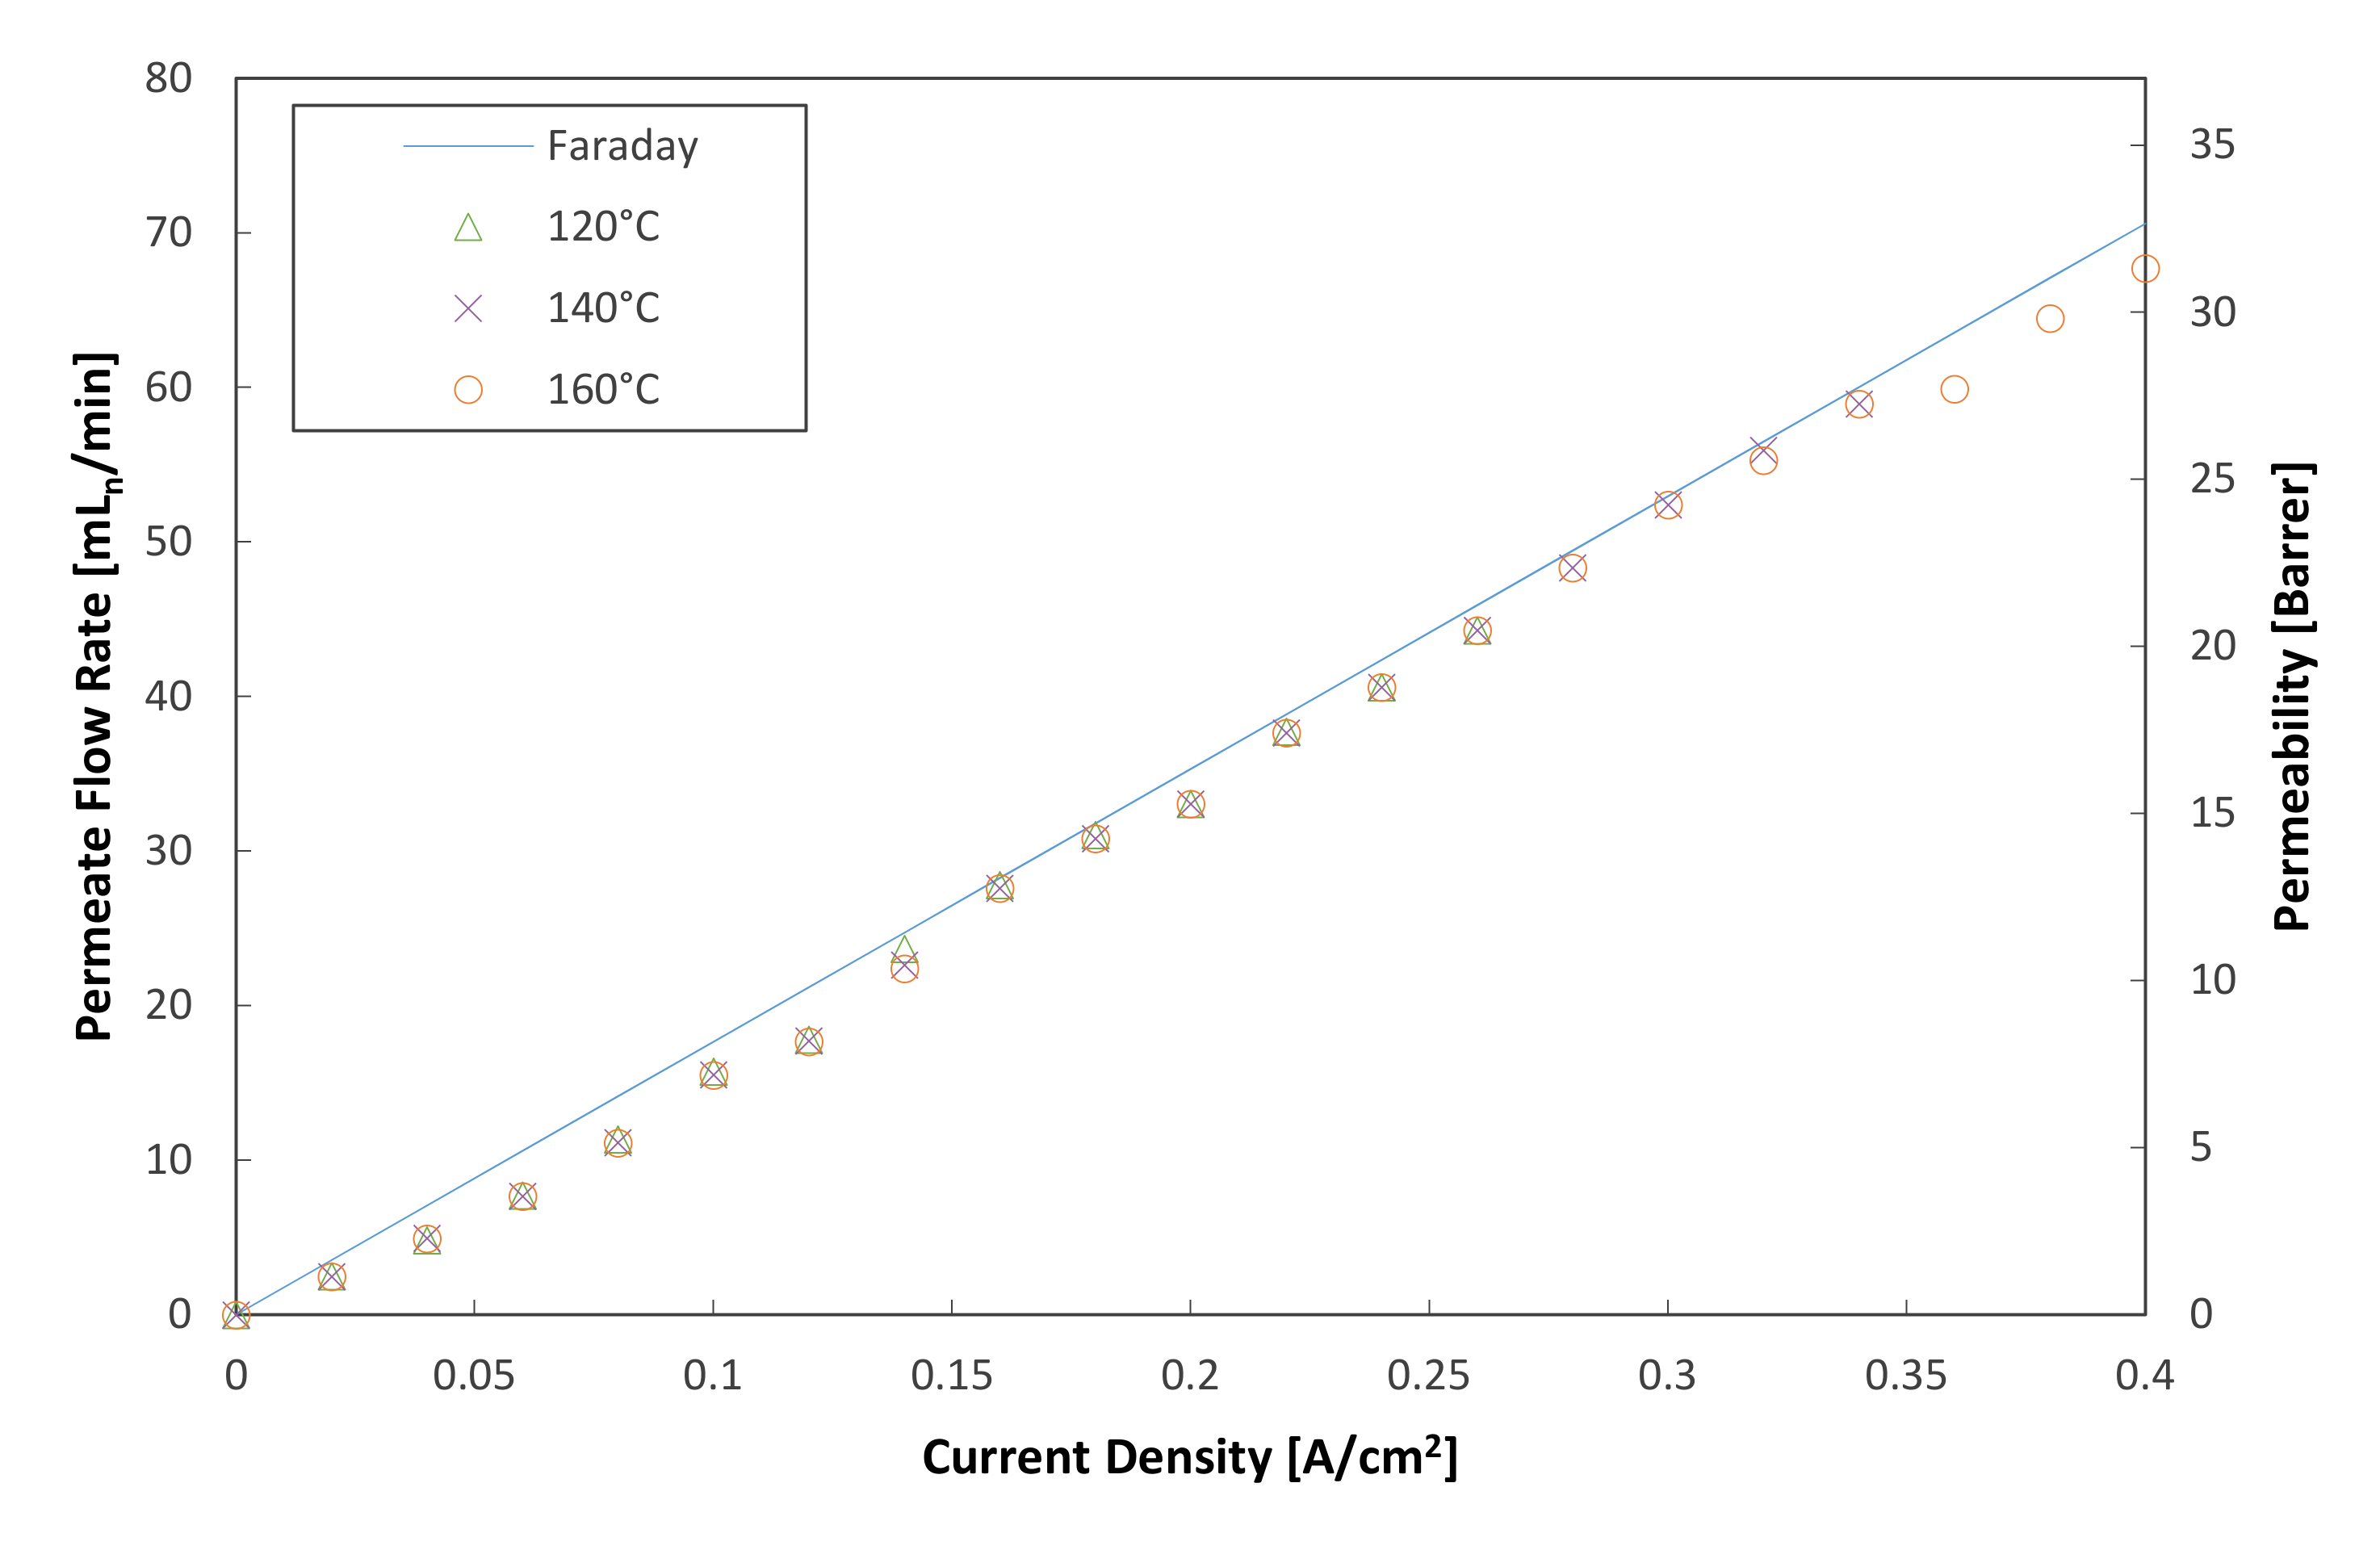
4.1. Pure Hydrogen Experiments: Membrane Characterization

The performance of the MEA was first investigated using a pure hydrogen feed at operating temperatures between 120 and 160 °C and a hydrogen flow rate of 100 mLn/min. The resulting voltage–current characteristics are shown in Figure 4. It is evident that the cell performance is sensitive to small changes in temperature (20 °C). A clear increase in the cell performance was observed as the voltage values decrease, with an increase in the applied current density. This results in higher overall power efficiencies. Moreover, the limiting current density values (vertical portion of the curves) also increased with temperature. The highest achievable current density was found to be 0.40 A cm−2 at 160 °C.
The linear nature of the initial portion of the curves indicates that the ohmic losses (IR-losses) dominate the voltage losses in this region. This behavior is common in electrochemical cells and suggests that the contact resistance and the membrane resistance play a crucial role in the general performance of the cell [15,28,45]. It can therefore be concluded that the cell performance can be enhanced by minimizing both the contact and membrane resistance. In addition, the curved nature of the final portion of the curves indicates that the mass transfer limitations dominate in the high current density region. This is explained by the depletion of reactants at the surface of the electrode.
In an ideal cell, the hydrogen permeation flux is given as a function of current, according to Faraday’s law (see Equation (1)), which is derived by assuming that the hydrogen is an ideal gas. However, the real value is always smaller than that depicted by an ideal process, due to losses in the system. In this particular case, the losses can be determined by the current efficiency, which is defined as the ratio of the actual hydrogen permeation rate and the theoretical hydrogen permeation rate:
ε i = m ˙ H 2 E x p e r i m e n t a l m ˙ H 2 T h e o r e t i c a l
where m ˙ H 2 E x p e r i m e n t a l depicts actual hydrogen flow from the cathode and m ˙ H 2 T h e o r e t i c a l depicts the theoretical hydrogen flow rate, determined from Faraday’s law. A visual correlation between the theoretical and actual hydrogen permeation rates is plotted in Figure 5. The hydrogen permeability is also shown on the same graph (left y-axis). In general, the measured data show good correlation with the theoretical values.
The calculated current efficiencies, together with the voltage and power efficiencies are illustrated in Figure 6. The voltage efficiency is defined in terms of the thermal energy of the hydrogen generated (Equation (3)). This is calculated with the voltage equivalent of the heat of combustion of hydrogen (1.484 V), whereas the power efficiency can be defined as the product of both the voltage and current efficiencies (Equation (4)).
ε v = 1 V 1.484
ε p = ε i × ε v
At low current densities (<0.08 A cm−2) the current efficiencies were relatively low (~80%) for all temperatures considered here. However, as the current density was increased, and therefore also the hydrogen flux, the current efficiency increased to >95%. Due to the high current efficiencies observed at the higher current densities, it was concluded that the lower efficiencies at lower current densities were caused by back diffusion of hydrogen. This can be explained by the low hydrogen fluxes at low current densities. Overall, it can be concluded that the current efficiency increased with current density at constant temperature, whilst temperature seems to play a negligible role in the current efficiency. Also, the voltage efficiency increased with an increase in temperature and decreased with an increase in current density. Lastly, higher power efficiencies were reached when the temperature was increased. The maximum power efficiencies at the respective temperatures were ~91% (120 °C), ~93% (140 °C) and ~95% (160 °C) at 0.16 A cm−2. Therefore, 0.16 A cm−2 was considered the optimum operating current density with regards to the power consumption at 120–160 °C.
In order to obtain a better understanding of the temperature effect on the performance of the EHS, EIS was used to diagnose the cell. Figure 7 shows the in situ AC impedance spectrum of the EHS operated at 0.1 A cm−2 with variations in the temperature and the hydrogen flow rate. Similar spectra have been widely reported in the literature for both FCs [14,46] and EHSs [47,48]. The intercept of the real axis (x-axis) represents the ohmic resistance, which is defined as the sum of the contact resistance, electrical resistance and the proton conduction resistance in the membrane). Figure 7 shows that the impedance spectra move towards the left as the temperature is increased. The leftwards movement indicates that the ohmic resistance of the cell decreases with temperature. This is in agreement with what is reported in the literature, as the membrane can be considered as an electric insulator, which means that theoretically its resistance decreases with temperature [49].
The diameter of the impedance arc is the sum of the charge transfer and mass transfer resistance. The reduction in the arc diameter at higher temperatures indicates that there is a slight improvement in mass transport and high frequency charge transfer [49]. According to Su et al. [50], an increase in temperature enhances the cell performance due to the increase in the mass transfer rate, and a lower cell resistance, as confirmed in this work. Furthermore, the overall performance enhancement with increasing temperatures (polarization curves) can be attributed to the decrease in ohmic resistance and the improvement in mass transport and high frequency charge transfer observed in the EIS data [49].

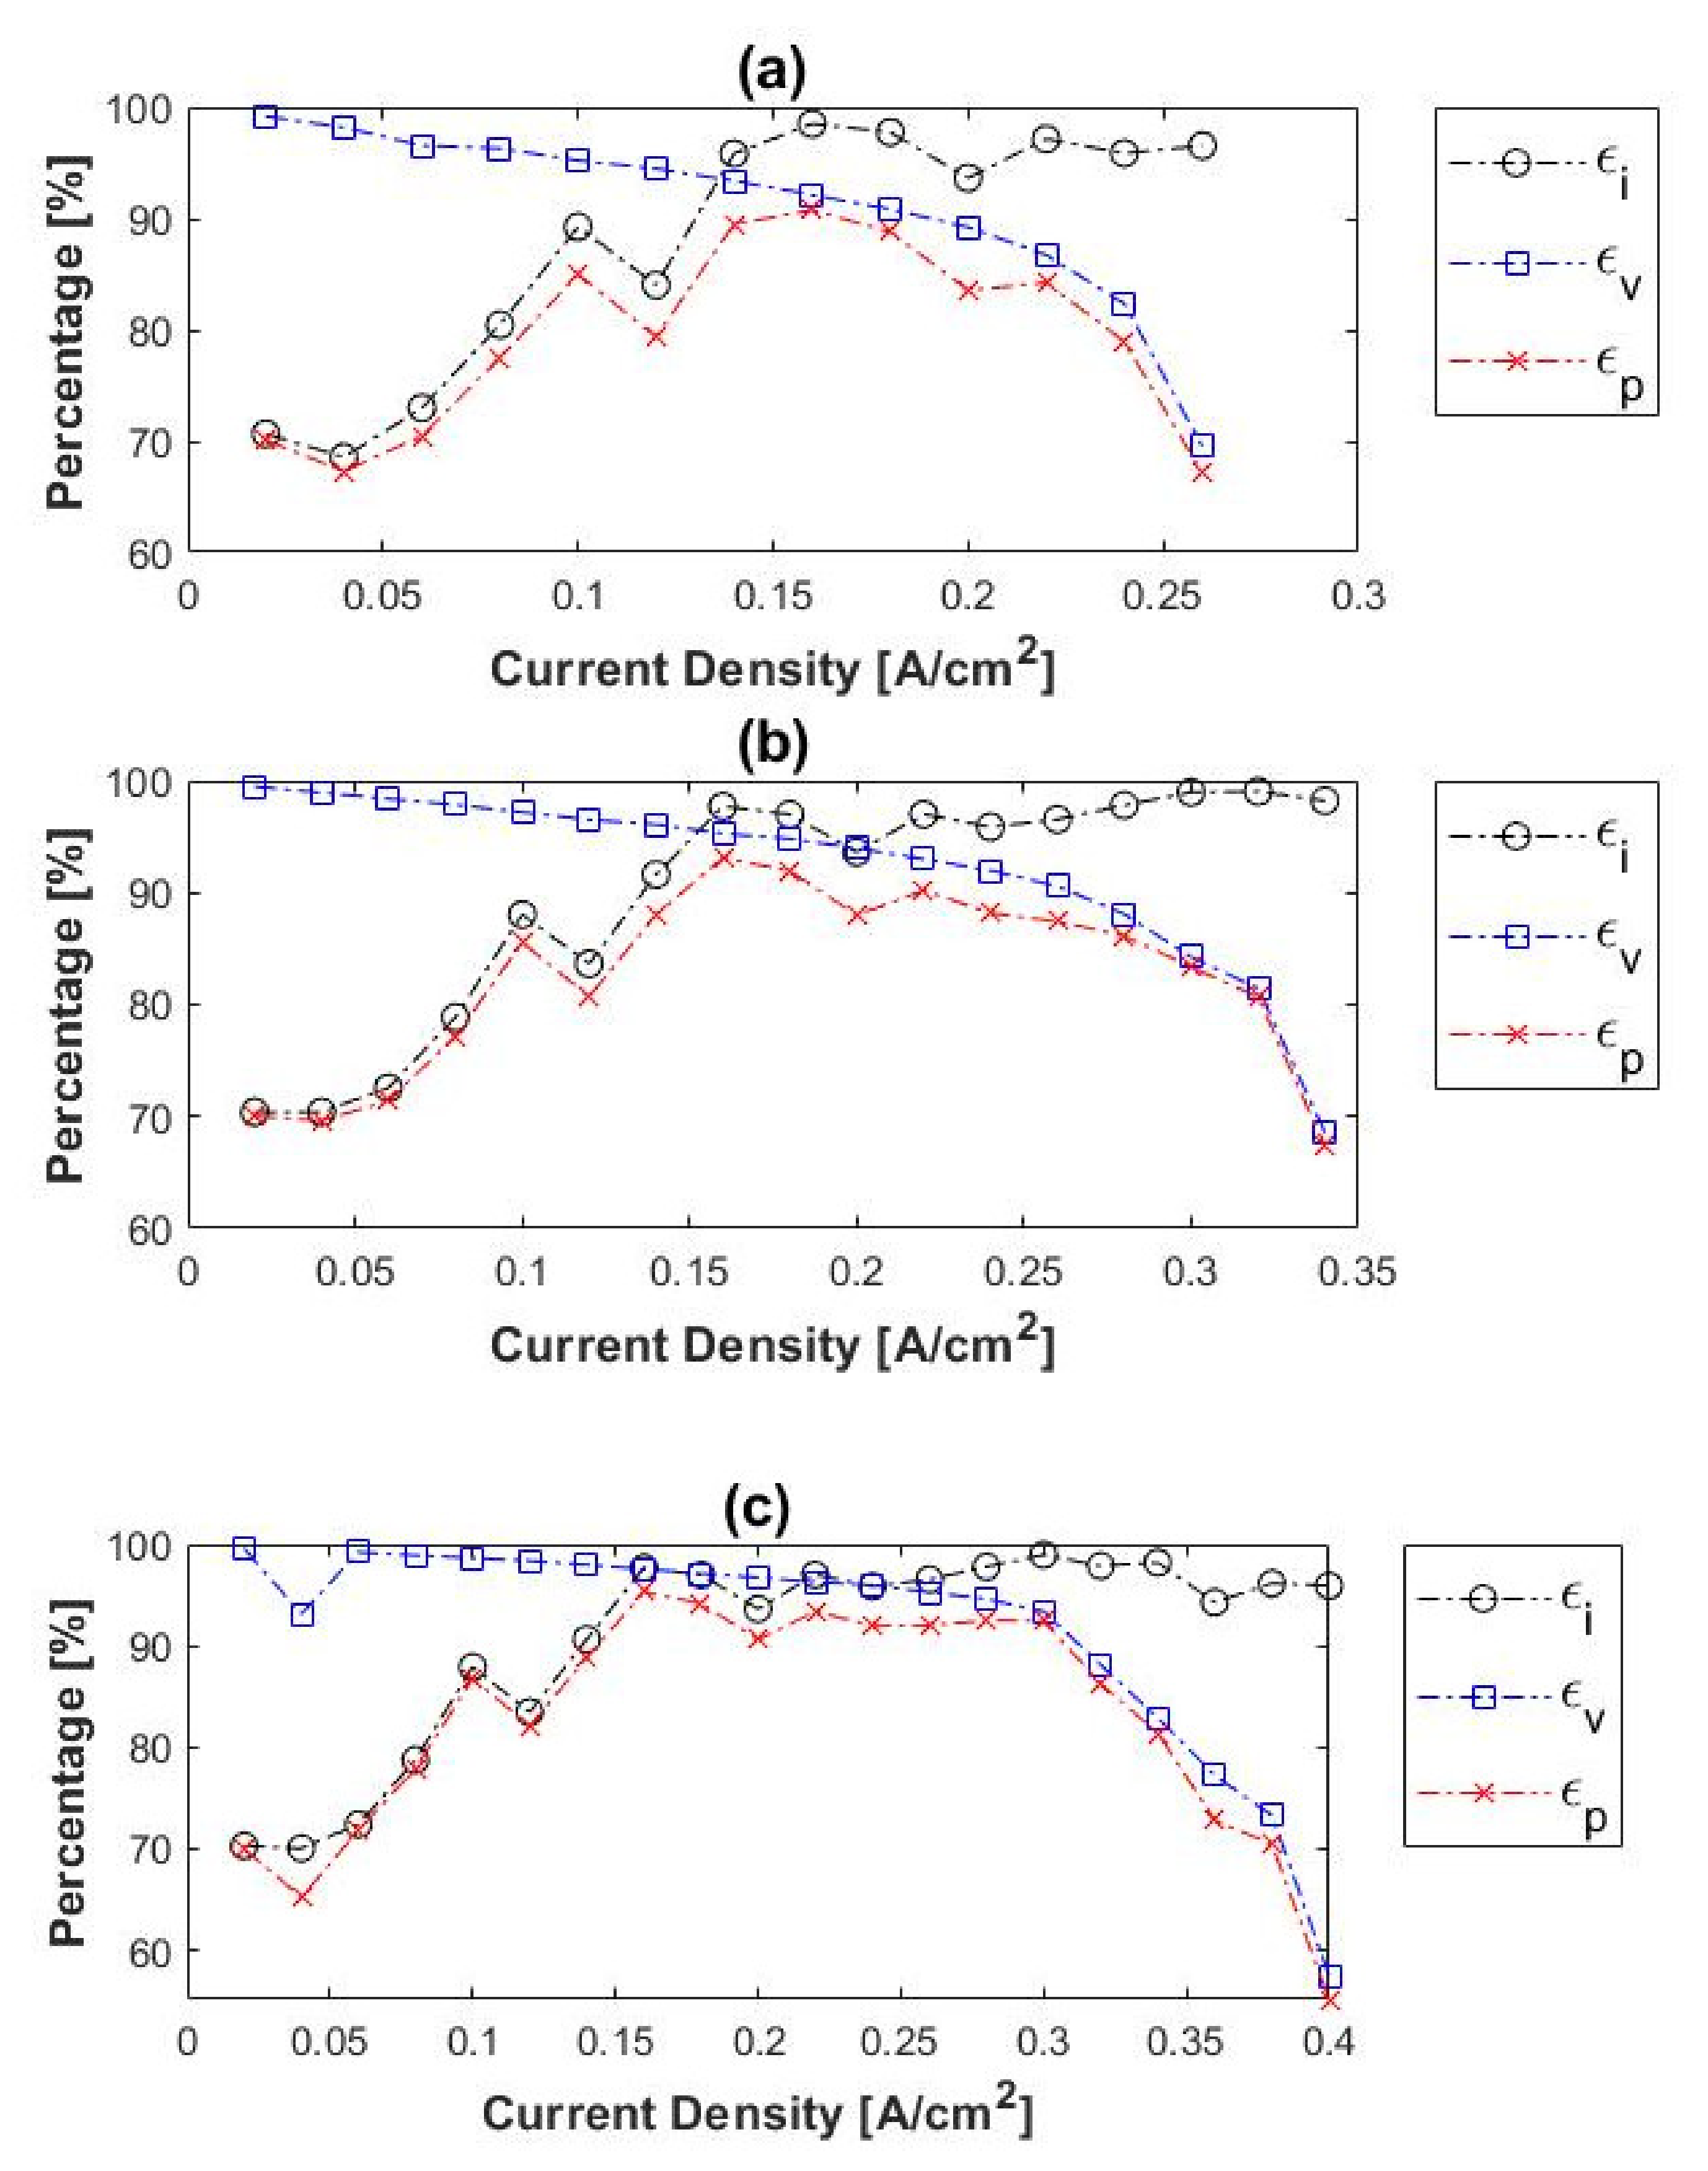
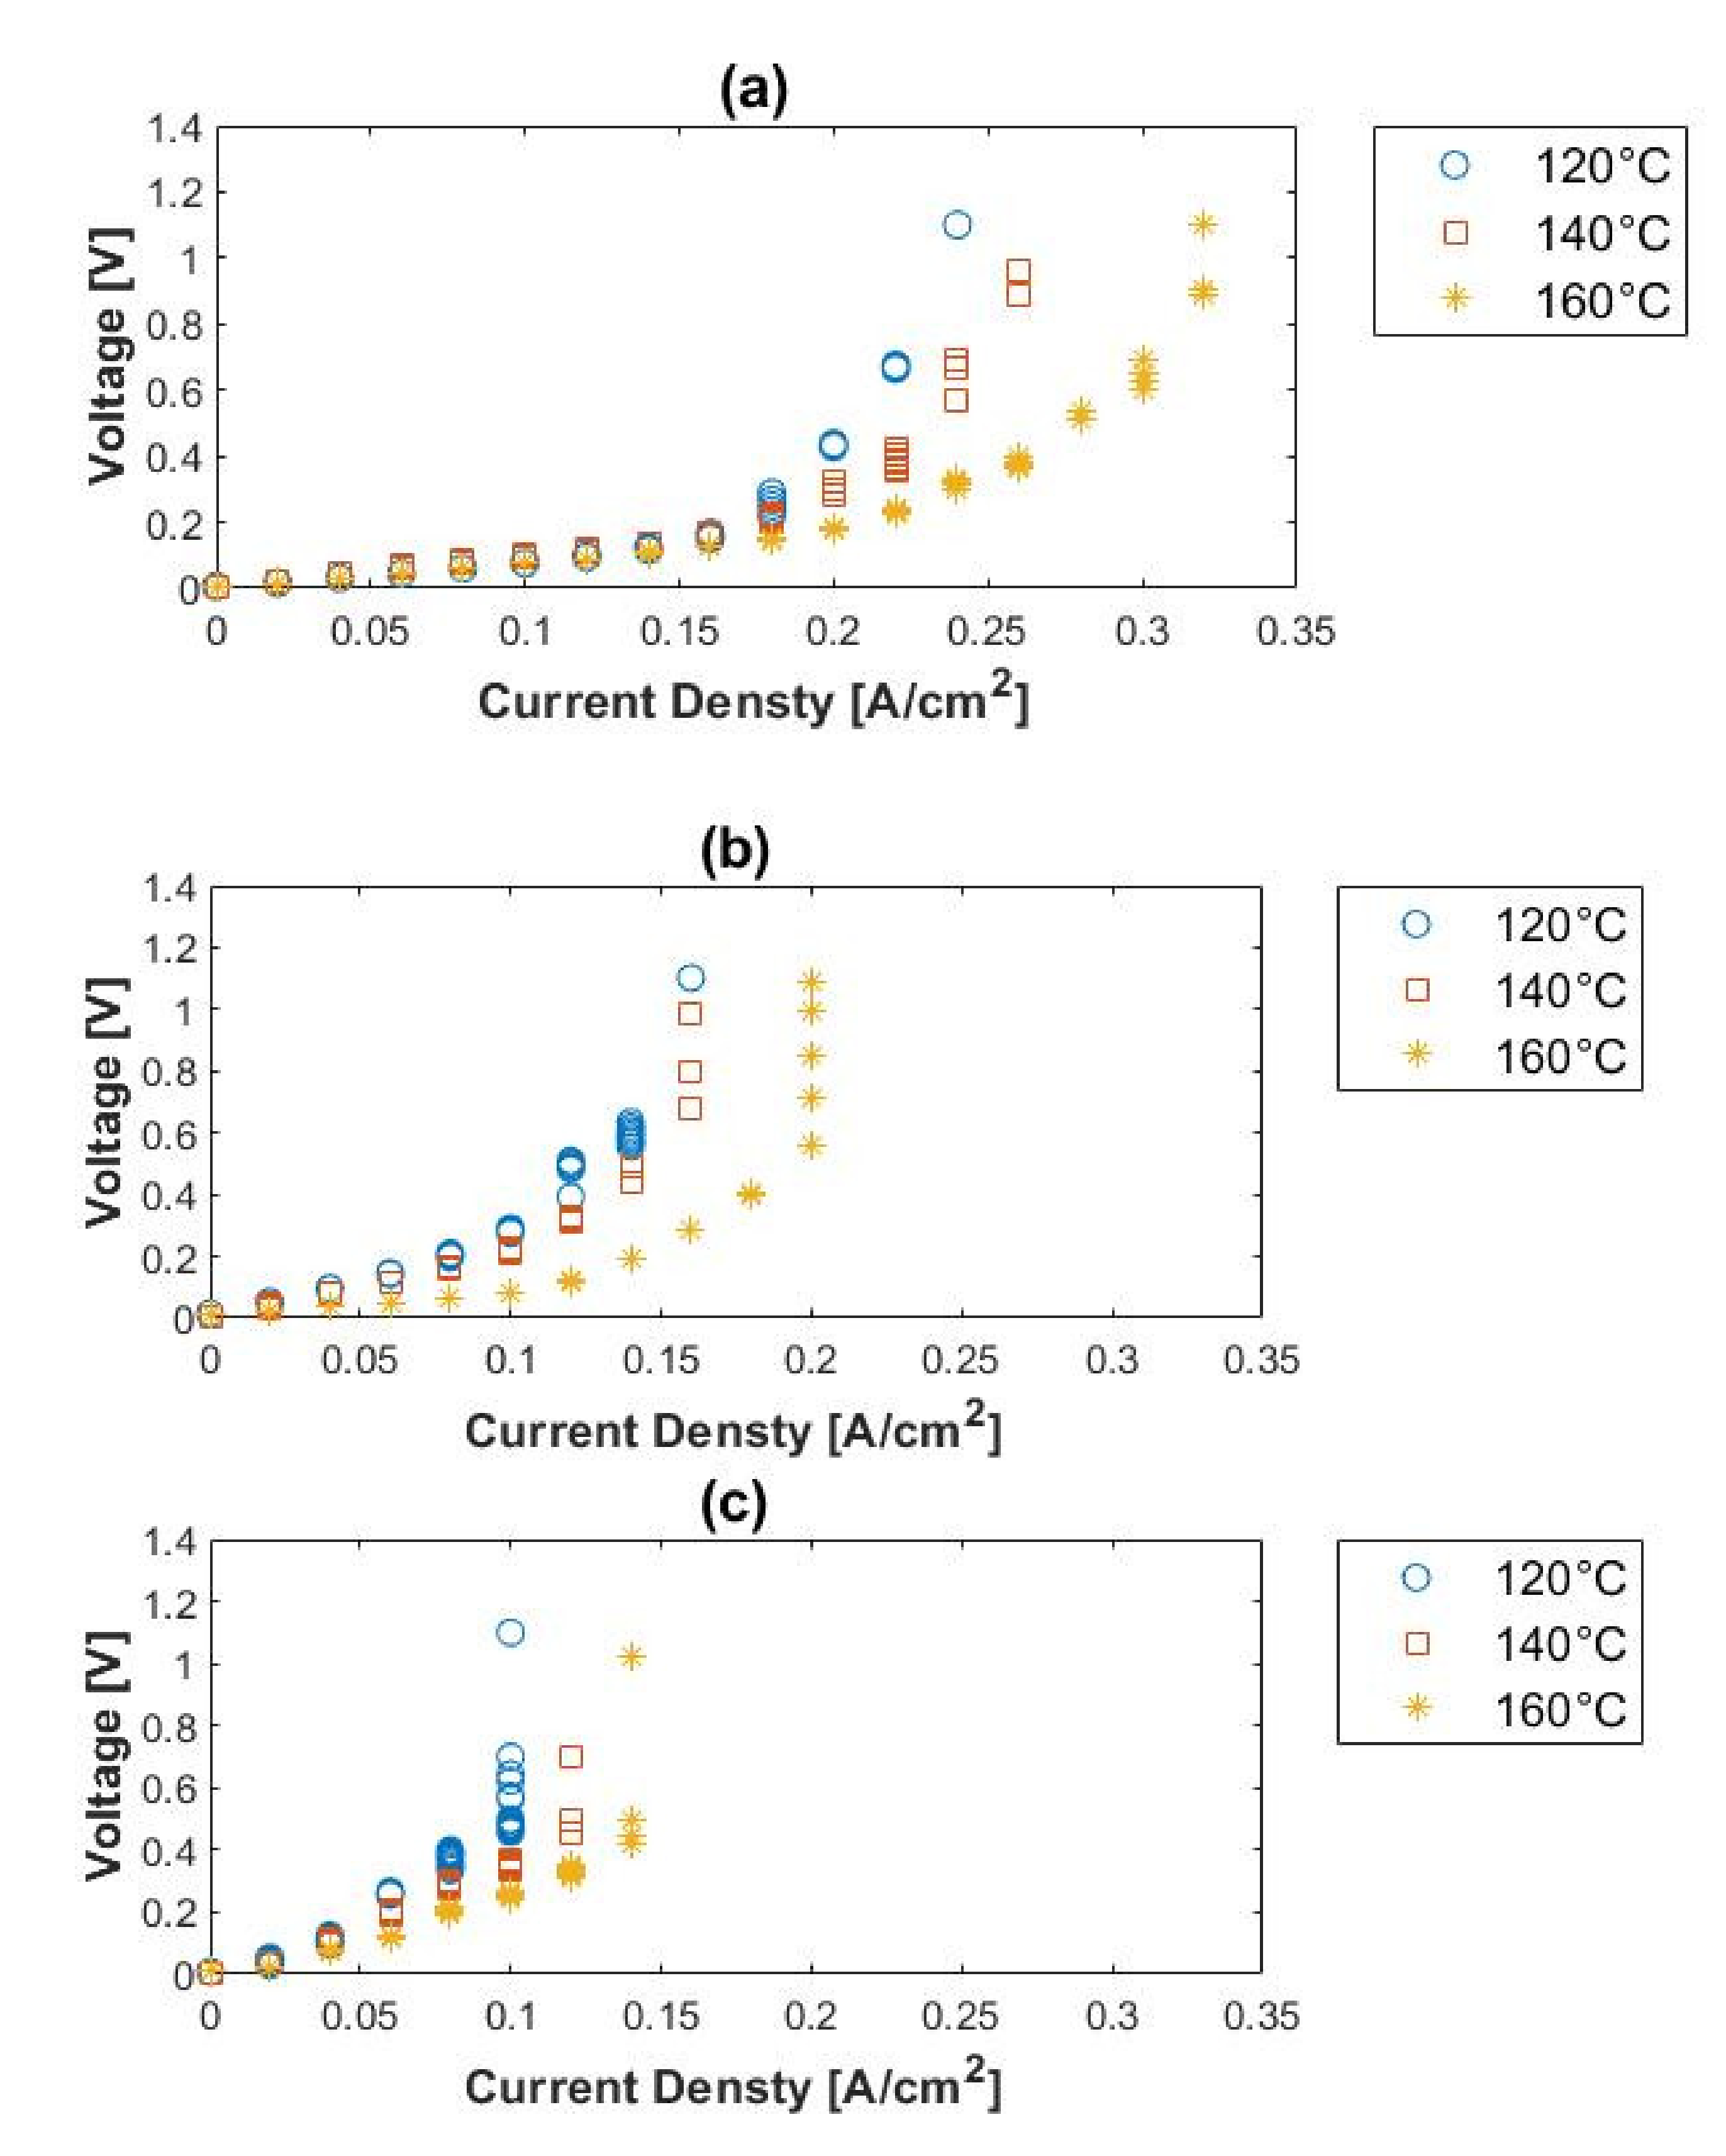
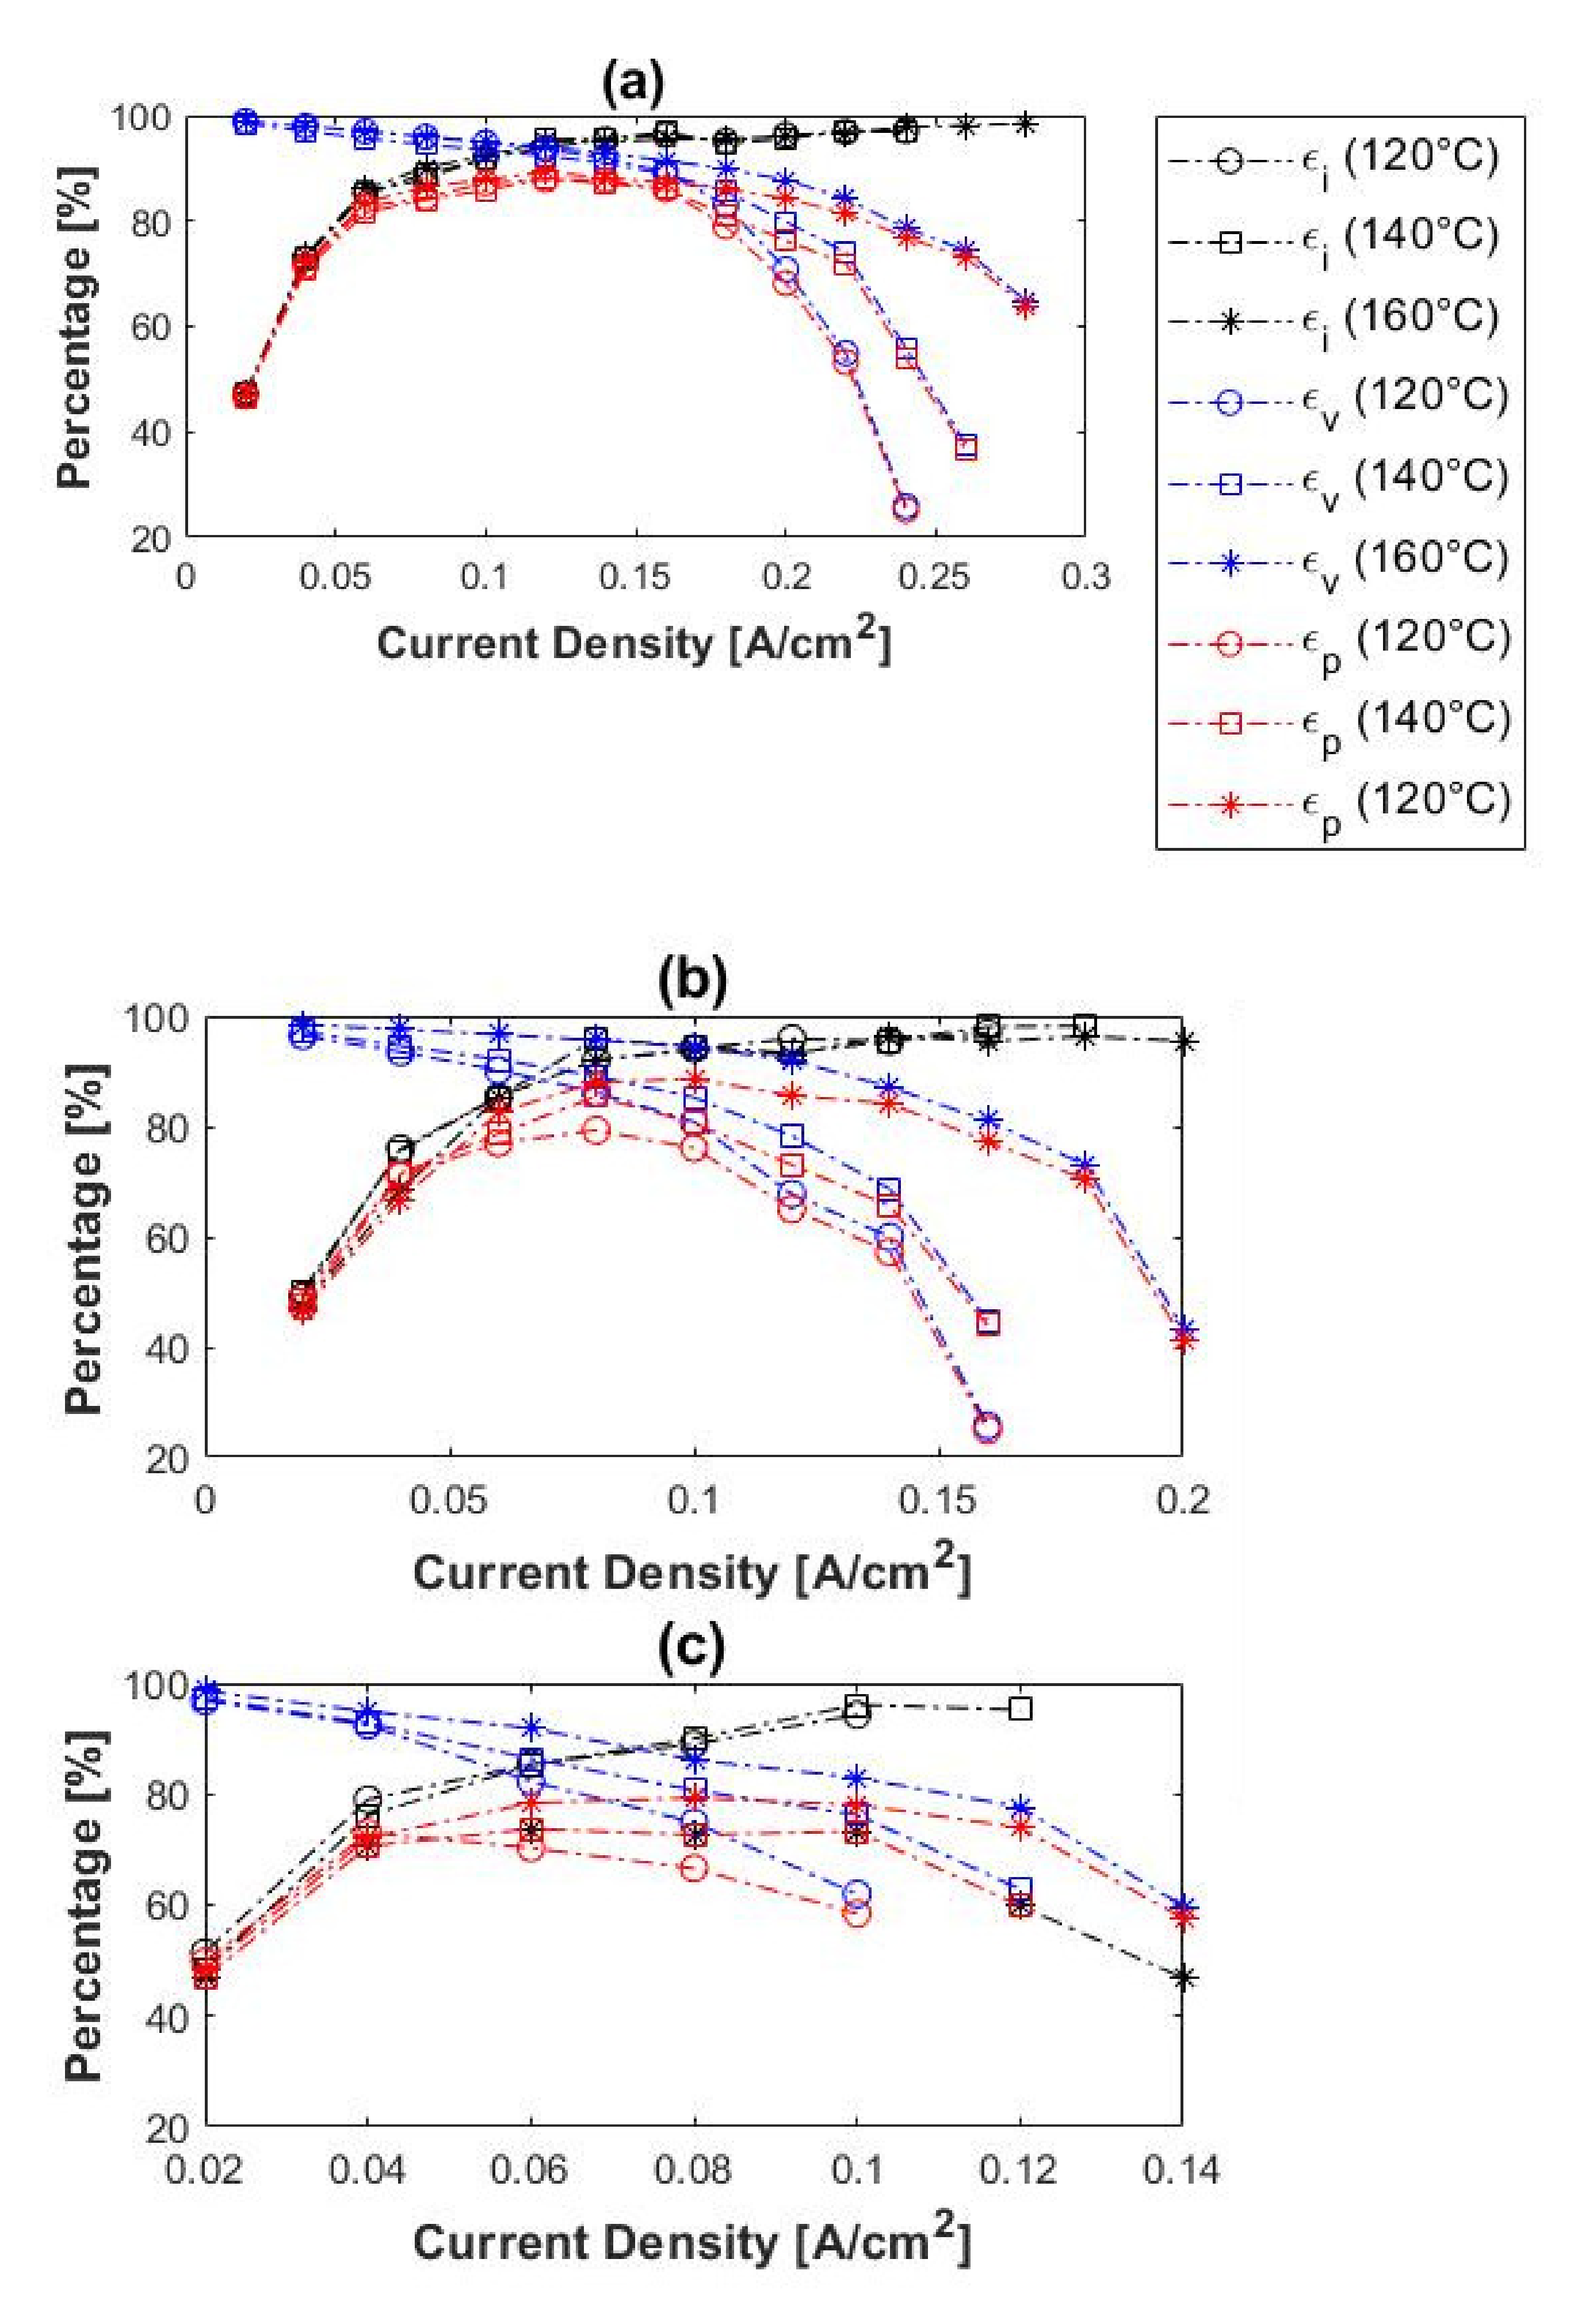
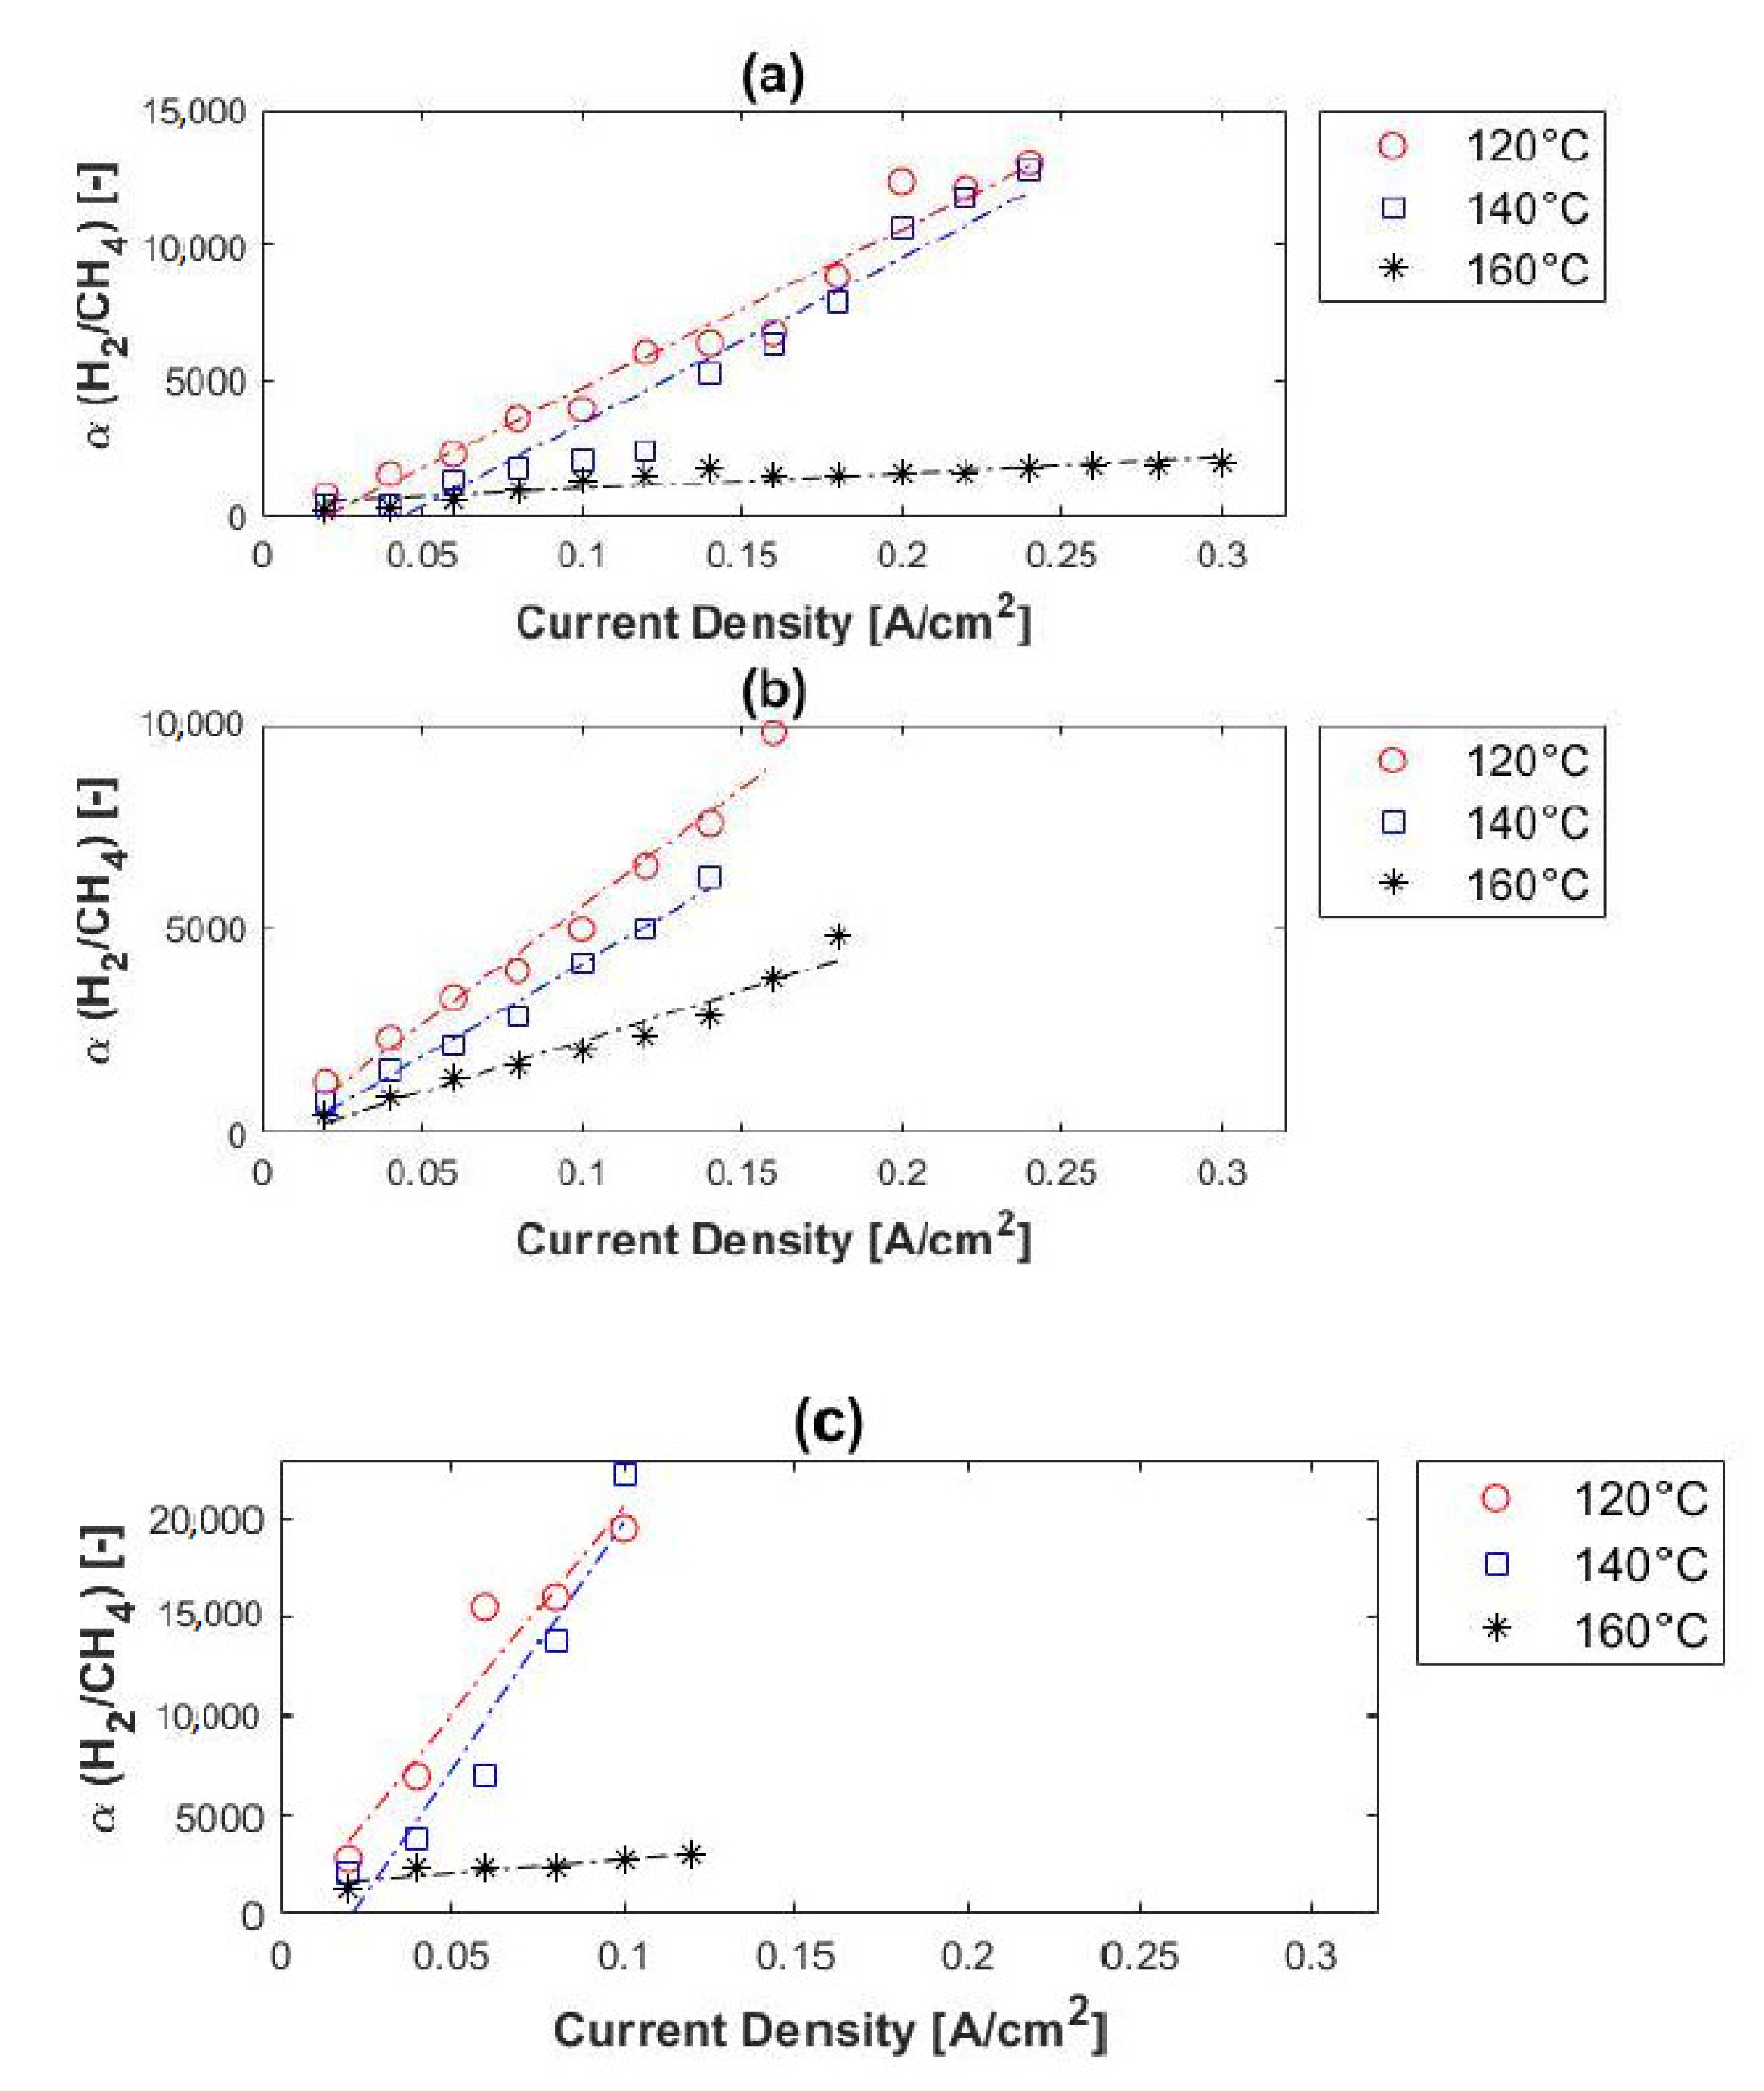
4.2. Hydrogen Separation from H2/CH4 Gas Mixtures

The EHS was evaluated for the electrochemical hydrogen separation from H2/CH4 gas mixtures (10% CH4, 50% CH4, and 80% CH4, with the balance hydrogen), where the hydrogen flow rate was kept constant at 100 mLn/min. The voltage–current characteristics of the H2/CH4 mixtures at different cell temperatures and feed concentrations are shown in Figure 8 and were compared to that of pure hydrogen (refer to Figure 4).
Generally, higher voltages were reached with the H2/CH4 gas mixtures, compared to that of pure hydrogen. Here it is noteworthy that the open-current voltage (OCV), determined by the Nernst equation, is not zero, as is the case with pure hydrogen. This is due to the differences in partial pressures [13]. The OCVs were calculated for the different feed compositions and temperatures at a fixed current density of 0.1 A cm−2. See Table 3. These values were compared to the cell voltages corresponding to pure hydrogen at the same current density: 0.071 V (120 °C), 0.042 V (140 °C) and 0.021 (160 °C), respectively. Based on Kim et al. [47], the actual operating voltage for the gas separation can be estimated by subtracting the OCV from the measured cell voltage. However, from Table 3, it is evident that these values are still much higher than the cell voltages corresponding to pure hydrogen.
General conclusions can be drawn from the performance curves (Figure 8). Firstly, at constant inlet composition, the general performance of the cell increased with temperature. This is explained by the enhanced reaction activity (mass transfer rate) of the electrodes at higher temperatures. Similar results have been reported by Lee et al. [15]. However, at constant temperature, an increase in methane concentration leads to a decrease in the performance of the cell. This performance decrease shows that the partial pressure of the hydrogen influences the general performance of the cell. Secondly, the limiting current density values, indicating where most of the hydrogen in the H2/CH4 mixtures has been consumed and where the hydrogen partial pressure at the anode becomes small, were seen to increase with temperature and decrease with methane concentration.
The current, voltage, and power efficiencies of the H2/CH4 gas mixtures were also considered and compared to those of pure hydrogen. The experimental results obtained for 10%, 50%, and 80% CH4 are illustrated in Figure 9. In general, the initial current efficiencies were significantly lower than that obtained with pure hydrogen. The current efficiencies for H2/CH4 were in the range ~47–51% at 0.02 A cm−2, whereas those for pure hydrogen were ~70%. The current efficiencies of the H2/CH4 mixtures also increased with current density, as was the case with pure hydrogen. The voltage efficiencies, on the other hand, decreased with an increase in current density, which correlates well with the results of pure hydrogen experiments. Moreover, the voltage efficiencies seemingly increased with temperature, observed with the 50 and 80% CH4 inlet mixtures. However, in the case of the 10% CH4, this trend was only visible at current densities > 0.16 A cm−2.
The power efficiencies had a maximum value at 0.12 A cm−2 with 10% CH4, 0.08–0.1 A cm−2 with 50% CH4 and 0.04–0.08 A cm−2 with 80% CH4. This depicts the optimum current density for hydrogen separation from the H2/CH4 mixtures at the respective operating conditions, with regards to the power consumption. Furthermore, the power efficiencies decreased with an increase in methane concentration and increased with temperature. The highest power efficiency was, therefore, observed with the 10% CH4 mixture at 160 °C: ~89%. Overall, the power efficiencies obtained with the respective H2/CH4 mixtures were much lower than with pure hydrogen, especially when the hydrogen-to-methane ratio of the inlet decreased.
In terms of separation, a high purity hydrogen (>99.9%) was achieved with all the methane inlet concentrations (10%, 50%, and 80% CH4). This implies that a high hydrogen purity can be generated from H2/CH4 gas mixtures, in a single-stage process, regardless of the inlet methane concentration. Moreover, the hydrogen purity was slightly enhanced with an increase in temperature. Besides the hydrogen purity, the hydrogen selectivity values were also calculated and reported [51]:
α i j = y i x i y j x j
where yi and yj are the molar fractions of gas species i and j on the permeate side, while xi and xj are the molar fractions of gas species i and j on the feed side.
The relationship between the hydrogen selectivity and current density, as a function of methane concentration, is illustrated in Figure 10. At fixed temperature and impurity concentration, the hydrogen purity of the permeate stream increased with an increase in current density. This is because, according to Faraday’s law, the proton flux through the membrane increases with current density, while the impurities (in this case CH4) are unaffected by the current density. The permeation of the impure gas species (CH4) through the membrane was proportional to/dependent on the change in partial pressure. When the hydrogen partial pressure at the anode side decreased, the selectivity and the hydrogen purity of the permeate (cathode outlet) increased.
According to Rowe et al. [52], the separation performance of a membrane can be improved by reducing the temperature, as explained by the Arrhenius equation. Our findings were in agreement with this. According to Figure 10, much higher hydrogen selectivity values were achieved at lower temperatures. For the 10% methane feed stream, the hydrogen selectivity decreased from ~13,000 to ~12,750 and then to ~1980 as temperature was increased from 120 to 140 °C and then to 160 °C. For the 50% methane feed stream, the selectivity decreased from ~9800 (120 °C) to ~6250 (140 °C) and then to ~4800 (160 °C). The highest hydrogen selectivity (~22,200) was achieved with the 80% methane feed stream at 140 °C. It was therefore evident that the selectivity values increase with both methane concentration and current density, and decrease when the temperature is increased.
Furthermore, the temperature effect on the hydrogen selectivity of the PEM was more pronounced at higher temperatures. Compared to the hydrogen selectivity values of other membrane technologies, for example, dense metallic (>1000), dense ceramic (>1000), microporous ceramic (5–139), porous carbon (4–20), and dense polymeric (low), it is evident that in terms of H2/CH4 separation (selectivity) the EHS far exceeds its competitors [18,25].

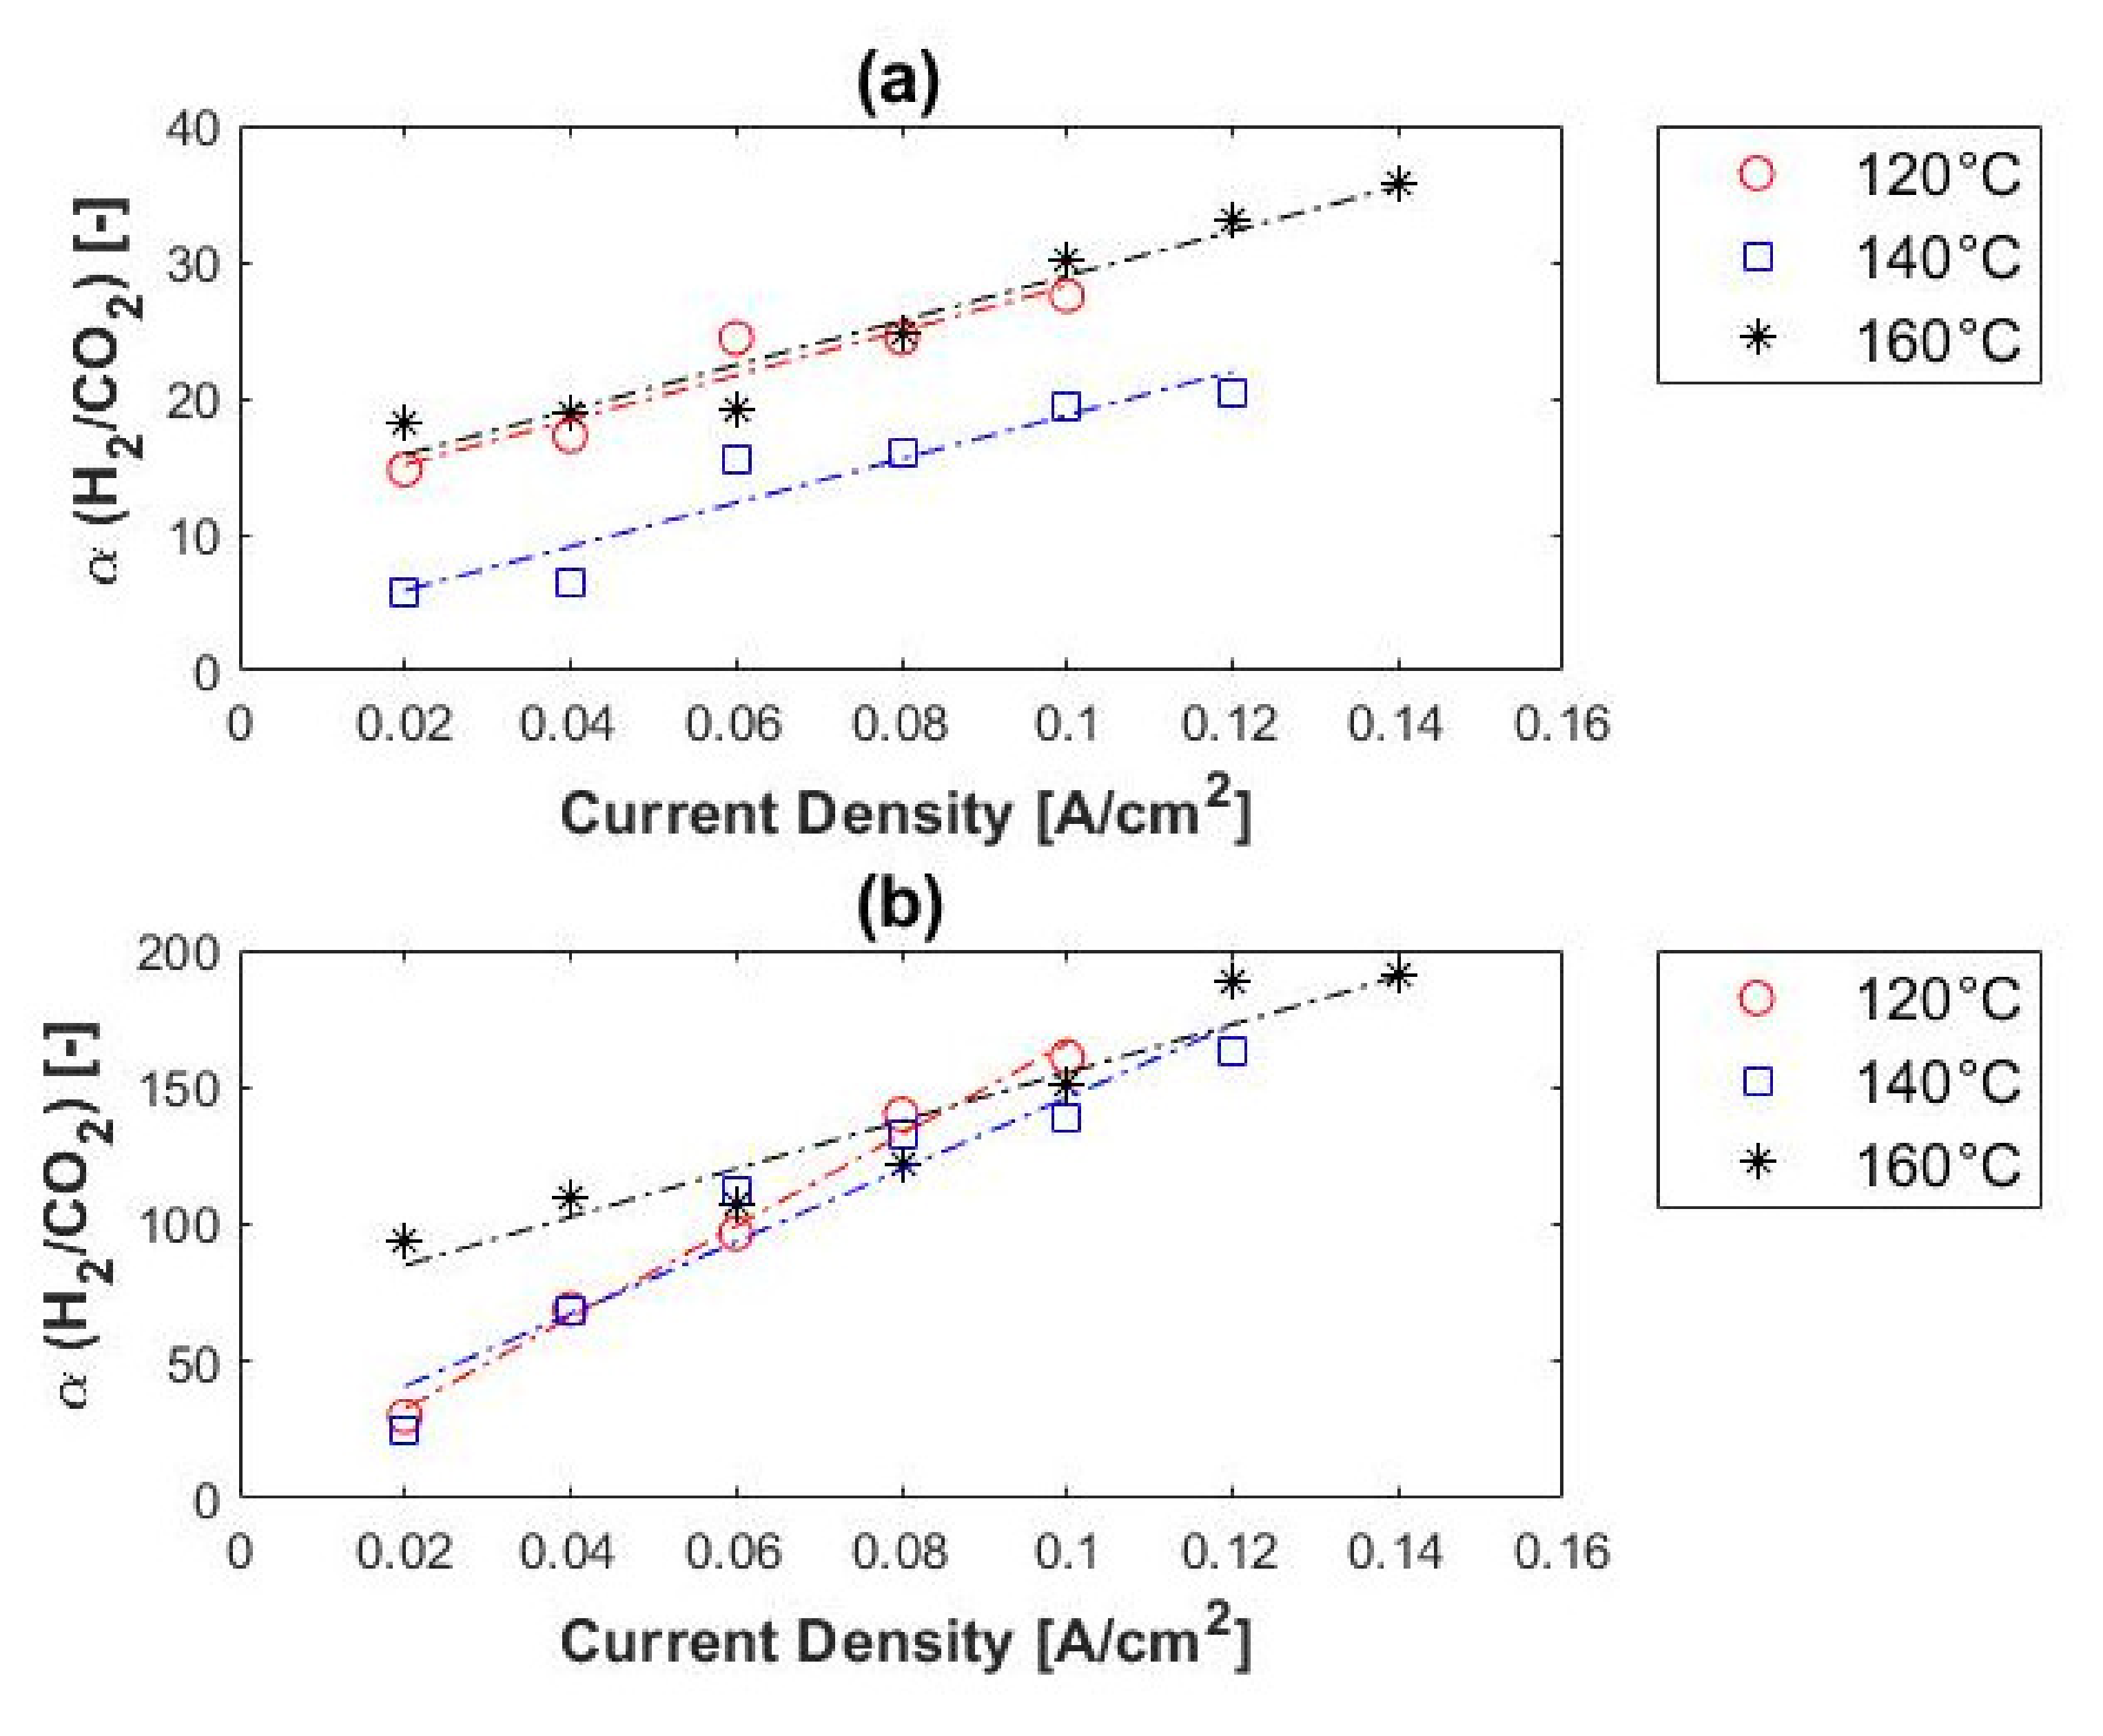
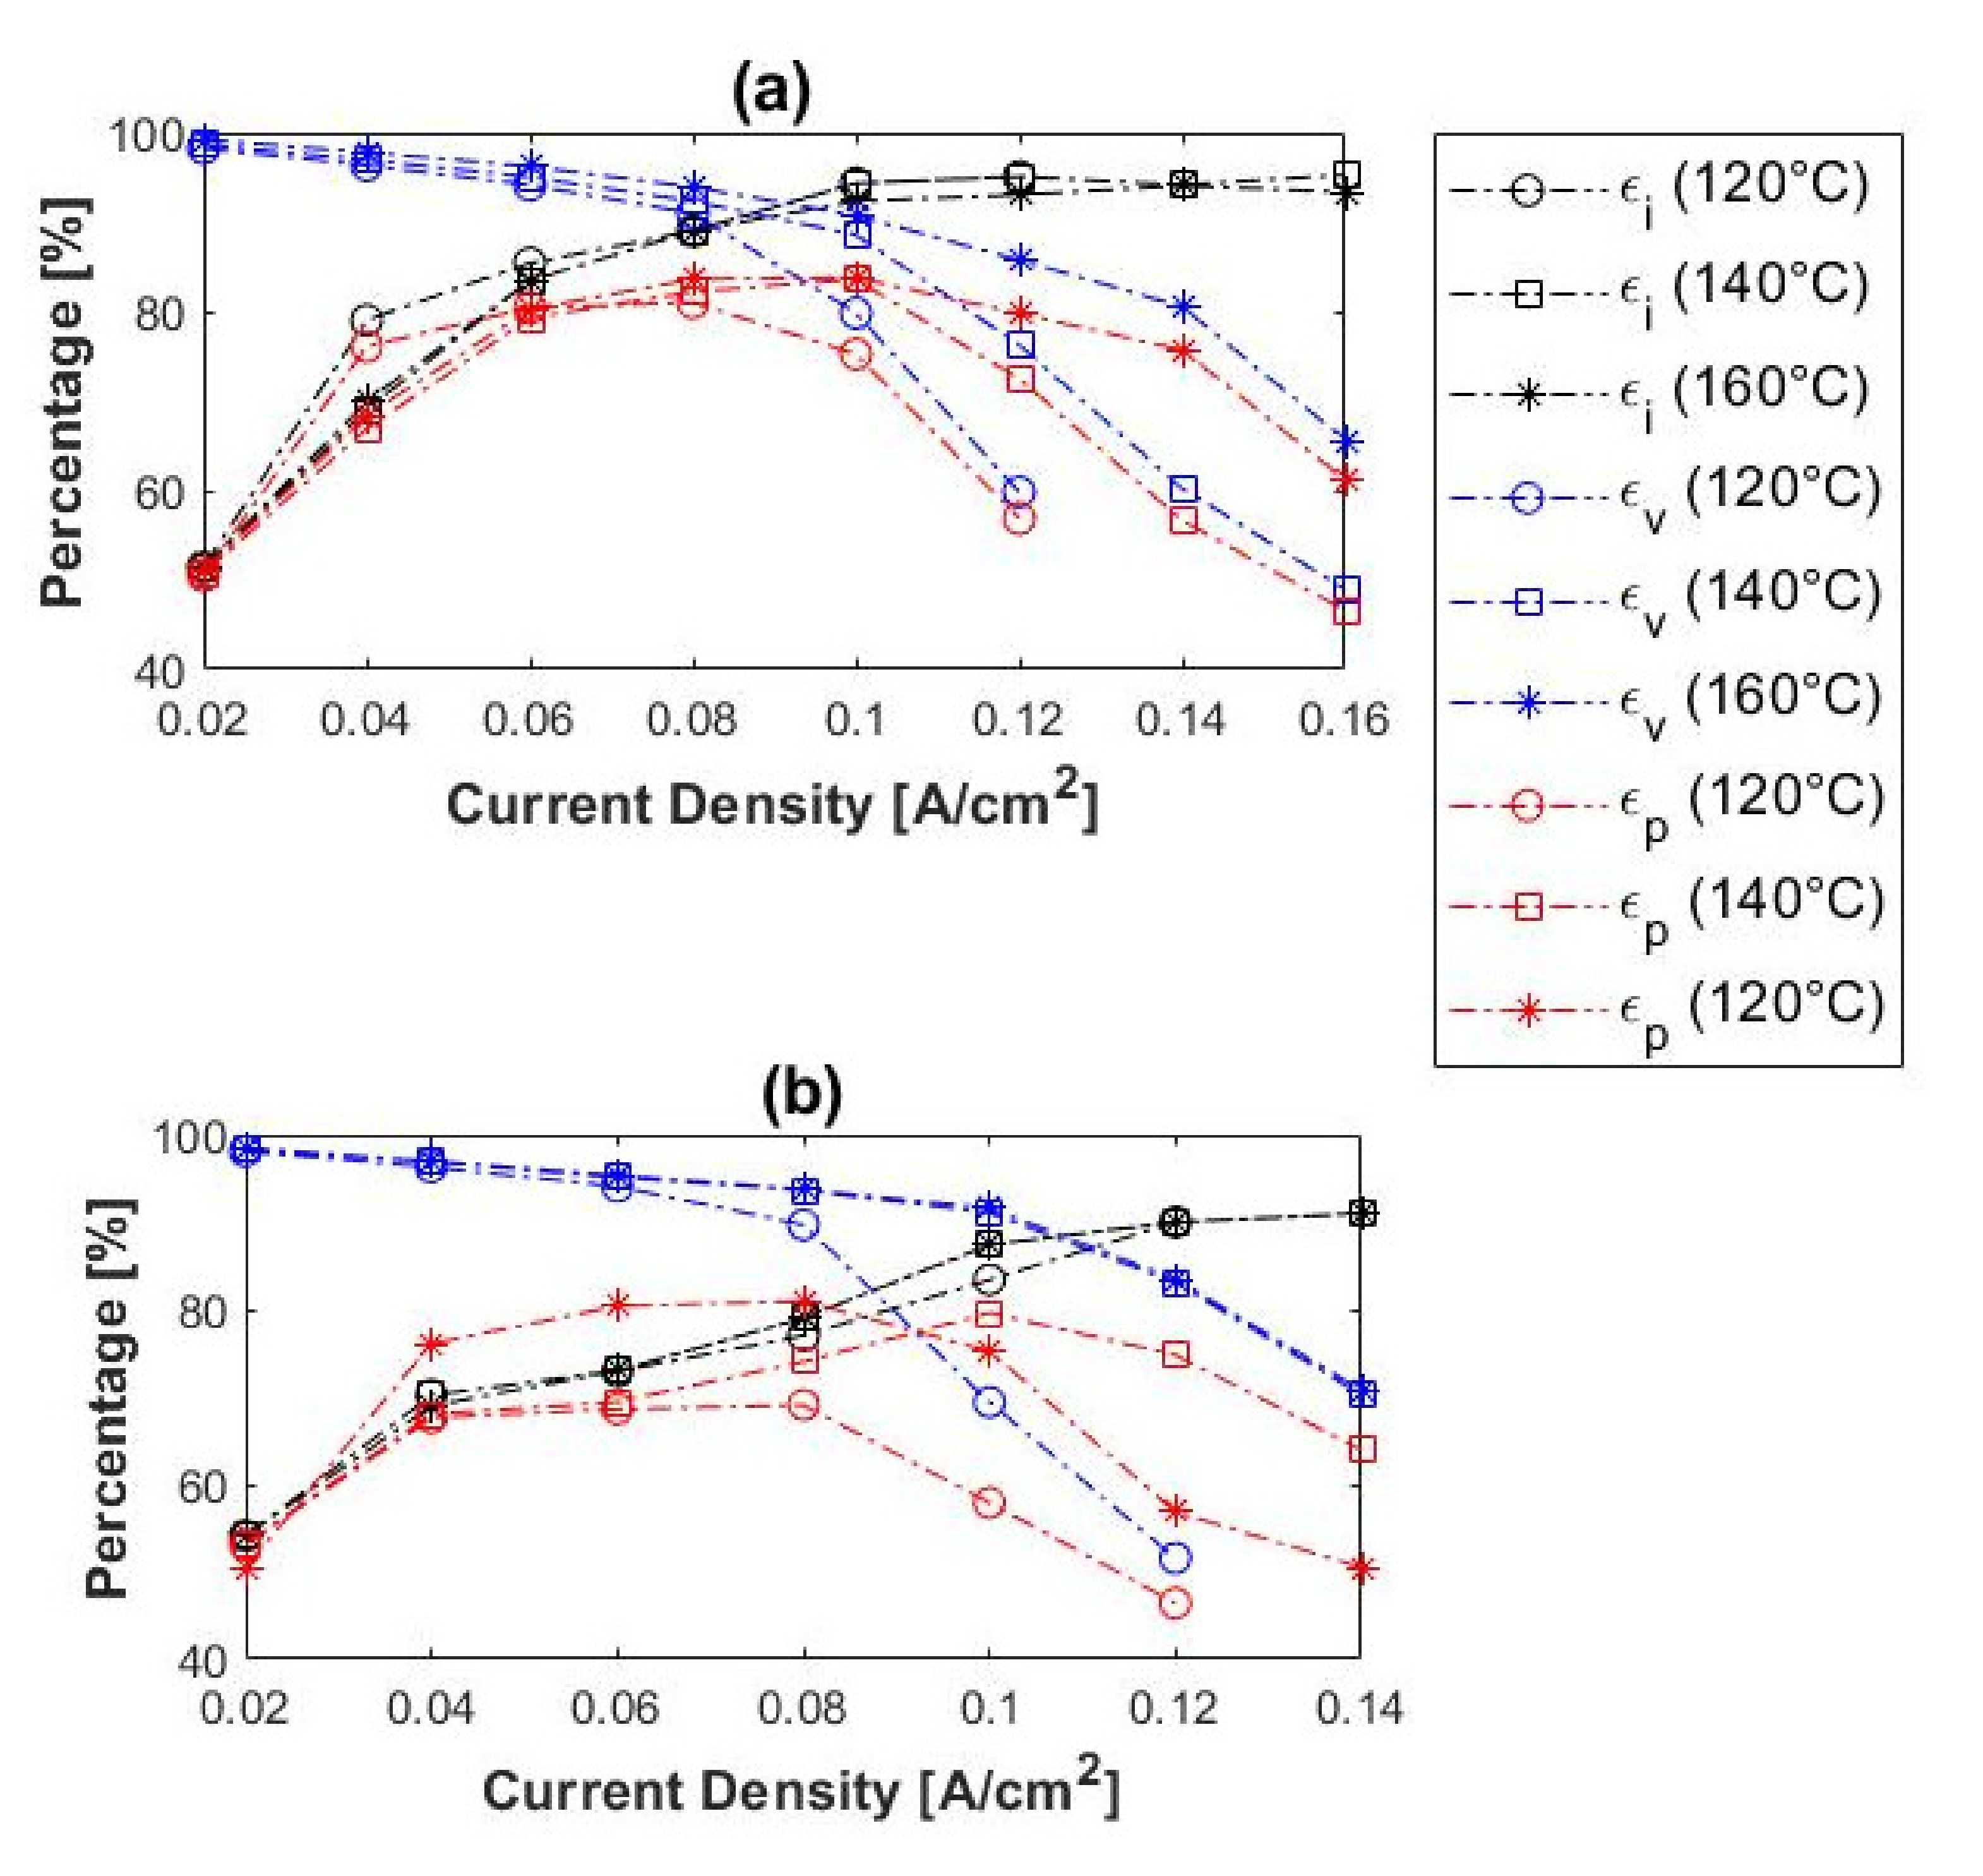
4.3. Hydrogen Separation from H2/CO2 Gas Mixtures

The voltage–current characteristics of electrochemical hydrogen separation from the H2/CO2 gas mixtures, as a function of temperature, are shown in Figure 11. The curved profile of the polarization curves suggests that the electrode reaction dominates the overpotential. Here the cell showed significantly larger voltages than in the case of the performance with pure hydrogen. For the 10% CO2 (balance hydrogen) separation mixture, the maximum achievable current density at 160 °C was 0.16 A cm−2. This is a large decline from the 0.4 A cm−2 that was reached with pure hydrogen. Furthermore, at 120 and 140 °C, the limiting current densities decreased from 0.28 and 0.32 A cm−2, obtained with pure hydrogen, to 0.12 and 0.16 A cm−2, respectively. For the 50% CO2 inlet stream, the limiting current densities were 0.14, 0.14, and 0.12 A cm−2, respectively at 160, 140, and 120 °C. A slight performance decline, in the order of 0.02 A cm−2, was seen when the CO2 concentration was changed from 10% (Figure 11a) to 50% (Figure 11b).
The change in the overpotential characteristics can be explained by the hydrogen to impurity ratio of the inlet stream. Since the impurity (CO2) makes up a large portion of the gas mixture, many of the active sites are covered by impurities and, consequently, the reaction sites are ‘blocked’ by the impurities. This was also observed with the H2/CH4 gas mixtures. However, the performance decay was more severe in the presence of CO2 than with CH4, possibly caused by the electrocatalytic reduction/hydrogenation of CO2. Previous studies, where similar experiments were performed, reported the reduction of CO2 to CO by the reverse water–gas shift (RWGS) [28,35,53]:
H 2 + C O 2 C O + H 2 O
Here, the adsorbed hydrogen reduces CO2 to CO on the electrocatalyst surface [54,55]. The formed CO strongly bind to the Pt sites, consequently causing the Pt to be poisoned [56]. Therefore, Pt–H binding is hindered [54,57]; hence, a voltage increase result.
Theoretically, the electrode tolerance to CO should increase with temperature, which is confirmed by the present work; the performance increased when the temperature was raised (Figure 11), with lower voltages seen at higher temperatures. However, no CO was detected with the in-line GC, situated downstream from the cathode outlet. Rather, trace amounts of methane were found on ppm level. This could be explained by the methanation of CO2 to CH4, believed to be driven by the presence of Co in the electrocatalyst. Co is known to have a high activity, similar to that of Ni [58,59] (Activity: Ru > Fe > Ni > Co > Mo [60]) and high selectivity (Selectivity: Ni > Co > Fe > Ru [60]) towards the methanation of CO2. The possible reaction network for the reduction of CO2 can be described by Equation (6) together with Equations (7) and (8) [61,62].
4 H 2 + C O 2 C H 4 + 2 H 2 O
3 H 2 + C O C H 4 + H 2 O
Only one article was found on the electrochemical reduction of CO2 in an electrolytic cell based on polybenzimidazole (PBI) membranes doped with phosphoric acid (PA) [63]. Here, the electrocatalytic reduction of CO2 on Pt-Mo/C and Pt/C was examined and compared [63]. Both CO and CH4 were detected as CO2 reduction products, although the Mo addition into Pt in the Pt-Mo/C electrocatalyst significantly promoted CO formation, whilst the formation of CH4 was suppressed. They confirmed that CO2 was reduced firstly to CO by adsorbed hydrogen, and hereafter further reduced to CH4 by more adsorbed hydrogen.
Here, as was the case with the methane-containing mixtures, the OCV is not zero, explained by the difference in partial pressures. See Table 4. The OCVs obtained were much higher than those obtained with the H2/CH4 mixtures at the same conditions. This might be due to the fact that CH4 only acts as a hydrogen diluent [64], whilst CO2 actually affects the electrode and its performance [47].
In terms of hydrogen purity, 98–99.5% was reached with 10% CO2 in the feed and 96–99.5% with 50% CO2 in the feed stream. Therefore, a hydrogen purity of up to 99.5% can be reached with a H2/CO2 ratio of 1:1. No correlation was found between the hydrogen purity of the permeate and the temperature, whereas the hydrogen purity did increase with current density. Figure 12 shows the hydrogen selectivity values in terms of feed concentration. Reasonable separation was achieved from the 1:1 H2/CO2 mixture, with selectivities of up to ~200. This is, however, much lower than the hydrogen selectivity values obtained with the H2/CH4 gas mixtures (up to ~22,000). A similar trend was observed for both the H2/CH4 and H2/CO2 mixtures in terms of current density and impurity concentration; the hydrogen selectivity increased with current density and impurity concentration. However, the trend of the selectivity in terms of temperature differed from that of the H2/CH4 mixtures. The selectivity did not increase with a decrease in temperature; the best selectivity was achieved at 160 °C. This can be explained by the catalyst poisoning that occurs (CO poisoning)—catalyst deactivation is alleviated at higher temperatures.
Compared with other membrane technologies, the hydrogen selectivities here were lower than achieved with dense metallic and dense ceramic membranes (>1000), but higher than those obtained with microporous ceramic, porous carbon and dense polymeric membranes [18,25].
The current, voltage, and power efficiencies of the H2/CO2 gas mixtures are given in Figure 13. In general, the current efficiencies increased with current density. The lower current efficiencies at lower current densities can be attributed to hydrogen cross-over. The current efficiencies at lower current densities were lower than in the case of pure hydrogen (~70% at 0.02 A cm−2). In terms of voltage efficiencies, an increase was observed when the temperature was increased, but a decrease with an increase in current density. A similar trend was seen for both the pure hydrogen and the hydrogen–methane mixtures.
The power efficiencies showed a maximum value of 0.08–0.10 A cm−2 for both the 10 and 50% CO2 inlet mixtures. This depicts the optimum current density for hydrogen separation from the H2/CO2 mixtures at the respective operating conditions with regards to the power consumption. Similar to the results recorded for the methane-containing mixtures, the power efficiencies here decreased with an increase in carbon dioxide concentration and increased with temperature. Moreover, nearly Faradic flow rates were achieved in all experiments performed.

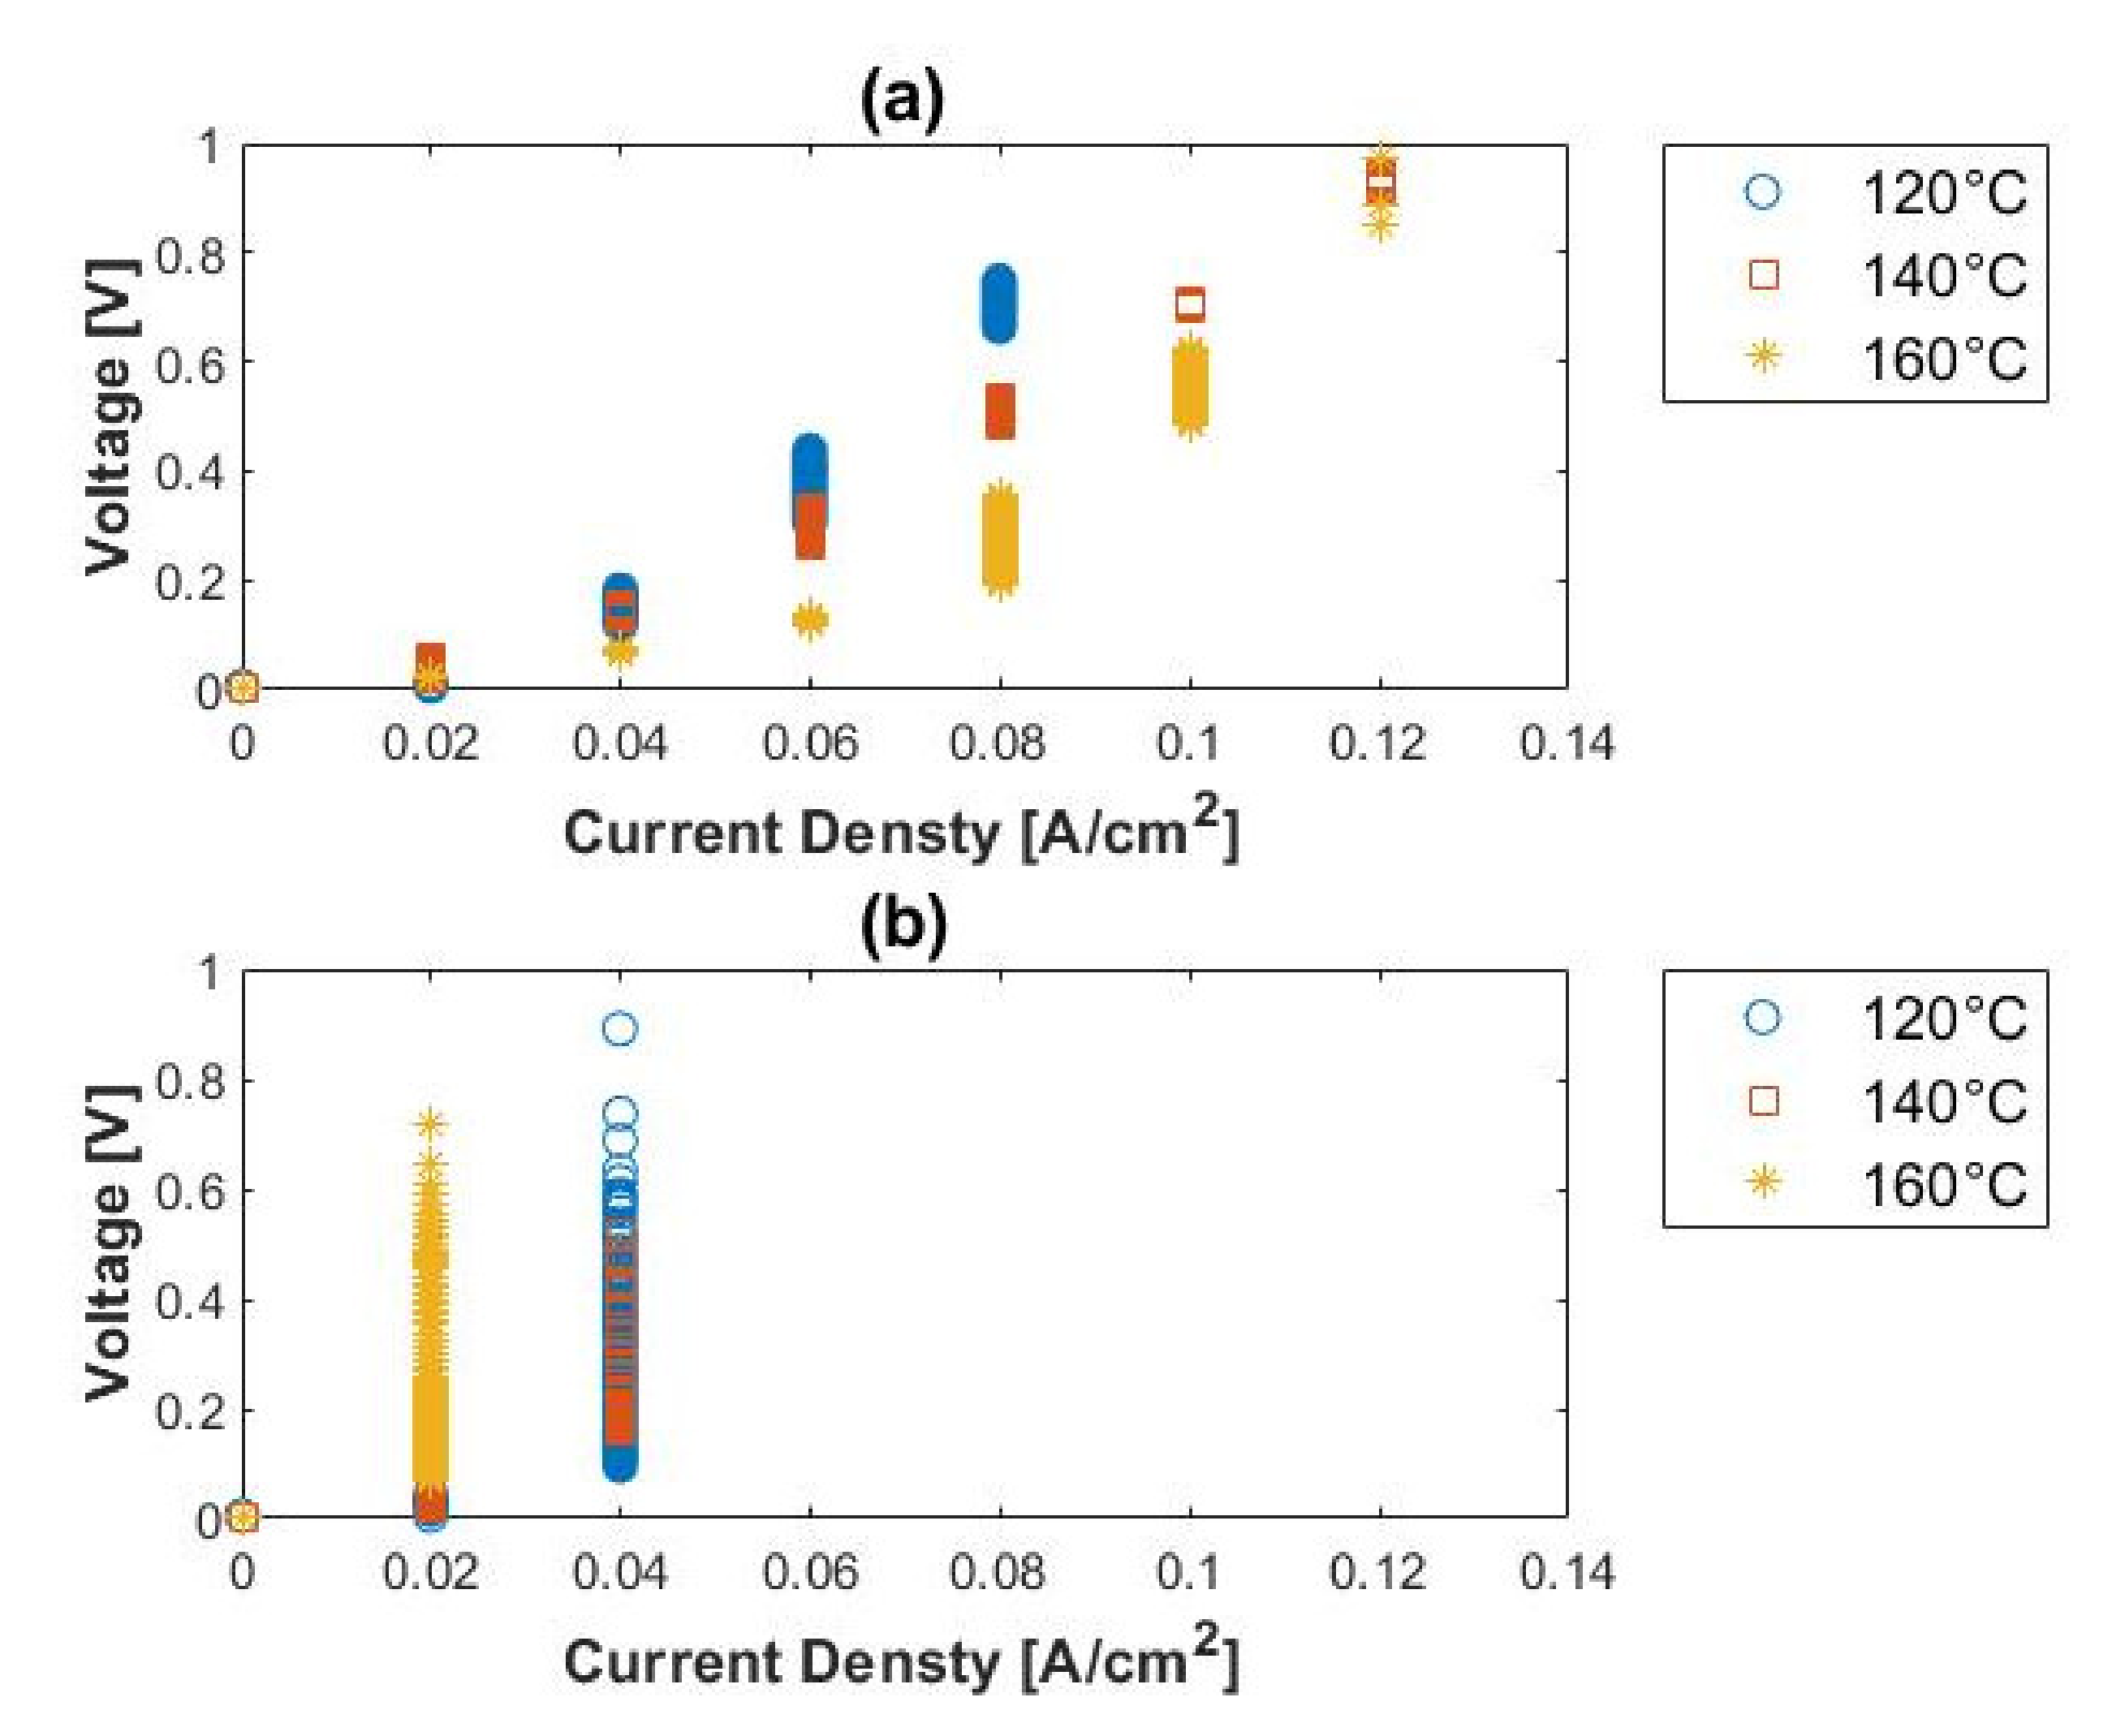
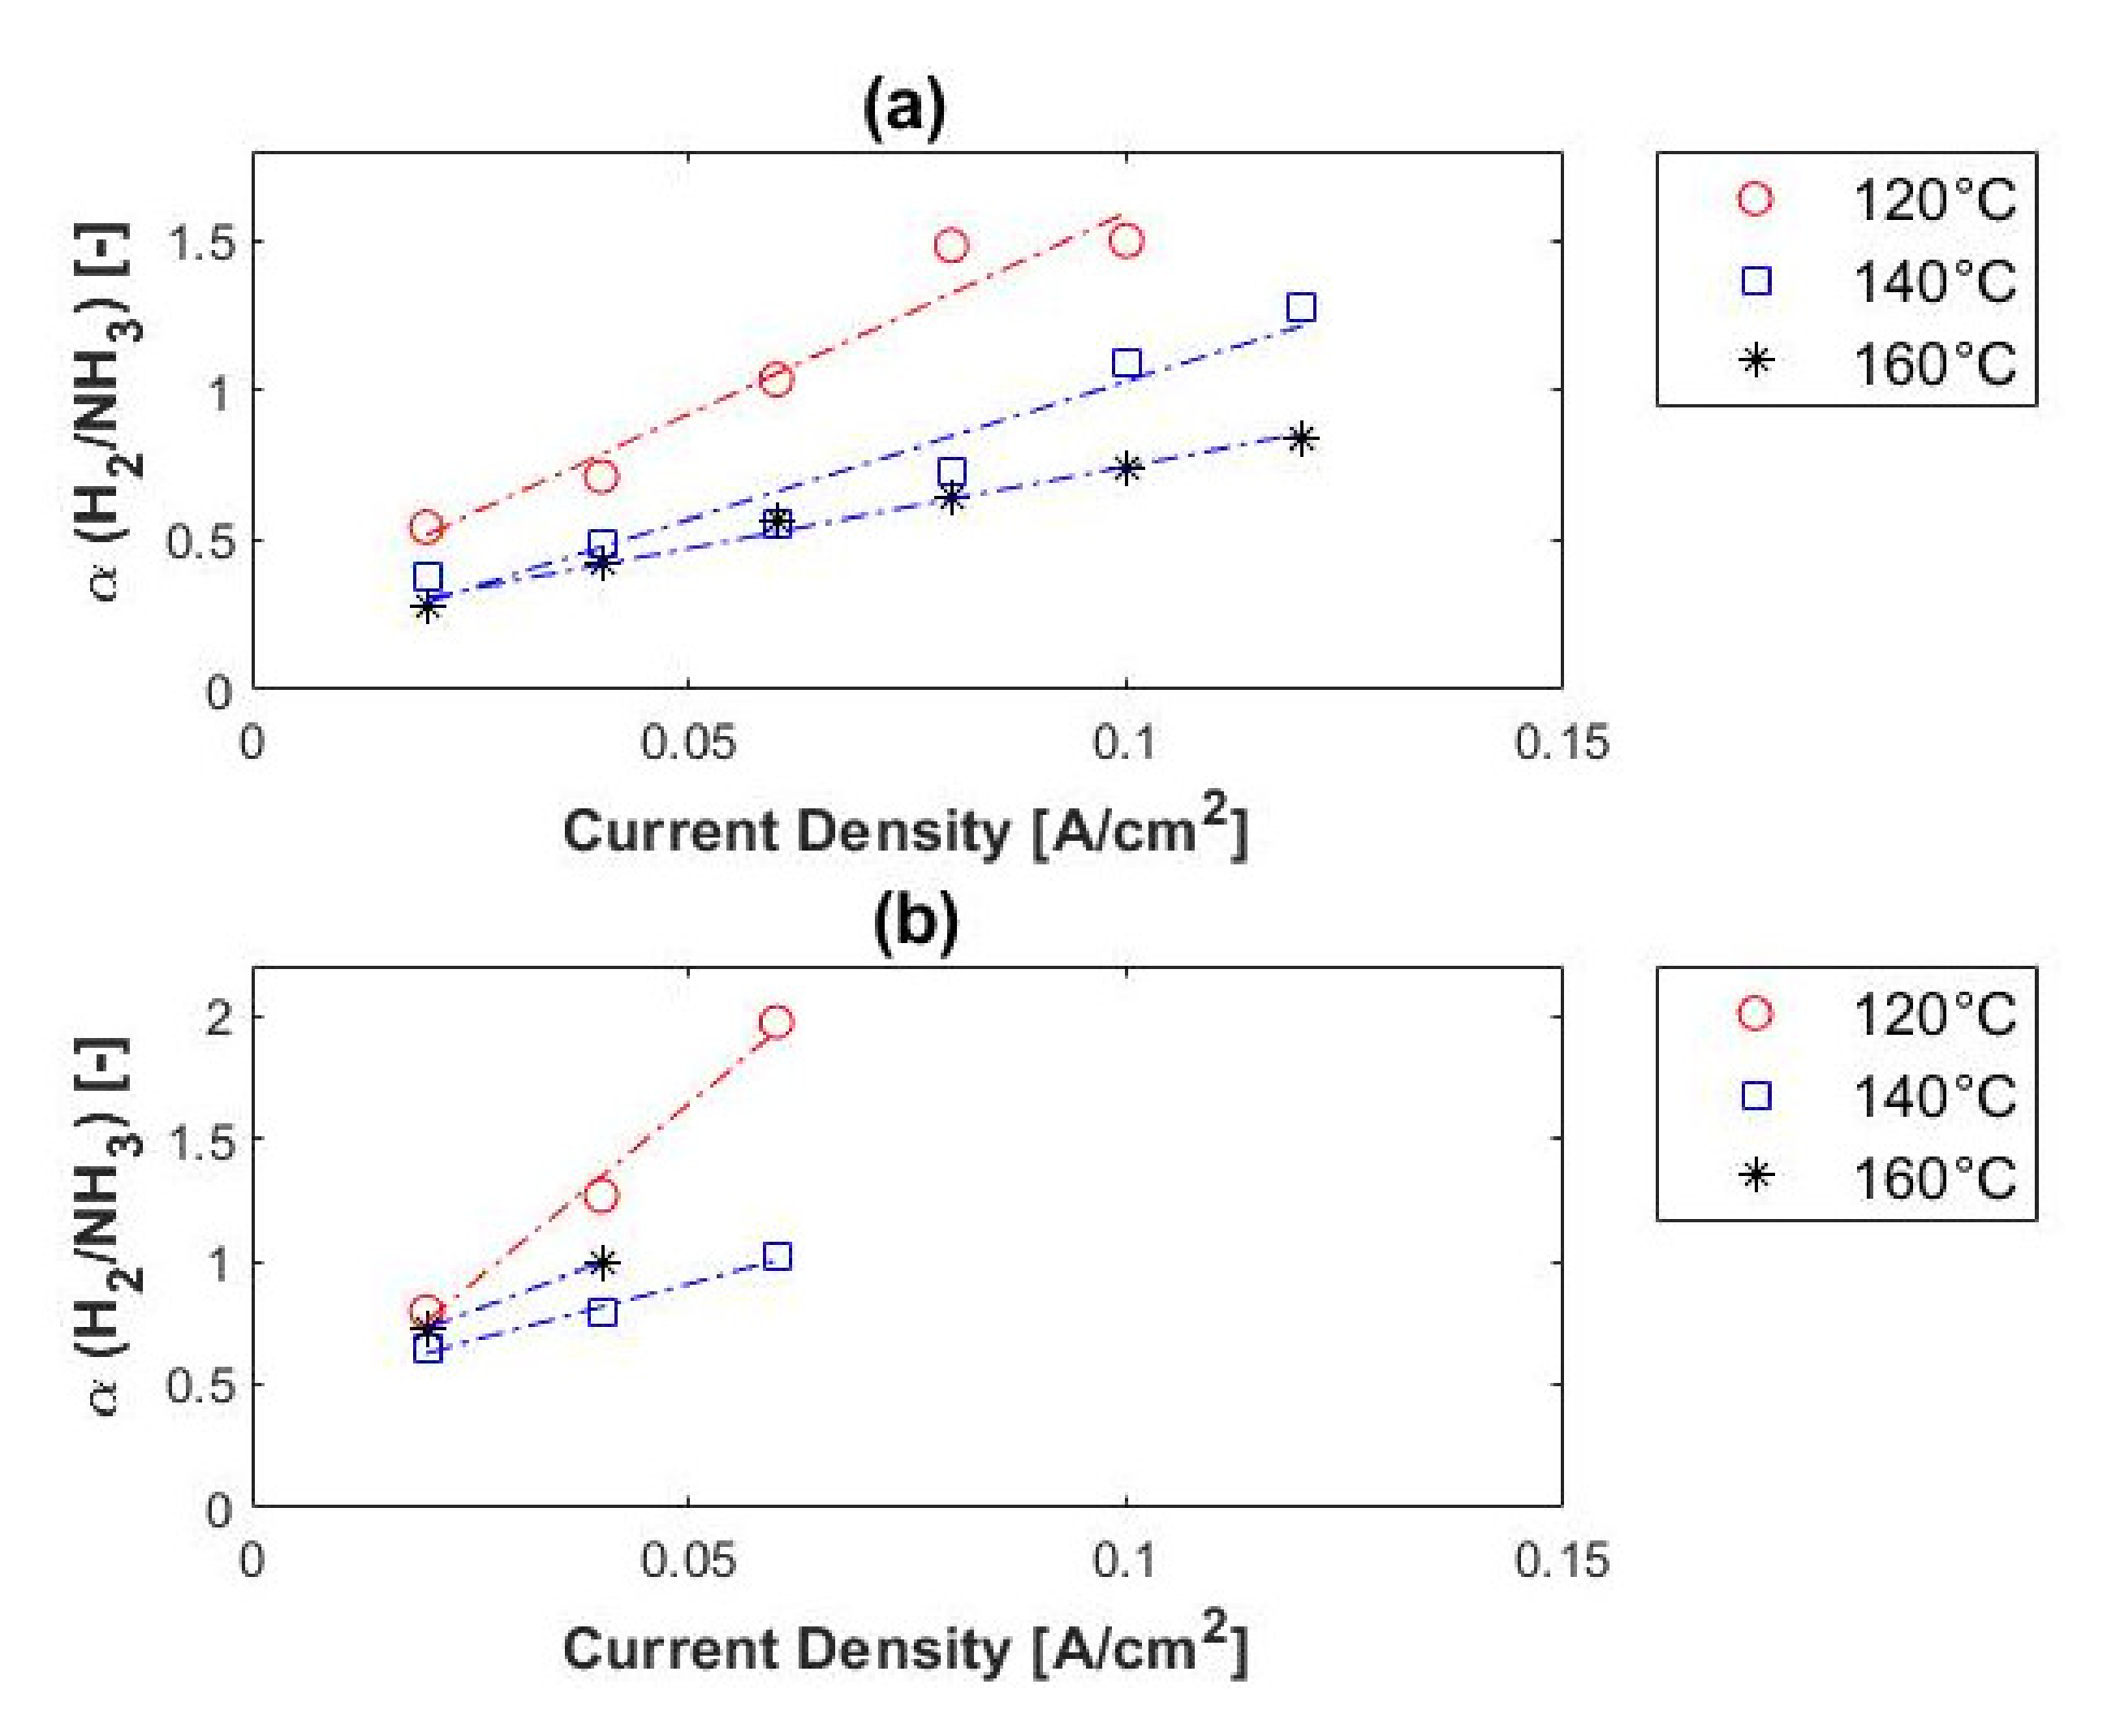
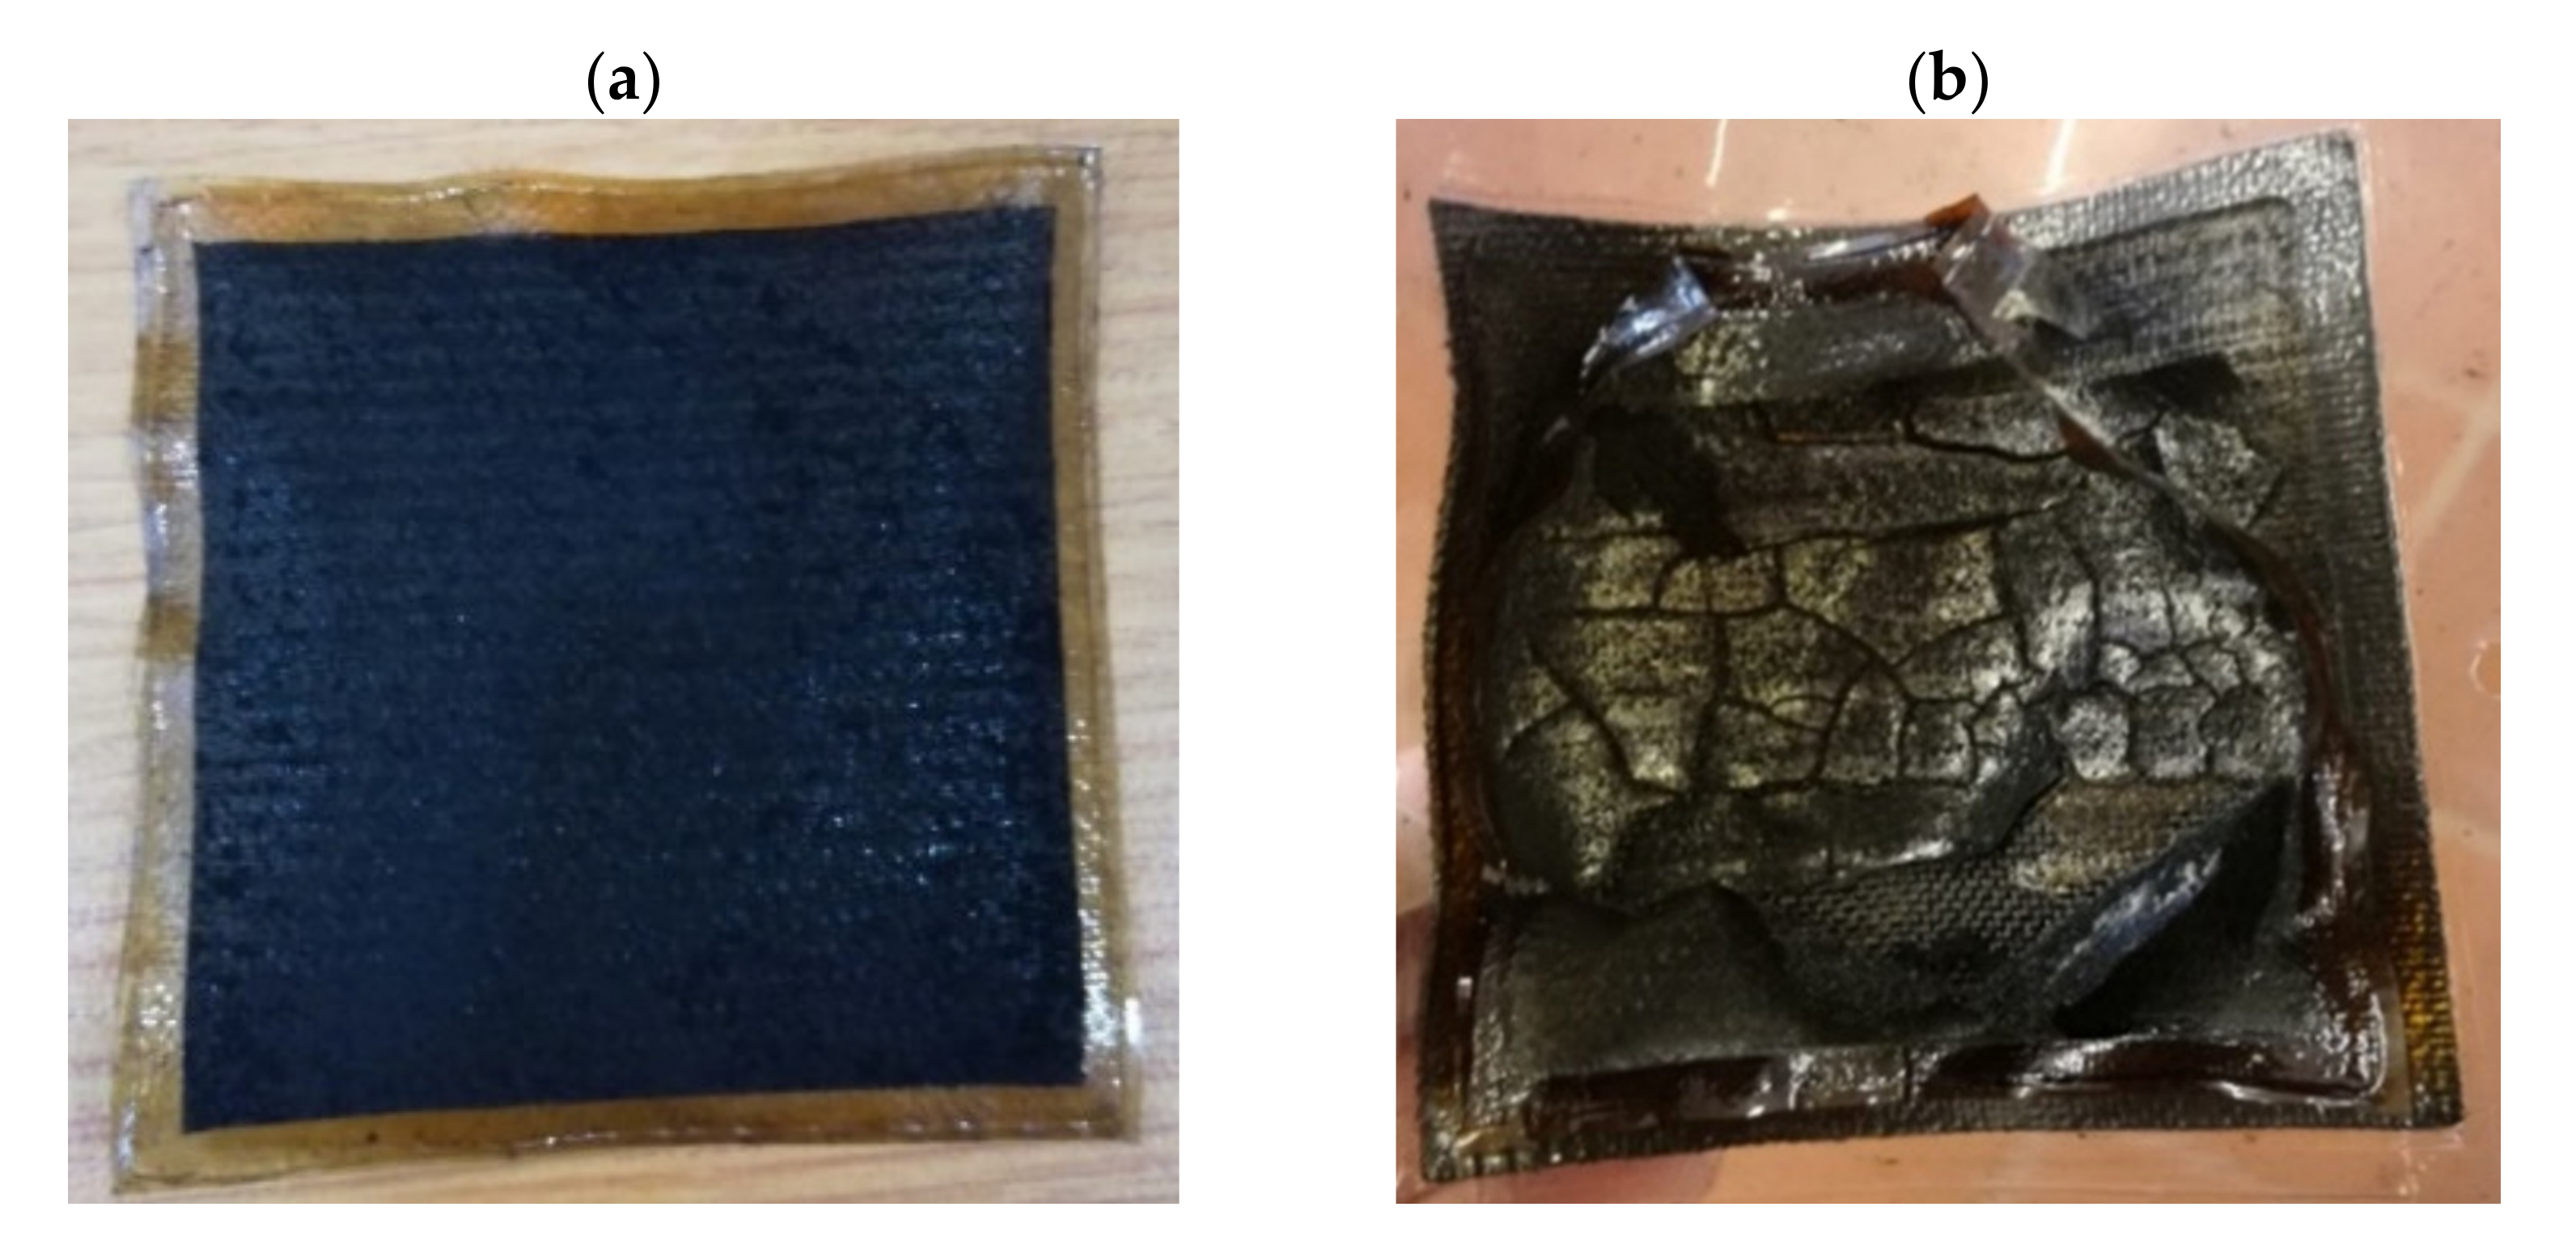
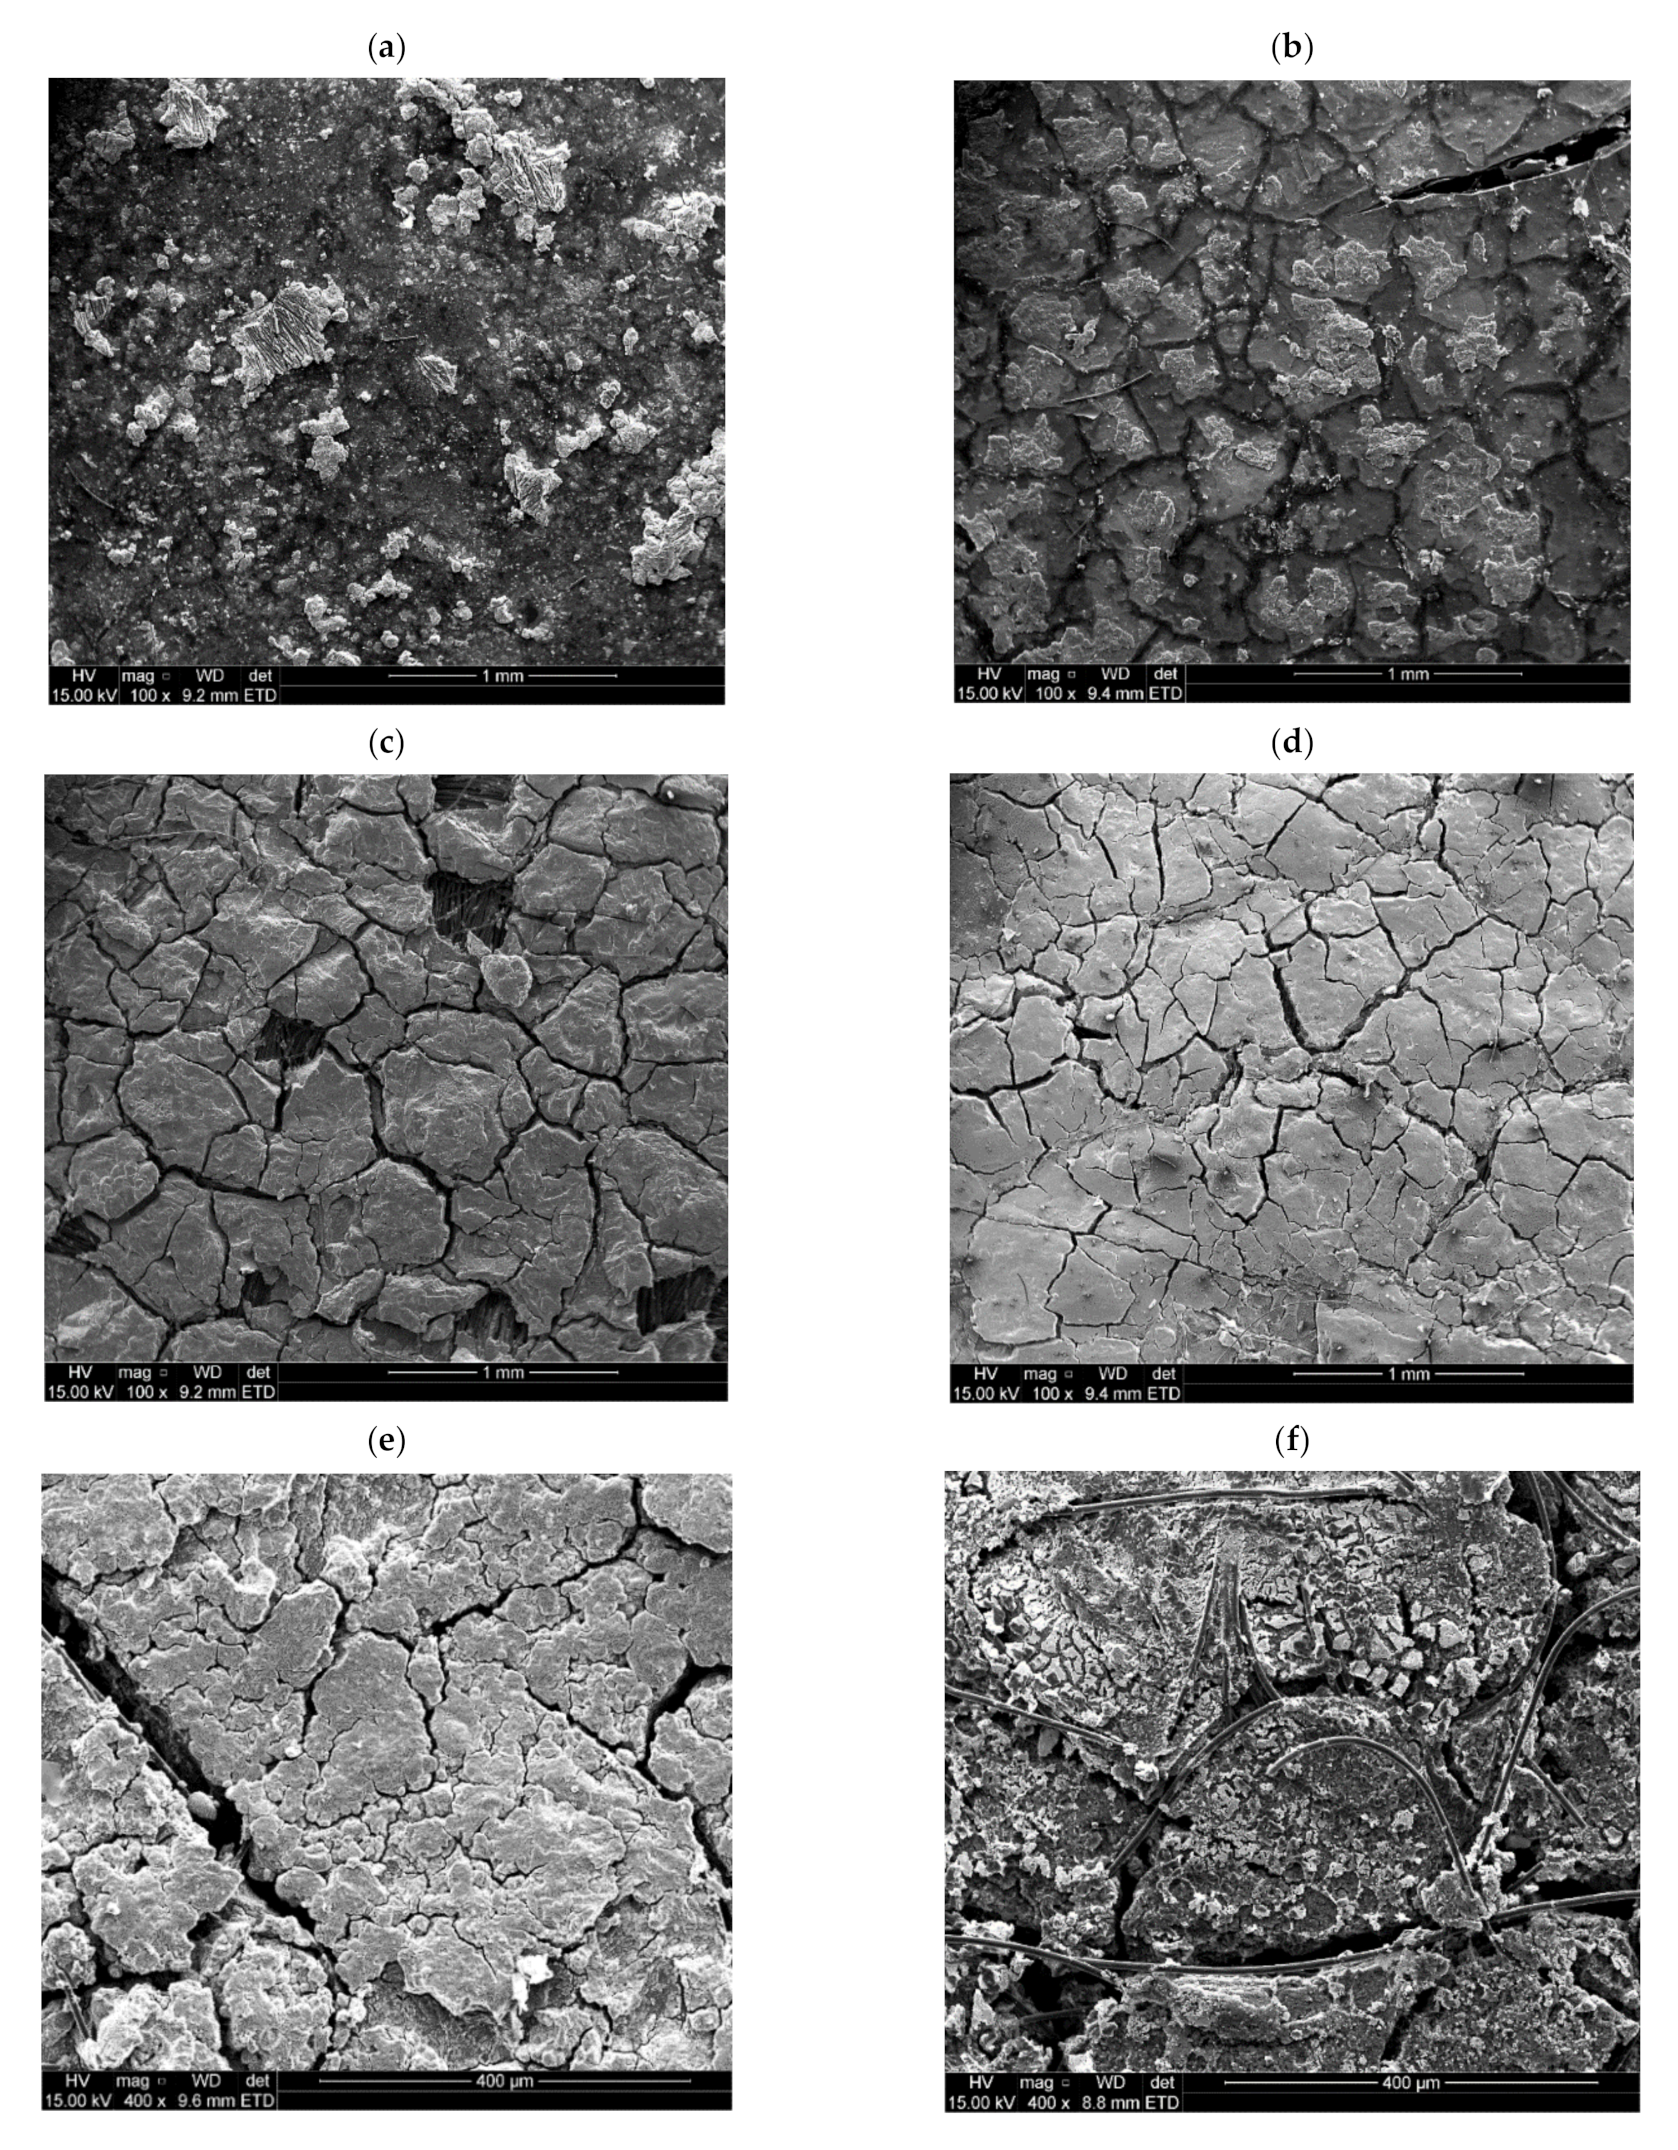
4.4. Hydrogen Separation from H2/NH3 Gas Mixtures

The voltage–current characteristic of the H2/NH3 inlet mixtures are presented in Figure 14. The cell performance is severely impaired in the presence of ammonia, even in very low concentrations (ppm range), when compared to the performance with pure hydrogen. The limiting current densities achieved were 0.10, 0.12, and 0.12 A cm−2 for 120, 140, and 160 °C, respectively, when 1500 ppm ammonia was present. When the cell was operated in the presence of 3000 ppm ammonia, the cell performance degraded completely, even with an increase in temperature. The limiting current densities in the presence of 3000 ppm NH3 were 0.04, 0.04, and 0.02 A cm−2 for 120, 140, and 160 °C, respectively. The limiting current densities seemingly indicate that the performance of the cell decreases as the temperature is raised. A reverse trend is, however, seen in the presence of 1500 ppm NH3. The results indicated that the performance of the cell deteriorates in the presence of ammonia (continuous exposure to ammonia) rather than with temperature, as observed in Figure 14b.
The selectivity graphs presented in Figure 15 show that very poor selectivities (<2) are achieved for feed streams containing both 1500 and 3000 ppm ammonia. Ammonia and hydrogen seem to compete with each other. In the cases where the selectivity values < 1, ammonia transport through the membrane is favored, whereas hydrogen is favored at selectivities > 1. Since hydrogen is split into its constituents, more specifically, protonated to H+ ions, ammonia protonation results:
N H 3 + H + N H 4 +
NH3+ is then also transported through the membrane.
The anode reaction can be depicted as follows:
N H 3 + 2 H 2 N H 4 + + H +
At lower current densities, however, the reaction seems to be the following, where ammonia is favored and not hydrogen:
2 N H 3 + H 2 2 N H 4 +
The effect of ammonia on the performance of LT-FCs has been determined, and reported in literature [65,66,67]. Some sources even report a decrease in FC catalytic activity when only 1 ppm NH3 is present, over a short one-week period. Their tests were performed with Nafion® (Wilmington, DE, USA) membranes. The loss in activity can be attributed to the alkaline nature of ammonia. The formed NH4+ ions (Equation (11)) react with the sulphonic groups (SO3), which are characteristic of Nafion membranes. Consequently, the water content and the conductivity of the membrane decreases, resulting in reduced FC performances [66,67]. Likewise, as for the sulphonic groups of the Nafion® membranes, so too for PA used in HT membranes (usually PBI-based membranes), which results in phosphate groups (PO43−). The performance losses observed in Figure 15 are therefore attributed to the alkaline nature of ammonia, reacting with the PA on the membrane. More specifically the formed NH4+ ions react with the PO43− groups, consequently resulting in a loss of conductivity. Similar to the results reported here, Vassiliev et al. [68] reports on the possible chemical incompatibility between the other organic fuels and the electrolyte in HT membranes doped with PA. More specifically, it was concluded that the probable reasons were that the catalyst deactivation and/or acid depletion within the electrode occurred.
Results of studies carried out with Nafion membranes to determine the effect of ammonia on the performance of LT-FCs have revealed that although substantial deactivation effects were observed in the presence of ammonia in the feed gas, the cell performance was recoverable, with time (in the order of days), when neat hydrogen is introduced to the anode side [67]. In the present study, however, this did not apply—the membranes were deactivated beyond recovery; for example, membrane cracks occurred (see Figure 16). Scanning electron microscopy (SEM) images of the microscopic morphological changes on the surface of a membrane and GDLs are also shown in Figure 17. Small cracks are even visible at the microscopic level.

4.5. Possible Future Work

As for a possible future work, one can consider using hydrocarbon-based PEM membranes [69], PFSA-based materials with various modifications to address water management challenges [70], as well as novel phosphonated materials [40].

5. Conclusions

For hydrogen feed, the voltage–current characteristics showed that the ohmic losses dominated the overpotential. From this, it was concluded that the membrane- and contact resistances of the cell play a major role in the efficacy of the EHS, and should, therefore, be minimised. Overall, the general performance of the cell increased with minor temperature changes (20 °C). Moreover, the current efficiencies for the pure hydrogen inlet ranged from ~70% to tlevels >95%. The current efficiency increased with current density, whilst the voltage efficiency increased with temperature and decreased with current density. This resulted in higher power efficiencies as the temperature was raised. The optimal current density with regards to power consumption was ~0.16 A cm−2. The highest limiting current density was 0.4 A cm−2, which is well below a current density of practical interest, 1 A cm−2.
Results revealed that hydrogen can be effectively recovered from H2/CH4 mixtures, yielding a hydrogen purity of >99.9%. From the polarization curves and selectivity graphs of the H2/CH4 mixtures, it was evident that the selectivity decreases with temperature, whilst the overall cell efficiency (power efficiency) increases, therefore the selectivity and cell efficiency behave antagonistically towards another. The highest selectivity achieved with H2/CH4 was ca. 22,000. Similar trends with regards to current, voltage, and power efficiencies were visible when compared with trends of the pure hydrogen experiments. Furthermore, performance of the cell was seen to decrease with an increase in methane concentration. Therefore, the cell performance is sensitive to the partial pressure of the hydrogen concentration in the feed.
In the H2/CO2 experiments, the Pt/Co catalyst is severely influenced by CO2, even at elevated temperatures. Hydrogen purities of 98–99.5% can be achieved for feed streams containing 10% CO2 and 96–99.5% for in the feed streams containing 50% CO2. Overall, poor selectivities (≤200) were reached for the CO2-containing streams, with poor overall cell performances due to catalyst deactivation caused by CO2 reduction. Similar to the H2/CH4 mixtures, the power efficiencies decreased with an increase in CO2 concentration and increased with temperature. The power efficiencies were, however, lower than that obtained by pure hydrogen and the CH4-containing mixtures.
Ammonia has a noticeable effect on the membrane—ammonia reacts with the acid embedded in the membrane. Even at very low concentrations (ppm) the membranes were affected by ammonia beyond recovery and, hence, unsuitable for use in electrochemical hydrogen separation. However, regarding the proton transport through the membrane, ammonia and hydrogen competed; ammonia transport was favored at low current densities and hydrogen transport was favored at higher current densities. The formation of NH4+ demonstrates the possibility of electrochemical transport/pumping and compression of ammonia with a PEM. In future research, alternative anion exchange membranes could be considered to possibly facilitate this reaction.
In terms of the hydrogen selectivity, power efficiencies, and the effects on the cell components, the performance of the cell based on the different gas mixtures were in the order: H2/CH4 > H2/CO2 > H2/NH3.

Author Contributions

L.V.: Conceptualization, investigation, data curation, writing—original draft, visualization and project administration. H.W.J.P.N.: supervision, writing—review and editing. D.G.B.: conceptualization, resources, supervision, writing—review and editing and funding acquisition. All authors have read and agreed to the published version of the manuscript.

Funding

This work was supported by HySA Infrastructure (via KP5 program) at the North-West University, Potchefstroom, South Africa.

Institutional Review Board Statement

Not applicable.

Informed Consent Statement

Not applicable.

Data Availability Statement

Not applicable.

Conflicts of Interest

The authors declare that they have no known competing financial interests or personal relationships that could have appeared to influence the work reported in this paper.

References

  1. Balat, M. Potential importance of hydrogen as a future solution to environmental and transportation problems. Int. J. Hydrogen Energy 2008, 33, 4013–4029. [Google Scholar] [CrossRef]
  2. Abe, J.; Popoola, A.; Ajenifuja, E.; Popoola, O. Hydrogen energy, economy and storage: Review and recommendation. Int. J. Hydrogen Energy 2019, 44, 15072–15086. [Google Scholar] [CrossRef]
  3. El-Shafie, M.; Kambara, S.; Hayakawa, Y. Hydrogen Production Technologies Overview. J. Power Energy Eng. 2019, 7, 107–154. [Google Scholar] [CrossRef] [Green Version]
  4. Rusman, N.; Dahari, M. A review on the current progress of metal hydrides material for solid-state hydrogen storage applications. Int. J. Hydrogen Energy 2016, 41, 12108–12126. [Google Scholar] [CrossRef]
  5. Chapman, A.; Itaoka, K.; Hirose, K.; Davidson, F.T.; Nagasawa, K.; Lloyd, A.C.; Webber, M.E.; Kurban, Z.; Managi, S.; Tamaki, T.; et al. A review of four case studies assessing the potential for hydrogen penetration of the future energy system. Int. J. Hydrogen Energy 2019, 44, 6371–6382. [Google Scholar] [CrossRef]
  6. The Paris Agreement | UNFCCC. Available online: https://unfccc.int/process-and-meetings/the-paris-agreement/the-paris-agreement (accessed on 23 January 2020).
  7. Holladay, J.D.; Wang, Y.; Jones, E. Review of Developments in Portable Hydrogen Production Using Microreactor Technology. Chem. Rev. 2004, 104, 4767–4790. [Google Scholar] [CrossRef] [PubMed]
  8. SAE International-Hydrogen Fuel Quality for Fuel Cell Vehicles: J2719. 2015. Available online: https://www.sae.org/standards/content/j2719_201109/ (accessed on 23 January 2020).
  9. Thomassen, M.; Sheridan, E.; Kvello, J. Electrochemical hydrogen separation and compression using polybenzimidazole (PBI) fuel cell technology. J. Nat. Gas Sci. Eng. 2010, 2, 229–234. [Google Scholar] [CrossRef]
  10. Acar, C.; Dincer, I. Comparative assessment of hydrogen production methods from renewable and non-renewable sources. Int. J. Hydrogen Energy 2014, 39, 1–12. [Google Scholar] [CrossRef]
  11. Dincer, I.; Acar, C. Review and evaluation of hydrogen production methods for better sustainability. Int. J. Hydrogen Energy 2015, 40, 11094–11111. [Google Scholar] [CrossRef]
  12. Baykara, S.Z. Hydrogen: A brief overview on its sources, production and environmental impact. Int. J. Hydrogen Energy 2018, 43, 10605–10614. [Google Scholar] [CrossRef]
  13. Perry, K.A.; Eisman, G.A.; Benicewicz, B.C. Electrochemical hydrogen pumping using a high-temperature polybenzimidazole (PBI) membrane. J. Power Sources 2008, 177, 478–484. [Google Scholar] [CrossRef]
  14. Chen, C.-Y.; Lai, W.-H.; Chen, Y.-K.; Su, S.-S. Characteristic studies of a PBI/H3PO4 high temperature membrane PEMFC under simulated reformate gases. Int. J. Hydrogen Energy 2014, 39, 13757–13762. [Google Scholar] [CrossRef]
  15. Lee, H.; Choi, H.; Choi, K.; Park, J.; Lee, T. Hydrogen separation using electrochemical method. J. Power Sources 2004, 132, 92–98. [Google Scholar] [CrossRef]
  16. Grande, C.A.; Lopes, F.V.S.; Ribeiro, A.M.; Loureiro, J.M.; Rodrigues, A.E. Adsorption of Off-Gases from Steam Methane Reforming (H2, CO2, CH4, CO and N2) on Activated Carbon. Sep. Sci. Technol. 2008, 43, 1338–1364. [Google Scholar] [CrossRef]
  17. Granite, E.J.; O’Brien, T. Review of novel methods for carbon dioxide separation from flue and fuel gases. Fuel Process. Technol. 2005, 86, 1423–1434. [Google Scholar] [CrossRef]
  18. Ockwig, N.W.; Nenoff, T.M. Membranes for Hydrogen Separation. Chem. Rev. 2007, 107, 4078–4110. [Google Scholar] [CrossRef]
  19. David, O.C. Membrane Technologies for Hydrogen and Carbon Monoxide Recovery from Residual Gas Streams; Universidad de Cantabria: Santander, Spain, 2012; pp. 1–183. [Google Scholar]
  20. Huang, C.; Ali, T. Analyses of one-step liquid hydrogen production from methane and landfill gas. J. Power Sources 2007, 173, 950–958. [Google Scholar] [CrossRef]
  21. Peters, T.; Stange, M.; Klette, H.; Bredesen, R. High pressure performance of thin Pd–23%Ag/stainless steel composite membranes in water gas shift gas mixtures; influence of dilution, mass transfer and surface effects on the hydrogen flux. J. Membr. Sci. 2008, 316, 119–127. [Google Scholar] [CrossRef]
  22. Liu, F.; Zhang, N. Strategy of Purifier Selection and Integration in Hydrogen Networks. Chem. Eng. Res. Des. 2004, 82, 1315–1330. [Google Scholar] [CrossRef]
  23. Liemberger, W.; Groß, M.; Miltner, M.; Harasek, M. Experimental analysis of membrane and pressure swing adsorption (PSA) for the hydrogen separation from natural gas. J. Clean. Prod. 2017, 167, 896–907. [Google Scholar] [CrossRef]
  24. Ravanchi, M.T.; Kaghazchi, T.; Kargari, A. Application of membrane separation processes in petrochemical industry: A review. Desalination 2009, 235, 199–244. [Google Scholar] [CrossRef]
  25. Adhikari, S.; Fernando, S. Hydrogen Membrane Separation Techniques. Ind. Eng. Chem. Res. 2006, 45, 875–881. [Google Scholar] [CrossRef]
  26. Wu, X.; Benziger, J.; He, G. Comparison of Pt and Pd catalysts for hydrogen pump separation from reformate. J. Power Sources 2012, 218, 424–434. [Google Scholar] [CrossRef]
  27. Sakai, T.; Matsumoto, H.; Kudo, T.; Yamamoto, R.; Niwa, E.; Okada, S.; Hashimoto, S.; Sasaki, K.; Ishihara, T. High performance of electroless-plated platinum electrode for electrochemical hydrogen pumps using strontium-zirconate-based proton conductors. Electrochim. Acta 2008, 53, 8172–8177. [Google Scholar] [CrossRef]
  28. Bouwman, P. Fundamental of Electrochemical Hydrogen Compression. In PEM Electrolysis for Hydrogen Production: Principles and Applications; Bessarabov, D., Wang, H., Li, H., Zhao, N., Eds.; CRC Press: Boca Raton, FL, USA, 2015; pp. 269–299. [Google Scholar]
  29. Grigoriev, S.; Shtatniy, I.; Millet, P.; Porembsky, V.; Fateev, V. Description and characterization of an electrochemical hydrogen compressor/concentrator based on solid polymer electrolyte technology. Int. J. Hydrogen Energy 2011, 36, 4148–4155. [Google Scholar] [CrossRef]
  30. Gardner, C.; Ternan, M. Electrochemical separation of hydrogen from reformate using PEM fuel cell technology. J. Power Sources 2007, 171, 835–841. [Google Scholar] [CrossRef]
  31. Kusoglu, A.; Tang, Y.; Lugo, M.; Karlsson, A.M.; Santare, M.H.; Cleghorn, S.; Johnson, W.B. Constitutive response and mechanical properties of PFSA membranes in liquid water. J. Power Sources 2010, 195, 483–492. [Google Scholar] [CrossRef] [Green Version]
  32. Haque, M.A.; Sulong, A.; Loh, K.; Majlan, E.H.; Husaini, T.; Rosli, R.E. Acid doped polybenzimidazoles based membrane electrode assembly for high temperature proton exchange membrane fuel cell: A review. Int. J. Hydrogen Energy 2017, 42, 9156–9179. [Google Scholar] [CrossRef]
  33. Huth, A.; Schaar, B.; Oekermann, T. A “proton pump” concept for the investigation of proton transport and anode kinetics in proton exchange membrane fuel cells. Electrochim. Acta 2009, 54, 2774–2780. [Google Scholar] [CrossRef]
  34. Kwon, K.; Park, J.O.; Yoo, D.Y.; Yi, J.S. Phosphoric acid distribution in the membrane electrode assembly of high temperature proton exchange membrane fuel cells. Electrochim. Acta 2009, 54, 6570–6575. [Google Scholar] [CrossRef]
  35. Araya, S.S.; Zhou, F.; Liso, V.; Sahlin, S.L.; Vang, J.R.; Thomas, S.; Gao, X.; Jeppesen, C.; Kær, S.K. A comprehensive review of PBI-based high temperature PEM fuel cells. Int. J. Hydrogen Energy 2016, 41, 21310–21344. [Google Scholar] [CrossRef]
  36. Alegre, C.; Álvarez-Manuel, L.; Mustata, R.; Valiño, L.; Lozano, A.; Barreras, F. Assessment of the durability of low-cost Al bipolar plates for High Temperature PEM fuel cells. Int. J. Hydrogen Energy 2019, 44, 12748–12759. [Google Scholar] [CrossRef]
  37. Kim, B.; Ma, S.; Jhong, H.-R.M.; Kenis, P.J. Influence of dilute feed and pH on electrochemical reduction of CO2 to CO on Ag in a continuous flow electrolyzer. Electrochim. Acta 2015, 166, 271–276. [Google Scholar] [CrossRef] [Green Version]
  38. Chippar, P.; Oh, K.; Kim, W.-G.; Ju, H. Numerical analysis of effects of gas crossover through membrane pinholes in high-temperature proton exchange membrane fuel cells. Int. J. Hydrogen Energy 2014, 39, 2863–2871. [Google Scholar] [CrossRef]
  39. Lee, K.-S.; Spendelow, J.S.; Choe, Y.-K.; Fujimoto, C.; Kim, Y.S. An operationally flexible fuel cell based on quaternary ammonium-biphosphate ion pairs. Nat. Energy 2016, 1, 16120. [Google Scholar] [CrossRef]
  40. Atanasov, V.; Lee, A.S.; Park, E.J.; Maurya, S.; Baca, E.D.; Fujimoto, C.; Hibbs, M.; Matanovic, I.; Kerres, J.; Kim, Y.S. Synergistically integrated phosphonated poly(pentafluorostyrene) for fuel cells. Nat. Mater. 2021, 20, 370–377. [Google Scholar] [CrossRef]
  41. Kim, Y.S. Polymer Electrolytes with High Ionic Concentration for Fuel Cells and Electrolyzers. ACS Appl. Polym. Mater. 2021, 3, 1250–1270. [Google Scholar] [CrossRef]
  42. Vermaak, L.; Neomagus, H.W.J.P.; Bessarabov, D.G. Recent Advances in Membrane-Based Electrochemical Hydrogen Separation: A Review. Membranes 2021, 11, 127. [Google Scholar] [CrossRef]
  43. Bessarabov, D.; Human, G.; Kruger, A.J.; Chiuta, S.; Modisha, P.M.; Du Preez, S.P.; Oelofse, S.P.; Vincent, I.; Van Der Merwe, J.; Langmi, H.W.; et al. South African hydrogen infrastructure (HySA infrastructure) for fuel cells and energy storage: Overview of a projects portfolio. Int. J. Hydrogen Energy 2017, 42, 13568–13588. [Google Scholar] [CrossRef]
  44. Bard, A.J.; Faulkner, L.R. Electrochemical Methods: Fundamentals and Applications; Wiley: Hoboken, NJ, USA, 2001; pp. 261–304. [Google Scholar]
  45. Barbir, F.; Görgün, H. Electrochemical hydrogen pump for recirculation of hydrogen in a fuel cell stack. J. Appl. Electrochem. 2006, 37, 359–365. [Google Scholar] [CrossRef]
  46. Zhang, J.; Tang, Y.; Song, C.; Zhang, J. Polybenzimidazole-membrane-based PEM fuel cell in the temperature range of 120–200 °C. J. Power Sources 2007, 172, 163–171. [Google Scholar] [CrossRef]
  47. Kim, S.J.; Lee, B.-S.; Ahn, S.H.; Han, J.Y.; Park, H.Y.; Kim, S.H.; Yoo, S.J.; Kim, H.-J.; Cho, E.; Henkensmeier, D.; et al. Characterizations of polybenzimidazole based electrochemical hydrogen pumps with various Pt loadings for H2/CO2 gas separation. Int. J. Hydrogen Energy 2013, 38, 14816–14823. [Google Scholar] [CrossRef]
  48. Nguyen, M.-T.; Grigoriev, S.A.; Kalinnikov, A.A.; Filippov, A.A.; Millet, P.; Fateev, V.N. Characterisation of a electrochemical hydrogen pump using electrochemical impedance spectroscopy. J. Appl. Electrochem. 2011, 41, 1033–1042. [Google Scholar] [CrossRef]
  49. Sahlin, S.L.; Araya, S.S.; Andreasen, S.J.; Kær, S.K. Electrochemical Impedance Spectroscopy (EIS) Characterization of Reformate-operated High Temperature PEM Fuel Cell Stack. Int. J. Power Energy Res. 2017, 1, 20–40. [Google Scholar] [CrossRef]
  50. Su, A.; Ferng, Y.; Hou, J.; Yu, T. Experimental and numerical investigations of the effects of PBI loading and operating temperature on a high-temperature PEMFC. Int. J. Hydrogen Energy 2012, 37, 7710–7718. [Google Scholar] [CrossRef]
  51. Li, P.; Wang, Z.; Qiao, Z.; Liu, Y.; Cao, X.; Li, W.; Wang, J.; Wang, S. Recent developments in membranes for efficient hydrogen purification. J. Membr. Sci. 2015, 495, 130–168. [Google Scholar] [CrossRef]
  52. Rowe, B.W.; Robeson, L.M.; Freeman, B.D.; Paul, D.R. Influence of temperature on the upper bound: Theoretical considerations and comparison with experimental results. J. Membr. Sci. 2010, 360, 58–69. [Google Scholar] [CrossRef]
  53. Onda, K.; Araki, T.; Ichihara, K.; Nagahama, M. Treatment of low concentration hydrogen by electrochemical pump or proton exchange membrane fuel cell. J. Power Sources 2009, 188, 1–7. [Google Scholar] [CrossRef]
  54. Hoshi, N.; Mizumura, T.; Hori, Y. Significant difference of the reduction rates of carbon dioxide between Pt(111) and Pt(110) single crystal electrodes. Electrochim. Acta 1995, 40, 883–887. [Google Scholar] [CrossRef]
  55. Janssen, G. Modelling study of CO2 poisoning on PEMFC anodes. J. Power Sources 2004, 136, 45–54. [Google Scholar] [CrossRef]
  56. Kortlever, R.; Shen, J.; Schouten, K.J.P.; Calle-Vallejo, F.; Koper, M.T.M. Catalysts and Reaction Pathways for the Electrochemical Reduction of Carbon Dioxide. J. Phys. Chem. Lett. 2015, 6, 4073–4082. [Google Scholar] [CrossRef] [PubMed]
  57. Ru, F.Y.; Zulkefli, N.N.; Yusra, N.; Yusuf, M.; Masdar, M.S. Effect of Operating Parameter on H2/CO2 Gas Separation using Electrochemical Cell. Int. J. Appl. Eng. Res. 2018, 13, 505–510. [Google Scholar]
  58. Rönsch, S.; Schneider, J.; Matthischke, S.; Schlüter, M.; Götz, M.; Lefebvre, J.; Prabhakaran, P.; Bajohr, S. Review on methanation—From fundamentals to current projects. Fuel 2016, 166, 276–296. [Google Scholar] [CrossRef]
  59. Kok, E.; Scott, J.; Cant, N.; Trimm, D. The impact of ruthenium, lanthanum and activation conditions on the methanation activity of alumina-supported cobalt catalysts. Catal. Today 2011, 164, 297–301. [Google Scholar] [CrossRef]
  60. Mills, G.A.; Steffgen, F.W. Catalytic Methanation. Catal. Rev. 1974, 8, 159–210. [Google Scholar] [CrossRef]
  61. Guerra, L.; Rossi, S.; Rodrigues, J.; Gomes, J.; Puna, J.; Santos, M. Methane production by a combined Sabatier reaction/water electrolysis process. J. Environ. Chem. Eng. 2018, 6, 671–676. [Google Scholar] [CrossRef]
  62. Wu, H.C.; Chang, Y.C.; Wu, J.H.; Lin, J.H.; Lin, I.K.; Chen, C.S. Methanation of CO2 and reverse water gas shift reactions on Ni/SiO2 catalysts: The influence of particle size on selectivity and reaction pathway. Catal. Sci. Technol. 2015, 5, 4154–4163. [Google Scholar] [CrossRef]
  63. Gao, D.; Cai, F.; Xu, Q.; Wang, G.; Pan, X.; Bao, X. Gas-phase electrocatalytic reduction of carbon dioxide using electrolytic cell based on phosphoric acid-doped polybenzimidazole membrane. J. Energy Chem. 2014, 23, 694–700. [Google Scholar] [CrossRef]
  64. Ibeh, B.; Gardner, C.; Ternan, M. Separation of hydrogen from a hydrogen/methane mixture using a PEM fuel cell. Int. J. Hydrogen Energy 2007, 32, 908–914. [Google Scholar] [CrossRef]
  65. Halseid, R.; Vie, P.J.; Tunold, R. Effect of ammonia on the performance of polymer electrolyte membrane fuel cells. J. Power Sources 2006, 154, 343–350. [Google Scholar] [CrossRef]
  66. Uribe, F.A.; Gottesfeld, S.; Zawodzinski, T.A. Effect of Ammonia as Potential Fuel Impurity on Proton Exchange Membrane Fuel Cell Performance. J. Electrochem. Soc. 2002, 149, A293–A296. [Google Scholar] [CrossRef]
  67. Halseid, R.; Vie, P.J.S.; Tunold, R. Influence of Ammonium on Conductivity and Water Content of Nafion 117 Membranes. J. Electrochem. Soc. 2004, 151, A381–A388. [Google Scholar] [CrossRef]
  68. Vassiliev, A.; Reumert, A.K.; Jensen, J.O.; Aili, D. Durability and degradation of vapor-fed direct dimethyl ether high temperature polymer electrolyte membrane fuel cells. J. Power Sources 2019, 432, 30–37. [Google Scholar] [CrossRef]
  69. Kim, A.R.; Gabunada, J.C.; Yoo, D.J. Amelioration in physicochemical properties and single cell performance of sulfonated poly(ether ether ketone) block copolymer composite membrane using sulfonated carbon nanotubes for intermediate humidity fuel cells. Int. J. Energy Res. 2019, 43, 2974–2989. [Google Scholar] [CrossRef]
  70. Vinothkannan, M.; Hariprasad, R.; Ramakrishnan, S.; Kim, A.R.; Yoo, D.J. Potential Bifunctional Filler (CeO2–ACNTs) for Nafion Matrix toward Extended Electrochemical Power Density and Durability in Proton-Exchange Membrane Fuel Cells Operating at Reduced Relative Humidity. ACS Sustain. Chem. Eng. 2019, 7, 12847–12857. [Google Scholar] [CrossRef]
Figure 1. Working principal of an ideal electrochemical hydrogen separator [42,43].
Membranes 11 00282 g001
Figure 2. Cross section of the electrochemical cell.
Membranes 11 00282 g002
Figure 3. Experimental set-up used for electrochemical hydrogen separation.
Membranes 11 00282 g003
Figure 4. Polarization curve for pure hydrogen (100 mLn/min, 1 atm).
Membranes 11 00282 g004
Figure 5. Theoretical and measured hydrogen permeate flow rates and hydrogen permeability (hydrogen flow rate = 100 mLn/min, 1 atm).
Membranes 11 00282 g005
Figure 6. Current-(εi), voltage-(εv), and power (εp) efficiencies as a function of current density at (a) 120 °C, (b) 140 °C and (c) 160 °C (hydrogen flow rate = 100 mLn/min, 1 atm).
Membranes 11 00282 g006
Figure 7. Electrochemical impedance spectroscopy (EIS) data showing the change in ohmic resistance (x-intercept) with temperature. Hydrogen flow rate = 100 mLn/min, 1 atm.
Membranes 11 00282 g007
Figure 8. Polarization curves for (a) 10%, (b) 50%, and (c) 80% methane, balance hydrogen (hydrogen flow rate = 100 mLn/min, 1 atm).
Membranes 11 00282 g008
Figure 9. Current-(εi), voltage-(εv), and power (εp) efficiencies as a function of current density at 120–160 °C for (a) 10%, (b) 50%, and (c) 80% methane, balance hydrogen (hydrogen flow rate = 100 mLn/min, 1 atm).
Membranes 11 00282 g009
Figure 10. H2/CH4 selectivity, in terms of methane concentration, versus current density: (a) 10% (b) 50% and (c) 80% methane, balance hydrogen (hydrogen flow rate = 100 mLn/min, 1 atm).
Membranes 11 00282 g010
Figure 11. Polarization curves for (a) 10%, (b) 50% carbon dioxide, balance hydrogen (hydrogen flow rate = 100 mLn/min, 1 atm).
Membranes 11 00282 g011
Figure 12. H2/CO2 selectivity, in terms of carbon dioxide concentration, versus current density: (a) 10% and (b) 50% carbon dioxide, balance hydrogen (hydrogen flow rate = 100 mLn/min, 1 atm).
Membranes 11 00282 g012
Figure 13. Current- (εi), voltage- (εv), and power (εp) efficiencies as a function of current density at 120–160 °C for (a) 10% and (b) 50% carbon dioxide, balance hydrogen (hydrogen flow rate = 100 mLn/min, 1 atm).
Membranes 11 00282 g013
Figure 14. Polarization curves for (a) 1500 ppm, (b) 3000 ppm ammonia, balance hydrogen (hydrogen flow rate = 100 mLn/min, 1 atm).
Membranes 11 00282 g014
Figure 15. H2/NH3 selectivity, in terms of ammonia concentration, versus current density: (a) 1500 ppm and (b) 3000 ppm ammonia, balance hydrogen (hydrogen flow rate = 100 mLn/min, 1 atm).
Membranes 11 00282 g015
Figure 16. Digital images of polybenzimidazole (PBI) membranes before and after ammonia exposure: (a) fresh membrane (before) and (b) cracked membrane (after).
Membranes 11 00282 g016
Figure 17. SEM images/surface morphologies of MEA components (before and after ammonia exposure): (a) membrane before ammonia exposure, (b) affected membrane after ammonia exposure, (c) cathode GDL (Pt catalyst) before ammonia exposure, (d) cathode GDL (Pt catalyst) after ammonia exposure, (e) anode GDL (Pt/Co catalyst) before ammonia exposure and (f) anode GDL (Pt/Co catalyst) after ammonia exposure (MEA: membrane electrode assembly; GDL: gas diffusion layer).
Membranes 11 00282 g017
Table 1. Properties of different hydrogen purification processes [22,23,24].
PropertiesPSAMembranesCryogenic
Min. feed purity (vol.%)>40>2515–80
Max. product purity (vol.%)>99.9>98~97
Max. hydrogen recovery (%)Up to 90Up to 95Up to 98
Inlet pressure (bar)10–7014–13814–83
Outlet pressure (bar)Similar to feedSubstantially less than feedSimilar to feed
Table 2. Properties of the TPS®-based membrane (as received from the supplier).
Membrane TypeTPS®-Based
Membrane thickness60–65 μm
Catalyst used anodePt-Co/C
Atomic ratio 1:1 (Pt:Co)
Catalyst used cathodePt/C
Total catalyst loading1.8 mg cm−2
Membrane area25 cm2
Temperature range120–200 °C
Proton conductivity8 × 10−2 S cm−1
Table 3. Hydrogen purity and cell voltage values as a function of temperature for the H2/CH4 feed mixtures, measured at 0.1 A cm−2.
TemperatureHydrogen Purity (%)OCV (V)Measured Voltage (V)Measured-OCV (V)
InletPermeate
120 °C2099.980.0270.5640.537
5099.980.0120.2840.272
9099.990.0020.0770.075
140 °C2099.980.0290.3520.323
5099.980.0120.2190.207
9099.990.0020.0750.074
160 °C2099.860.0300.2530.233
5099.950.0130.0830.070
9099.990.0020.0740.072
Table 4. Hydrogen purity and cell voltage values as a function of temperature for the H2/CO2 feed mixtures, measured at 0.1 A cm−2.
TemperatureHydrogen Purity (%)OCV (V)Measured Voltage (V)Measured-OCV (V)
Inlet (Anode)Permeate (Cathode)
120 °C5099.390.0120.4540.442
9099.560.0020.3000.298
140 °C5099.290.0120.1320.120
9099.440.0020.1700.168
160 °C5099.340.0130.1250.112
9099.630.0020.1380.136
Publisher’s Note: MDPI stays neutral with regard to jurisdictional claims in published maps and institutional affiliations.

