Plasticized PVC Membrane Modified Electrodes: Voltammetry of Highly Hydrophobic Compounds


Abstract
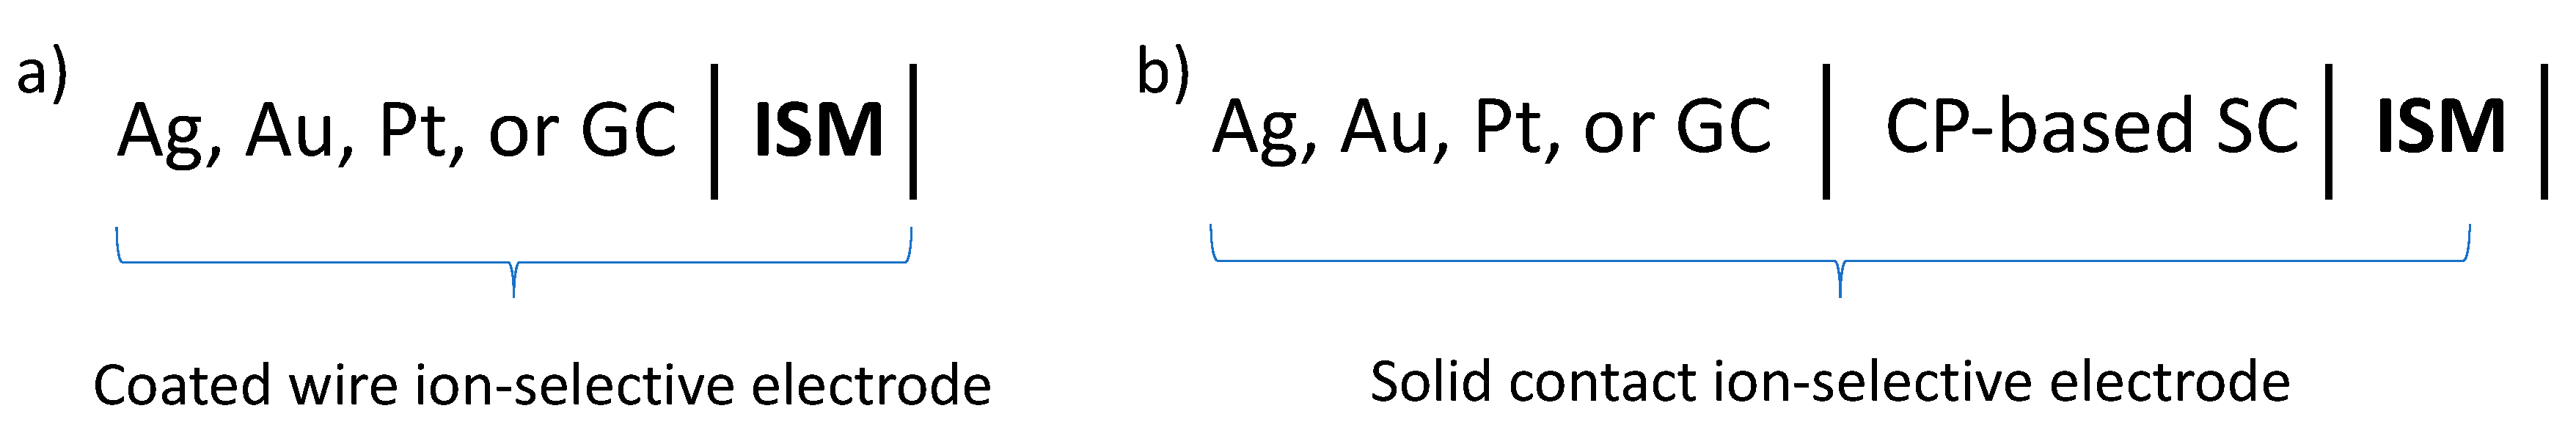
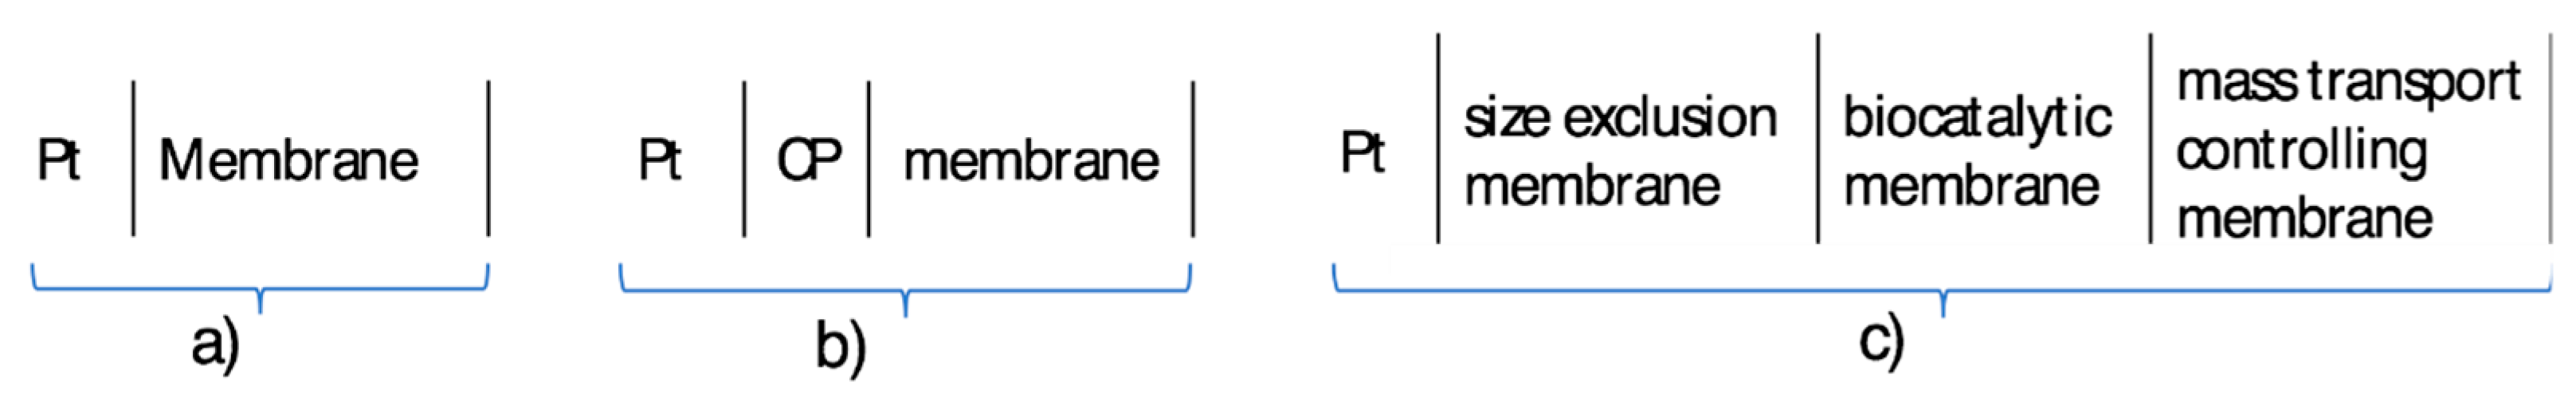
:1. Introduction
2. Materials and Methods
2.1. Membranes and Membrane Deposition
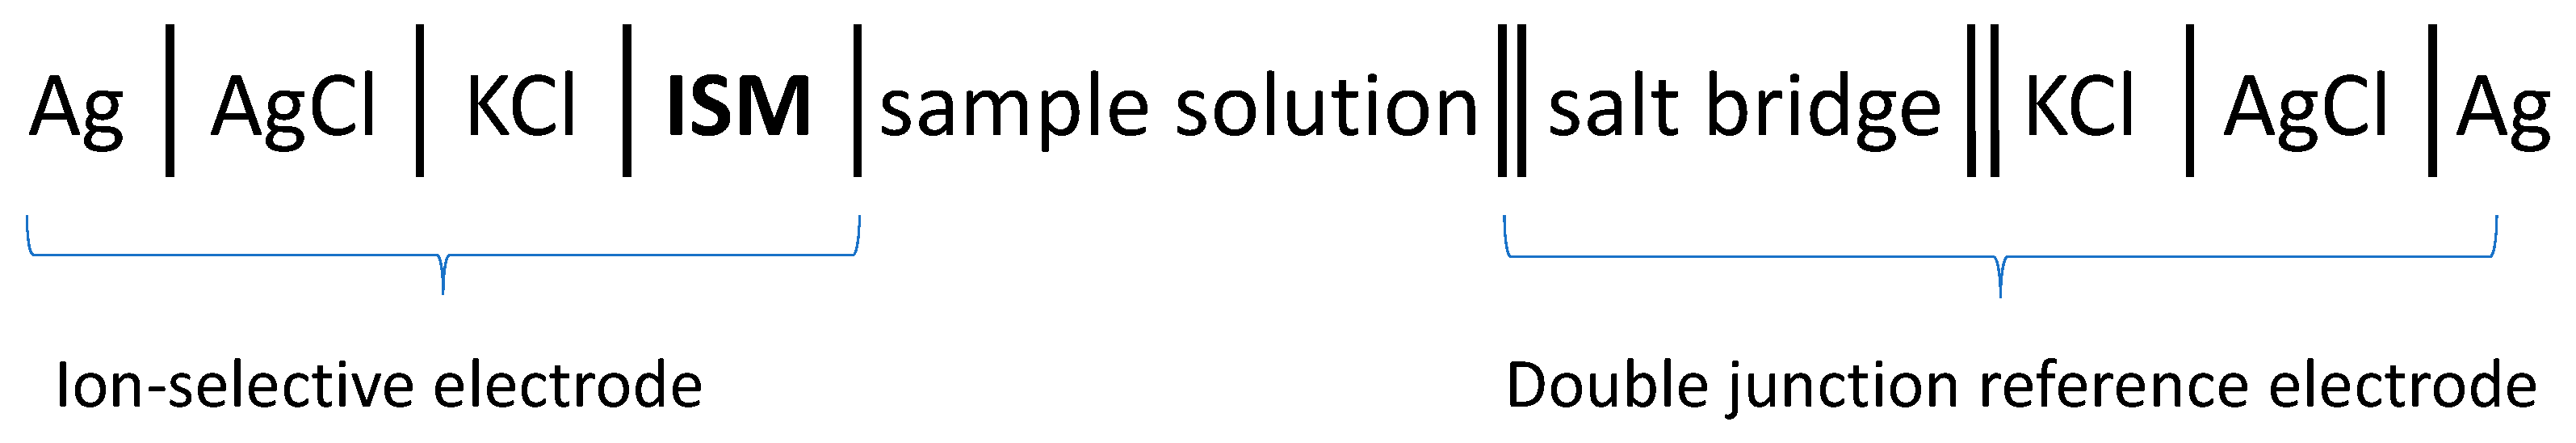
2.2. Batch Measurements with Linear Sweep Voltammetry and Chronoamperometry
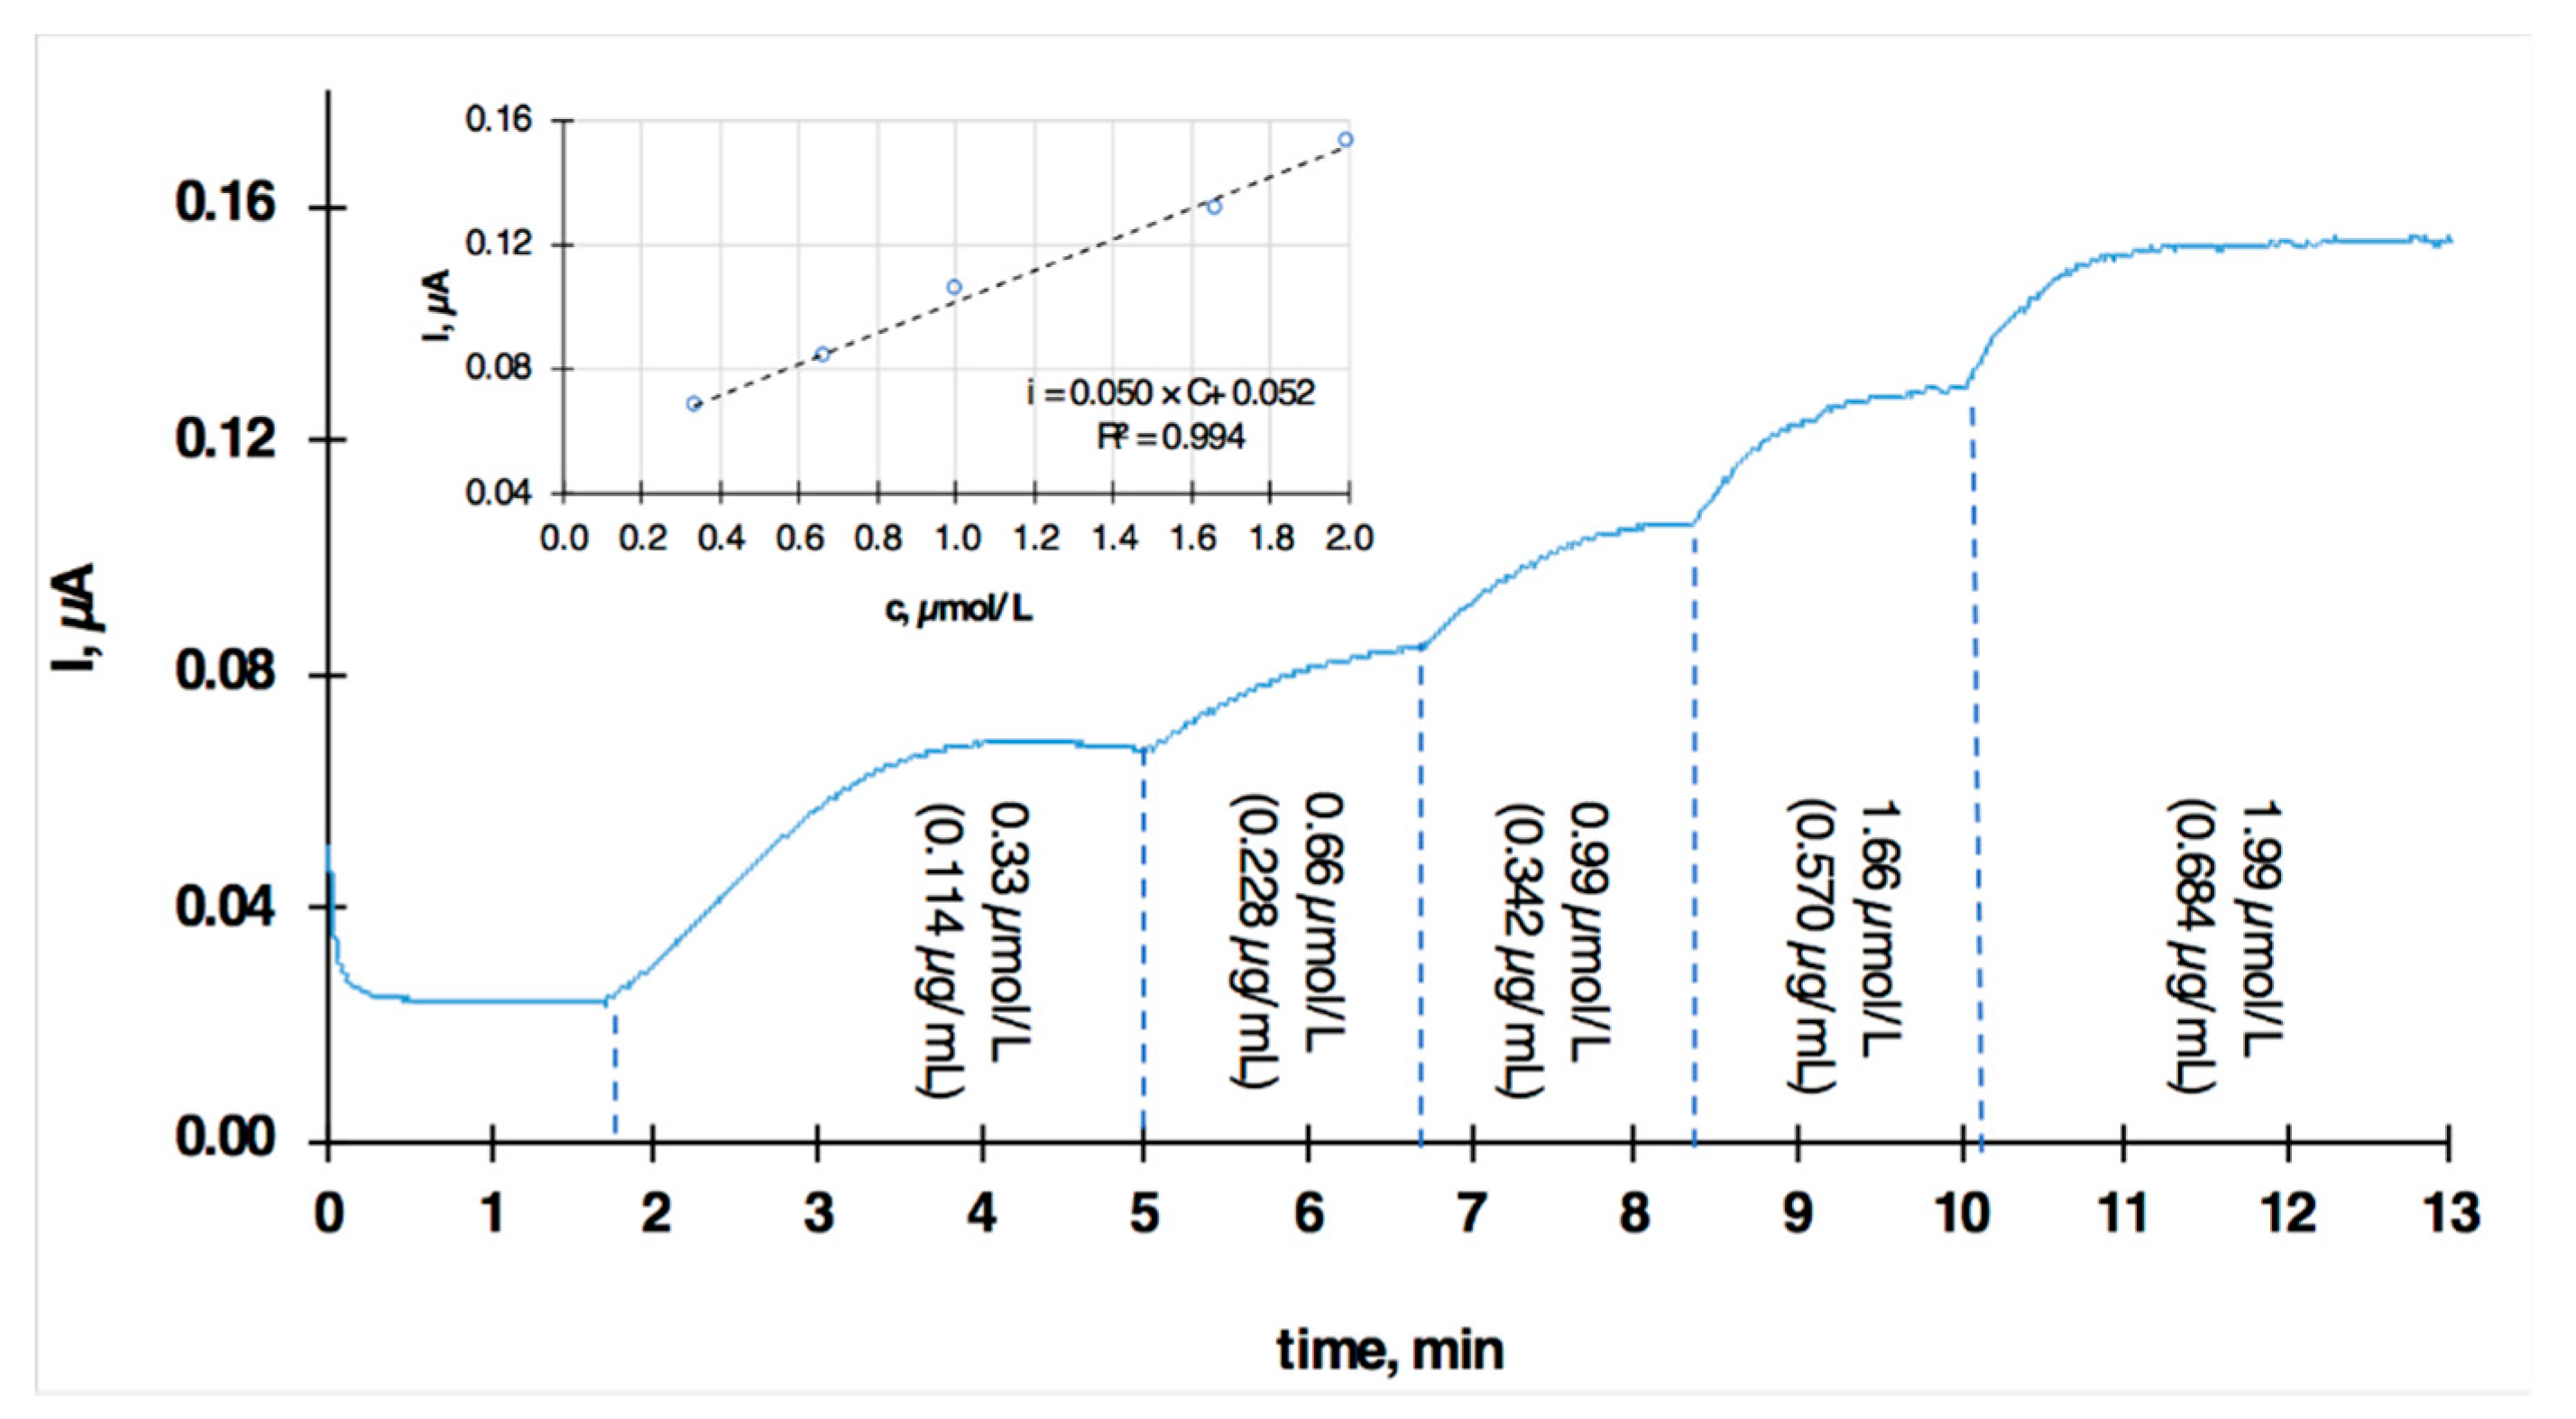
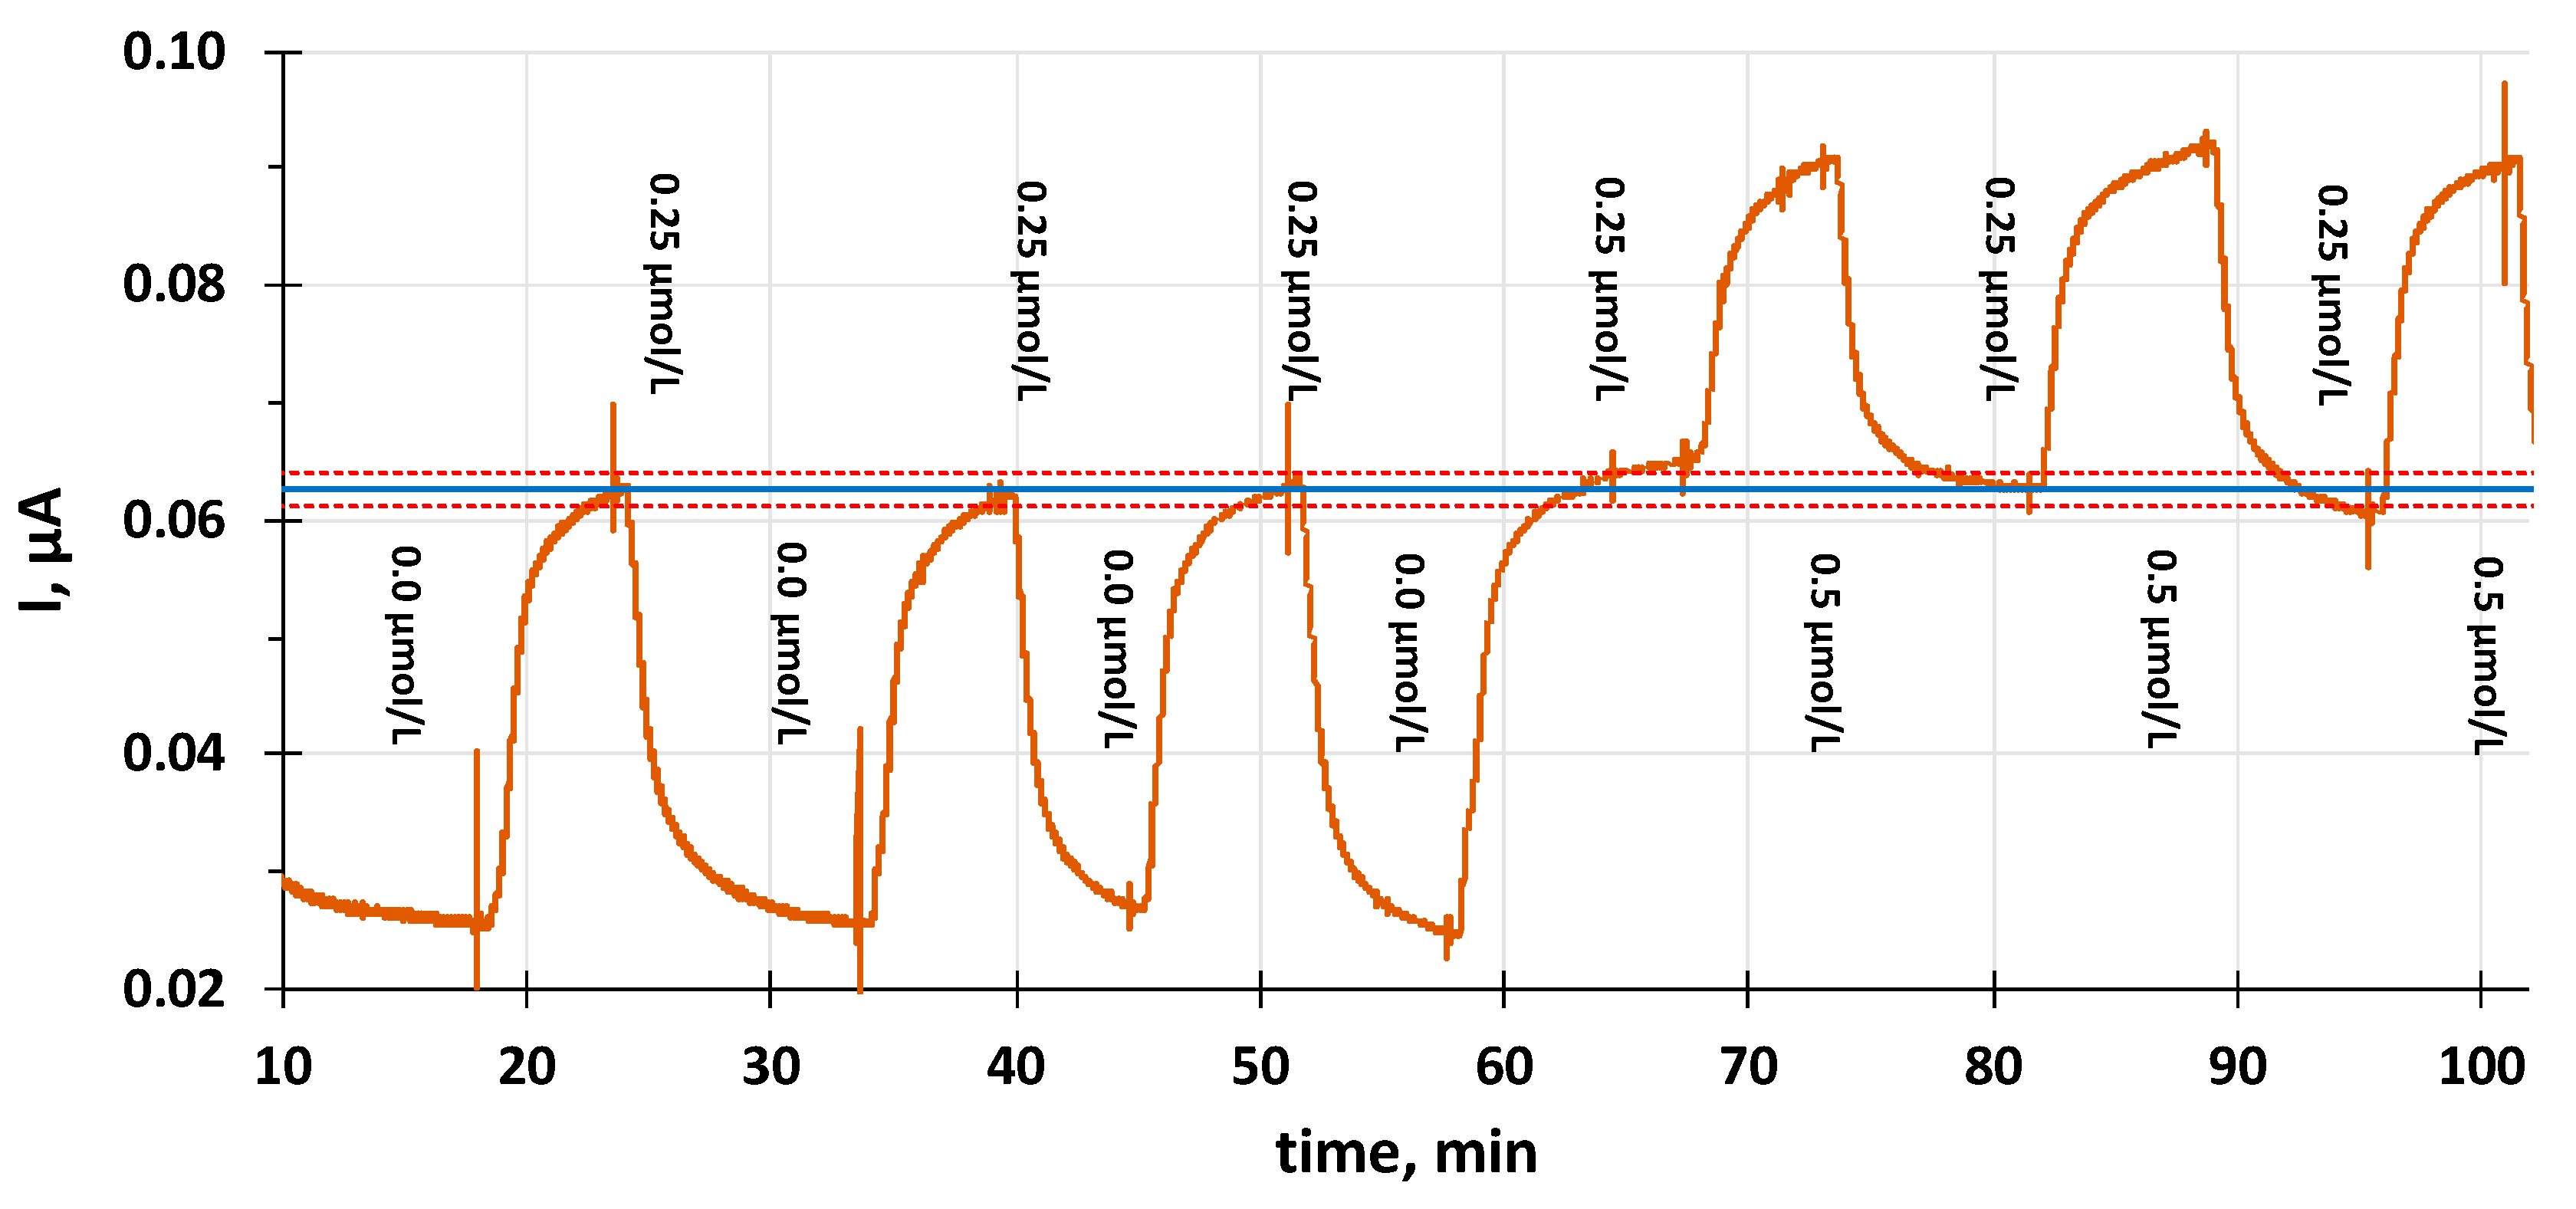
2.3. Chronoamperometry in a Continuous Flow Analysis Mode
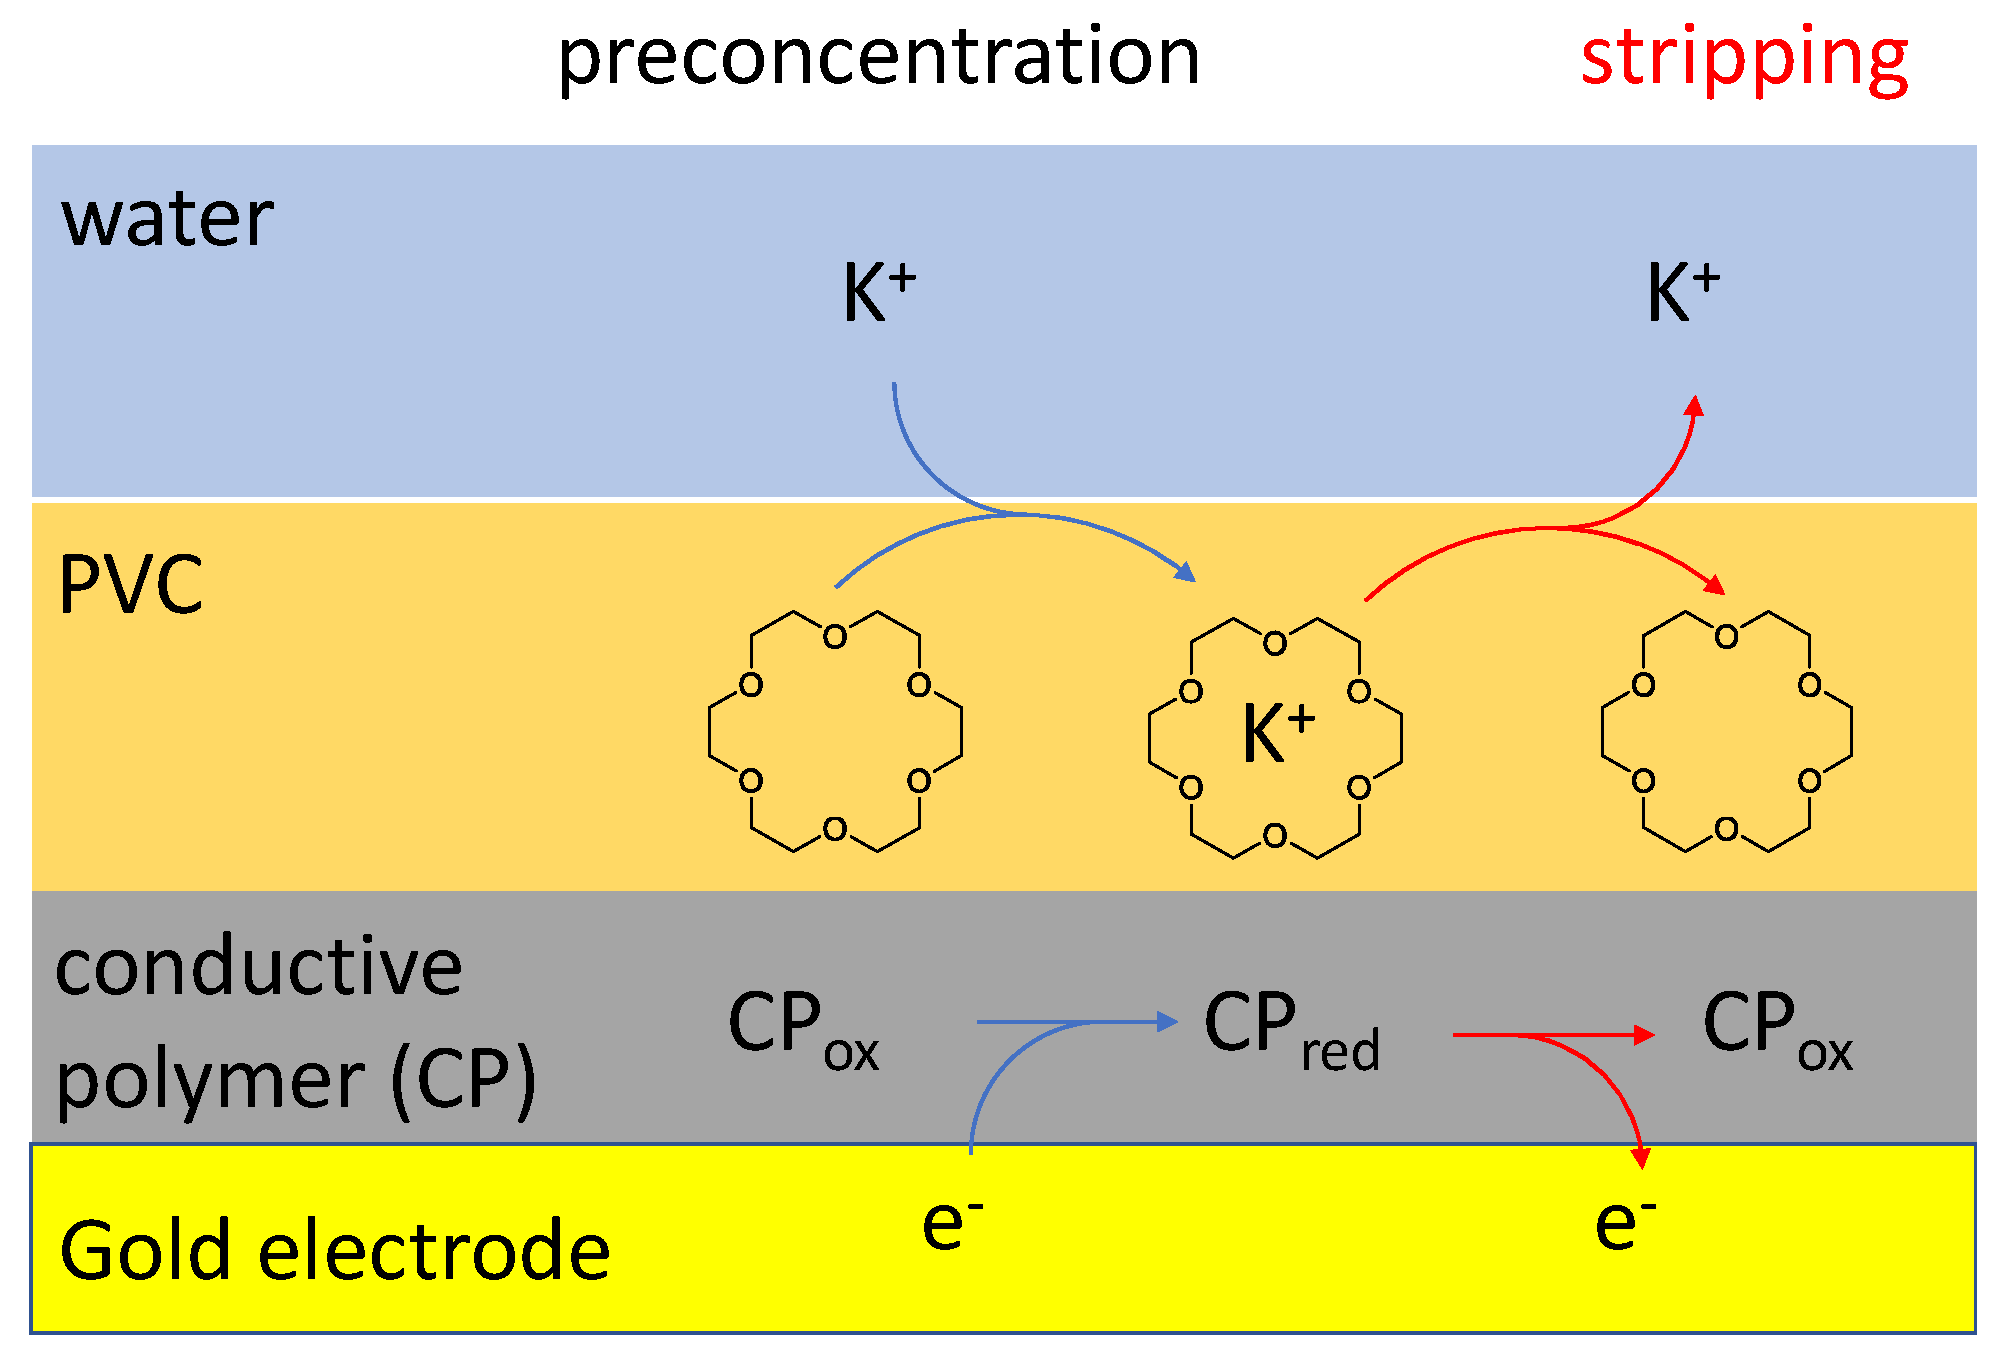
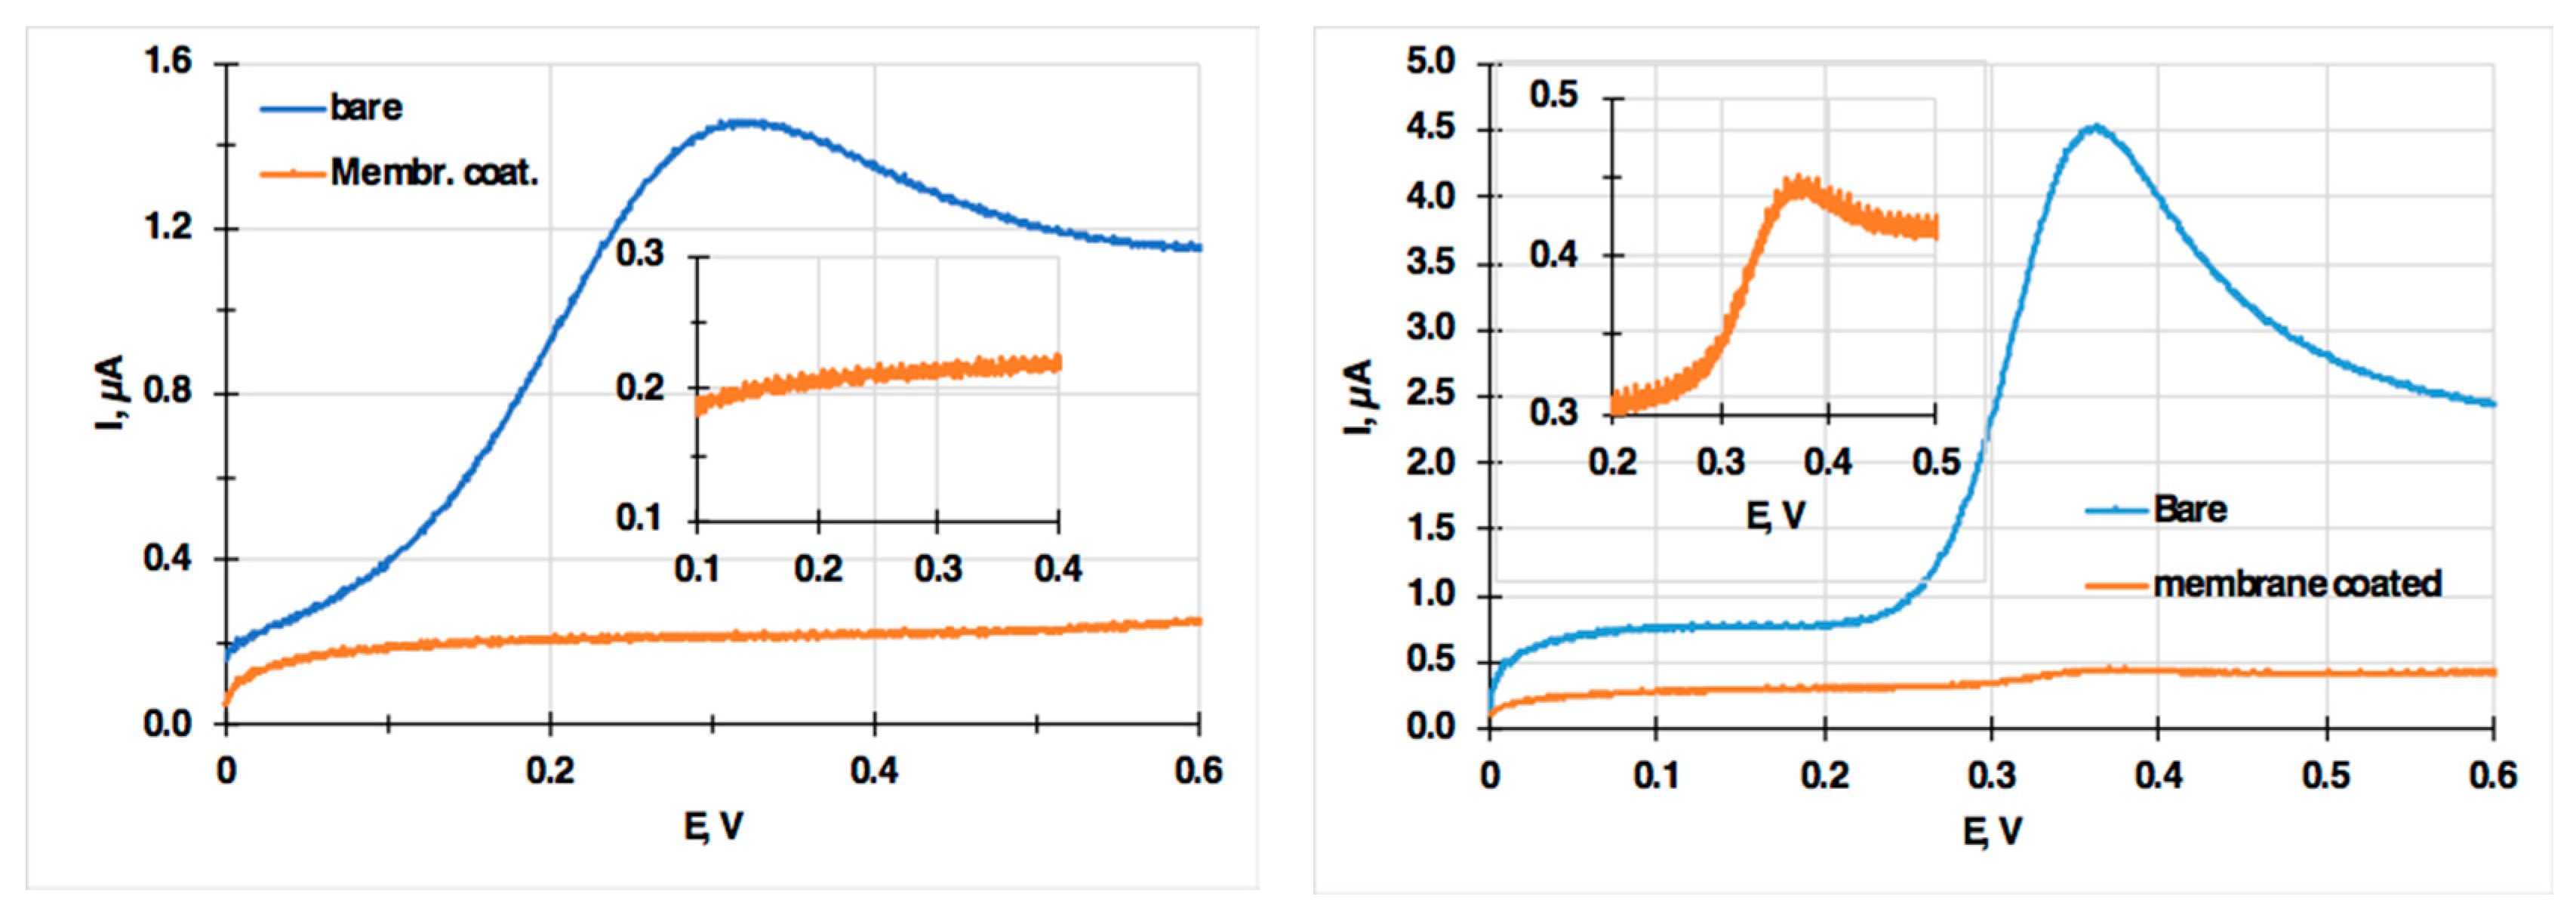
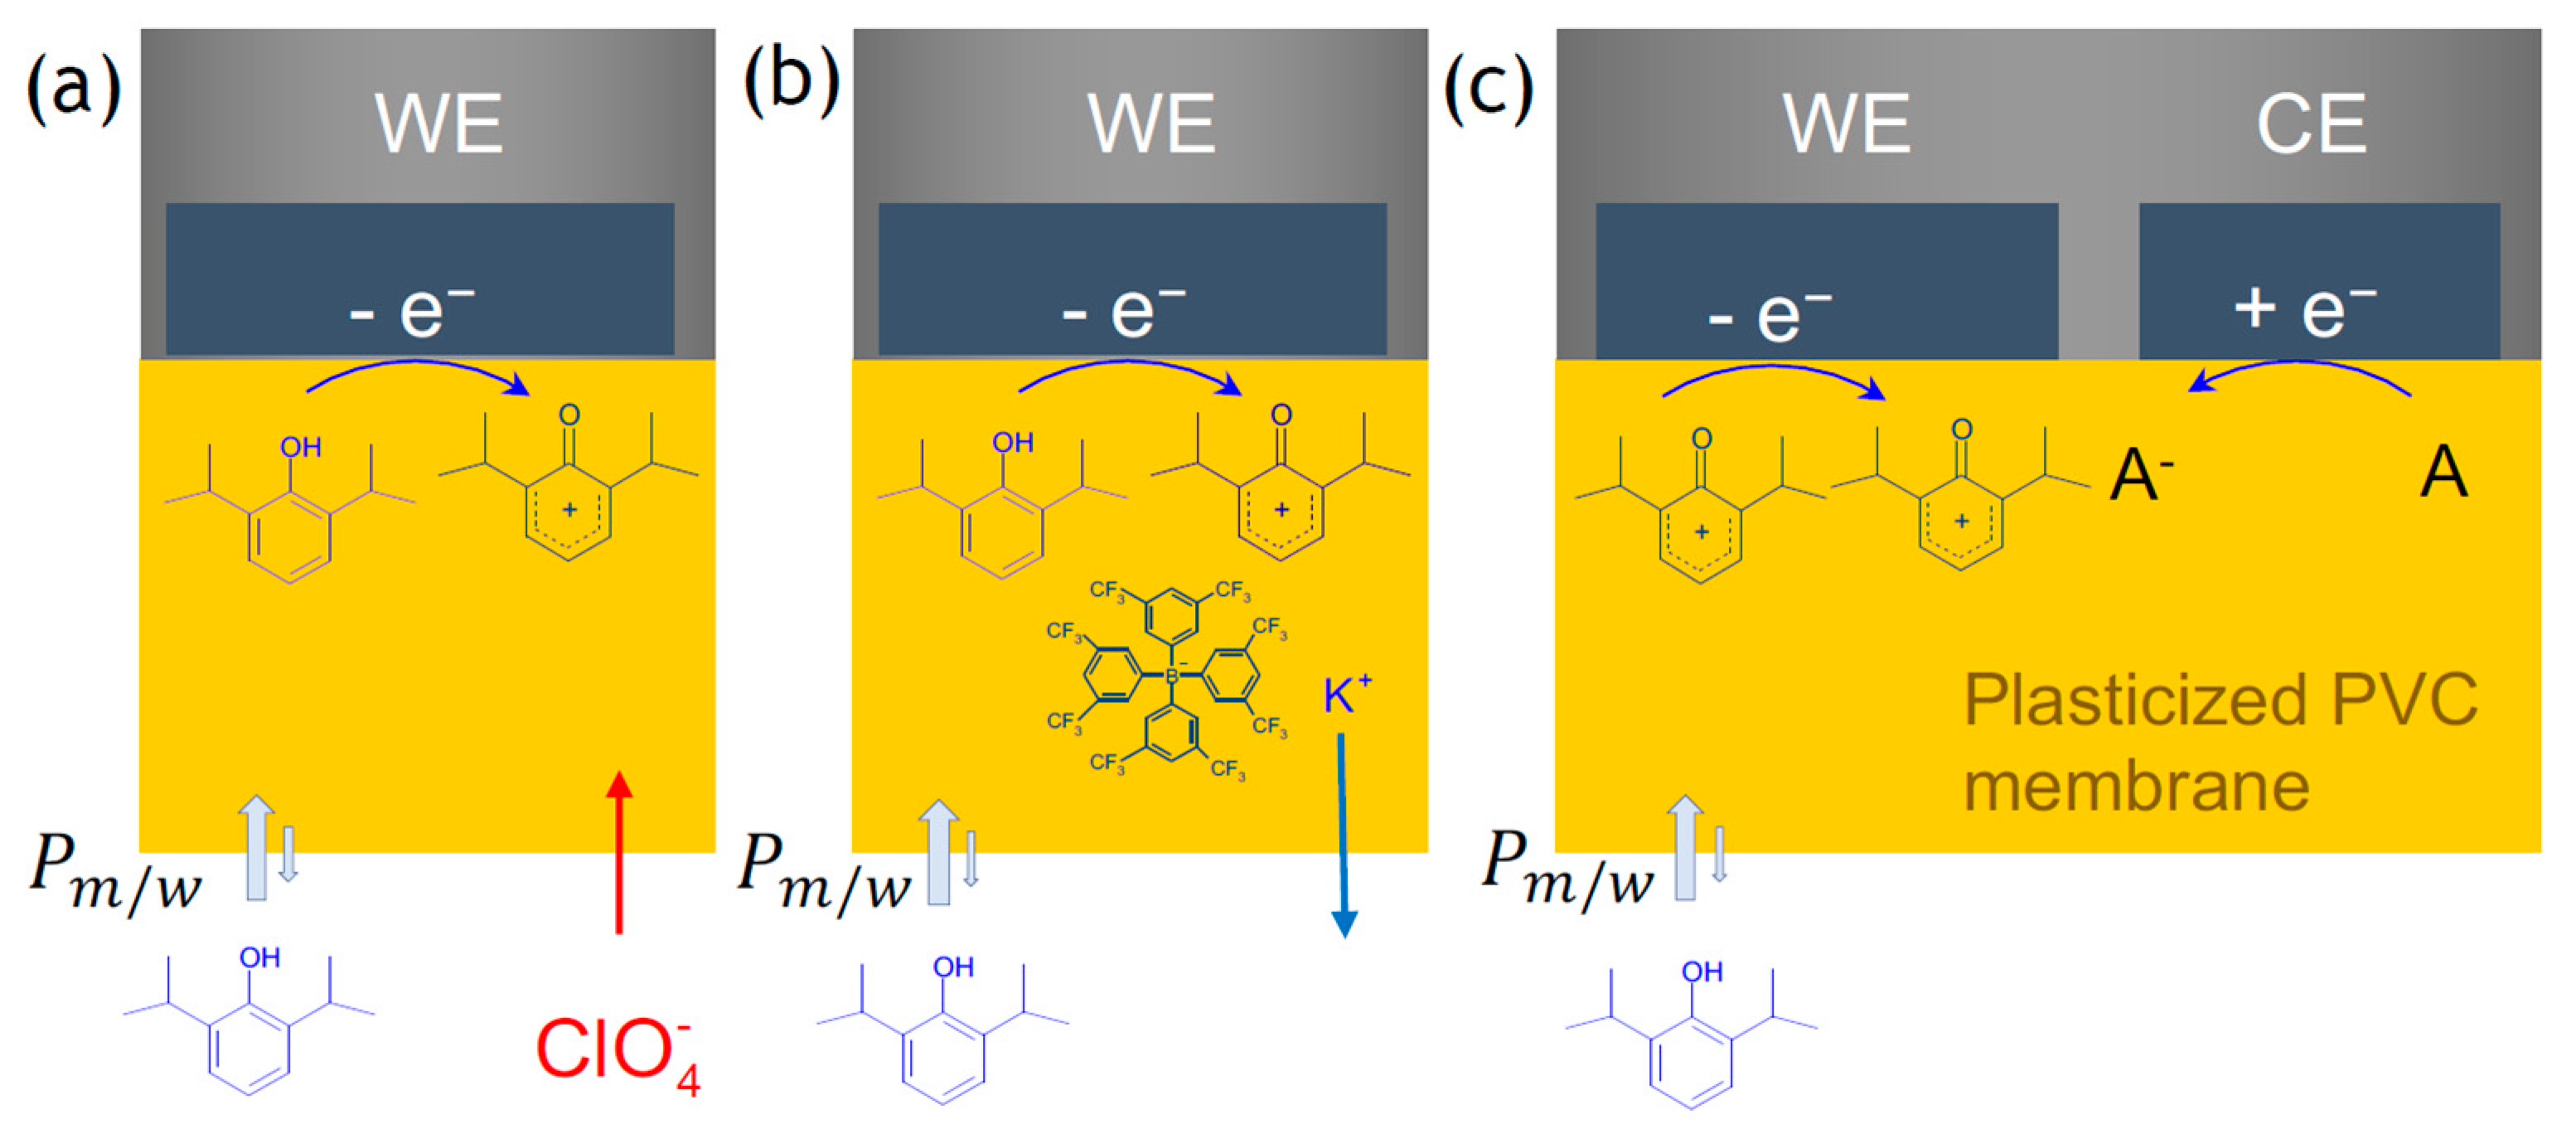
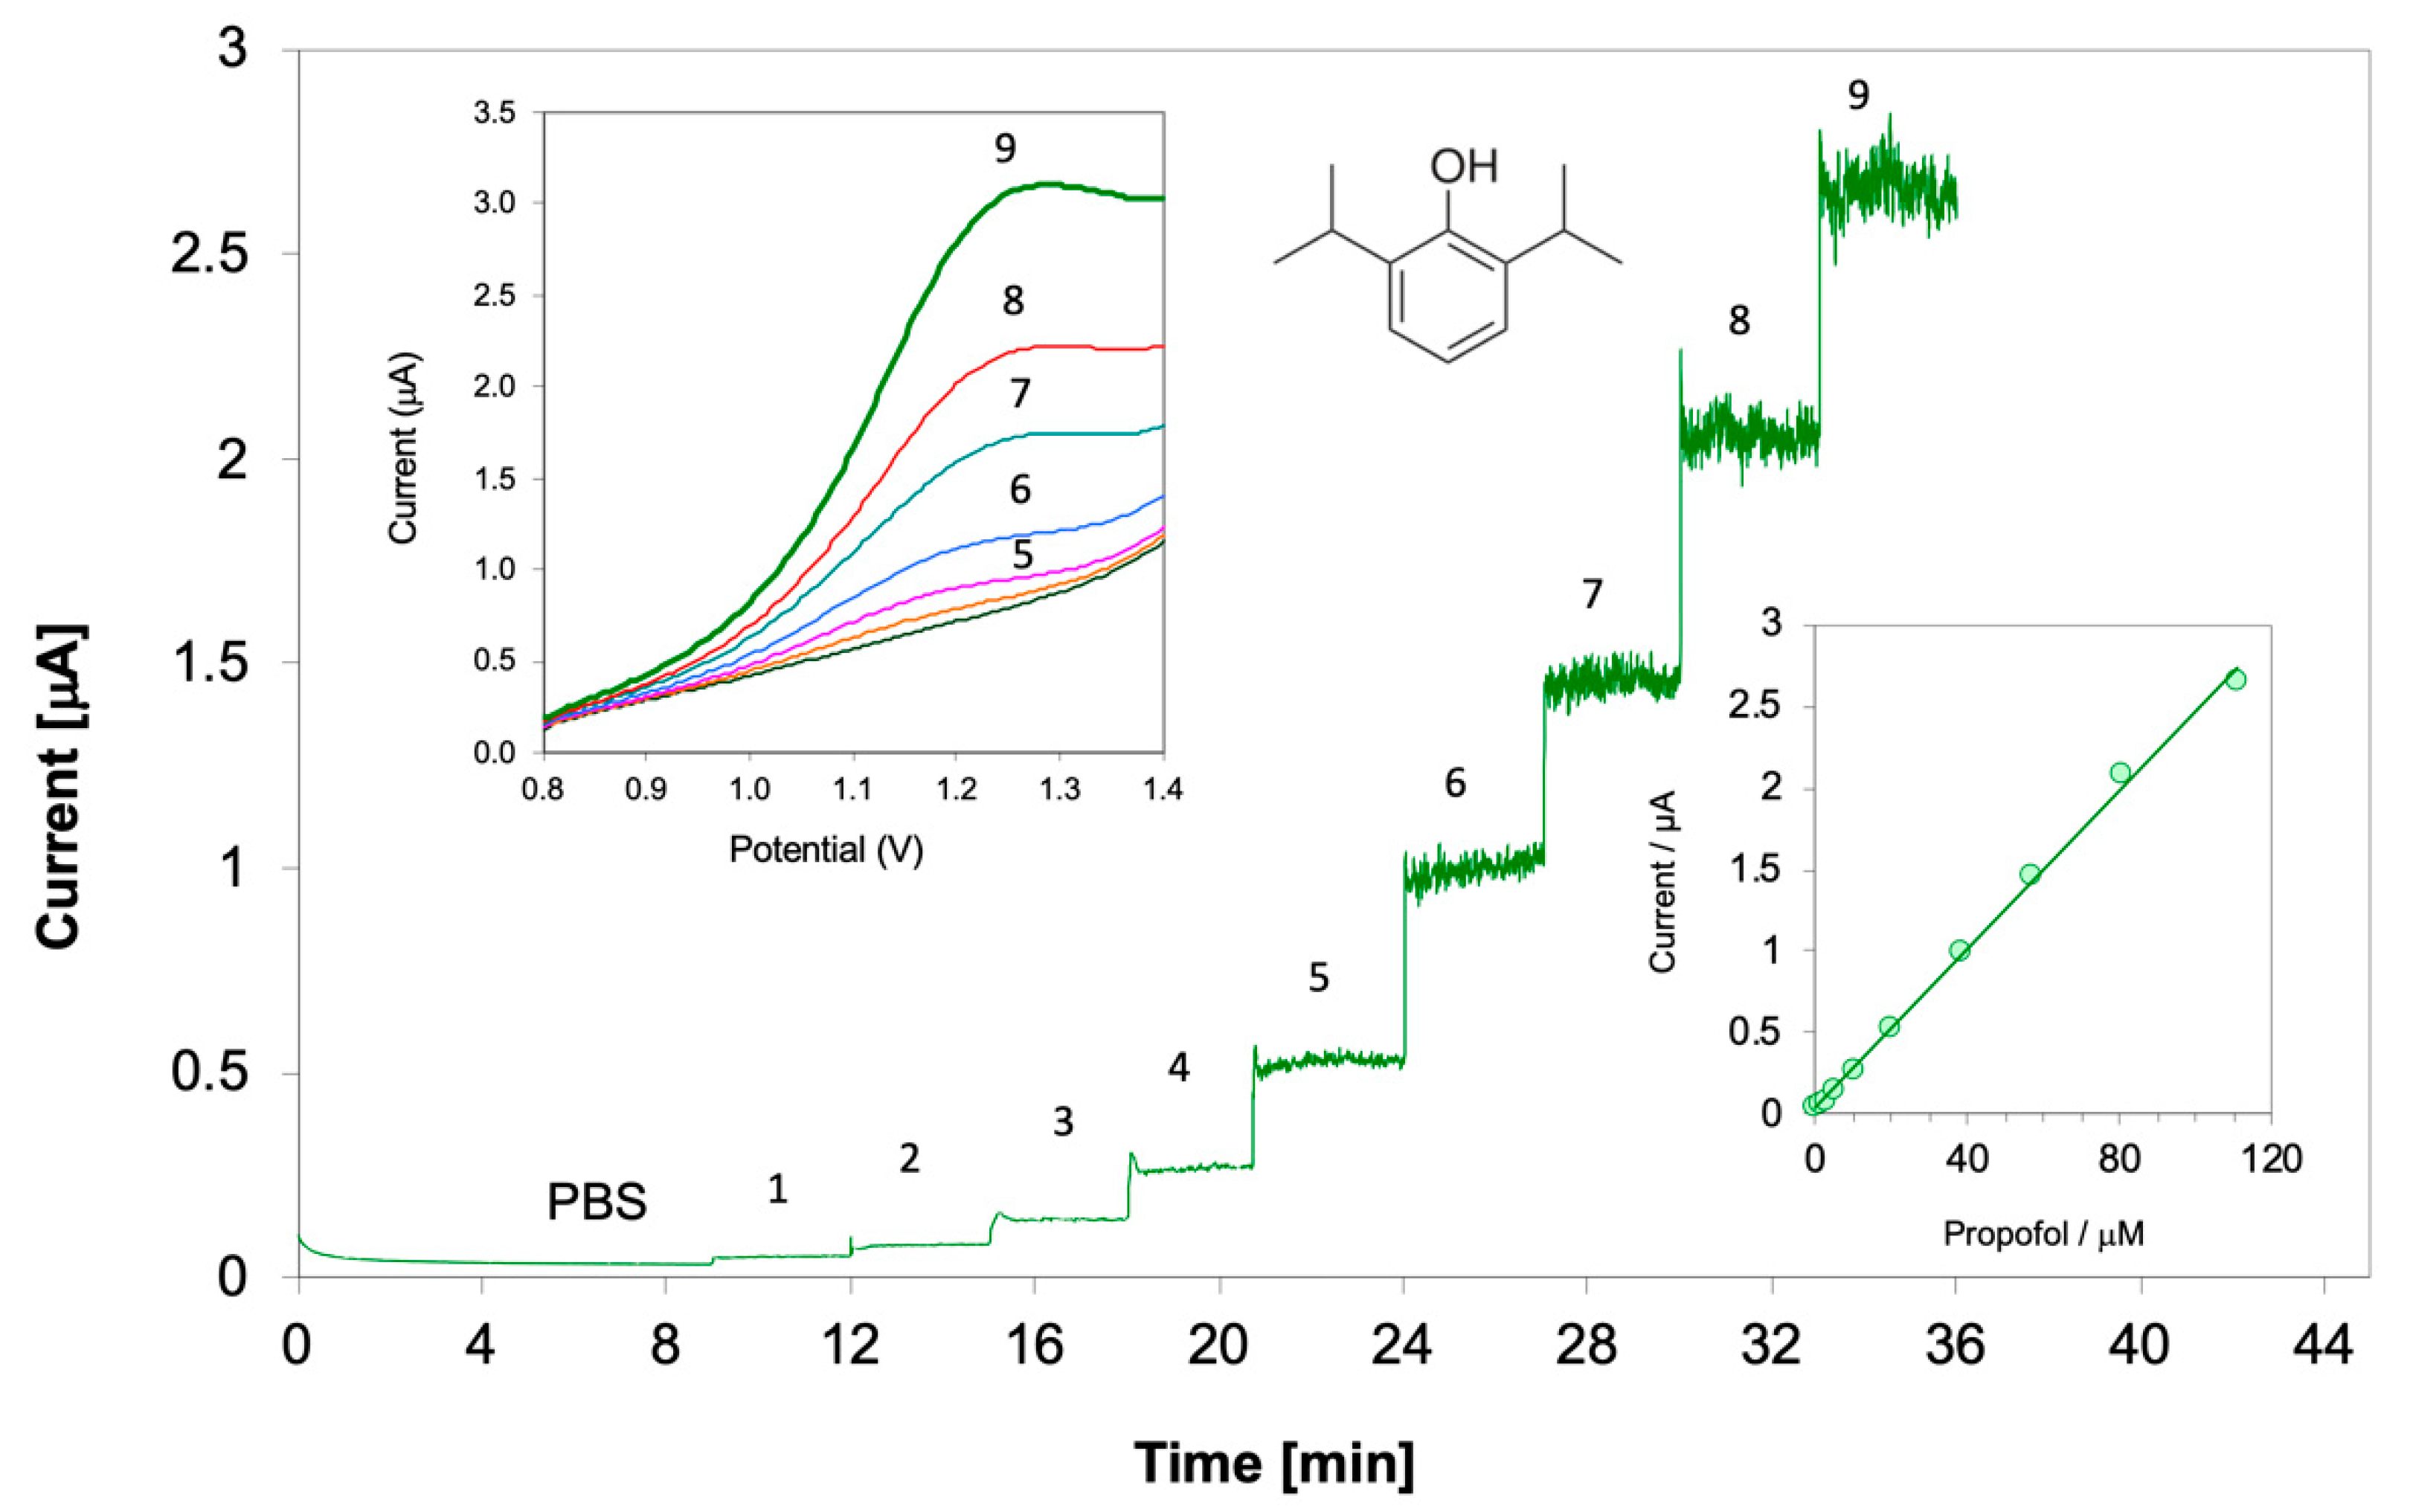
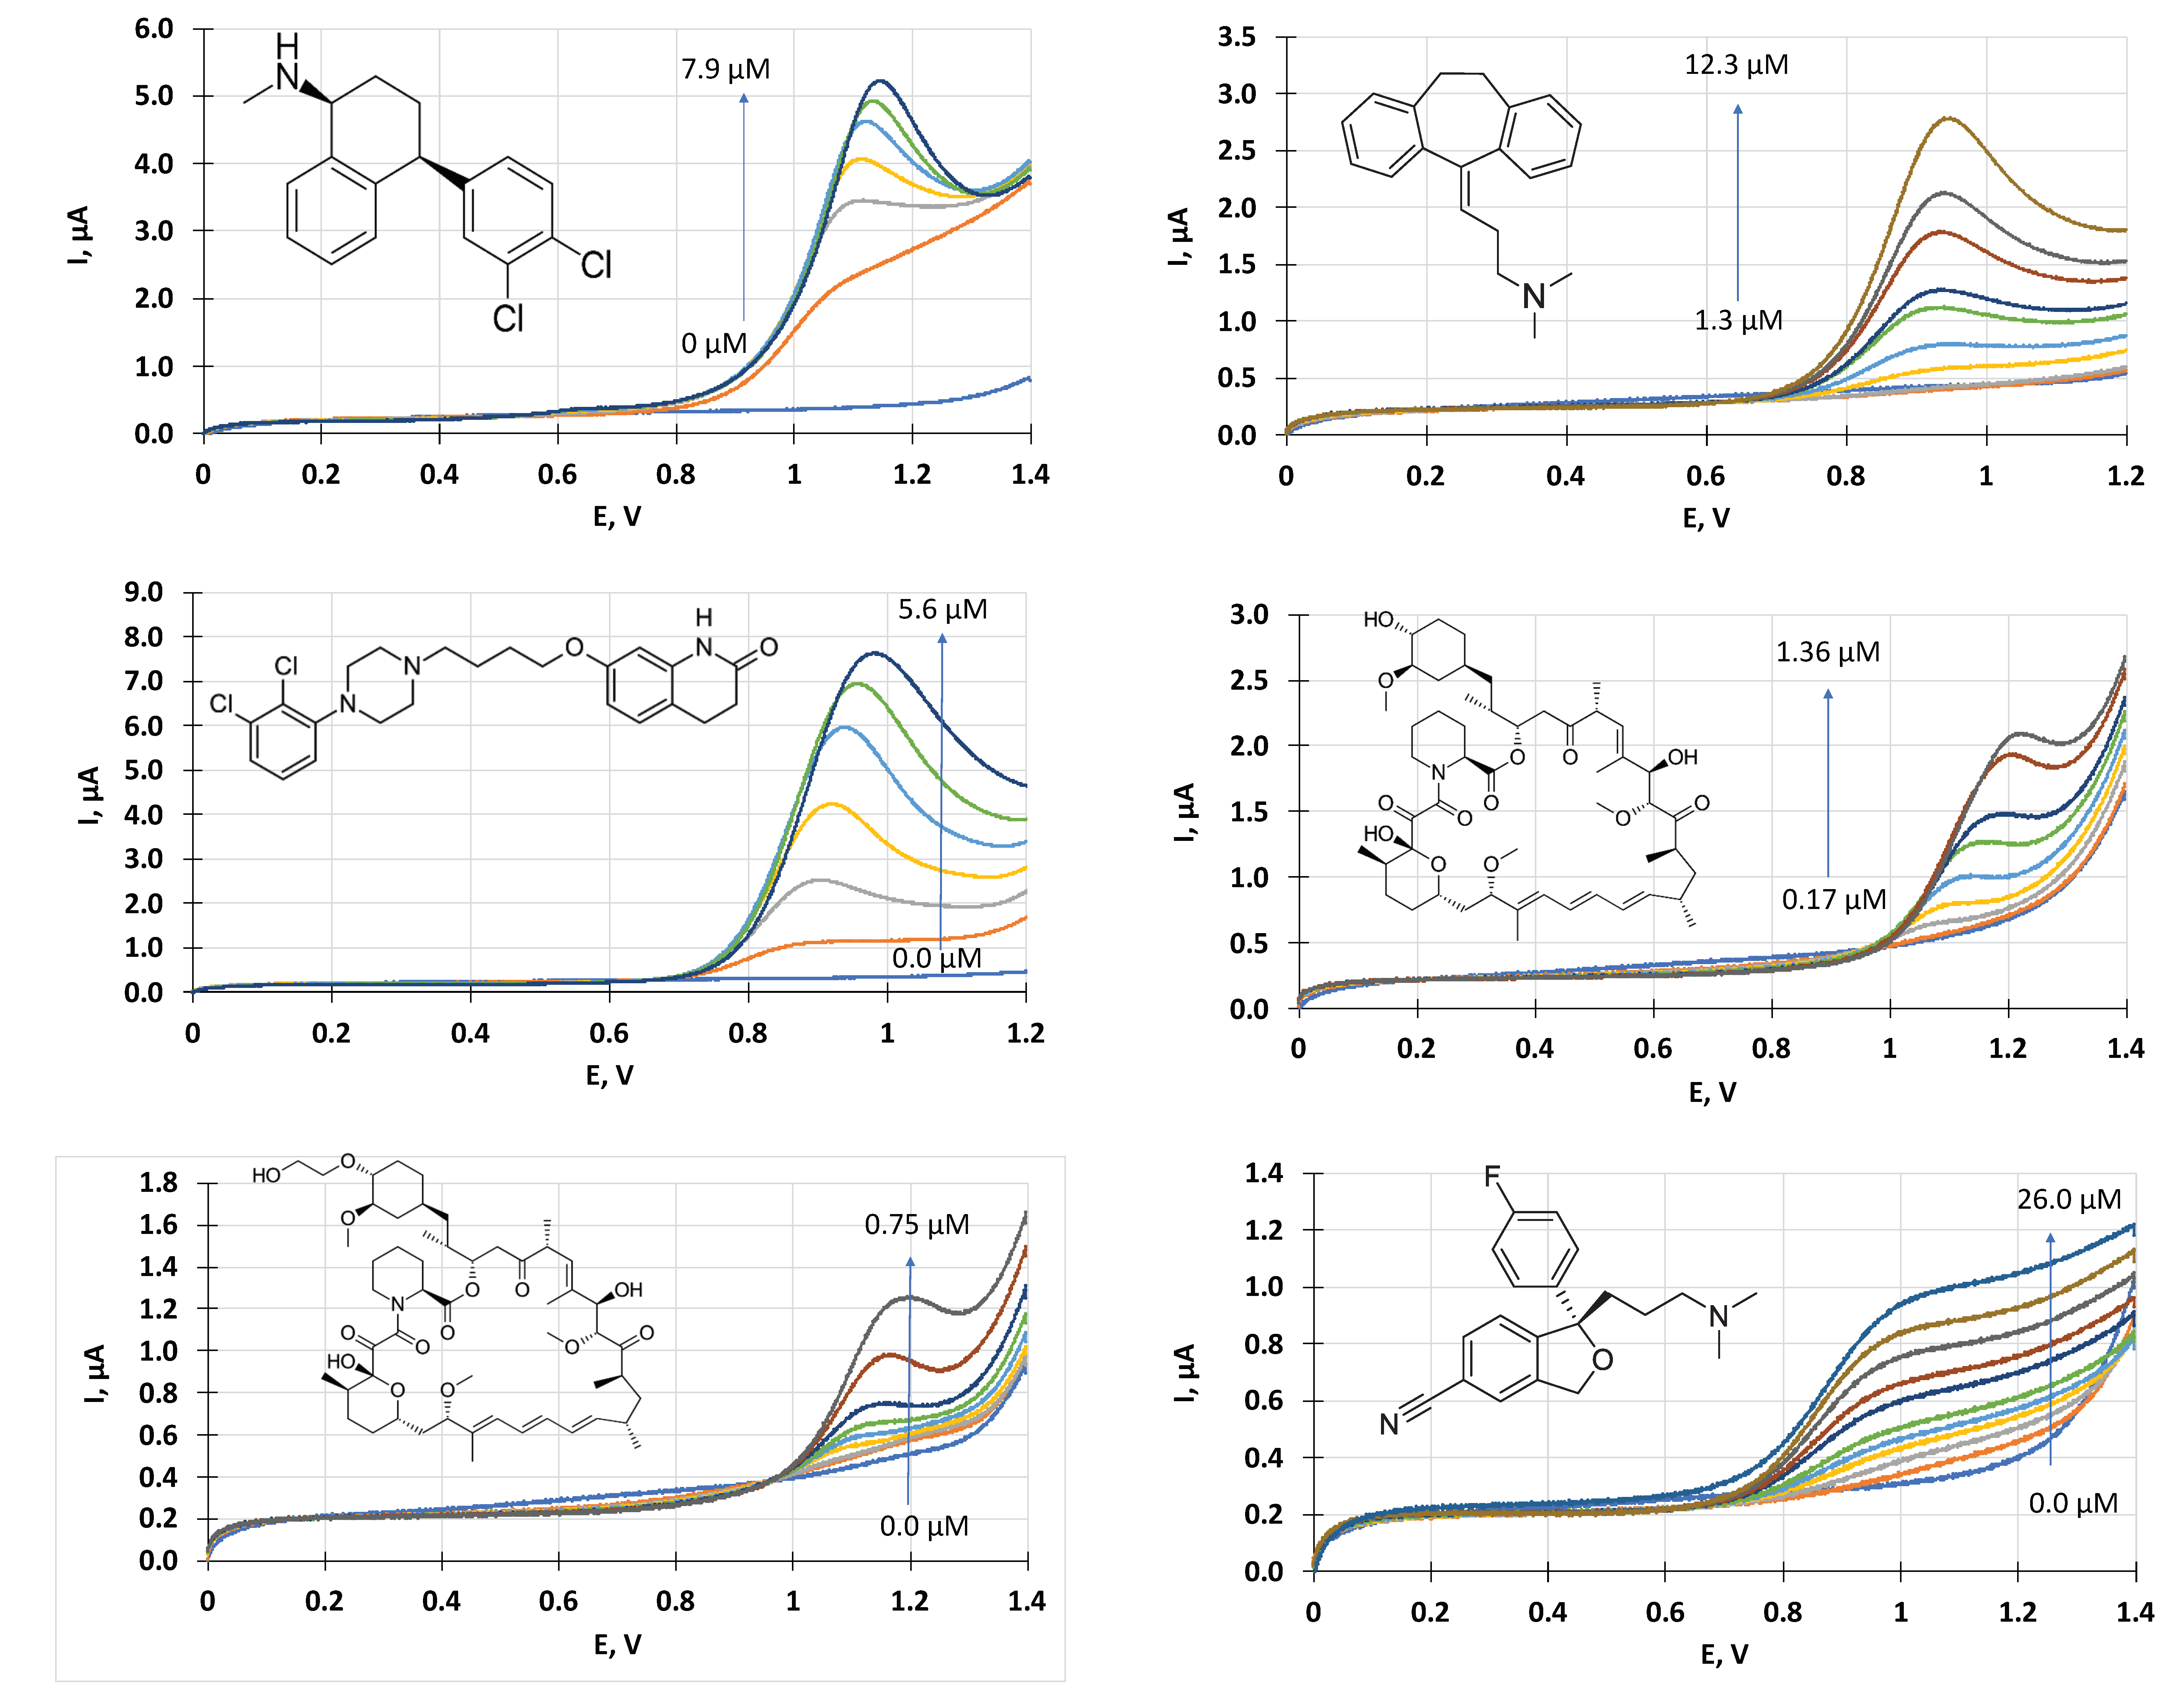
3. Results
Voltammetric Measurement of Highly Lipophilic Molecules
4. Conclusions
Author Contributions
Funding
Conflicts of Interest
References
- Zdrachek, E.; Bakker, E. Potentiometric Sensing. Anal. Chem. 2019, 91, 2–26. [Google Scholar] [CrossRef] [PubMed] [Green Version]
- Lindner, E.; Buck, R.P. Microfabricated Potentiometric Electrodes and their In Vivo Application. Anal. Chem. 2000, 72, 336A–345A. [Google Scholar] [CrossRef] [PubMed] [Green Version]
- Abbot Point of Care The i-STAT System. Available online: https://www.pointofcare.abbott/us/en/home (accessed on 7 March 2020).
- Phillips, F.; Kaczor, K.; Gandhi, N.; Pendley, B.D.; Danish, R.K.; Neuman, M.R.; Toth, B.; Horvath, V.; Lindner, E. Measurement of Sodium Ion Activity in Undiluted Urine with Cation-Selective Polymeric Membrane Electrodes after the Removal of Interfering Compounds. Talanta 2007, 74, 255–264. [Google Scholar] [CrossRef] [Green Version]
- Sempionatto, J.R.; Jeerapan, I.; Krishnan, S.; Wang, J. Wearable Chemical Sensors: Emerging Systems for On-Body Analytical Chemistry. Anal. Chem. 2020, 92, 378–396. [Google Scholar] [CrossRef] [PubMed]
- Lindner, E.; Pendley, B.D. A tutorial on the application of ion-selective electrode potentiometry: An analytical method with unique qualities, unexplored opportunities and potential pitfalls; Tutorial. Anal. Chim. Acta 2013, 762, 1–13. [Google Scholar] [CrossRef]
- Murray, R.W.; Ewing, A.G.; Durst, R.A. Chemically Modified Electrodes—Molecular Design for Electroanalysis. Anal. Chem. 1987, 59, A379. [Google Scholar] [CrossRef]
- Guadalupe, A.R.; Abruña, H.D. Electroanalysis with Chemically Modified Electrodes. Anal. Chem. 1985, 57, 142–149. [Google Scholar] [CrossRef]
- Cattrall, R.W.; Freiser, H. Coated wire ion selective electrodes. Anal. Chem. 1971, 43, 1905–1906. [Google Scholar] [CrossRef]
- Buck, R.P.; Lindner, E. Studies of potential generation accross membrane sensors at interfaces and through bulk. Acc. Chem. Res. 1998, 31, 257–266. [Google Scholar] [CrossRef]
- Fibbioli, M.; Morf, W.E.; Badertscher, M.; de Rooij, N.F.; Pretsch, E. Potential drifts of solid-contacted ion-selective electrodes due to zero-current ion fluxes through the sensor membrane. Electroanalysis 2000, 12, 1286–1292. [Google Scholar] [CrossRef]
- Hambly, B.; Guzinski, M.; Pendley, B.; Lindner, E. Evaluation, pitfalls and recommendations for the “water layer test” for solid contact ion-selective electrodes. Electroanalysis 2020, 32, 1–12. [Google Scholar] [CrossRef]
- Organic Electrochemistry, 4th ed; Hammerich, O.; Lund, H. (Eds.) Marcel Dekker: New York, NY, USA, 2001. [Google Scholar]
- Horvai, G.; Pungor, E. Electrochemical Detectors in HPLC and Ion Chromatography. Crit. Rev. Anal. Chem. 1989, 21, 1–28. [Google Scholar] [CrossRef]
- Toth, K.; Stulik, K.; Kutner, W.; Feher, Z.; Lindner, E. Electrochemical Detection in Liquid Flow Analytical Techniques: Characterization and Classification (IUPAC Technical Report). Pure Appl. Chem. 2004, 76, 1119–1138. [Google Scholar] [CrossRef]
- Xiao, T.F.; Wu, F.; Hao, J.; Zhang, M.N.; Yu, P.; Mao, L.Q. In Vivo Analysis with Electrochemical Sensors and Biosensors. Anal. Chem. 2017, 89, 300–313. [Google Scholar] [CrossRef] [PubMed]
- Wisniewski, N.; Moussy, F.; Reichert, W.M. Characterization of Implantable Biosensor Membrane Biofouling. Fres. J. Anal. Chem. 2000, 366, 611–621. [Google Scholar] [CrossRef] [PubMed]
- Wisniewski, N.; Reichert, M. Methods for Reducing Biosensor Membrane Biofouling. Colloid Surf. B 2000, 18, 197–219. [Google Scholar] [CrossRef]
- Amemiya, S.; Kim, J.; Izadyar, A.; Kabagambe, B.; Shen, M.; Ishimatsu, R. Electrochemical Sensing and Imaging Based on Ion Transfer at Liquid/Liquid Interfaces. Electrochim. Acta 2013, 110, 836–845. [Google Scholar] [CrossRef] [Green Version]
- Izadyar, A. Stripping Voltammetry at the Interface Between Two Immiscible Electrolyte Solutions: A Review Paper. Electroanalysis 2018, 30, 2210–2221. [Google Scholar] [CrossRef]
- Izadyar, A.; Kim, Y.; Ward, M.M.; Amemiya, S. Double-Polymer-Modified Pencil Lead for Stripping Voltammetry of Perchlorate in Drinking Water. J. Chem. Ed. 2012, 89, 1323–1326. [Google Scholar] [CrossRef]
- Kim, Y.; Rodgers, P.J.; Ishimatsu, R.; Amemiya, S. Subnanomolar Ion Detection by Stripping Voltammetry with Solid-Supported Thin Polymeric Membrane. Anal. Chem. 2009, 81, 7262–7270. [Google Scholar] [CrossRef]
- Kim, Y.; Amemiya, S. Stripping analysis of nanomolar perchlorate in drinking water with a voltammetric ion-selective electrode based on thin-layer liquid membrane. Anal. Chem. 2008, 80, 6056–6065. [Google Scholar] [CrossRef] [PubMed]
- Kabagambe, B.; Izadyar, A.; Amemiya, S. Stripping Voltammetry of Nanomolar Potassium and Ammonium Ions Using a Valinomycin-Doped Double-Polymer Electrode. Anal. Chem. 2012, 84, 7979–7986. [Google Scholar] [CrossRef] [PubMed]
- Guo, J.D.; Yuan, Y.; Amemiya, S. Voltammetric Detection of Heparin at Polarized Blood Plasma/1,2-Dichloroethane Interfaces. Anal. Chem. 2005, 77, 5711–5719. [Google Scholar] [CrossRef] [PubMed]
- Amemiya, S.; Kim, Y.; Ishimatsu, R.; Kabagambe, B. Electrochemical Heparin Sensing at Liquid/Liquid Interfaces and Polymeric Membranes. Anal. Bioanal. Chem. 2011, 399, 571–579. [Google Scholar] [CrossRef]
- Amemiya, S.; Yang, X.; Wazenegger, L. Voltammetry of the Phase Transfer of Polypeptide Protamines across Polarized Liquid/Liquid Interfaces. J. Am. Chem. Soc. 2003, 125, 11832–11833. [Google Scholar] [CrossRef]
- Suárez-Herrera, M.F.; Scanlon, M.D. Quantitative Analysis of Redox-Inactive Ions by AC Voltammetry at a Polarised Interface between Two Immiscible Electrolyte Solutions. Anal. Chem. 2020. [Google Scholar] [CrossRef]
- Amemiya, S. Voltammetric Ion Selectivity of Thin Ionophore-Based Polymeric Membranes: Kinetic Effect of Ion Hydrophilicity. Anal. Chem. 2016, 88, 8893–8901. [Google Scholar] [CrossRef] [Green Version]
- Kabagambe, B.; Garada, M.B.; Ishimatsu, R.; Amemiya, S. Subnanomolar Detection Limit of Stripping Voltammetric Ca2+-Selective Electrode: Effects of Analyte Charge and Sample Contamination. Anal. Chem. 2014, 86, 7939–7946. [Google Scholar] [CrossRef]
- Kivlehan, F.; Garay, F.; Guo, J.D.; Chaum, E.; Lindner, E. Toward Feedback-Controlled Anesthesia: Voltamrnetric Measurement of Propofol (2,6-Diisopropylphenol) in Serum-Like Electrolyte Solutions. Anal. Chem. 2012, 84, 7670–7676. [Google Scholar] [CrossRef]
- Langmaier, J.; Garay, F.; Kivlehan, F.; Chaum, E.; Lindner, E. Electrochemical quantification of 2,6-diisopropylphenol (propofol). Anal. Chim. Acta 2011, 704, 63–67. [Google Scholar] [CrossRef]
- Srivastava, A.K.; Upadhyay, S.S.; Rawool, C.R.; Punde, N.S.; Rajpurohit, A.S. Voltammetric Techniques for the Analysis of Drugs using Nanomaterials based Chemically Modified Electrodes. Curr. Anal. Chem. 2019, 15, 249–276. [Google Scholar] [CrossRef]
- Pysarevska, S.; Plotycya, S.; Dubenska, L. Voltammetry of Local Anesthetics: Theoretical and Practical Aspects. Crit. Rev. Anal. Chem. 2020. [Google Scholar] [CrossRef]
- Amatore, C.; Da Mota, N.; Lemmer, C.; Pebay, C.C.S.; Thouin, L. Theory and Experiments of Transport at Channel Microband Electrodes under Laminar Flows. 2. Electrochemical Regimes at Double Microband Assemblies under Steady State. Anal. Chem. 2008, 80, 9483–9490. [Google Scholar] [CrossRef] [Green Version]
- Bodor, S.; Zook, J.M.; Lindner, E.; Toth, K.; Gyurcsanyi, R.E. Chronopotentiometric Method for the Assessment of Ionophore Diffusion Coefficients in Solvent Ppolymeric Membranes. J. Solid State Electrochem. 2009, 13, 171–179. [Google Scholar] [CrossRef]
- Sheppard, J.B. Voltammetric Determination of Diffusion and Partition Coefficients in Plasticized Polymer Membranes; University of Memphis: Memphis, TN, USA, 2016. [Google Scholar]
- Takacs-Novak, K.; Avdeef, A. Interlaboratory Study of log P Determination by Shake-Flask and Potentiometric Methods. J. Pharm. Biomed. 1996, 14, 1405–1413. [Google Scholar] [CrossRef]
- Sheppard, J.B.; Hambly, B.; Pendley, B.; Lindner, E. Voltammetric Determination Of Diffusion Coefficients In Polymer Membranes. Analyst 2017, 142, 930–937. [Google Scholar] [CrossRef]
- Rainey, F.; Kivlehan, F.; Chaum, E.; Lindner, E. Toward Feedback Controlled Anesthesia: Automated Flow Analytical System for Electrochemical Monitoring of Propofol in Serum. Electroanalysis 2014, 26, 1–9. [Google Scholar] [CrossRef]
- Kivlehan, F.; Chaum, E.; Lindner, E. Propofol Detection and Quantification in Human Bblood: The Promise of Feedback Controlled, Closed-Loop Anesthesia. Analyst 2015, 140, 98–106. [Google Scholar] [CrossRef]
- Pyka, A.; Babuåka, M.; Zachariasz, M. A Comparison of Theoretical Methods of Calculation of Partition Coefficients for Selected Drugs. Acta Pol. Pharm. 2006, 63, 159–167. [Google Scholar]


| Macroelectrode, Equation (6) | 337 | 1066 | 0.11 | 0.35 |
| Microelectrode, Equation (7) | 18.0 | 180 | 0.006 | 0.06 |
| Membrane Composition * | Background | Concentration Range † [μmol/L] | LOD [μmol/L] | Resolution [μmol/L] |
|---|---|---|---|---|
| o-NPOE plasticizer | PBS | 0–56.6 | 0.03 ± 0.01 | 1.1 ± 0.2 |
| 3 mmol/L AA | 0–56.6 | 0.05 ± 0.05 | 2.0 ± 1.0 | |
| 1 mmol/L APAP | 0–56.6 | 0.08 ± 0.02 | 4.6 ± 0.9 | |
| 5% BSA | 5–56.6 | 2.2 ± 3.1 | 14 ± 2 | |
| mix | 2.5–109.8 | 0. 5 ± 0.4 | 28 ± 5 | |
| DOS plasticizer | PBS | 0–56.6 | 0.12 ± 0.05 | 4.3 ± 0.4 |
| mix | 0–56.6 | 3.0 ± 0.3 | 4.5 ± 2.3 |
| Sertraline (Zoloft) Antidepressant SSRI |  | log P = 5.06–5.15 MW: 306.229 g/mol Concentration range: 30–200 ng/mL 0.1–0.65 µmol/L |
| Amitriptyline (Elavil) Antidepressant |  | log P = 4.81–5.1 log Pexp = 4.92 [42] MW: 277.403 g/mol Concentration range: 75–175 µg/L 0.27–0.63 µmol/L |
| Aripiprazole (Abilify) Antipsychotic |  | log P = 4.9–5.21 MW: 448.385 g/mol Concentration range: 150 and 300 ng/mL 0.33–0.67 µmol/L |
| Sirolimus (Rapamycin) Immunosuppressant |  | log P = 4.8–7. 5 MW: 914.2 g/mol Concentration range: 4–20 ng/mL 4.4–21.9 nmol/L |
| Everolimus (Zortress) Immunosuppressant |  | log P = 5.0–7.4 MW: 958.240 g/mol Concentration range: 3–8 ng/mL 3.1–8.3 nmol/L |
| Citalopram (Celexa) Antidepressant SSRI |  | log P = 3.6–3.8 MW: 324.392 g/mol Concentration range: 50–100 ng/mL 0.15–0.3 µmol/L |
| Analyte | Method | Matrix | LOD µmol/L | Resolution µmol/L |
|---|---|---|---|---|
| Amitriptyline | LSV | PBS Whole blood | 0.09 ± 0.05 (n = 3) 0.07 ± 0.03 (n = 2) | 0.60 ± 0.2 (n = 3) 0.09 ± 0.03 (n = 2) |
| CA | PBS Whole blood | 0.01 ± 0.03 (n = 5) 0.03 | 0.05 ± 0.02 (n = 3) 0.07 | |
| Sertraline | LSV | PBS | 0.13 | 0.75 |
| CA | PBS | 0.003 | 0.12 | |
| Aripiprazone | LSV | PBS | 0.02 | 0.43 |
| CA | PBS | 0.009 | 0.07 | |
| Sirolimus | LSV | PBS | 0.02 | 0.07 |
| CA | PBS | 0.003 | 0.02 | |
| Everolimus | LSV | PBS | 0.01 | 0.05 |
| CA | PBS | 0.02 | 0.04 | |
| Citalopram | LSV | PBS | 0.6 | 0.7 |
| CA | PBS | 0.008 | 0.08 |
© 2020 by the authors. Licensee MDPI, Basel, Switzerland. This article is an open access article distributed under the terms and conditions of the Creative Commons Attribution (CC BY) license (http://creativecommons.org/licenses/by/4.0/).
Share and Cite
Lindner, E.; Guzinski, M.; Pendley, B.; Chaum, E. Plasticized PVC Membrane Modified Electrodes: Voltammetry of Highly Hydrophobic Compounds. Membranes 2020, 10, 202. https://doi.org/10.3390/membranes10090202
Lindner E, Guzinski M, Pendley B, Chaum E. Plasticized PVC Membrane Modified Electrodes: Voltammetry of Highly Hydrophobic Compounds. Membranes. 2020; 10(9):202. https://doi.org/10.3390/membranes10090202
Chicago/Turabian StyleLindner, Ernő, Marcin Guzinski, Bradford Pendley, and Edward Chaum. 2020. "Plasticized PVC Membrane Modified Electrodes: Voltammetry of Highly Hydrophobic Compounds" Membranes 10, no. 9: 202. https://doi.org/10.3390/membranes10090202