
BCG-Vaccinated Children with Contact to Tuberculosis Patients Show Delayed Conversion of Mycobacterium tuberculosis-Specific IFN-γ Release
 , ,
, ,  ,
,  ,
,  , , and
Abstract
:1. Introduction
2. Material and Methods
2.1. Study Cohorts and Clinical Characterization
2.2. Whole Blood Stimulation Assays and Quantification of IFN-γ
2.3. T-Cell Activation Marker (TAM)-TB Assay
2.4. Statistics
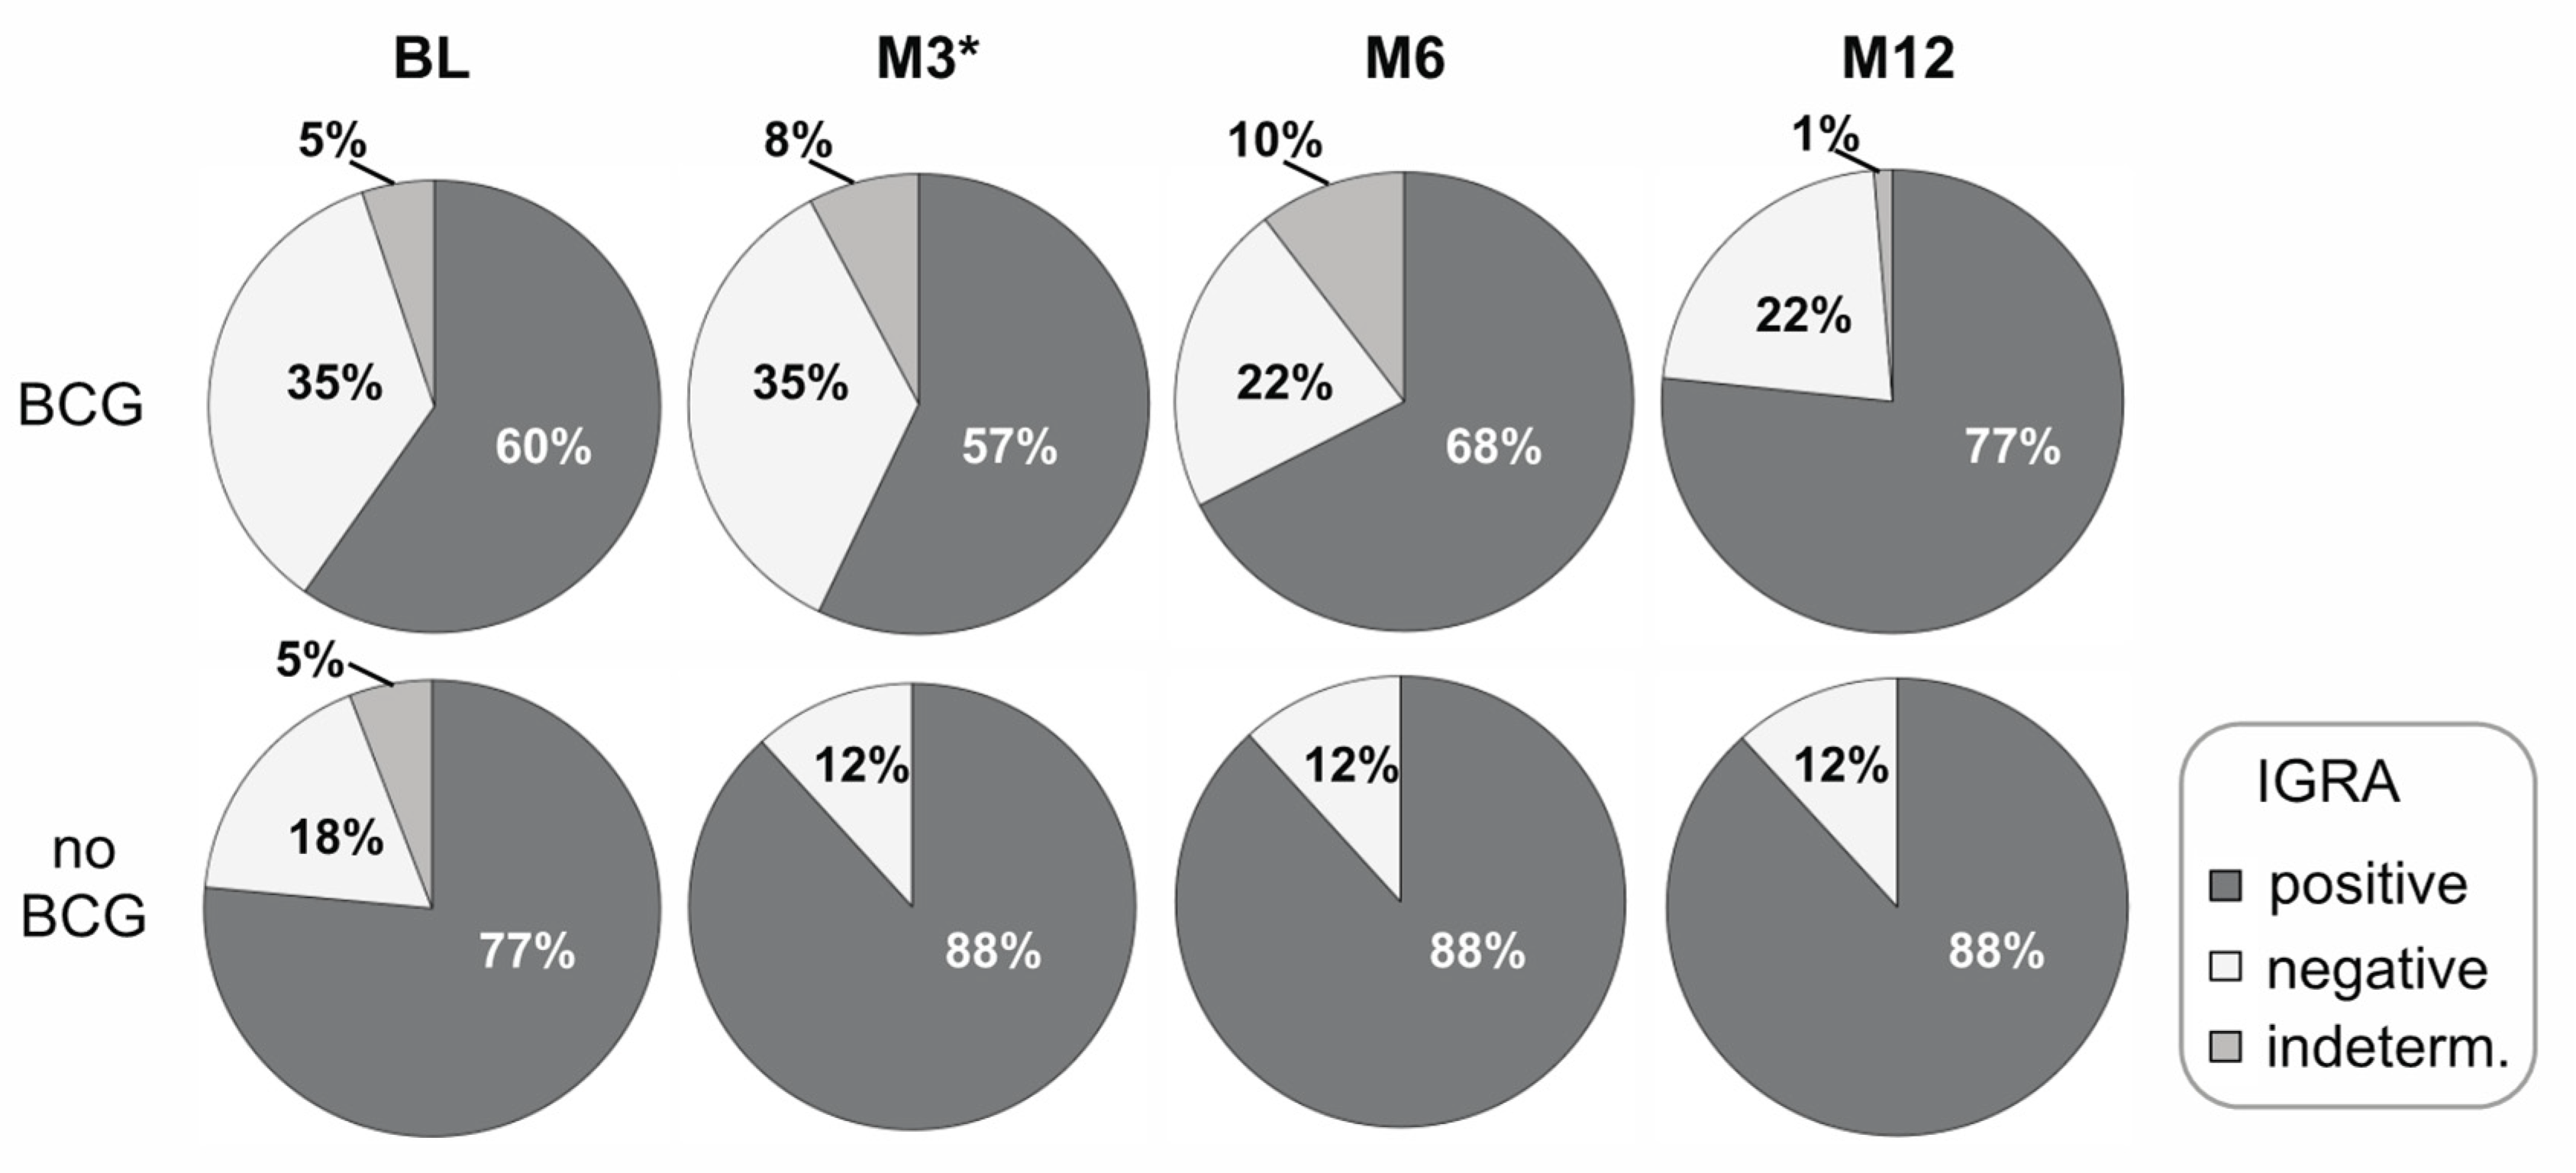
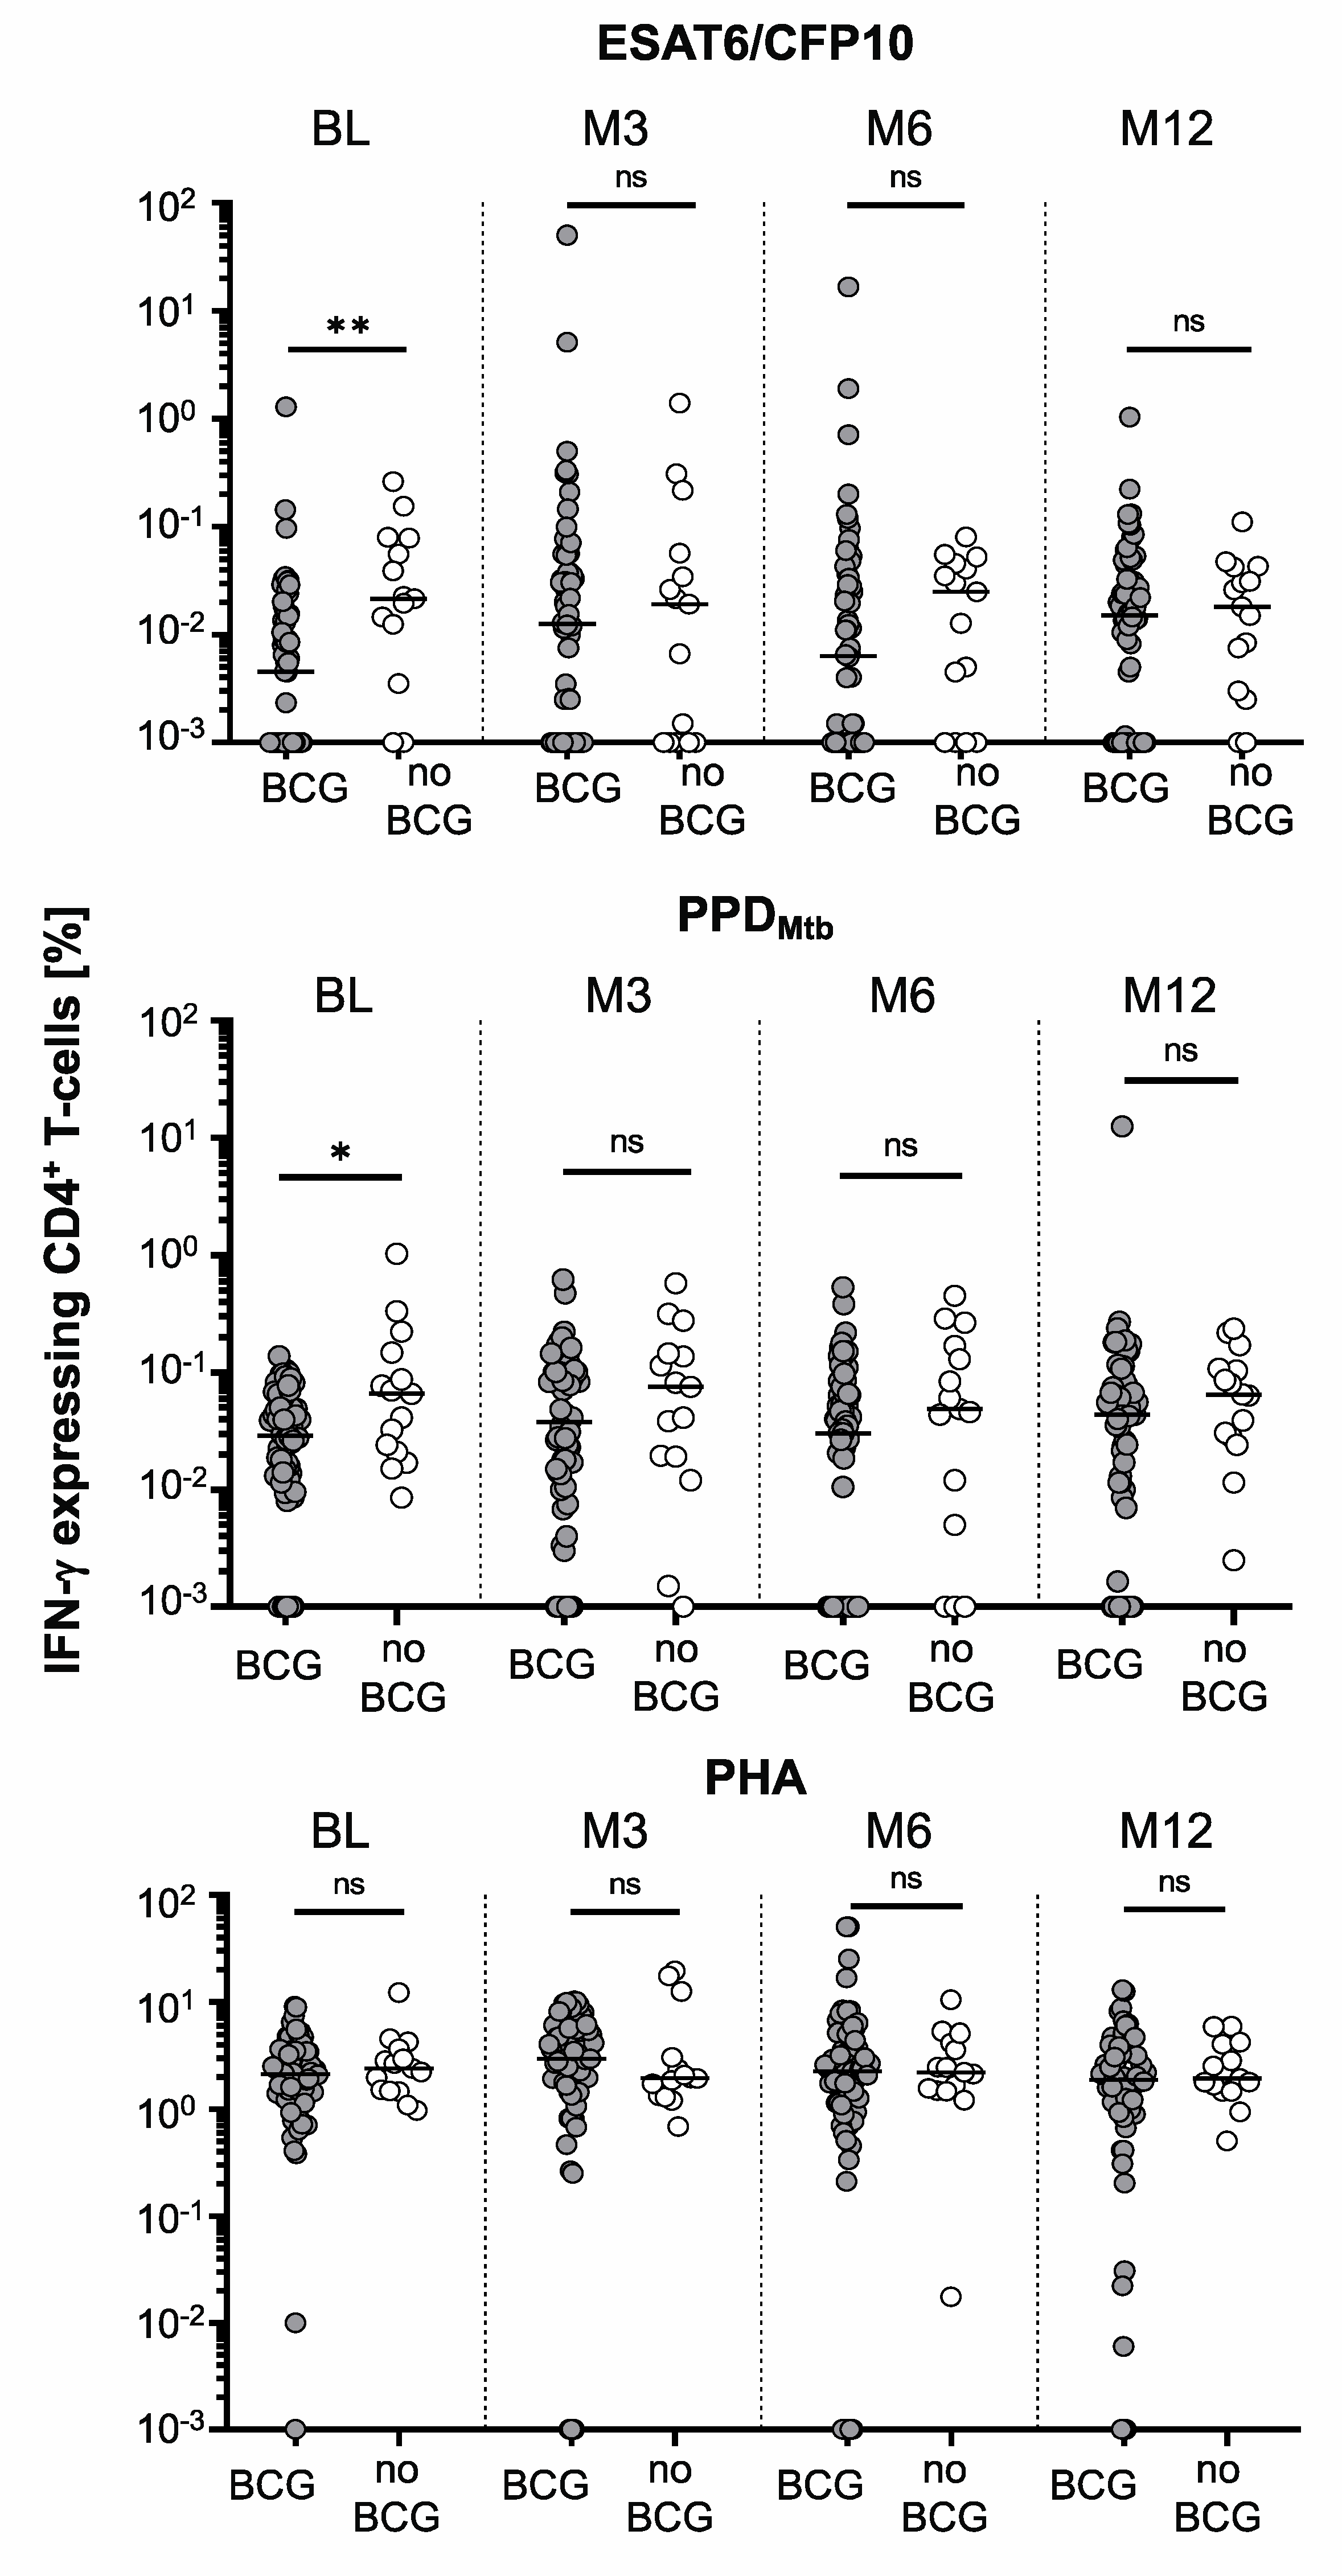
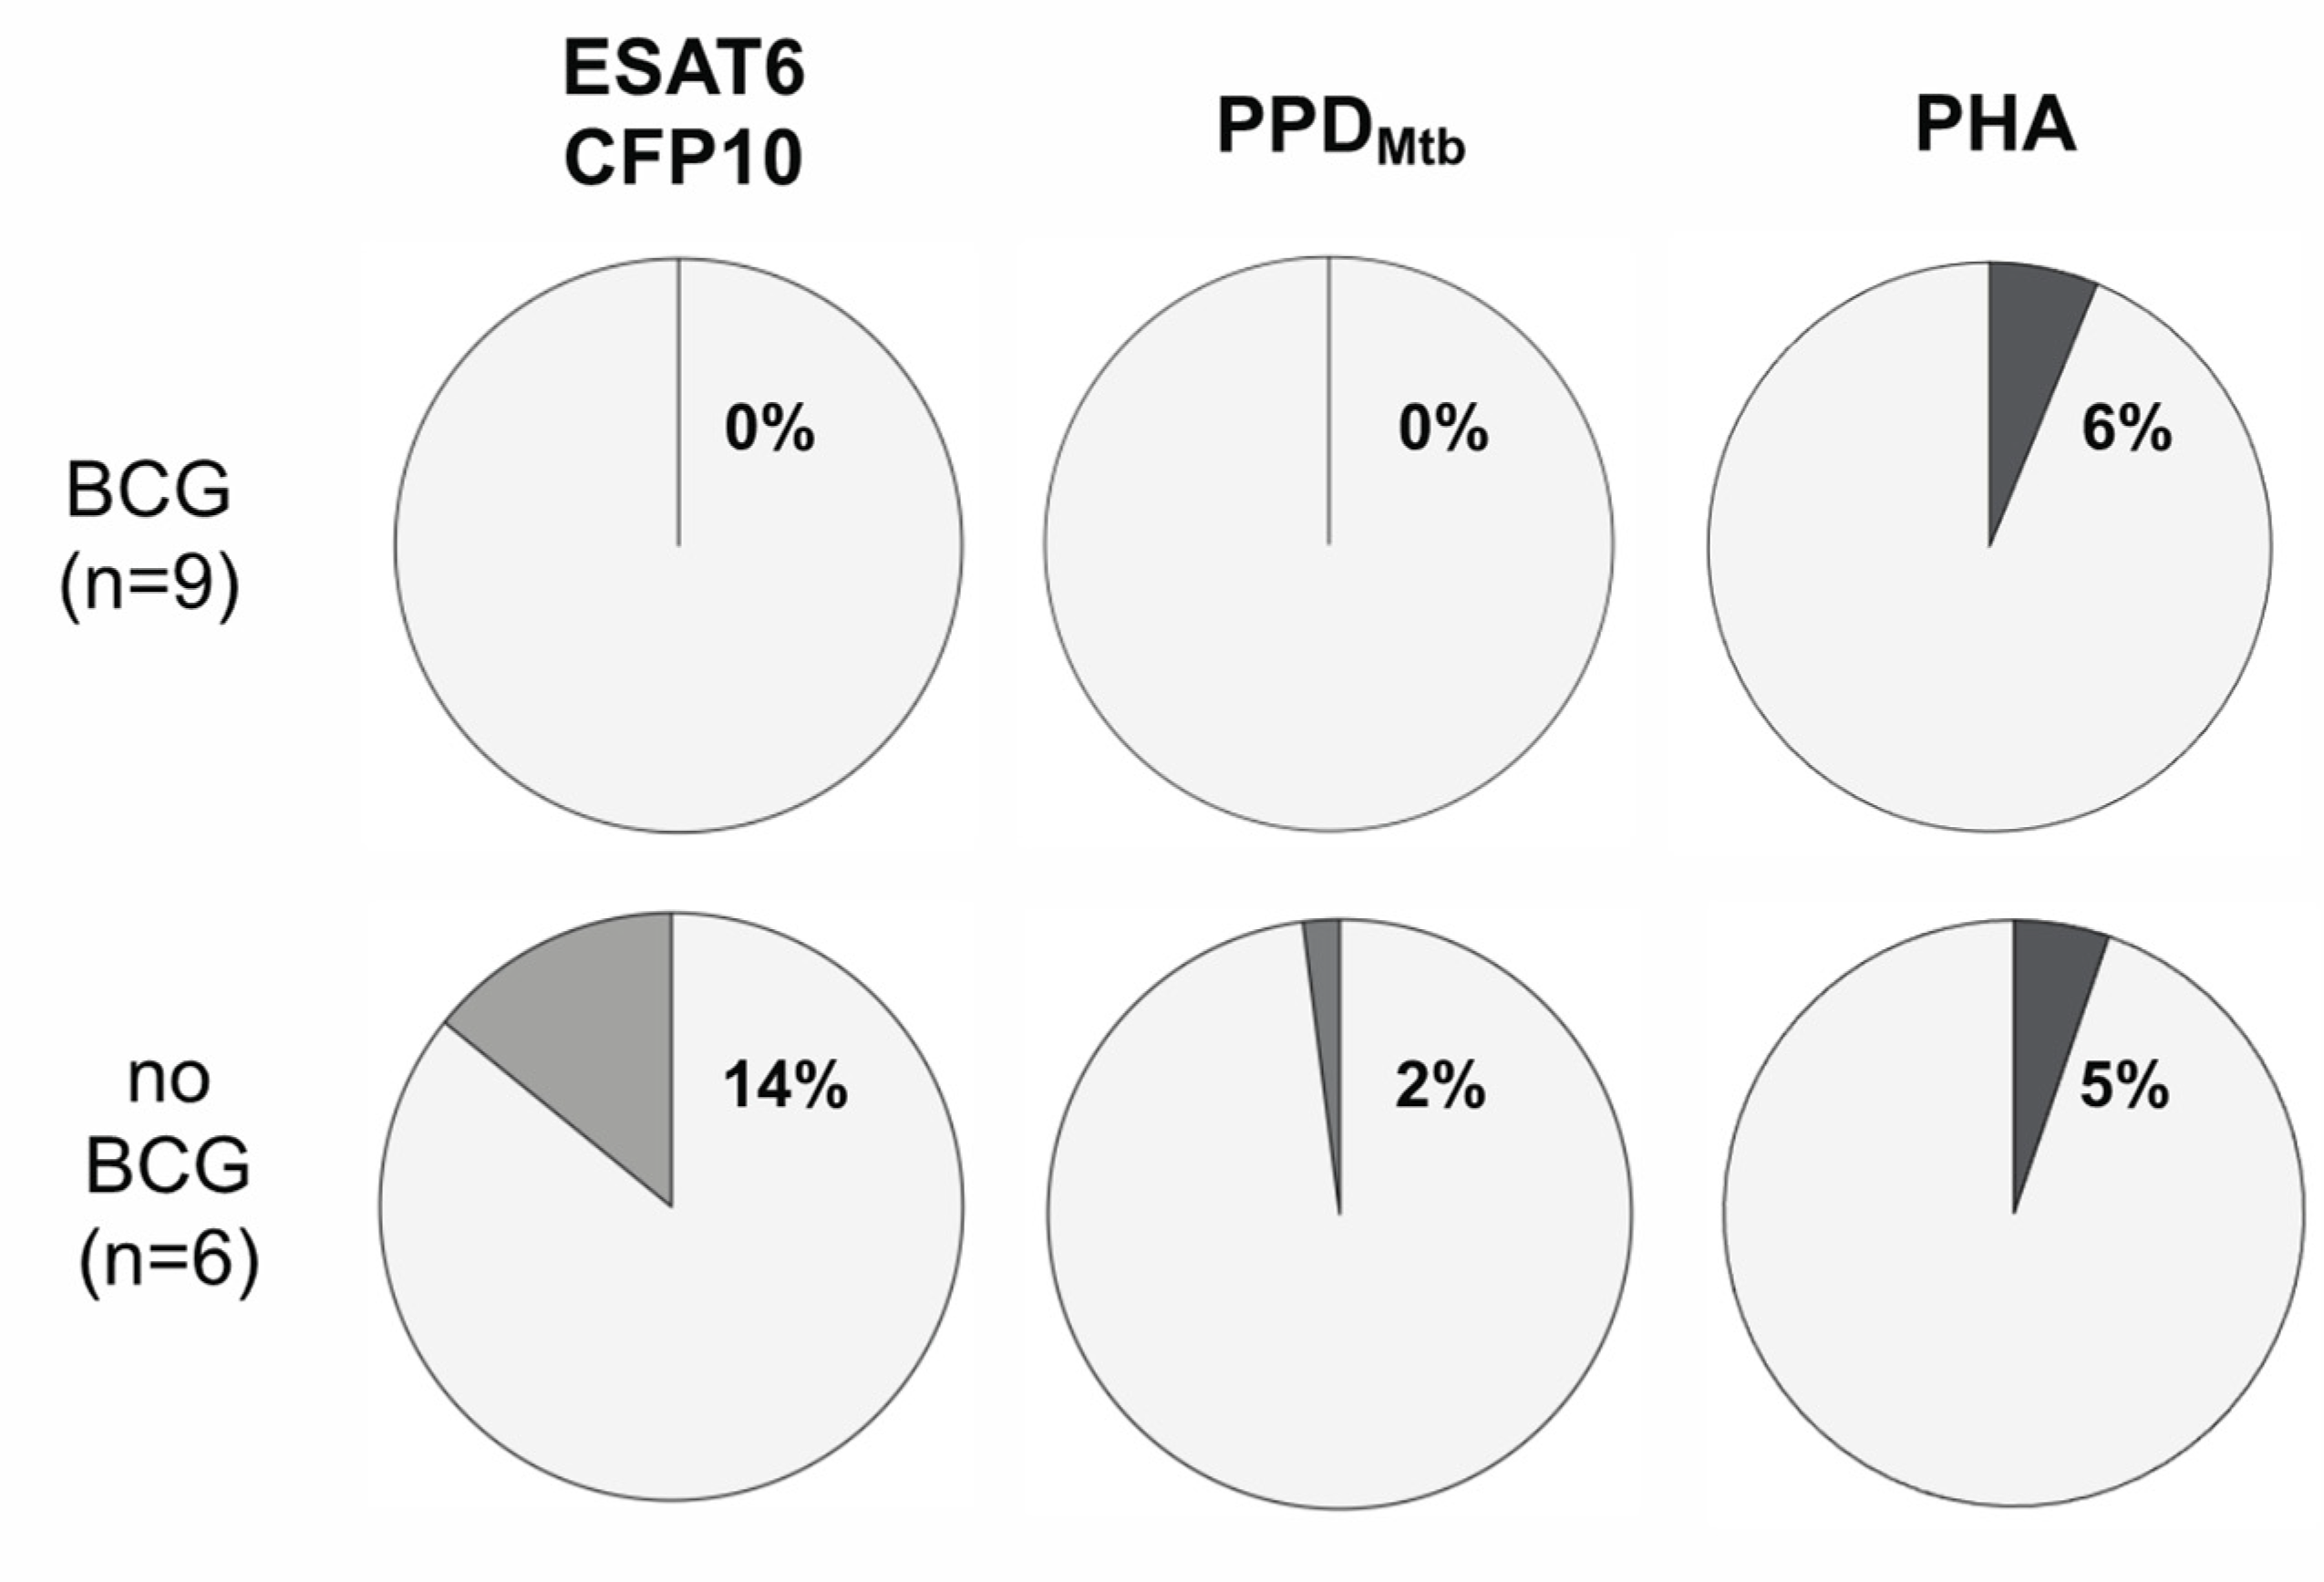
3. Results
4. Discussion
5. Conclusions
Supplementary Materials
Author Contributions
Funding
Institutional Review Board Statement
Informed Consent Statement
Data Availability Statement
Acknowledgments
Conflicts of Interest
References
- Donald, P.R.; Marais, B.J.; Barry, C.E., 3rd. Age and the epidemiology and pathogenesis of tuberculosis. Lancet 2010, 375, 1852–1854. [Google Scholar] [CrossRef] [PubMed]
- Dodd, P.J.; Yuen, C.M.; Sismanidis, C.; Seddon, J.A.; Jenkins, H.E. The global burden of tuberculosis mortality in children: A mathematical modelling study. Lancet Glob. Health 2017, 5, e898–e906. [Google Scholar] [CrossRef] [PubMed]
- World Health Organization. BCG vaccine: WHO position paper, February 2018—Recommendations. Vaccine 2018, 36, 3408–3410. [Google Scholar] [CrossRef] [PubMed]
- Mangtani, P.; Abubakar, I.; Ariti, C.; Beynon, R.; Pimpin, L.; Fine, P.E.; Rodrigues, L.C.; Smith, P.G.; Lipman, M.; Whiting, P.F.; et al. Protection by BCG vaccine against tuberculosis: A systematic review of randomized controlled trials. Clin. Infect. Dis. 2014, 58, 470–480. [Google Scholar] [CrossRef]
- Walzl, G.; Ronacher, K.; Hanekom, W.; Scriba, T.J.; Zumla, A. Immunological biomarkers of tuberculosis. Nat. Rev. Immunol. 2011, 11, 343–354. [Google Scholar] [CrossRef]
- Kroon, E.E.; Kinnear, C.J.; Orlova, M.; Fischinger, S.; Shin, S.; Boolay, S.; Walzl, G.; Jacobs, A.; Wilkinson, R.J.; Alter, G.; et al. An observational study identifying highly tuberculosis-exposed, HIV-1-positive but persistently TB, tuberculin and IGRA negative persons with M. tuberculosis specific antibodies in Cape Town, South Africa. EBioMedicine 2020, 61, 103053. [Google Scholar] [CrossRef]
- Simmons, J.D.; Stein, C.M.; Seshadri, C.; Campo, M.; Alter, G.; Fortune, S.; Schurr, E.; Wallis, R.S.; Churchyard, G.; Mayanja-Kizza, H.; et al. Immunological mechanisms of human resistance to persistent Mycobacterium tuberculosis infection. Nat. Rev. Immunol. 2018, 18, 575–589. [Google Scholar] [CrossRef]
- Lundtoft, C.; Awuah, A.A.; Nausch, N.; Enimil, A.; Mayatepek, E.; Owusu-Dabo, E.; Jacobsen, M. Alternative Quantiferon cytokines for diagnosis of children with active tuberculosis and HIV co-infection in Ghana. Med. Microbiol. Immunol. 2017, 206, 259–265. [Google Scholar] [CrossRef]
- Portevin, D.; Moukambi, F.; Clowes, P.; Bauer, A.; Chachage, M.; Ntinginya, N.E.; Mfinanga, E.; Said, K.; Haraka, F.; Rachow, A.; et al. Assessment of the novel T-cell activation marker-tuberculosis assay for diagnosis of active tuberculosis in children: A prospective proof-of-concept study. Lancet Infect. Dis. 2014, 14, 931–938. [Google Scholar] [CrossRef]
- Verrall, A.J.; Alisjahbana, B.; Apriani, L.; Novianty, N.; Nurani, A.C.; van Laarhoven, A.; Ussher, J.E.; Indrati, A.; Ruslami, R.; Netea, M.G.; et al. Early Clearance of Mycobacterium tuberculosis: The INFECT Case Contact Cohort Study in Indonesia. J. Infect. Dis. 2020, 221, 1351–1360. [Google Scholar] [CrossRef]
- Lalvani, A.; Seshadri, C. Understanding How BCG Vaccine Protects Against Mycobacterium tuberculosis Infection: Lessons From Household Contact Studies. J. Infect. Dis. 2020, 221, 1229–1231. [Google Scholar] [CrossRef] [PubMed]
- Ewer, K.; Deeks, J.; Alvarez, L.; Bryant, G.; Waller, S.; Andersen, P.; Monk, P.; Lalvani, A. Comparison of T-cell-based assay with tuberculin skin test for diagnosis of Mycobacterium tuberculosis infection in a school tuberculosis outbreak. Lancet 2003, 361, 1168–1173. [Google Scholar] [CrossRef] [PubMed]
- Adankwah, E.; Nausch, N.; Minadzi, D.; Abass, M.K.; Franken, K.; Ottenhoff, T.H.M.; Mayatepek, E.; Phillips, R.O.; Jacobsen, M. Interleukin-6 and Mycobacterium tuberculosis dormancy antigens improve diagnosis of tuberculosis. J. Infect. 2021, 82, 245–252. [Google Scholar] [CrossRef] [PubMed]
- Nausch, N.; Lundtoft, C.; Schulz, G.; Henckel, H.; Mayatepek, E.; Fleischer, B.; Marx, F.M.; Jacobsen, M. Multiple cytokines for the detection of Mycobacterium tuberculosis infection in children with tuberculosis. Int. J. Tuberc. Lung Dis. 2017, 21, 270–277. [Google Scholar] [CrossRef]
- Schuck, S.D.; Mueller, H.; Kunitz, F.; Neher, A.; Hoffmann, H.; Franken, K.L.; Repsilber, D.; Ottenhoff, T.H.; Kaufmann, S.H.; Jacobsen, M. Identification of T-cell antigens specific for latent Mycobacterium tuberculosis infection. PLoS ONE 2009, 4, e5590. [Google Scholar] [CrossRef]
- Adankwah, E.; Lundtoft, C.; Guler, A.; Franken, K.; Ottenhoff, T.H.M.; Mayatepek, E.; Owusu-Dabo, E.; Phillips, R.O.; Nausch, N.; Jacobsen, M. Two-Hit in vitro T-Cell Stimulation Detects Mycobacterium tuberculosis Infection in QuantiFERON Negative Tuberculosis Patients and Healthy Contacts From Ghana. Front Immunol. 2019, 10, 1518. [Google Scholar] [CrossRef]
- Ahmed, M.I.M.; Ntinginya, N.E.; Kibiki, G.; Mtafya, B.A.; Semvua, H.; Mpagama, S.; Mtabho, C.; Saathoff, E.; Held, K.; Loose, R.; et al. Phenotypic Changes on Mycobacterium tuberculosis-Specific CD4 T Cells as Surrogate Markers for Tuberculosis Treatment Efficacy. Front. Immunol. 2018, 9, 2247. [Google Scholar] [CrossRef]
- Adekambi, T.; Ibegbu, C.C.; Cagle, S.; Kalokhe, A.S.; Wang, Y.F.; Hu, Y.; Day, C.L.; Ray, S.M.; Rengarajan, J. Biomarkers on patient T cells diagnose active tuberculosis and monitor treatment response. J. Clin. Investig. 2015, 125, 1827–1838. [Google Scholar] [CrossRef]
- Birk, N.M.; Nissen, T.N.; Ladekarl, M.; Zingmark, V.; Kjaergaard, J.; Jensen, T.M.; Jensen, S.K.; Thostesen, L.M.; Kofoed, P.E.; Stensballe, L.G.; et al. The association between Bacillus Calmette-Guerin vaccination (1331 SSI) skin reaction and subsequent scar development in infants. BMC Infect. Dis. 2017, 17, 540. [Google Scholar] [CrossRef]
- Lalvani, A.; Sridhar, S. BCG vaccination: 90 years on and still so much to learn. Thorax 2010, 65, 1036–1038. [Google Scholar] [CrossRef]
- Geckin, B.; Konstantin Fohse, F.; Dominguez-Andres, J.; Netea, M.G. Trained immunity: Implications for vaccination. Curr. Opin. Immunol. 2022, 77, 102190. [Google Scholar] [CrossRef] [PubMed]
- Ferluga, J.; Yasmin, H.; Al-Ahdal, M.N.; Bhakta, S.; Kishore, U. Natural and trained innate immunity against Mycobacterium tuberculosis. Immunobiology 2020, 225, 151951. [Google Scholar] [CrossRef] [PubMed]
- Kaufmann, E.; Sanz, J.; Dunn, J.L.; Khan, N.; Mendonca, L.E.; Pacis, A.; Tzelepis, F.; Pernet, E.; Dumaine, A.; Grenier, J.C.; et al. BCG Educates Hematopoietic Stem Cells to Generate Protective Innate Immunity against Tuberculosis. Cell 2018, 172, 176–190.e19. [Google Scholar] [CrossRef] [PubMed]


| BCG Vaccination Status | |||
|---|---|---|---|
| Characteristics | Yes (n = 77) | No (n = 17) | p-Value |
| Age (median, range) | 10 (5–16) | 10 (5–16) | 0.419 |
| Sexmale, n (%) | 35 (45.5) | 8 (47.1) | 0.999 |
| Co-infections, n (%) | |||
| Schistosoma haematobium | 2 (2.6) | 1 (5.9) | 0.454 |
| Plasmodium falciparum | 30 (37.0) | 9 (52.9) | 0.415 |
| Giardia lamblia | 2 (2.6) | 1 (5.9) | 0.454 |
| Ascaris lumbricoides | 5 (6.5) | 0 (0) | 0.581 |
| Hookworm | 3 (3.9) | 0 (0) | 0.999 |
| Mansonella perstans | 2 (2.6) | 0 (0) | 0.999 |
| Disease History, n (%) | |||
| Diabetes | 2 (2.6) | 0 (0) | 0.999 |
| Gastrointestinal diseases | 1 (1.3) | 0 (0) | 0.999 |
| Allergy | 1 (1.3) | 0 (0) | 0.999 |
| Period of exposure to index tuberculosis patients, n (%) | |||
| 1 month | 4 (5.2) | 0 (0) | 0.395 |
| 2 months | 31 (40.3) | 5 (29.4) | |
| 3 months | 39 (50.6) | 10 (58.8) | |
| 6 months | 3 (3.9) | 2 (11.8) | |
| BCG Vaccination Status | |||
|---|---|---|---|
| Timepoint/ Stimulus | Yes (n = 77) median (range) | No. (n = 17) median (range) | p-Value |
| BL | |||
| PHA | 310 (0–4394) | 191 (0–4025) | 0.763 |
| PPD | 109 (0–4458) | 359 (0–2310) | 0.013 |
| ESAT-6/CFP-10 | 41 (0–1870) | 120 (0–1399) | 0.027 |
| M3 | |||
| PHA | 276 (0–2499) | 422 (43–3494) | 0.304 |
| PPD | 72 (0–2572) | 299 (26–2451) | 0.007 |
| ESAT-6/CFP-10 | 36 (0–1421) | 142 (0–2361) | 0.009 |
| M6 | |||
| PHA | 484 (0–5681) | 358 (0–3698) | 0.753 |
| PPD | 99 (0–5425) | 217 (16–2629) | 0.110 |
| ESAT-6/CFP-10 | 86 (0–3963) | 141 (0–5523) | 0.190 |
| M12 | |||
| PHA | 476 (0–4358) | 845 (0–2350) | 0.598 |
| PPD | 149 (0–4722) | 400 (0–1769) | 0.019 |
| ESAT-6/CFP-10 | 56 (0–5449) | 148 (0–1243) | 0.028 |
| TAM-TB | BCG TAM-TB-Positive, n (%) | Non-BCG TAM-TB-Positive, n (%) | p-Value |
|---|---|---|---|
| BL | 9 (16.3) | 6 (40.0) | 0.032 |
| M3 | 22 (34.4) | 5 (33.3) | 1 |
| M6 | 16 (25.0) | 7 (46.7) | 0.119 |
| M12 | 18 (28.1) | 6 (40.0) | 0.368 |
Disclaimer/Publisher’s Note: The statements, opinions and data contained in all publications are solely those of the individual author(s) and contributor(s) and not of MDPI and/or the editor(s). MDPI and/or the editor(s) disclaim responsibility for any injury to people or property resulting from any ideas, methods, instructions or products referred to in the content. |
© 2023 by the authors. Licensee MDPI, Basel, Switzerland. This article is an open access article distributed under the terms and conditions of the Creative Commons Attribution (CC BY) license (https://creativecommons.org/licenses/by/4.0/).
Share and Cite
Owusu, D.O.; Adankwah, E.; Aniagyei, W.; Acheampong, I.; Minadzi, D.; Yeboah, A.; Arthur, J.F.; Lamptey, M.; Vivekanandan, M.M.; Abass, M.K.; et al. BCG-Vaccinated Children with Contact to Tuberculosis Patients Show Delayed Conversion of Mycobacterium tuberculosis-Specific IFN-γ Release. Vaccines 2023, 11, 855. https://doi.org/10.3390/vaccines11040855
Owusu DO, Adankwah E, Aniagyei W, Acheampong I, Minadzi D, Yeboah A, Arthur JF, Lamptey M, Vivekanandan MM, Abass MK, et al. BCG-Vaccinated Children with Contact to Tuberculosis Patients Show Delayed Conversion of Mycobacterium tuberculosis-Specific IFN-γ Release. Vaccines. 2023; 11(4):855. https://doi.org/10.3390/vaccines11040855
Chicago/Turabian StyleOwusu, Dorcas O., Ernest Adankwah, Wilfred Aniagyei, Isaac Acheampong, Difery Minadzi, Augustine Yeboah, Joseph F. Arthur, Millicent Lamptey, Monika M. Vivekanandan, Mohammed K. Abass, and et al. 2023. "BCG-Vaccinated Children with Contact to Tuberculosis Patients Show Delayed Conversion of Mycobacterium tuberculosis-Specific IFN-γ Release" Vaccines 11, no. 4: 855. https://doi.org/10.3390/vaccines11040855