

Cost-Effectiveness of Vaccination of Older Adults with an MF59®-Adjuvanted Quadrivalent Influenza Vaccine Compared to Standard-Dose and High-Dose Vaccines in Denmark, Norway, and Sweden
 , , ,
, , ,
Abstract
:1. Introduction
2. Materials and Methods
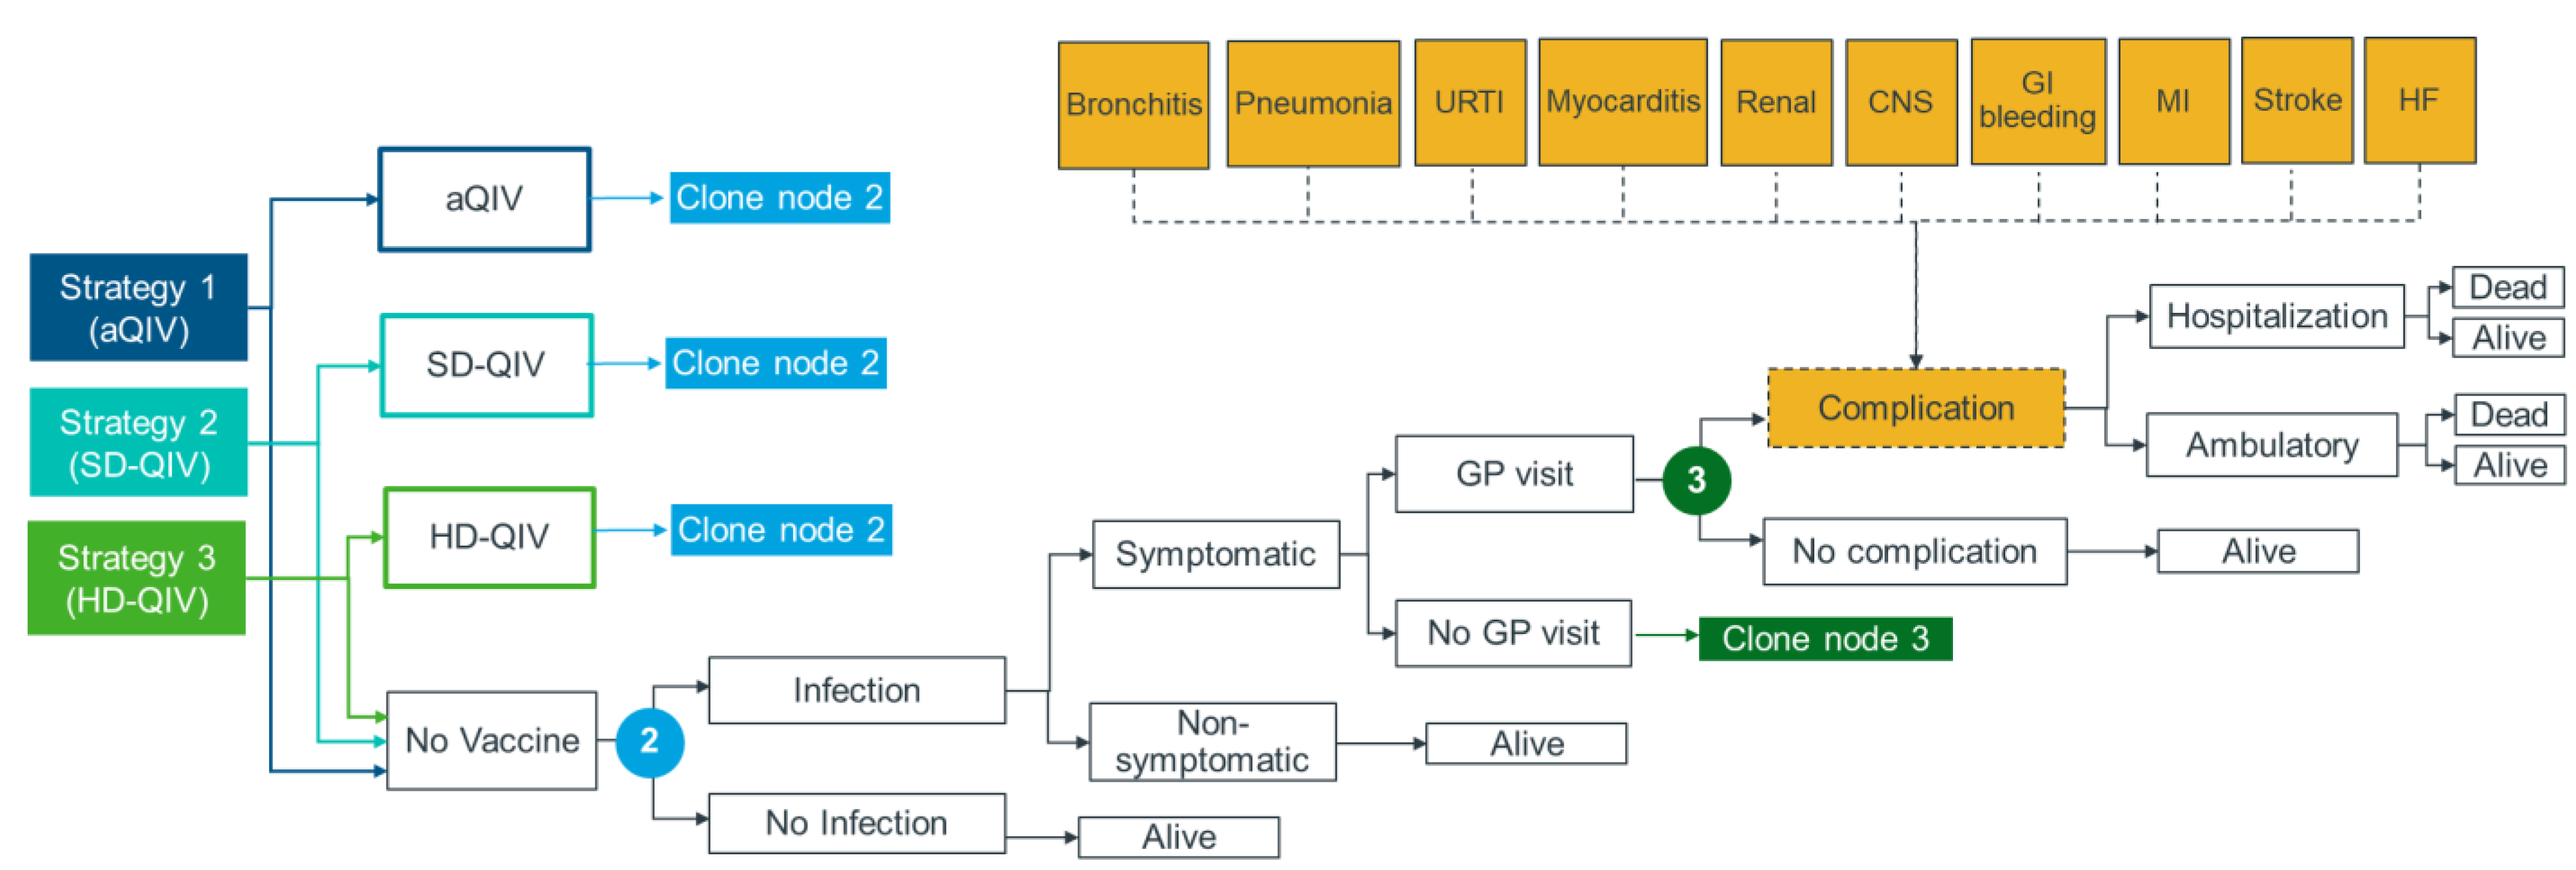
2.1. Model Framework
2.2. Study Population and Analyses Settings
2.3. Model Inputs
2.3.1. Influenza Attack Rate
2.3.2. Vaccination Strategy and Coverage Rates
2.3.3. Vaccine Effectiveness
2.3.4. Clinical Inputs
2.3.5. Health-Related Quality of Life Inputs
2.3.6. Costs and Resource Use Inputs
2.4. Cost-Effectiveness Analysis
2.5. Scenario and Sensitivity Analyses
3. Results
3.1. Base Case Results
3.2. Scenario Analysis
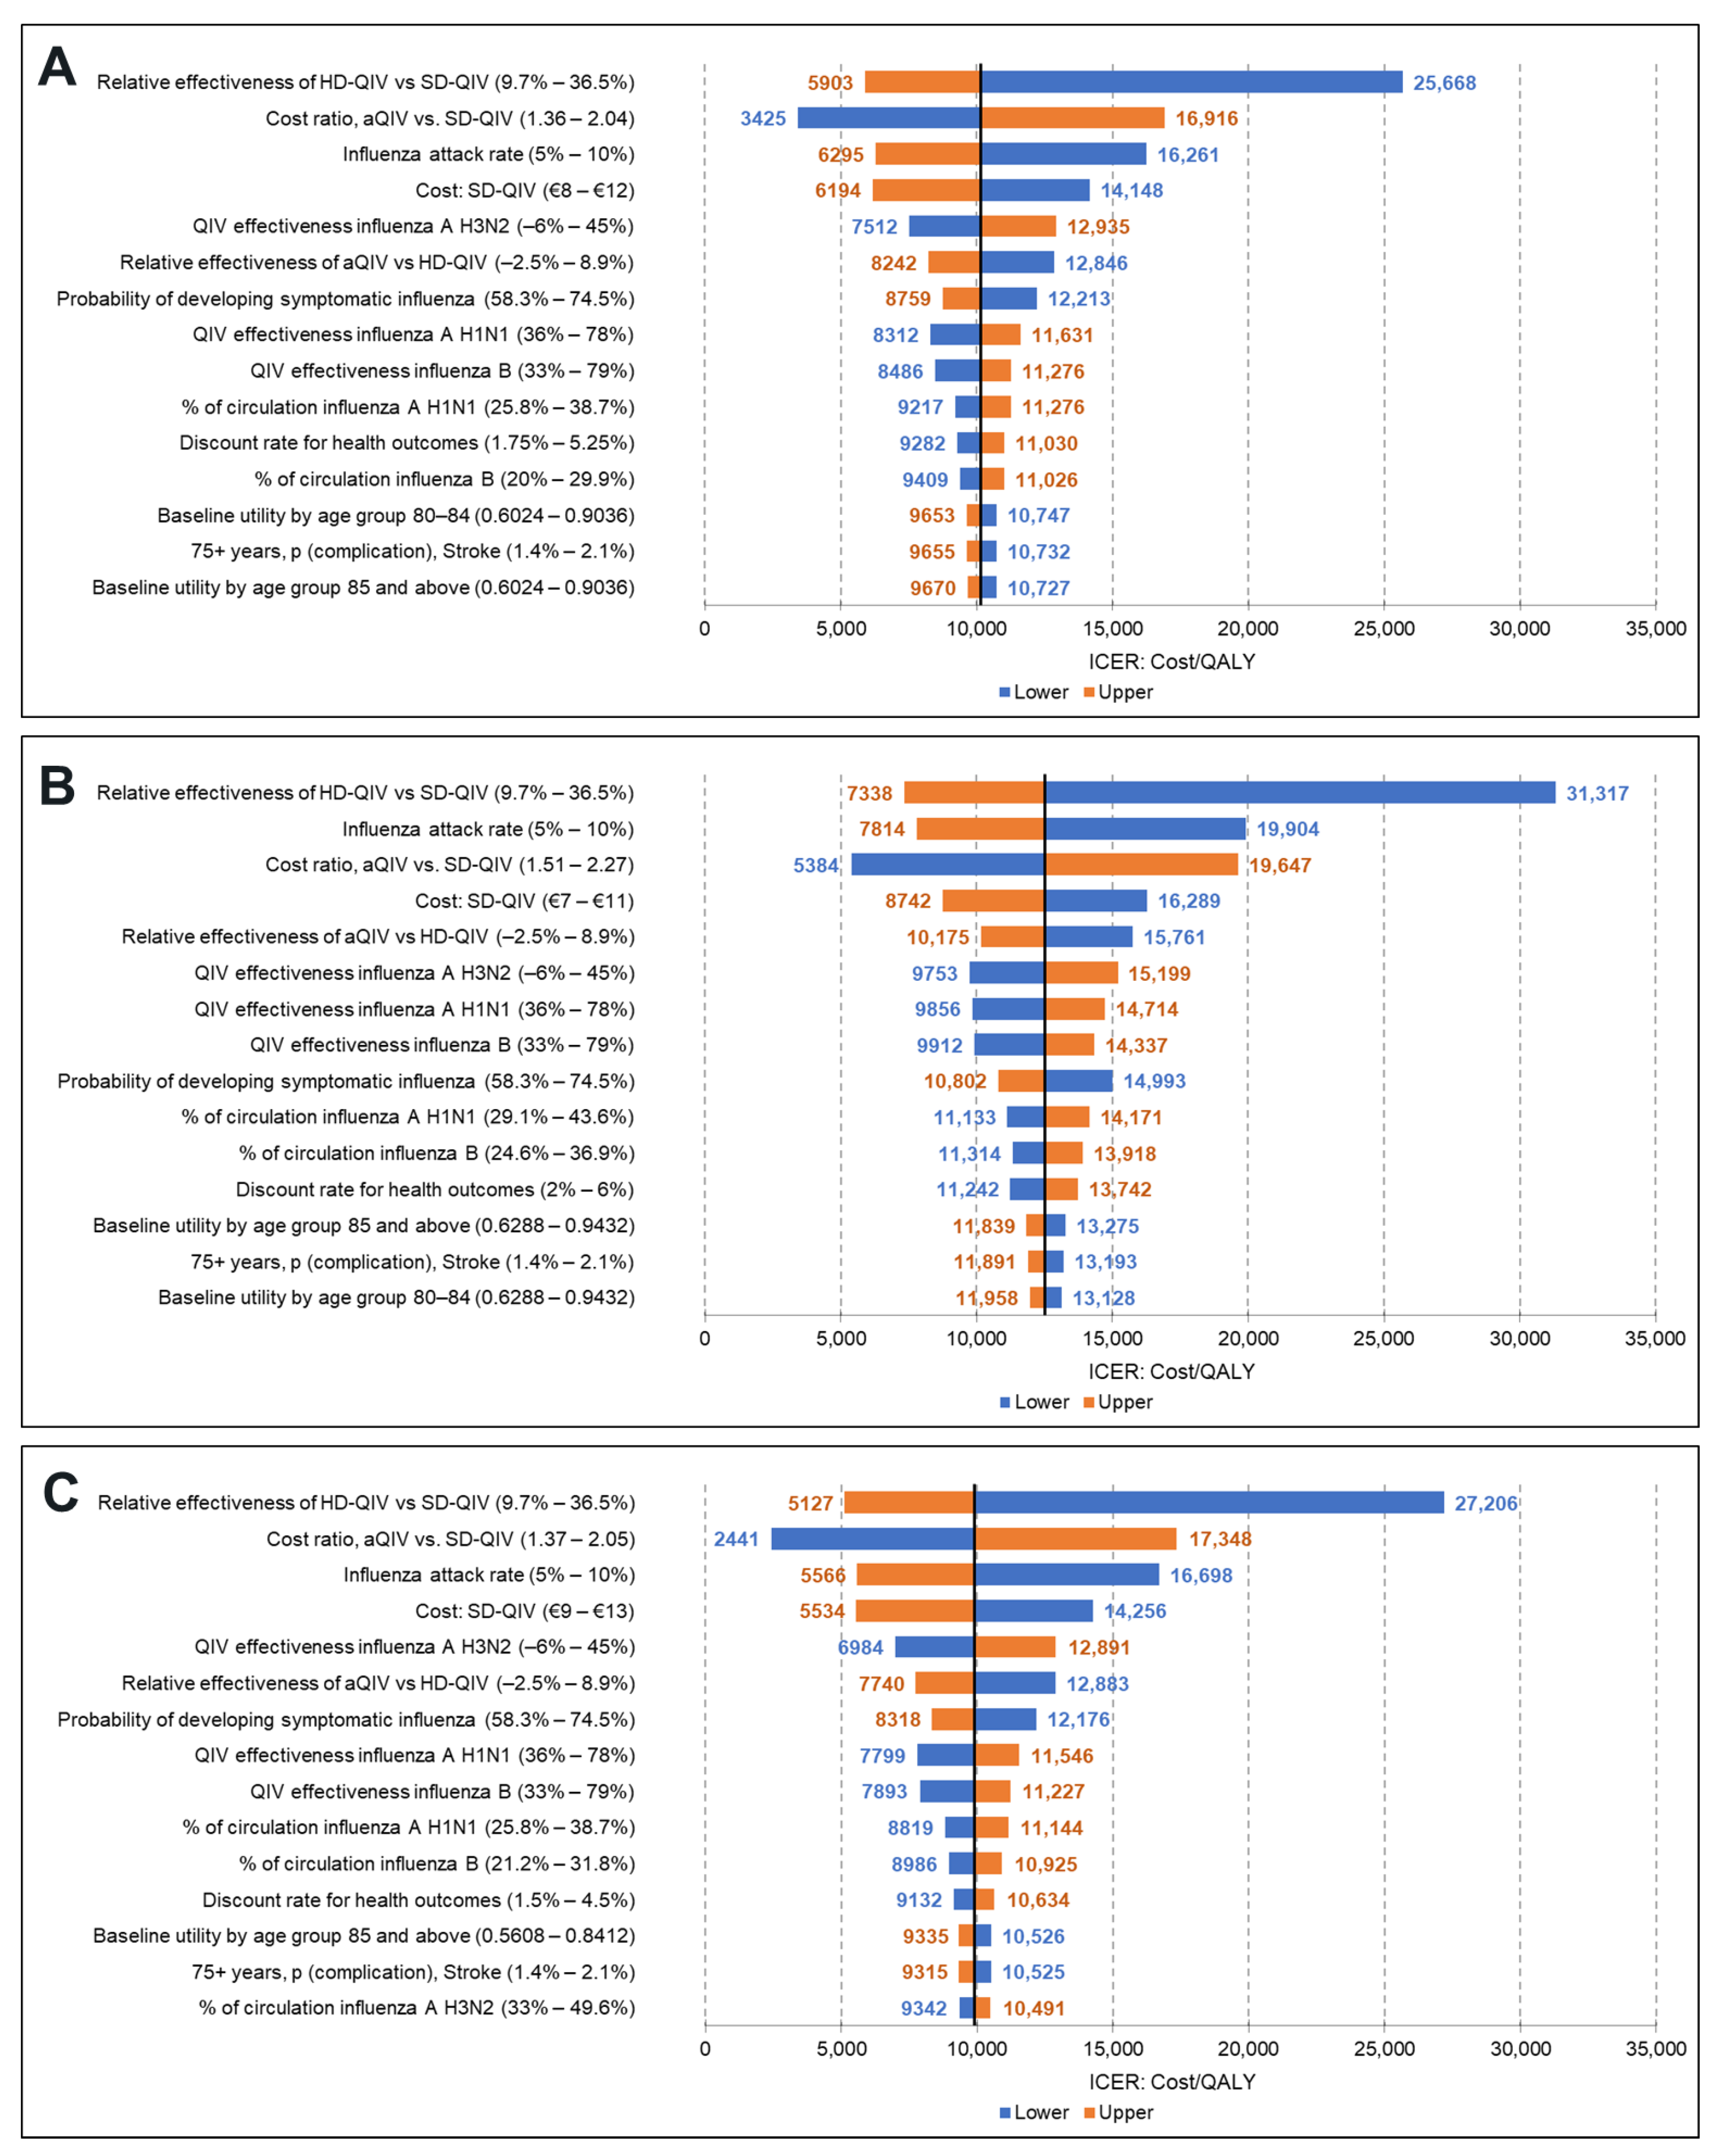
3.3. DSA (Healthcare Payer Perspective)
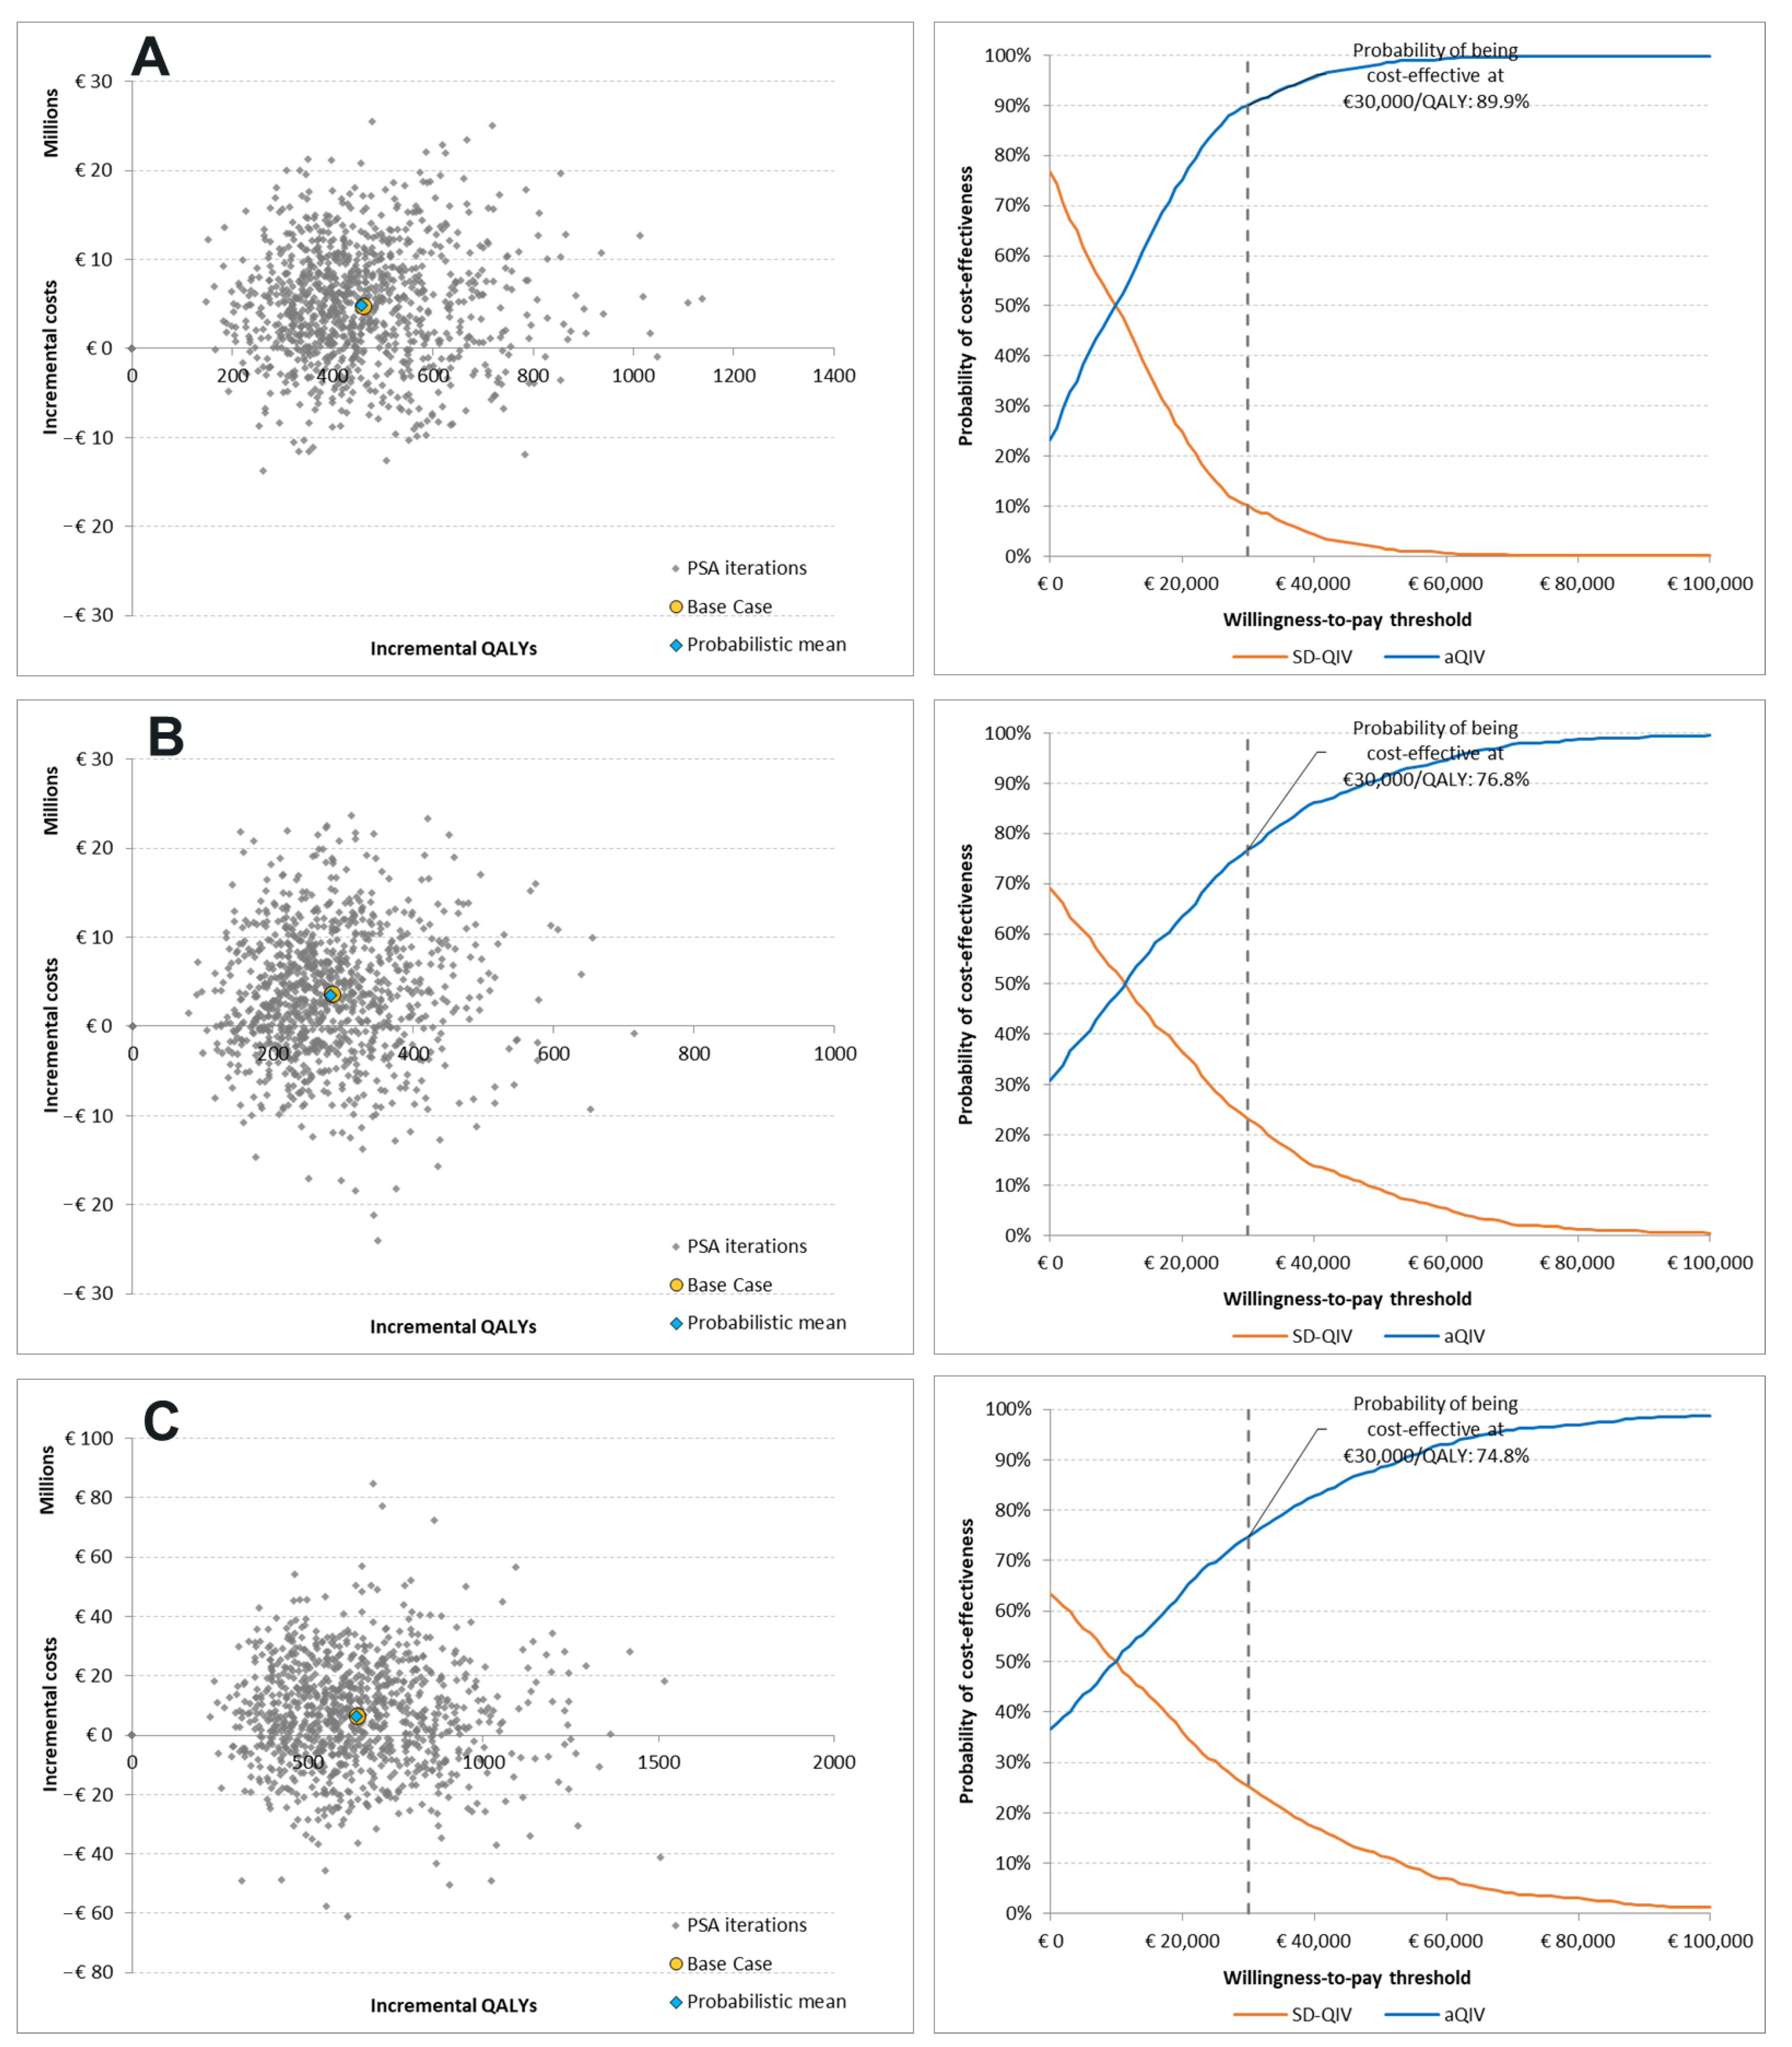
3.4. PSA (Healthcare Payer Perspective)
4. Discussion
5. Conclusions
Supplementary Materials
Author Contributions
Funding
Data Availability Statement
Conflicts of Interest
References
- World Health Organization (WHO). Influenza (Seasonal). Available online: https://www.who.int/news-room/fact-sheets/detail/influenza-(seasonal) (accessed on 31 October 2022).
- Macias, A.E.; McElhaney, J.E.; Chaves, S.S.; Nealon, J.; Nunes, M.C.; Samson, S.I.; Seet, B.T.; Weinke, T.; Yu, H. The disease burden of influenza beyond respiratory illness. Vaccine 2021, 39 (Suppl. S1), A6–A14. [Google Scholar] [CrossRef] [PubMed]
- World Health Organization (WHO). Influenza. Available online: https://www.who.int/teams/health-product-policy-and-standards/standards-and-specifications/vaccines-quality/influenza (accessed on 31 October 2022).
- European Centre for Disease Prevention and Control. Factsheet about Seasonal Influenza. Available online: https://www.ecdc.europa.eu/en/seasonal-influenza/facts/factsheet (accessed on 28 October 2022).
- Hak, E.; Wei, F.; Nordin, J.; Mullooly, J.; Poblete, S.; Nichol, K.L. Development and validation of a clinical prediction rule for hospitalization due to pneumonia or influenza or death during influenza epidemics among community-dwelling elderly persons. J. Infect. Dis. 2004, 189, 450–458. [Google Scholar] [CrossRef] [PubMed] [Green Version]
- Rothberg, M.B.; Haessler, S.D.; Brown, R.B. Complications of viral influenza. Am. J. Med. 2008, 121, 258–264. [Google Scholar] [CrossRef] [PubMed]
- Nielsen, J.; Vestergaard, L.S.; Richter, L.; Schmid, D.; Bustos, N.; Asikainen, T.; Trebbien, R.; Denissov, G.; Innos, K.; Virtanen, M.J.; et al. European all-cause excess and influenza-attributable mortality in the 2017/18 season: Should the burden of influenza B be reconsidered? Clin. Microbiol. Infect. 2019, 25, 1266–1276. [Google Scholar] [CrossRef] [Green Version]
- Comber, L.; Murchu, E.O.; Jordan, K.; Hawkshaw, S.; Marshall, L.; O’Neill, M.; Teljeur, C.; Ryan, M.; Carnahan, A.; Pérez Martín, J.J. Systematic review of the efficacy, effectiveness and safety of high-dose seasonal influenza vaccines for the prevention of laboratory-confirmed influenza in individuals ≥18 years of age. Rev. Med. Virol. 2022, e2330. [Google Scholar] [CrossRef]
- Preaud, E.; Durand, L.; Macabeo, B.; Farkas, N.; Sloesen, B.; Palache, A.; Shupo, F.; Samson, S.I. Annual public health and economic benefits of seasonal influenza vaccination: A European estimate. BMC Public Health 2014, 14, 813. [Google Scholar] [CrossRef] [Green Version]
- Nokleby, H.; Nicoll, A. Risk groups and other target groups–preliminary ECDC guidance for developing influenza vaccination recommendations for the season 2010-11. Eurosurveillance 2010, 15, 19525. [Google Scholar] [CrossRef]
- Chen, J.; Kelley, W.J.; Goldstein, D.R. Role of Aging and the Immune Response to Respiratory Viral Infections: Potential Implications for COVID-19. J. Immunol. 2020, 205, 313–320. [Google Scholar] [CrossRef]
- Wilkinson, K.; Wei, Y.; Szwajcer, A.; Rabbani, R.; Zarychanski, R.; Abou-Setta, A.M.; Mahmud, S.M. Efficacy and safety of high-dose influenza vaccine in elderly adults: A systematic review and meta-analysis. Vaccine 2017, 35, 2775–2780. [Google Scholar] [CrossRef]
- O’Hagan, D.T.; Tsai, T.; Reed, S. Emulsion-based adjuvants for improved influenza vaccines. In Influenza Vaccines for the Future; Springer: Berlin/Heidelberg, Germany, 2011; pp. 327–357. [Google Scholar] [CrossRef]
- European Centre for Disease Prevention and Control. Types of Seasonal Influenza Vaccine. Available online: https://www.ecdc.europa.eu/en/seasonal-influenza/prevention-and-control/vaccines/types-of-seasonal-influenza-vaccine (accessed on 31 October 2022).
- Van Buynder, P.; Konrad, S.; Van Buynder, J.; Brodkin, E.; Krajden, M.; Ramler, G.; Bigham, M. The comparative effectiveness of adjuvanted and unadjuvanted trivalent inactivated influenza vaccine (TIV) in the elderly. Vaccine 2013, 31, 6122–6128. [Google Scholar] [CrossRef] [Green Version]
- Johansen, N.D.; Modin, D.; Nealon, J.; Samson, S.; Salamand, C.; Loiacono, M.M.; Larsen, C.S.; Jensen, A.M.R.; Landler, N.E.; Claggett, B.L.; et al. A Pragmatic Randomized Feasibility Trial of Influenza Vaccines. NEJM Evid. 2023, 2, EVIDoa2200206. [Google Scholar] [CrossRef]
- Joint Committee on Vaccination and Immunisation (JCVI). Advice on Influenza Vaccines for 2022/23 (22 September 2021). Available online: https://www.nitag-resource.org/sites/default/files/2021-10/JCVI%20Statement%20on%20Influenza%20Vaccines%202022-23.pdf (accessed on 27 November 2022).
- Bundesministerium für Gesundheit. Ordinance on the Entitlement to Vaccination against Influenza and Measles of 10 March 2021 (BAnz AT 11.03.2021 V2), Amended by Article 1 of the Ordinance of 24 February 2022 (BAnz AT 24.02.2022 V1). Available online: https://www.gesetze-im-internet.de/masernischimpfansprv/BJNR607010021.html (accessed on 27 November 2022).
- Australian Technical Advisory Group on Immunisation (ATAGI). Clinical Advice—Statement on the Administration of Seasonal Influenza Vaccines in 2022 (März 2022). Available online: https://www.health.gov.au/sites/default/files/documents/2022/02/atagi-advice-on-seasonal-influenza-vaccines-in-2022.pdf (accessed on 27 November 2022).
- Grohskopf, L.A.; Blanton, L.H.; Ferdinands, J.M.; Chung, J.R.; Broder, K.R.; Talbot, H.K.; Morgan, R.L.; Fry, A.M. Prevention and control of seasonal influenza with vaccines: Recommendations of the advisory committee on immunization practices—United States, 2022–2023 influenza season. MMWR Recomm. Rep. 2022, 71, 1–28. [Google Scholar] [CrossRef] [PubMed]
- Danish Health Authority. Health Technology Assessment (HTA) of Influenza Vaccination. Available online: https://www.sst.dk/da/Udgivelser/2021/Medicinsk-teknologivurdering-_MTV_-af-Influenzavaccination (accessed on 11 January 2022).
- Norwegian Institute of Public Health. Vaccine Recommendations for Influenza Season 2022–2023. Available online: https://www.fhi.no/en/id/influensa/influenza-vaccine/about-seasonal-influenza-vaccine/#about-the-seasonal-influenza-vaccine-202223 (accessed on 31 October 2022).
- The Public Health Agency of Sweden—Folkhälsomyndigheten. Principles of Influenza Vaccination and Types of Vaccine. Available online: https://www.folkhalsomyndigheten.se/smittskydd-beredskap/vaccinationer/vacciner-a-o/influensa/principer-for-influensavaccination/ (accessed on 31 October 2022).
- Ruiz-Aragon, J.; Marquez-Pelaez, S.; Gani, R.; Alvarez, P.; Guerrero-Luduena, R. Cost-effectiveness and burden of disease for adjuvanted quadrivalent influenza vaccines compared to high-dose quadrivalent influenza vaccines in elderly patients in Spain. Vaccines 2022, 10, 176. [Google Scholar] [CrossRef] [PubMed]
- Fochesato, A.; Sottile, S.; Pugliese, A.; Marquez-Pelaez, S.; Toro-Diaz, H.; Gani, R.; Alvarez, P.; Ruiz-Aragon, J. An economic evaluation of the adjuvanted quadrivalent influenza vaccine compared with standard-dose quadrivalent influenza vaccine in the Spanish older adult population. Vaccines 2022, 10, 1360. [Google Scholar] [CrossRef]
- Kohli, M.A.; Maschio, M.; Cartier, S.; Mould-Quevedo, J.; Fricke, F.U. The cost-effectiveness of vaccination of older adults with an MF59-adjuvanted quadrivalent influenza vaccine compared to other available quadrivalent vaccines in Germany. Vaccines 2022, 10, 1386. [Google Scholar] [CrossRef] [PubMed]
- Kohli, M.A.; Maschio, M.; Mould-Quevedo, J.F.; Drummond, M.; Weinstein, M.C. The cost-effectiveness of an adjuvanted quadrivalent influenza vaccine in the United Kingdom. Hum. Vaccines Immunother. 2021, 17, 4603–4610. [Google Scholar] [CrossRef]
- Calabro, G.E.; Boccalini, S.; Panatto, D.; Rizzo, C.; Di Pietro, M.L.; Abreha, F.M.; Ajelli, M.; Amicizia, D.; Bechini, A.; Giacchetta, I.; et al. The New Quadrivalent Adjuvanted Influenza Vaccine for the Italian Elderly: A Health Technology Assessment. Int. J. Environ. Res. Public Health 2022, 19, 4166. [Google Scholar] [CrossRef]
- Dolk, C.; Eichner, M.; Welte, R.; Anastassopoulou, A.; Van Bellinghen, L.A.; Nautrup, B.P.; Van Vlaenderen, I.; Schmidt-Ott, R.; Schwehm, M.; Postma, M. Cost-utility of quadrivalent versus trivalent influenza vaccine in Germany, using an individual-based dynamic transmission model. Pharmacoeconomics 2016, 34, 1299–1308. [Google Scholar] [CrossRef] [Green Version]
- Cai, R.; Gerlier, L.; Eichner, M.; Schwehm, M.; Rajaram, S.; Mould-Quevedo, J.; Lamotte, M. Cost-effectiveness of the cell-based quadrivalent versus the standard egg-based quadrivalent influenza vaccine in Germany. J. Med. Econ. 2021, 24, 490–501. [Google Scholar] [CrossRef]
- The Danish Medicines Council. The Danish Medicines Council Methods Guide for Assessing New Pharmaceuticals. Available online: https://medicinraadet.dk/media/wq0dxny2/the_danish_medicines_council_methods_guide_for_assessing_new_pharmaceuticals_version_1-2_adlegacy.pdf (accessed on 31 October 2022).
- The Ministry of Finance (Denmark). Documentation Note—The Socio-Economic Discount Rate. Available online: https://fm.dk/media/18371/dokumentationsnotat-for-den-samfundsoekonomiske-diskonteringsrente_7-januar-2021.pdf (accessed on 31 October 2022).
- Norwegian Institute of Public Health. Guidelines for the Submission of Documentation for Single Technology Assessments (STAs) of Medical Devices and Diagnostic Interventions. Available online: https://www.fhi.no/globalassets/guidelines-for-the-submission-of-documents-for-stas-2021.pdf (accessed on 15 September 2022).
- The Dental and Pharmaceutical Benefits Agency (TLV). General Guidelines for Economic Evaluations from the Pharmaceutical Benefits Board. Available online: https://www.tlv.se/download/18.2e53241415e842ce95514e9/1510316396792/Guidelines-for-economic-evaluations-LFNAR-2003-2.pdf (accessed on 31 October 2022).
- Somes, M.P.; Turner, R.M.; Dwyer, L.J.; Newall, A.T. Estimating the annual attack rate of seasonal influenza among unvaccinated individuals: A systematic review and meta-analysis. Vaccine 2018, 36, 3199–3207. [Google Scholar] [CrossRef]
- Chit, A.; Roiz, J.; Briquet, B.; Greenberg, D.P. Expected cost effectiveness of high-dose trivalent influenza vaccine in US seniors. Vaccine 2015, 33, 734–741. [Google Scholar] [CrossRef] [Green Version]
- Raviotta, J.M.; Smith, K.J.; DePasse, J.; Brown, S.T.; Shim, E.; Nowalk, M.P.; Wateska, A.; France, G.S.; Zimmerman, R.K. Cost-effectiveness and public health impact of alternative influenza vaccination strategies in high-risk adults. Vaccine 2017, 35, 5708–5713. [Google Scholar] [CrossRef]
- Wolff, E.; Larsson, S.; Roth, A.; Bastami, S. Cost-effectiveness of influenza vaccination of elderly in Sweden: Ellen Wolff. Eur. J. Public Health 2016, 26, ckw164-060. [Google Scholar] [CrossRef] [Green Version]
- Belongia, E.A.; Simpson, M.D.; King, J.P.; Sundaram, M.E.; Kelley, N.S.; Osterholm, M.T.; McLean, H.Q. Variable influenza vaccine effectiveness by subtype: A systematic review and meta-analysis of test-negative design studies. Lancet Infect. Dis. 2016, 16, 942–951. [Google Scholar] [CrossRef] [PubMed]
- DiazGranados, C.A.; Dunning, A.J.; Kimmel, M.; Kirby, D.; Treanor, J.; Collins, A.; Pollak, R.; Christoff, J.; Earl, J.; Landolfi, V.; et al. Efficacy of high-dose versus standard-dose influenza vaccine in older adults. N. Engl. J. Med. 2014, 371, 635–645. [Google Scholar] [CrossRef] [PubMed]
- Coleman, B.L.; Sanderson, R.; Haag, M.D.M.; McGovern, I. Effectiveness of the MF59-adjuvanted trivalent or quadrivalent seasonal influenza vaccine among adults 65 years of age or older, a systematic review and meta-analysis. Influenza Other Respir. Viruses 2021, 15, 813–823. [Google Scholar] [CrossRef]
- Carrat, F.; Vergu, E.; Ferguson, N.M.; Lemaitre, M.; Cauchemez, S.; Leach, S.; Valleron, A.J. Time lines of infection and disease in human influenza: A review of volunteer challenge studies. Am. J. Epidemiol. 2008, 167, 775–785. [Google Scholar] [CrossRef] [Green Version]
- Boehme, A.K.; Luna, J.; Kulick, E.R.; Kamel, H.; Elkind, M.S.V. Influenza-like illness as a trigger for ischemic stroke. Ann. Clin. Transl. Neurol. 2018, 5, 456–463. [Google Scholar] [CrossRef]
- Truelsen, T.; Piechowski-Jozwiak, B.; Bonita, R.; Mathers, C.; Bogousslavsky, J.; Boysen, G. Stroke incidence and prevalence in Europe: A review of available data. Eur. J. Neurol. 2006, 13, 581–598. [Google Scholar] [CrossRef]
- Michaelidis, C.I.; Kern, M.S.; Smith, K.J. Cost-effectiveness of decision support strategies in acute bronchitis. J. Gen. Intern. Med. 2015, 30, 1505–1510. [Google Scholar] [CrossRef] [Green Version]
- Rozenbaum, M.H.; Mangen, M.J.; Huijts, S.M.; van der Werf, T.S.; Postma, M.J. Incidence, direct costs and duration of hospitalization of patients hospitalized with community acquired pneumonia: A nationwide retrospective claims database analysis. Vaccine 2015, 33, 3193–3199. [Google Scholar] [CrossRef] [PubMed] [Green Version]
- Longstreth, G.F.; Feitelberg, S.P. Outpatient care of selected patients with acute non-variceal upper gastrointestinal haemorrhage. Lancet 1995, 345, 108–111. [Google Scholar] [CrossRef] [PubMed]
- Verpillat, P.; Dorey, J.; Guilhaume-Goulant, C.; Dabbous, F.; Brunet, J.; Aballea, S. A chart review of management of ischemic stroke patients in Germany. J. Mark. Access Health Policy 2015, 3, 24223. [Google Scholar] [CrossRef] [PubMed]
- Fu, M.; Kontogeorgos, S.; Thunstrom, E.; Sandstrom, T.Z.; Kroon, C.; Bollano, E.; Schaufelberger, M.; Rosengren, A. Trends in myocarditis incidence, complications and mortality in Sweden from 2000 to 2014. Sci. Rep. 2022, 12, 1810. [Google Scholar] [CrossRef]
- Engstad, T.; Engstad, T.; Viitanen, M.; Ellekjær, H. Epidemiology of stroke in the elderly in the Nordic countries. Incidence, survival, prevalence and risk factors. Nor. Epidemiol. 2012, 22, 121–126. [Google Scholar] [CrossRef] [Green Version]
- Jones, N.R.; Roalfe, A.K.; Adoki, I.; Hobbs, F.R.; Taylor, C.J. Survival of patients with chronic heart failure in the community: A systematic review and meta-analysis. Eur. J. Heart Fail. 2019, 21, 1306–1325. [Google Scholar] [CrossRef] [Green Version]
- Tomonaga, Y.; Zens, K.D.; Lang, P.; Born, R.; Schwenkglenks, M.; Swiss Sentinel Surveillance Network. Productivity losses due to influenza and influenza-like illness in Switzerland: Results of the Swiss Sentinel Surveillance Network in a non-pandemic era. Swiss Med. Wkly. 2021, 151, w30022. [Google Scholar] [CrossRef]
- Accordini, S.; Corsico, A.G.; Calciano, L.; Bono, R.; Cerveri, I.; Fois, A.; Pirina, P.; Tassinari, R.; Verlato, G.; de Marco, R. The impact of asthma, chronic bronchitis and allergic rhinitis on all-cause hospitalizations and limitations in daily activities: A population-based observational study. BMC Pulm. Med. 2015, 15, 10. [Google Scholar] [CrossRef] [Green Version]
- Tellioglu, E.; Balci, G.; Mertoglu, A. Duration of stay of patients with community-acquired pneumonia in influenza season. Turk. Thorac. J. 2018, 19, 182–186. [Google Scholar] [CrossRef]
- Debes, S.; Haug, J.B.; de Blasio, B.F.; Jonassen, C.M.; Dudman, S.G. Etiology of viral respiratory tract infections in hospitalized adults, and evidence of the high frequency of prehospitalization antibiotic treatment in Norway. Health Sci. Rep. 2021, 4, e403. [Google Scholar] [CrossRef]
- Kotseva, K.; Gerlier, L.; Sidelnikov, E.; Kutikova, L.; Lamotte, M.; Amarenco, P.; Annemans, L. Patient and caregiver productivity loss and indirect costs associated with cardiovascular events in Europe. Eur. J. Prev. Cardiol. 2019, 26, 1150–1157. [Google Scholar] [CrossRef] [PubMed]
- Turchetti, G.; Bellelli, S.; Amato, M.; Bianchi, S.; Conti, P.; Cupisti, A.; Panichi, V.; Rosati, A.; Pizzarelli, F.; On Behalf of the Tuscany, C.K.D.S.G. The social cost of chronic kidney disease in Italy. Eur. J. Health Econ. 2017, 18, 847–858. [Google Scholar] [CrossRef] [Green Version]
- Strzelczyk, A.; Knake, S.; Oertel, W.H.; Rosenow, F.; Hamer, H.M. Inpatient treatment costs of status epilepticus in adults in Germany. Seizure 2013, 22, 882–885. [Google Scholar] [CrossRef] [Green Version]
- Button, L.A.; Roberts, S.E.; Evans, P.A.; Goldacre, M.J.; Akbari, A.; Dsilva, R.; Macey, S.; Williams, J.G. Hospitalized incidence and case fatality for upper gastrointestinal bleeding from 1999 to 2007: A record linkage study. Aliment. Pharmacol. Ther. 2011, 33, 64–76. [Google Scholar] [CrossRef]
- Stendardo, M.; Bonci, M.; Casillo, V.; Miglio, R.; Giovannini, G.; Nardini, M.; Campo, G.; Fucili, A.; Boschetto, P. Predicting return to work after acute myocardial infarction: Socio-occupational factors overcome clinical conditions. PLoS ONE 2018, 13, e0208842. [Google Scholar] [CrossRef]
- Statistics Denmark. FOLK1A: Population at the First Day of the Quarter by Region, Sex, Age and Marital Status. Available online: https://www.statbank.dk/statbank5a/selectvarval/define.asp?PLanguage=1&subword=tabsel&MainTable=FOLK1A&PXSId=199113&tablestyle=&ST=SD&buttons=0 (accessed on 31 October 2022).
- Statistics Norway. Population, by Sex and One-Year Age Groups. Available online: https://www.ssb.no/en/statbank/table/07459/ (accessed on 31 October 2022).
- Statistics Sweden. Population by Age and Sex. Available online: https://www.statistikdatabasen.scb.se/pxweb/en/ssd/START__BE__BE0101__BE0101A/BefolkningR1860N/ (accessed on 31 October 2022).
- Statens Serum Institut (Denmark). Influenza Coverage—Monitoring in Numbers, Graphs and Maps. Available online: https://statistik.ssi.dk/sygdomsdata#!/?vaccination=14&sex=3&agegroup=4&landsdel=100&xaxis=Season&show=Graph&season=2014%7C2018&datatype=Vaccination (accessed on 31 October 2022).
- Norwegian Institute of Public Health. Norhealth—Influenza Vaccine Coverage. Available online: https://www.norgeshelsa.no/norgeshelsa/ (accessed on 15 September 2022).
- The Public Health Agency of Sweden—Folkhälsomyndigheten. Influenza in Sweden—Season 2020–2021. Available online: https://www.folkhalsomyndigheten.se/publicerat-material/publikationsarkiv/i/influenza-in-sweden-season-2020-2021/?pub=99545 (accessed on 15 September 2022).
- Statens Serum Institut (Denmark). Influenza Season 2014/2015. Available online: https://en.ssi.dk/news/epi-news/2015/no-24---2015 (accessed on 15 September 2022).
- Statens Serum Institut (Denmark). Influenza Season 2015/2016. Available online: https://en.ssi.dk/news/epi-news/2016/no-24---2016 (accessed on 15 September 2022).
- Statens Serum Institut (Denmark). Influenza Season 2016/2017. Available online: https://en.ssi.dk/news/epi-news/2017/no-24---2017 (accessed on 15 September 2022).
- Statens Serum Institut (Denmark). Influenza Season 2019/2020. Available online: https://en.ssi.dk/news/epi-news/2020/no-26---2020 (accessed on 15 September 2022).
- Statens Serum Institut (Denmark). Influenza Season 2017/2018. Available online: https://en.ssi.dk/surveillance-and-preparedness/surveillance-in-denmark/annual-reports-on-disease-incidence/influenza-season-2017-2018 (accessed on 15 September 2022).
- Norwegian Institute of Public Health. Influenza Season in Norway 2014–2015: Annual Report Disease Program for Influenza. Available online: https://www.fhi.no/globalassets/dokumenterfiler/influensa/influensaovervaking-gml/influensasesongen-i-norge-2014-15.-arsrapport-sykdomsprogram-for-influensa-pdf.pdf (accessed on 15 September 2022).
- Norwegian Institute of Public Health. Influenza Season in Norway 2015–2016: Annual Report Disease Program for Influenza. Available online: https://www.fhi.no/globalassets/dokumenterfiler/influensa/sesongrapport-influensa-2015-16.pdf (accessed on 15 September 2022).
- Norwegian Institute of Public Health. Influenza Season in Norway 2016–2017: Annual Report Disease Program for Influenza. Available online: https://www.fhi.no/globalassets/dokumenterfiler/influensa/influensa-arsrapprt-2016.pdf (accessed on 15 September 2022).
- Norwegian Institute of Public Health. Influenza Season in Norway 2017–2018: Annual Report Disease Program for Influenza. Available online: https://www.fhi.no/globalassets/dokumenterfiler/rapporter/2018/influensasesongen-i-norge-2017-18_publisert-100718.pdf (accessed on 15 September 2022).
- Norwegian Institute of Public Health. Influenza Season in Norway 2018–2019: Annual Report Disease Program for Influenza. Available online: https://www.fhi.no/globalassets/dokumenterfiler/rapporter/2019/influensasesongen-i-norge-2018-19_publiser.pdf (accessed on 15 September 2022).
- The Public Health Agency of Sweden—Folkhälsomyndigheten. Influenza in Sweden—Season 2018–2019. Available online: https://www.folkhalsomyndigheten.se/publicerat-material/publikationsarkiv/i/influenza-in-sweden-season-2018-2019/ (accessed on 15 September 2022).
- The Public Health Agency of Sweden—Folkhälsomyndigheten. Influenza in Sweden—Season 2014–2015. Available online: https://www.folkhalsomyndigheten.se/contentassets/e33657cab0bf4d99be98a976ec423c9f/influenza-in-sweden-2014-2015.pdf (accessed on 15 September 2022).
- The Public Health Agency of Sweden—Folkhälsomyndigheten. Influenza in Sweden—Season 2017–2018. Available online: https://www.folkhalsomyndigheten.se/publicerat-material/publikationsarkiv/i/influenza-in-sweden-2017-2018/?pub=54559 (accessed on 15 September 2022).
- The Public Health Agency of Sweden—Folkhälsomyndigheten. Influenza in Sweden—Season 2016–2017. Available online: https://www.folkhalsomyndigheten.se/contentassets/b5f8b9e9e0654de38d557b4a55d19496/influenza-in-sweden-2016-2017.pdf (accessed on 15 September 2022).
- The Public Health Agency of Sweden—Folkhälsomyndigheten. Influenza in Sweden—Season 2015–2016. (accessed on 15 September 2022).
- IQVIA. IQVIA Pricing Insights database. 2022; [Data on file]. [Google Scholar]
- Ministerio de Sanidad. Pliego de Cláusulas Administrativas Particulares del Acuerdo Marco Para la Selección de Suministradores de Vacunas Frente a la Gripe Estacional Para Determinados Órganos de Contratación de la Administración General del Estado Instituto Nacional de Gestión Sanitaria (Ingesa) y Las Ciudades de Ceuta y Melilla y Varias Comunidades Autonomas. Available online: https://contrataciondelestado.es/wps/wcm/connect/7c41cd41-00c8-4c07-be3d-272d29585268/DOC20210419131140PCAP+Gripe+2021-2025.pdf?MOD=AJPERES (accessed on 16 January 2023).
- Regione Emilia-Romagna. Atti Amministrativi Num. 220 del 19/04/2021 Bologna. Available online: https://www.sitar-er.it/PubbBandi/VisualizzaAllegatoEsito.do?codGara=190467&codLott=4&numAppa=1 (accessed on 16 January 2023).
- The Danish Medical Association. Fees and Benefits, Group 2 Tariffs, Group 2 Rates per. 1 April 2022. Available online: https://www.laeger.dk/PLO-honorarer-og-ydelser (accessed on 31 October 2022).
- Sweden Southern Healthcare Region. Regional Prices and Allowances. Available online: https://sodrasjukvardsregionen.se/download/regionala-priser-och-ersattningar-for-sodra-sjukvardsregionen-2022/?wpdmdl=24791&masterkey=61decc148fc78 (accessed on 15 November 2022).
- The Danish Health Data Authority. DRG Rates 2022. Available online: https://sundhedsdatastyrelsen.dk/da/afregning-og-finansiering/takster-drg/takster-2022 (accessed on 31 October 2022).
- The Norwegian Directorate of Health. Effort-driven financing (ISF)—Regulations 2022. Available online: https://www.helsedirektoratet.no/tema/finansiering/innsatsstyrt-finansiering-og-drg-systemet/innsatsstyrt-finansiering-isf (accessed on 31 October 2022).
- The Danish Health Data Authority. DRG Rates 2017: Outpatient Day Rates. Available online: https://sundhedsdatastyrelsen.dk/da/afregning-og-finansiering/takster-drg/takster-2017 (accessed on 31 October 2022).
- Statistics Denmark. Labour Force Status in Percentage by Sex, Age, Employment Status and Time; Total 65–74 Years Employment Rate 2022Q1. Available online: https://www.statbank.dk/20309 (accessed on 31 October 2022).
- Statistics Norway. Employed Persons per 4th Quarter (per Cent), by Age, Contents, Year and Sex; For Age Group 67–74 Years. Available online: https://www.ssb.no/en/statbank/table/06445/tableViewLayout1/ (accessed on 31 October 2022).
- Statistics Sweden. The Labour Force Surveys (LFS). Available online: https://www.scb.se/hitta-statistik/statistik-efter-amne/arbetsmarknad/arbetskraftsundersokningar/arbetskraftsundersokningarna-aku/pong/tabell-och-diagram/icke-sasongrensade-data/grundtabeller-aku-1574-ar-ar/ (accessed on 31 October 2022).
- Statistics Denmark. LONS50: Earnings by Age, Sector, Salary, Salary Earners, Components and Sex. Available online: https://www.statbank.dk/LONS50 (accessed on 31 October 2022).
- Statistics Norway. Monthly Earnings, by Sector, Age, Sex, Contractual Working Hours, Contents, Year and Measuring Method; for Age 60 Years or Older. Available online: https://www.ssb.no/en/statbank/table/11421/tableViewLayout1/ (accessed on 31 October 2022).
- Statistics Sweden. Average Monthly Salary by Sector 1992–2021. Available online: https://www.scb.se/en/finding-statistics/statistics-by-subject-area/labour-market/wages-salaries-and-labour-costs/salary-structures-whole-economy/pong/tables-and-graphs/average-monthly-salary-by-sector/ (accessed on 31 October 2022).
- Apoteket. Available online: https://www.apoteket.se/ (accessed on 15 September 2022).
- The Danish Medicines Agency. medicinpriser.dk. Available online: https://medicinpriser.dk/ (accessed on 31 October 2022).
- The Norwegian Medicines Agency. Drug Search. Available online: https://www.legemiddelsok.no/ (accessed on 31 October 2022).
- Shedrawy, J.; Deogan, C.; Ohd, J.N.; Hergens, M.P.; Bruchfeld, J.; Jonsson, J.; Siroka, A.; Lonnroth, K. Cost-effectiveness of the latent tuberculosis screening program for migrants in Stockholm Region. Eur. J. Health Econ. 2021, 22, 445–454. [Google Scholar] [CrossRef] [PubMed]
- AMGROS. Estimating Unit Costs. Available online: https://amgros.dk/media/2227/amgros-estimating-unit-costs.pdf (accessed on 15 September 2022).
- Health Norway (Helse Norge). User Fee and Rates 2022. Available online: https://www.helsenorge.no/en/patient-travel/om/user-fee-and-rates/ (accessed on 15 September 2022).
- Kiritharan, S.; Johanson, M.V.; Jensen, M.B.; Thomsen, J.N.L.; Andersen, C.A.; Jensen, C.E. A cost-minimisation analysis of performing point-of-care ultrasonography on patients with vaginal bleeding in early pregnancy in general practice: A decision analytical model. BMC Health Serv. Res. 2022, 22, 55. [Google Scholar] [CrossRef]
- Janssen, M.F.; Szende, A.; Cabases, J.; Ramos-Goni, J.M.; Vilagut, G.; Konig, H.H. Population norms for the EQ-5D-3L: A cross-country analysis of population surveys for 20 countries. Eur. J. Health Econ. 2019, 20, 205–216. [Google Scholar] [CrossRef] [PubMed] [Green Version]
- Stavem, K.; Augestad, L.A.; Kristiansen, I.S.; Rand, K. General population norms for the EQ-5D-3 L in Norway: Comparison of postal and web surveys. Health Qual. Life Outcomes 2018, 16, 204. [Google Scholar] [CrossRef]
- Meier, C.R.; Napalkov, P.N.; Wegmuller, Y.; Jefferson, T.; Jick, H. Population-based study on incidence, risk factors, clinical complications and drug utilisation associated with influenza in the United Kingdom. Eur. J. Clin. Microbiol. Infect. Dis. 2000, 19, 834–842. [Google Scholar] [CrossRef]
- Kwong, J.C.; Schwartz, K.L.; Campitelli, M.A.; Chung, H.; Crowcroft, N.S.; Karnauchow, T.; Katz, K.; Ko, D.T.; McGeer, A.J.; McNally, D.; et al. Acute myocardial infarction after laboratory-confirmed influenza infection. N. Engl. J. Med. 2018, 378, 345–353. [Google Scholar] [CrossRef]
- Li, X.; Bilcke, J.; van der Velden, A.W.; Bongard, E.; Bruyndonckx, R.; Sundvall, P.D.; Harbin, N.J.; Coenen, S.; Francis, N.; Bruno, P.; et al. Direct and Indirect Costs of Influenza-Like Illness Treated with and Without Oseltamivir in 15 European Countries: A Descriptive Analysis Alongside the Randomised Controlled ALIC(4)E Trial. Clin. Drug. Investig. 2021, 41, 685–699. [Google Scholar] [CrossRef] [PubMed]
- Hasegawa, K.; Tsugawa, Y.; Brown, D.F.; Mansbach, J.M.; Camargo, C.A., Jr. Trends in bronchiolitis hospitalizations in the United States, 2000–2009. Pediatrics 2013, 132, 28–36. [Google Scholar] [CrossRef] [Green Version]
- Abraham, K.A.; Thompson, E.B.; Bodger, K.; Pearson, M. Inequalities in outcomes of acute kidney injury in England. QJM 2012, 105, 729–740. [Google Scholar] [CrossRef] [PubMed] [Green Version]
- Si, Y.; Xiao, X.; Xiang, S.; Liu, J.; Mo, Q.; Sun, H. Risk assessment of in-hospital mortality of patients with epilepsy: A large cohort study. Epilepsy Behav. 2018, 84, 44–48. [Google Scholar] [CrossRef] [PubMed]
- El-Tawil, A.M. Trends on gastrointestinal bleeding and mortality: Where are we standing? World J. Gastroenterol. 2012, 18, 1154–1158. [Google Scholar] [CrossRef]
- Niikura, R.; Yasunaga, H.; Yamaji, Y.; Horiguchi, H.; Fushimi, K.; Yamada, A.; Hirata, Y.; Koike, K. Factors affecting in-hospital mortality in patients with lower gastrointestinal tract bleeding: A retrospective study using a national database in Japan. J. Gastroenterol. 2015, 50, 533–540. [Google Scholar] [CrossRef]
- Freisinger, E.; Sehner, S.; Malyar, N.M.; Suling, A.; Reinecke, H.; Wegscheider, K. Nationwide routine-data analysis of sex differences in outcome of acute myocardial infarction. Clin. Cardiol. 2018, 41, 1013–1021. [Google Scholar] [CrossRef] [PubMed] [Green Version]
- Statistics Denmark. Consumer Price Index. Available online: https://www.dst.dk/en/Statistik/emner/oekonomi/prisindeks/forbrugerprisindeks (accessed on 31 October 2022).
- Statistics Norway. Consumer Price Index. Available online: https://www.ssb.no/en/priser-og-prisindekser/konsumpriser/statistikk/konsumprisindeksen (accessed on 15 November 2022).
- Statistics Sweden. CPI, Fixed Index Numbers. Available online: https://www.scb.se/en/finding-statistics/statistics-by-subject-area/prices-and-consumption/consumer-price-index/consumer-price-index-cpi/pong/tables-and-graphs/consumer-price-index-cpi/cpi-fixed-index-numbers-1980100/ (accessed on 15 November 2022).
- Kirch, W. (Ed.) Human capital approach. In Encyclopedia of Public Health; Springer: Dordrecht, The Netherlands, 2008; pp. 697–698. [Google Scholar]
- Grotle, M.; Braten, L.C.; Brox, J.I.; Espeland, A.; Zolic-Karlsson, Z.; Killingmo, R.M.; Tingulstad, A.; Grovle, L.; Froholdt, A.; Kristoffersen, P.M.; et al. Cost-utility analysis of antibiotic treatment in patients with chronic low back pain and Modic changes: Results from a randomised, placebo-controlled trial in Norway (the AIM study). BMJ Open 2020, 10, e035461. [Google Scholar] [CrossRef]
- Sciera, L.K.; Frost, L.; Dybro, L.; Poulsen, P.B. The cost-effectiveness of one-time opportunistic screening for atrial fibrillation in different age cohorts of inhabitants in Denmark aged 65 years and above: A Markov modelled analysis. Eur. Heart J. Qual. Care Clin. Outcomes 2022, 8, 177–186. [Google Scholar] [CrossRef]
- Ulfsdotter, M.; Lindberg, L.; Mansdotter, A. A Cost-Effectiveness Analysis of the Swedish Universal Parenting Program All Children in Focus. PLoS ONE 2015, 10, e0145201. [Google Scholar] [CrossRef] [Green Version]
- Barrios, J.M.R.; Alcantara, F.P.; Palomo, C.C.; Garcia, P.G.; De Las Heras, E.A.; Riestra, M.B. The use of cost per life year gained as a measurement of cost-effectiveness in Spain: A systematic review of recent publications. Eur. J. Health Econ. 2012, 13, 723–740. [Google Scholar] [CrossRef] [Green Version]
- The Danish Health Authority. Medical Technology Assessment (MTV) of Influenza Vaccination. Available online: https://www.sst.dk/-/media/Udgivelser/2021/Influenza-2021-MTV/Medicinsk-teknologivurdering-_MTV_-af-influenzavaccination_310821.ashx?la=da&hash=78C51C501E3DC81103F53D2514F95F91B5CBCB4A (accessed on 31 October 2022).
- Hauge, S.H.; Bakken, I.J.; de Blasio, B.F.; Haberg, S.E. Burden of medically attended influenza in Norway 2008–2017. Influenza Other Respir. Viruses 2019, 13, 240–247. [Google Scholar] [CrossRef] [PubMed] [Green Version]
- Gran, J.M.; Iversen, B.; Hungnes, O.; Aalen, O.O. Estimating influenza-related excess mortality and reproduction numbers for seasonal influenza in Norway, 1975–2004. Epidemiol. Infect. 2010, 138, 1559–1568. [Google Scholar] [CrossRef] [PubMed]
- Xue, Y.; Kristiansen, I.S.; de Blasio, B.F. Modeling the cost of influenza: The impact of missing costs of unreported complications and sick leave. BMC Public Health 2010, 10, 724. [Google Scholar] [CrossRef] [Green Version]
- European Medicines Agency. Fluad Tetra. Available online: https://www.ema.europa.eu/en/medicines/human/EPAR/fluad-tetra (accessed on 11 March 2022).
- Pillsbury, A.J.; Fathima, P.; Quinn, H.E.; Cashman, P.; Blyth, C.C.; Leeb, A.; Macartney, K.K. Comparative Postmarket Safety Profile of Adjuvanted and High-Dose Influenza Vaccines in Individuals 65 Years or Older. JAMA Netw. Open 2020, 3, e204079. [Google Scholar] [CrossRef] [PubMed]
- Gupta, C.; Sachdeva, A.; Khamar, J.; Bu, C.; Bartoszko, J.; Loeb, M. Effectiveness of the influenza vaccine at reducing adverse events in patients with heart failure: A systematic review and meta-analysis. Vaccine 2022, 40, 3433–3443. [Google Scholar] [CrossRef]
- Pitman, R.; Fisman, D.; Zaric, G.S.; Postma, M.; Kretzschmar, M.; Edmunds, J.; Brisson, M.; Force, I.-S.M.G.R.P.T. Dynamic transmission modeling: A report of the ISPOR-SMDM Modeling Good Research Practices Task Force Working Group-5. Med. Decis. Mak. 2012, 32, 712–721. [Google Scholar] [CrossRef]


| Parameter | Value | Reference |
|---|---|---|
| Influenza attack rate in unvaccinated population | 7.20% | [35] |
| Vaccine effectiveness | ||
| SD-QIV VE against influenza A H1N1 | 62.00% | [39] |
| SD-QIV VE against influenza A H3N2 | 24.00% | |
| SD-QIV VE against influenza B | 63.00% | |
| rVE HD-QIV vs. SD-QIV | 24.20% | [40] |
| rVE aQIV vs. HD-QIV | 3.20% | [41] |
| Clinical events | ||
| Probability of developing symptomatic influenza | 66.90% | [42] |
| Probability of medical attention (GP visit) | 30.00% | [21] |
| Probability of developing IRCs | IRC specific (see Table S1) | [30,43,44] |
| Probability of hospitalization due to IRCs | [45,46,47,48] | |
| Probability of death due to IRCs | [30,49,50,51] | |
| Societal perspective inputs | ||
| Number of days lost due to symptomatic influenza | 3.20 | [52] |
| Number of days lost due to hospitalization | IRC specific (see Table S1) | [53,54,55,56,57,58,59,60] |
| Utility decrements | ||
| Symptomatic influenza | −0.0079 | [30] |
| Hospitalization | IRC specific (see Table S1) | [30] |
| Outpatient | [30] |
| Parameter | Denmark | Norway | Sweden | References |
|---|---|---|---|---|
| Population and vaccination strategy | ||||
| Population size (≥65 years) | 1,198,676 | 989,474 | 2,118,766 | [61,62,63] |
| Proportion of males (%) | 46.10% | 46.90% | 46.70% | |
| Vaccine coverage rate | 75.00% | 59.70% | 60.00% | [64,65,66] |
| Influenza strain distribution a | ||||
| Influenza A (H1N1) | 32.20% | 36.30% | 32.20% | [67,68,69,70,71,72,73,74,75,76,77,78,79,80,81] |
| Influenza A (H3N2) | 42.80% | 32.90% | 41.30% | |
| Influenza B | 25.00% | 30.70% | 26.50% | |
| Vaccine costs (€) | ||||
| SD-QIV | 10.20 | 9.10 | 11.00 | [82] |
| aQIV (ratio vs. SD-QIV) | 170% | 189% | 171% | Assumption |
| HD-QIV | 25.00 | 25.00 | 25.00 | [83,84] |
| Vaccine admin. costs (€) | 30.47 | 54.81 | 68.10 | |
| Direct medical costs (€) | ||||
| GP visit | 30.47 | 54.81 | 167.11 | [85,86] |
| Hospitalization | IRC specific (see Table S2) | [86,87,88] | ||
| Outpatient | [86,88,89] | |||
| Societal perspective inputs | ||||
| Proportion of the population employed (65–74 years) | 16.6% | 19.7% | 19.2% | [90,91,92] |
| Labor costs per day (EUR) | 309.13 | 250.68 | 294.40 | [93,94,95] |
| Non-prescription medication (EUR) | 4.30 | 2.61 | 1.03 | [96,97,98] |
| Transport (vaccination) (EUR) | 5.03 | 2.65 | 4.84 | [99,100,101,102] |
| Transport (outpatient) (EUR) | 5.03 | 2.65 | 4.84 | |
| Transport (hospitalization) (EUR) | 14.84 | 7.66 | 4.84 | |
| Baseline utilities | ||||
| 65–69 years | 0.82 | 0.80 | 0.84 | [103,104] |
| 70–74 years | 0.82 | 0.80 | 0.84 | |
| 75+ years | 0.75 | 0.79 | 0.70 | |
| Scenario | Description | References |
|---|---|---|
| Scenario 1 | Assumed lower vaccine coverage rates (47.6% for Denmark, 29.5% for Norway, and 50% for Sweden, average coverage from seasons 2014/15 to 2018/19) | [64,65,77,78,79,80,81] |
| Scenario 2 (2.1 to 2.5) | Conducted separate analyses for seasons 2014/15 to 2018/19 (5 seasons before COVID-19 pandemic) with influenza strain circulation for each season | [67,68,69,70,71,72,73,74,75,76,77,78,79,80,81] |
| Scenario 3 | aQIV VE estimated using only effectiveness evidence from observational studies (using rVE for aTIV vs. SD-TIV from Coleman et al. [13.9%]) [41] | [41] |
| Scenario 4 (4.1 to 4.2) | Used lower (36% for H1N1, −6% for H3N2, and 33% for subtype B) and upper (78% for H1N1, 45% for H3N2, and 79% for subtype B) bounds of the 95% CI for SD-QIV VE | [39] |
| Scenario 5 (5.1 to 5.2) | Used lower and upper bounds of the 95% CI for rVE of HD-QIV vs. SD-QIV (9.7–36.5%) and aQIV vs. HD-QIV (−2.5–8.9%) | [40,41] |
| Scenario 6 (6.1 to 6.2) | Varied the management costs of all IRCs (outpatient and hospitalizations) by ±30% | NA |
| Scenario 7 | Removed HF from the model | NA |
| Denmark | Norway | Sweden | |||||||
|---|---|---|---|---|---|---|---|---|---|
| aQIV | SD-QIV | Incremental | aQIV | SD-QIV | Incremental | aQIV | SD-QIV | Incremental | |
| Population size (≥65 years) | 1,198,676 | 989,474 | 2,118,766 | ||||||
| Health outcomes | |||||||||
| Number of symptomatic influenza cases | 31,590 | 37,828 | −6238 | 29,685 | 33,495 | −3810 | 64,815 | 73,539 | −8724 |
| Number of GP visits | 9477 | 11,348 | −1871 | 8906 | 10,048 | −1143 | 19,445 | 22,062 | −2617 |
| Number of IRCs | 5009 | 5998 | −989 | 4700 | 5303 | −603 | 10,287 | 11,672 | −1385 |
| Number of hospitalizations | 1554 | 1861 | −307 | 1454 | 1640 | −187 | 3199 | 3629 | −431 |
| Number of deaths | 271 | 325 | −54 | 252 | 285 | −32 | 560 | 636 | −75 |
| Total LYs | 12,115,917 | 12,115,416 | 501 | 10,000,047 | 9,999,745 | 301 | 22,394,455 | 22,393,722 | 732 |
| Total QALYs | 9,325,198 | 9,324,737 | 461 | 7,902,627 | 7,902,342 | 285 | 16,430,639 | 16,429,998 | 641 |
| Costs outcomes (EUR) | |||||||||
| Total costs (healthcare payer) | 51,515,927 | 46,825,793 | 4,690,134 | 52,035,223 | 48,469,152 | 3,566,071 | 136,996,364 | 130,650,741 | 6,345,624 |
| Cost of vaccines | 15,552,821 | 9,169,871 | 6,382,950 | 10,160,315 | 5,375,515 | 4,784,799 | 23,899,680 | 13,983,856 | 9,915,825 |
| Cost of vaccine administration | 27,390,008 | 27,390,008 | 0 | 32,378,525 | 32,378,525 | 0 | 86,570,351 | 86,570,351 | 0 |
| Cost of GP visits | 288,737 | 345,750 | −57,013 | 488,136 | 550,781 | −62,645 | 3,249,334 | 3,686,664 | −437,331 |
| Cost of IRCs (outpatient) | 1,157,037 | 1,385,502 | −228,465 | 712,610 | 804,063 | −91,454 | 2,572,916 | 2,919,207 | −346,291 |
| Cost of IRCs (hospitalization) | 7,127,324 | 8,534,662 | −1,407,338 | 8,295,638 | 9,360,267 | −1,064,629 | 20,704,084 | 23,490,664 | −2,786,580 |
| Total costs (societal) | 67,020,197 | 64,496,697 | 2,523,500 | 63,835,993 | 61,583,322 | 2,252,671 | 167,147,145 | 164,032,551 | 3,114,594 |
| Societal costs | 15,504,270 | 17,670,904 | −2,166,634 | 11,800,770 | 13,114,170 | −1,313,400 | 30,150,780 | 33,381,810 | −3,231,029 |
| Cost effectiveness outcomes (Healthcare payer perspective) | |||||||||
| ICER (EUR /QALY) | 10,170 | 12,515 | 9894 | ||||||
| NMB (EUR) | 9,144,058 | 4,981,874 | 12,893,567 | ||||||
| Cost effectiveness outcomes (Societal perspective) | |||||||||
| ICER EUR /QALY) | 5472 | 7906 | 4856 | ||||||
| NMB (EUR) | 11,310,692 | 6,295,273 | 16,124,596 | ||||||
| Denmark | Norway | Sweden | |||||||
|---|---|---|---|---|---|---|---|---|---|
| aQIV | HD-QIV | Incremental | aQIV | HD-QIV | Incremental | aQIV | HD-QIV | Incremental | |
| Population size (≥65 years) | 1,198,676 | 989,474 | 2,118,766 | ||||||
| Health outcomes | |||||||||
| Number of symptomatic influenza cases | 31,590 | 32,157 | −567 | 29,685 | 30,032 | −346 | 64,815 | 65,608 | −793 |
| Number of GP visits | 9477 | 9647 | −170 | 8906 | 9009 | −104 | 19,445 | 19,683 | −238 |
| Number of IRCs | 5009 | 5099 | −90 | 4700 | 4755 | −55 | 10,287 | 10,413 | −126 |
| Number of hospitalizations | 1554 | 1582 | −28 | 1454 | 1471 | −17 | 3199 | 3238 | −39 |
| Number of deaths | 271 | 276 | −5 | 252 | 255 | −3 | 560 | 567 | −7 |
| Total LYs | 12,115,917 | 12,115,871 | 46 | 10,000,047 | 10,000,019 | 27 | 22,394,455 | 22,394,388 | 67 |
| Total QALYs | 9,325,198 | 9,325,156 | 42 | 7,902,627 | 7,902,601 | 26 | 16,430,639 | 16,430,581 | 58 |
| Costs outcomes (EUR) | |||||||||
| Total costs (healthcare payer) | 51,515,927 | 58,592,192 | −7,076,265 | 52,035,223 | 56,753,615 | −4,718,391 | 136,996,364 | 145,202,777 | −8,206,412 |
| Cost of vaccines | 15,552,821 | 22,475,175 | −6,922,354 | 10,160,315 | 14,767,899 | −4,607,585 | 23,899,680 | 31,781,490 | −7,881,810 |
| Cost of vaccine administration | 27,390,008 | 27,390,008 | 0 | 32,378,525 | 32,378,525 | 0 | 86,570,351 | 86,570,351 | 0 |
| Cost of GP visits | 288,737 | 293,920 | −5184 | 488,136 | 493,832 | −5696 | 3,249,334 | 3,289,096 | −39,762 |
| Cost of IRCs (outpatient) | 1,157,037 | 1,177,809 | −20,772 | 712,610 | 720,925 | −8315 | 2,572,916 | 2,604,400 | −31,485 |
| Cost of IRCs (hospitalization) | 7,127,324 | 7,255,279 | −127,955 | 8,295,638 | 8,392,434 | −96,796 | 20,704,084 | 20,957,439 | −253,356 |
| Total costs (societal) | 67,020,197 | 74,293,452 | −7,273,255 | 63,835,993 | 68,673,799 | −4,837,806 | 167,147,145 | 175,647,322 | −8,500,177 |
| Societal costs | 15,504,270 | 15,701,260 | −196,990 | 11,800,770 | 11,920,184 | −119,414 | 30,150,780 | 30,444,546 | −293,765 |
| Cost effectiveness outcomes (Healthcare payer perspective) | |||||||||
| ICER (EUR /QALY) | Dominant | Dominant | Dominant | ||||||
| NMB (EUR) | 8,334,069 | 5,495,571 | 9,955,639 | ||||||
| Cost effectiveness outcomes (Societal perspective) | |||||||||
| ICER EUR /QALY) | Dominant | Dominant | Dominant | ||||||
| NMB (EUR) | 8,531,060 | 5,614,985 | 10,249,405 | ||||||
| Scenario | ICER (EUR/QALY) | ||
|---|---|---|---|
| Denmark | Norway | Sweden | |
| Base case | 10,170 | 12,515 | 9894 |
| Scenario 1 (Vaccine coverage rates) | 10,170 | 12,515 | 9894 |
| Scenario 2.1 (Strain distribution 2014/15) | 9364 | 11,522 | 9162 |
| Scenario 2.2 (Strain distribution 2015/16) | 15,263 | 17,354 | 15,507 |
| Scenario 2.3 (Strain distribution 2016/17) | 6275 | 7966 | 5650 |
| Scenario 2.4 (Strain distribution 2017/18) | 12,952 | 14,563 | 12,291 |
| Scenario 2.5 (Strain distribution 2018/19) | 10,412 | 14,422 | 10,333 |
| Scenario 3 (aQIV rVE vs. SD-QIV at 13.9%) | 22,881 | 27,936 | 24,093 |
| Scenario 4.1 (lower bound SD-QIV VE) | 5367 | 6429 | 4490 |
| Scenario 4.2 (upper bound SD-QIV VE) | 17,168 | 21,615 | 17,793 |
| Scenario 5.1 (lower bound rVEs) | 45,919 | 55,886 | 49,828 |
| Scenario 5.2 (upper bound rVEs) | 5085 | 6345 | 4213 |
| Scenario 6.1 (30% decrease in complication costs) | 11,234 | 13,732 | 11,360 |
| Scenario 6.2 (30% increase in complication costs) | 9106 | 11,298 | 8429 |
| Scenario 7 (exclude HF) | 12,318 | 14,998 | 11,977 |
Disclaimer/Publisher’s Note: The statements, opinions and data contained in all publications are solely those of the individual author(s) and contributor(s) and not of MDPI and/or the editor(s). MDPI and/or the editor(s) disclaim responsibility for any injury to people or property resulting from any ideas, methods, instructions or products referred to in the content. |
© 2023 by the authors. Licensee MDPI, Basel, Switzerland. This article is an open access article distributed under the terms and conditions of the Creative Commons Attribution (CC BY) license (https://creativecommons.org/licenses/by/4.0/).
Share and Cite
Jacob, J.; Biering-Sørensen, T.; Holger Ehlers, L.; Edwards, C.H.; Mohn, K.G.-I.; Nilsson, A.; Hjelmgren, J.; Ma, W.; Sharma, Y.; Ciglia, E.; et al. Cost-Effectiveness of Vaccination of Older Adults with an MF59®-Adjuvanted Quadrivalent Influenza Vaccine Compared to Standard-Dose and High-Dose Vaccines in Denmark, Norway, and Sweden. Vaccines 2023, 11, 753. https://doi.org/10.3390/vaccines11040753
Jacob J, Biering-Sørensen T, Holger Ehlers L, Edwards CH, Mohn KG-I, Nilsson A, Hjelmgren J, Ma W, Sharma Y, Ciglia E, et al. Cost-Effectiveness of Vaccination of Older Adults with an MF59®-Adjuvanted Quadrivalent Influenza Vaccine Compared to Standard-Dose and High-Dose Vaccines in Denmark, Norway, and Sweden. Vaccines. 2023; 11(4):753. https://doi.org/10.3390/vaccines11040753
Chicago/Turabian StyleJacob, Jorge, Tor Biering-Sørensen, Lars Holger Ehlers, Christina H. Edwards, Kristin Greve-Isdahl Mohn, Anna Nilsson, Jonas Hjelmgren, Wenkang Ma, Yuvraj Sharma, Emanuele Ciglia, and et al. 2023. "Cost-Effectiveness of Vaccination of Older Adults with an MF59®-Adjuvanted Quadrivalent Influenza Vaccine Compared to Standard-Dose and High-Dose Vaccines in Denmark, Norway, and Sweden" Vaccines 11, no. 4: 753. https://doi.org/10.3390/vaccines11040753