
An Ethyl Acetate Extract of Eryngium carlinae Inflorescences Attenuates Oxidative Stress and Inflammation in the Liver of Streptozotocin-Induced Diabetic Rats
 , , , , , and
Abstract
: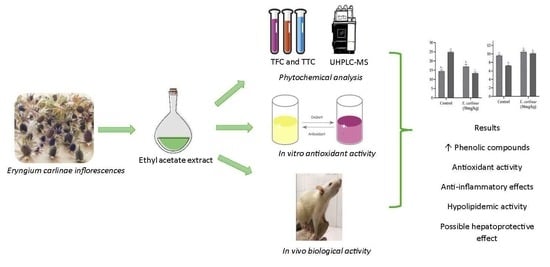
1. Introduction
2. Materials and Methods
2.1. Plant Material
2.2. Phytochemical Constituents of the Ethyl Acetate Extract
2.2.1. Total Flavonoid Content (TFC)
2.2.2. Total Terpenoid Content (TTC)
2.2.3. Identification and Quantification of Phenolic Compounds of the Ethyl Acetate Extract
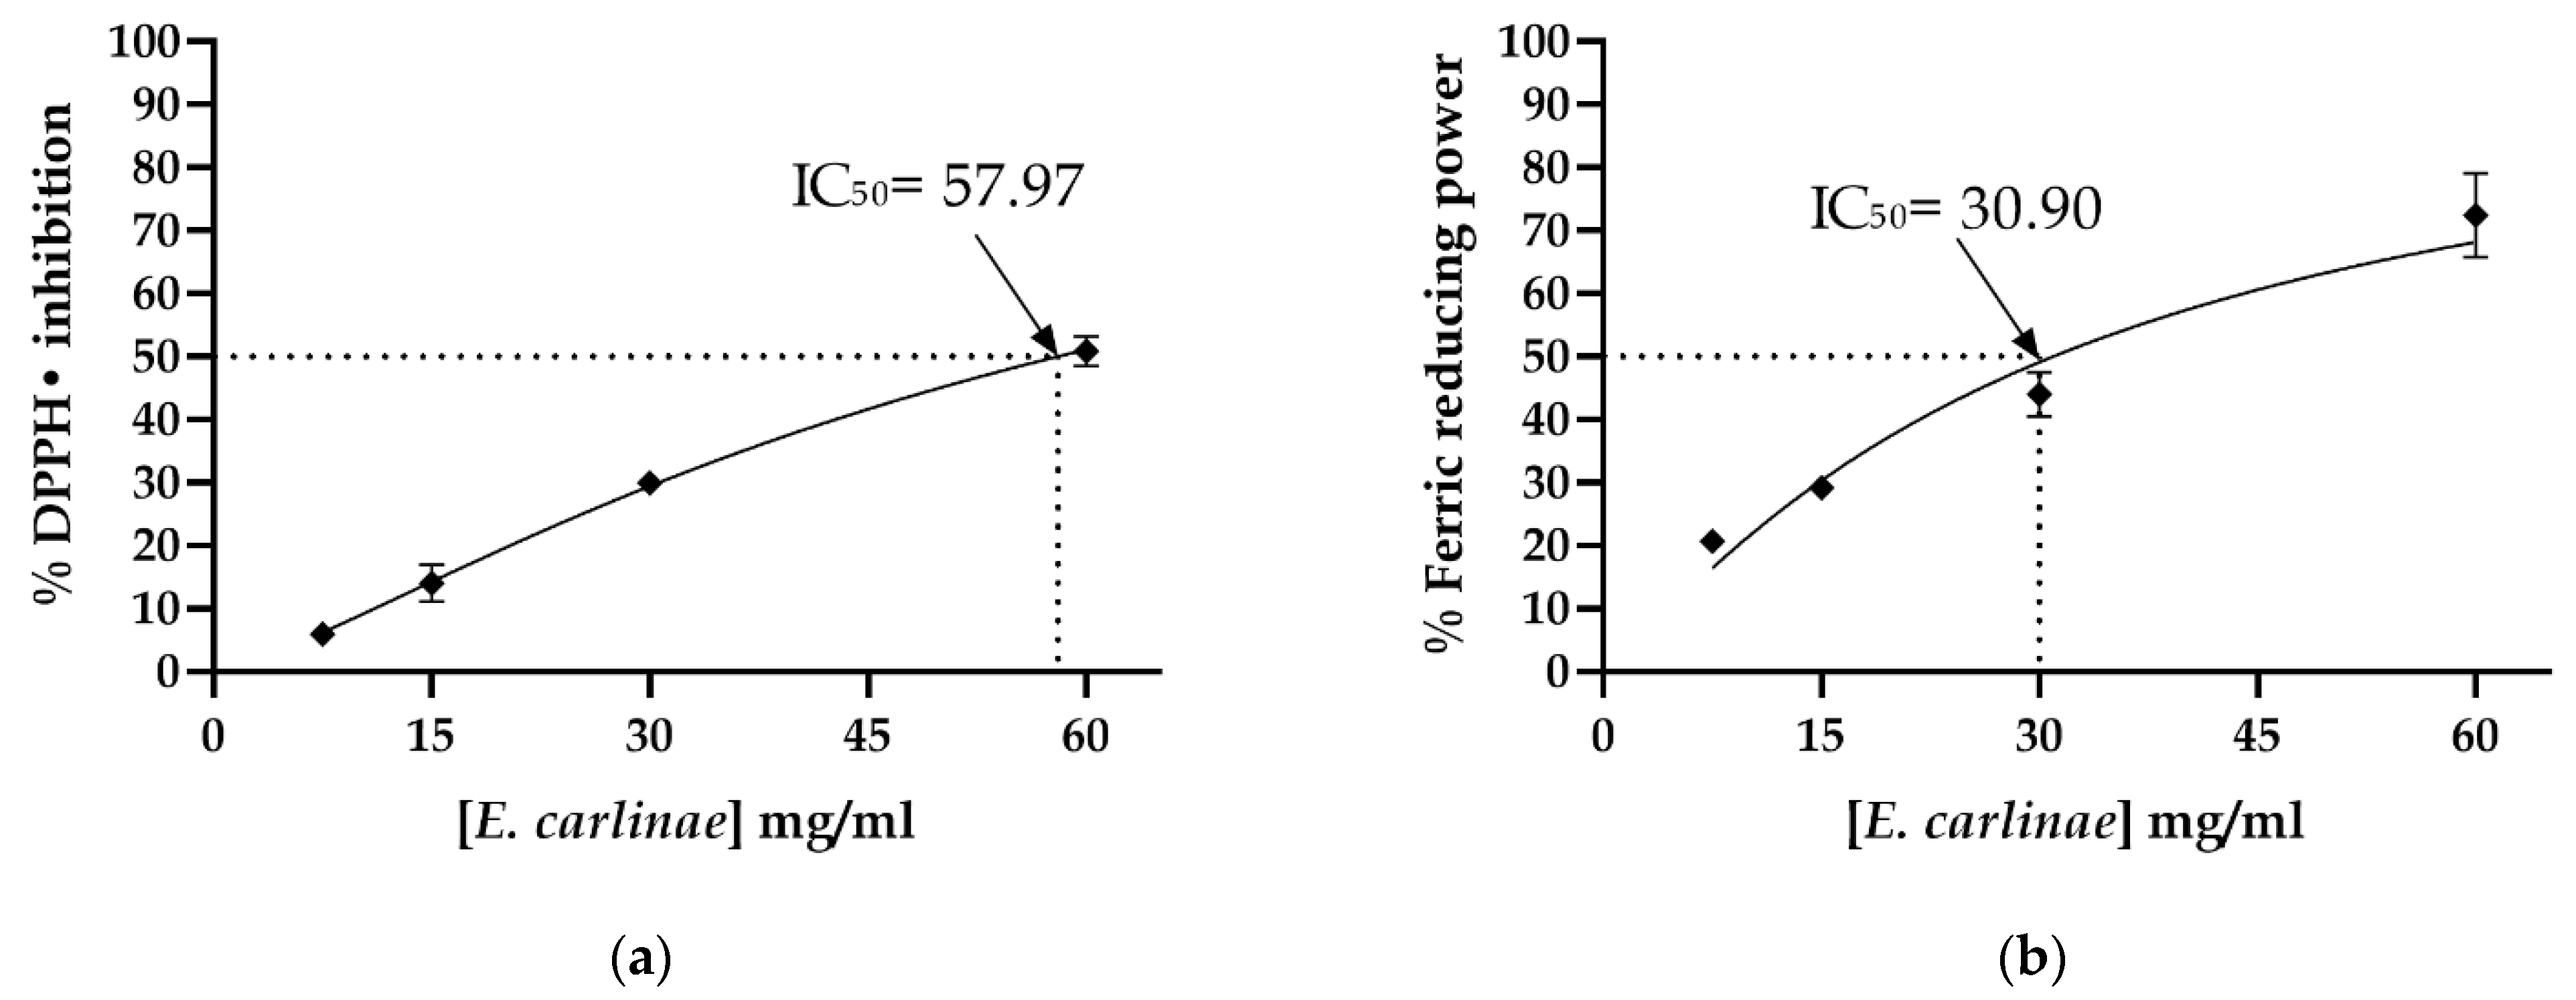
2.3. In Vitro Antioxidant Activity of the Ethyl Acetate Extract
DPPH Radical Scavenging Activity
2.4. In Vivo Biological Activity of the Ethyl Acetate Extract
2.4.1. Animals
2.4.2. Liver Triacylglycerides Content
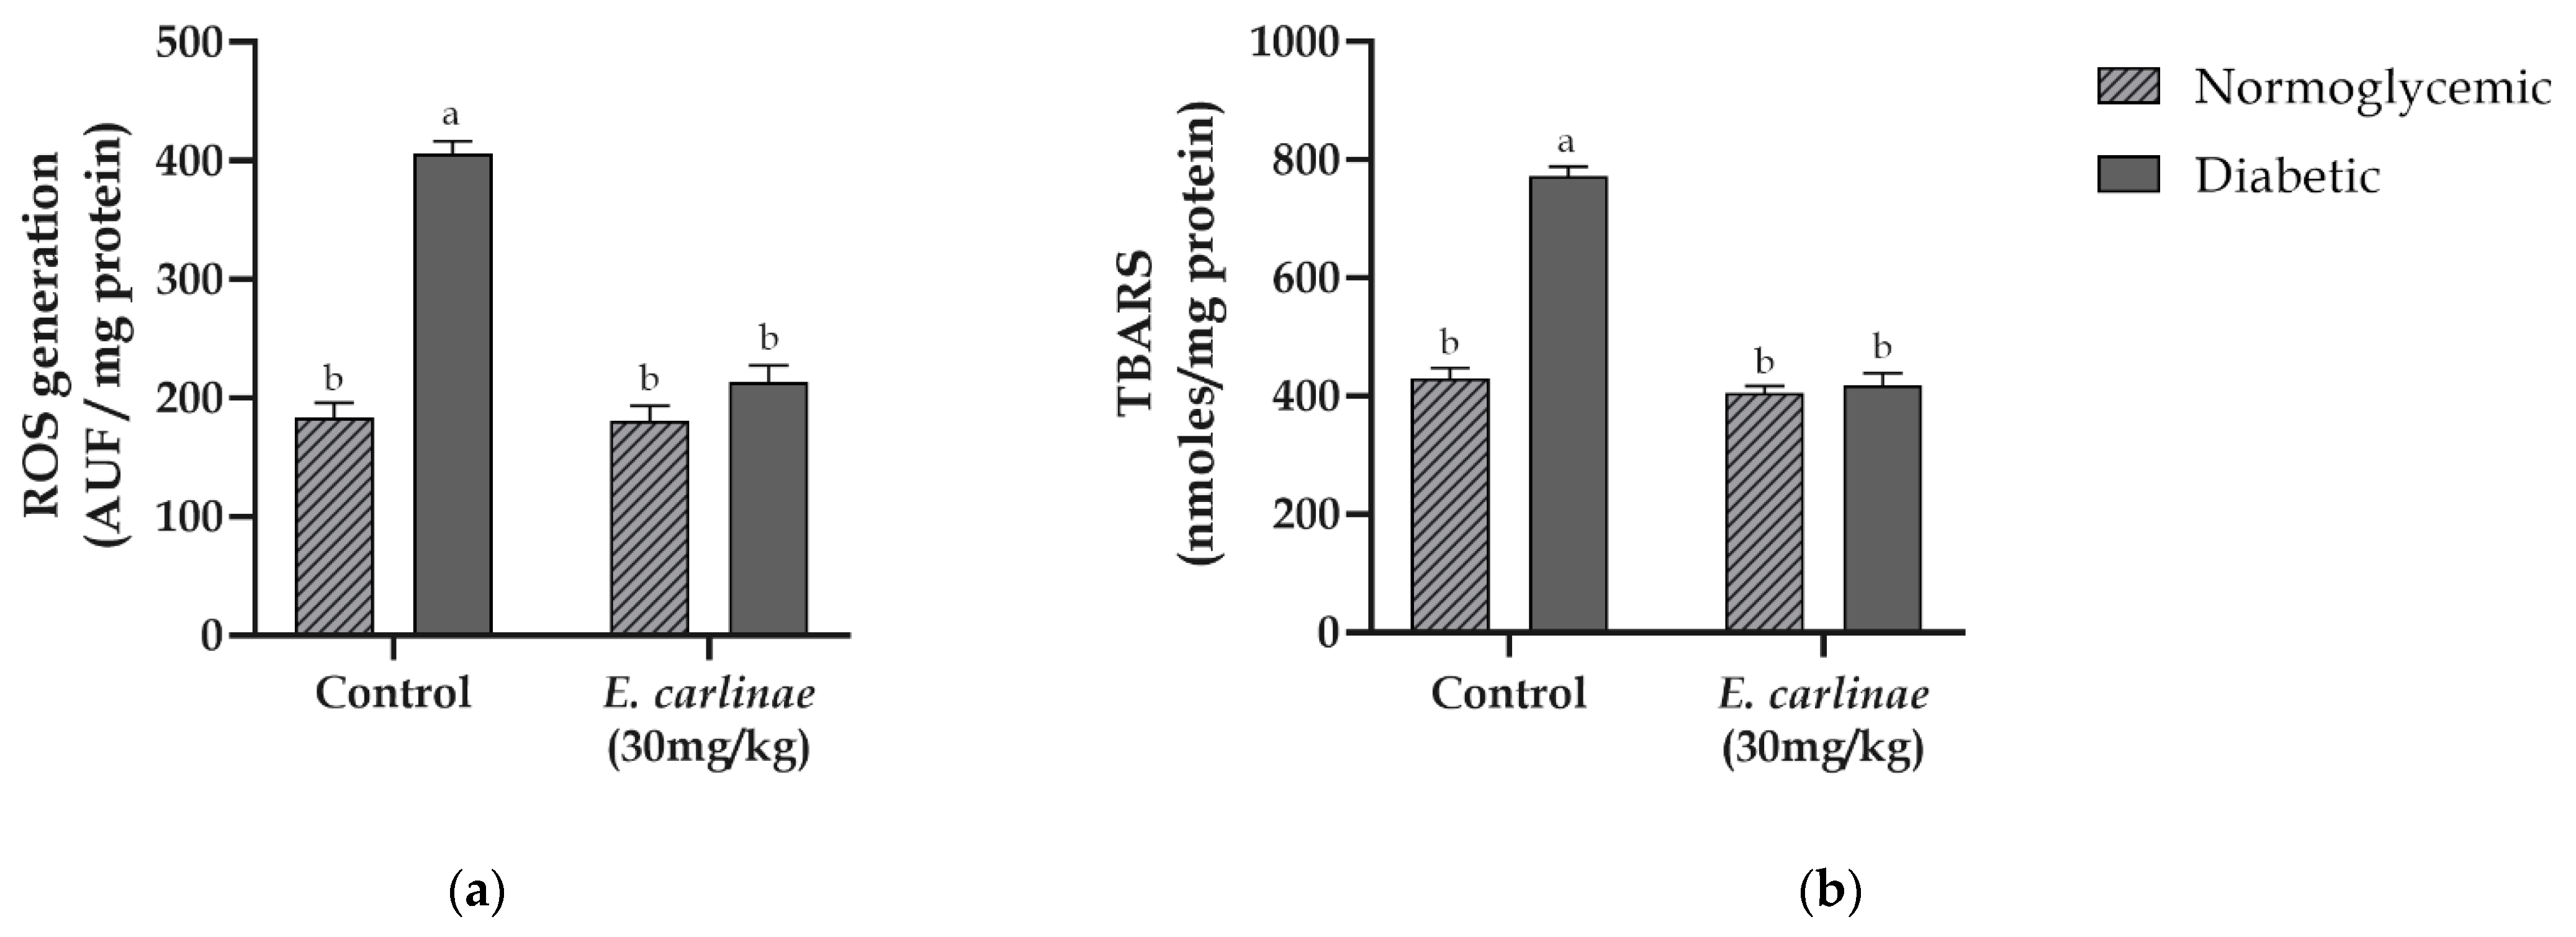
2.4.3. Oxidative Stress Markers
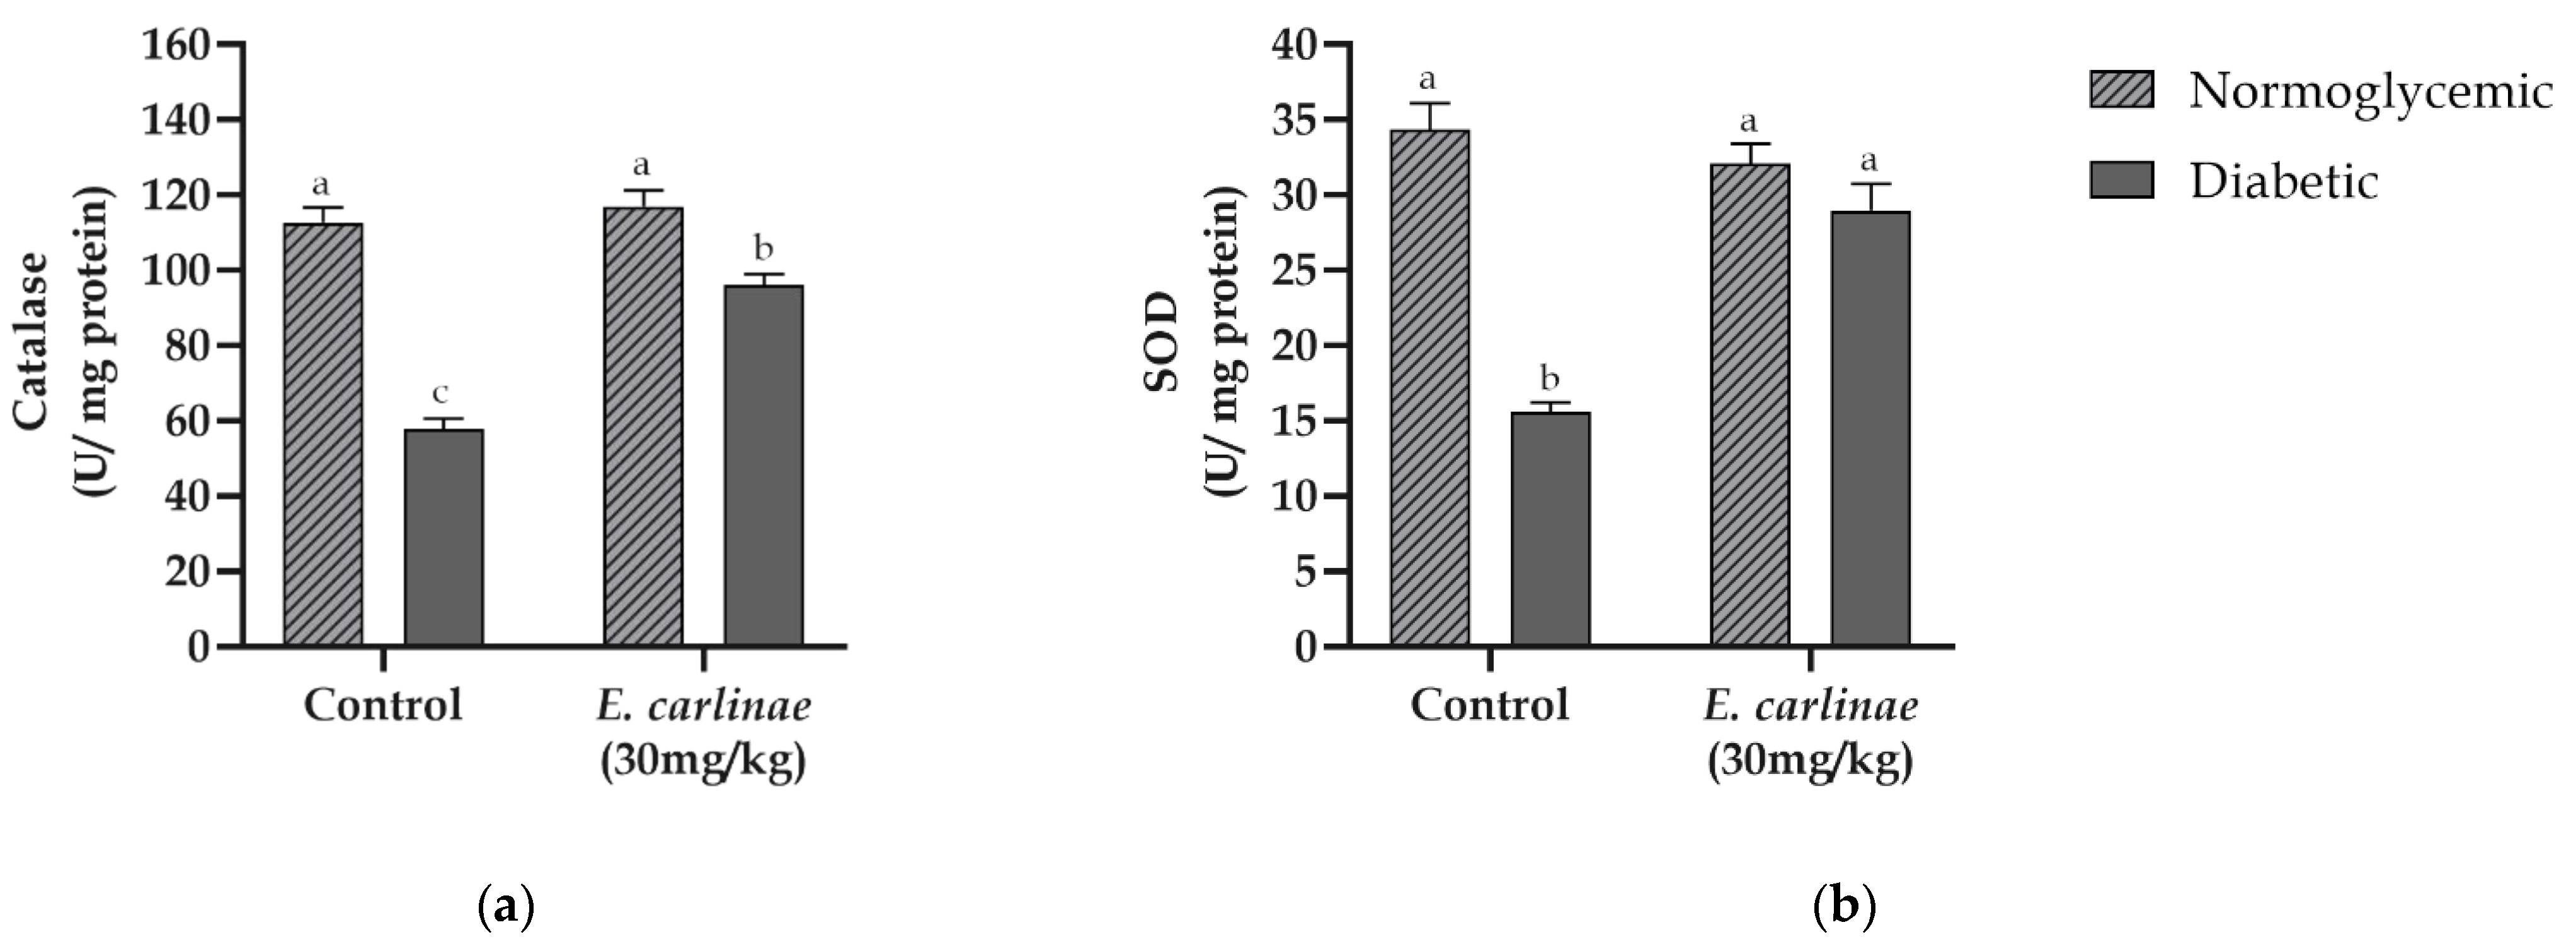
2.4.4. Antioxidant Enzyme Activities
2.4.5. Mitochondrial Respiratory Chain Complex Activities
2.4.6. Expression of Inflammatory Markers
2.5. Statistical Analysis
3. Results
3.1. Determination of the Phytochemical Constituents of the Ethyl Acetate Extract
3.2. Determination of the In Vitro Antioxidant Activity of the Ethyl Acetate Extract
3.3. Effect of the Ethyl Acetate Extract on Biochemical Parameters and Body Weight Gain In Vivo
3.4. Influence of the Ethyl Acetate Extract on Liver Enzymes and Triacylglycerides Content
3.5. Effect of the Ethyl Acetate Extract on Oxidative Stress Markers
3.6. Influence of the Ethyl Acetate Extract on Liver Antioxidant Enzyme Activity
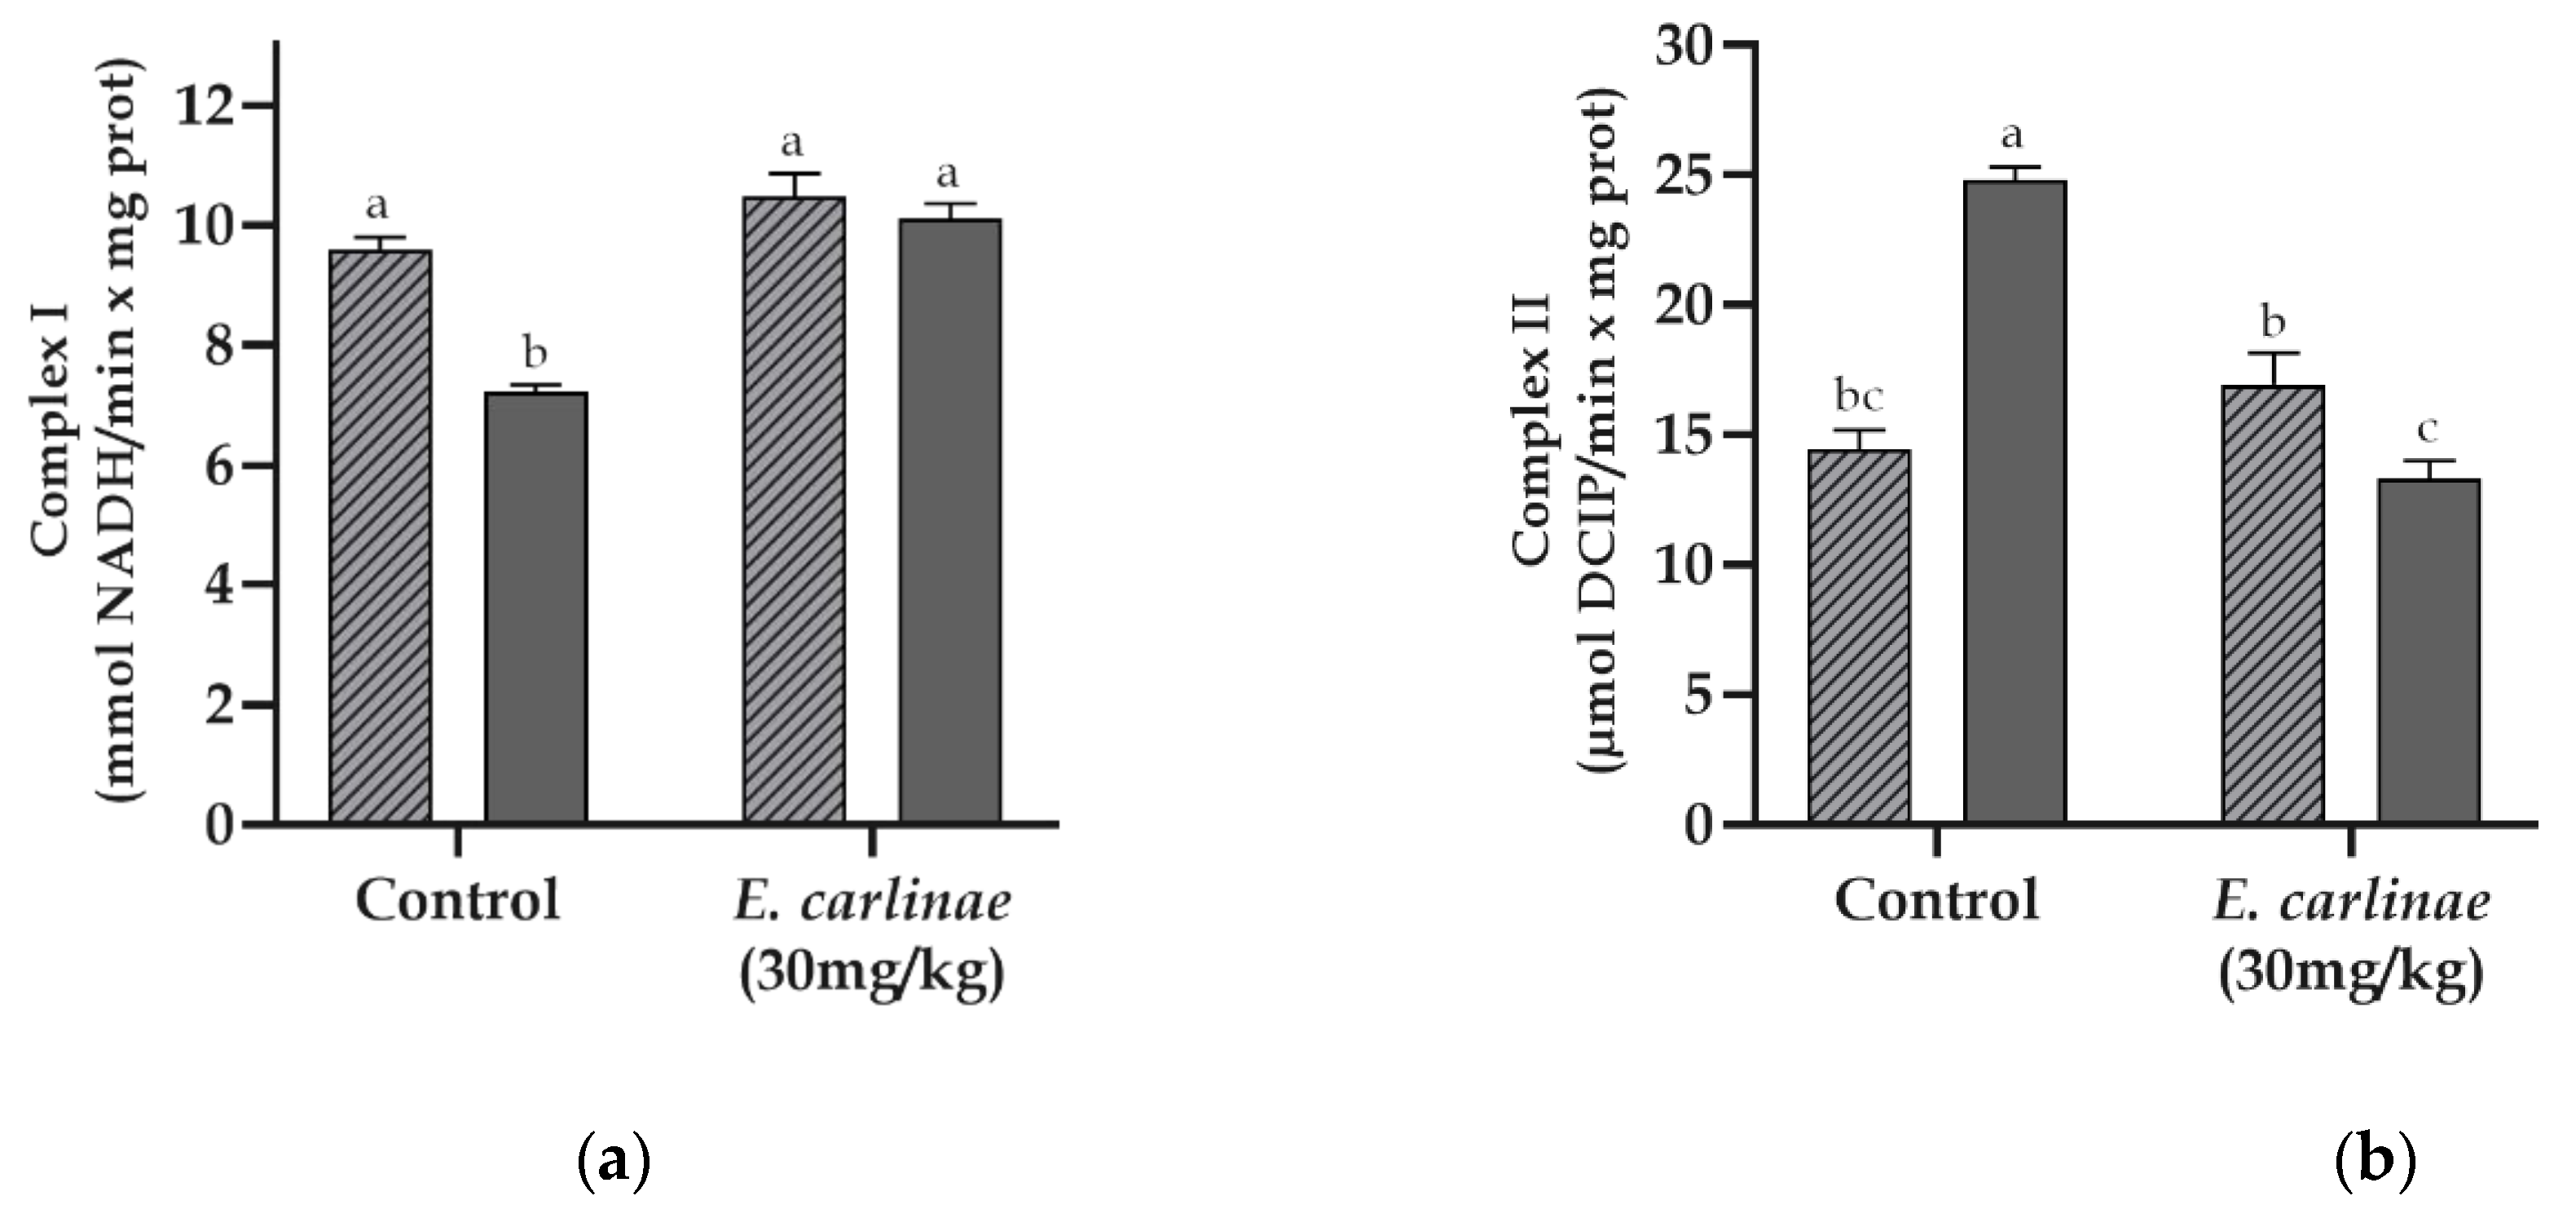
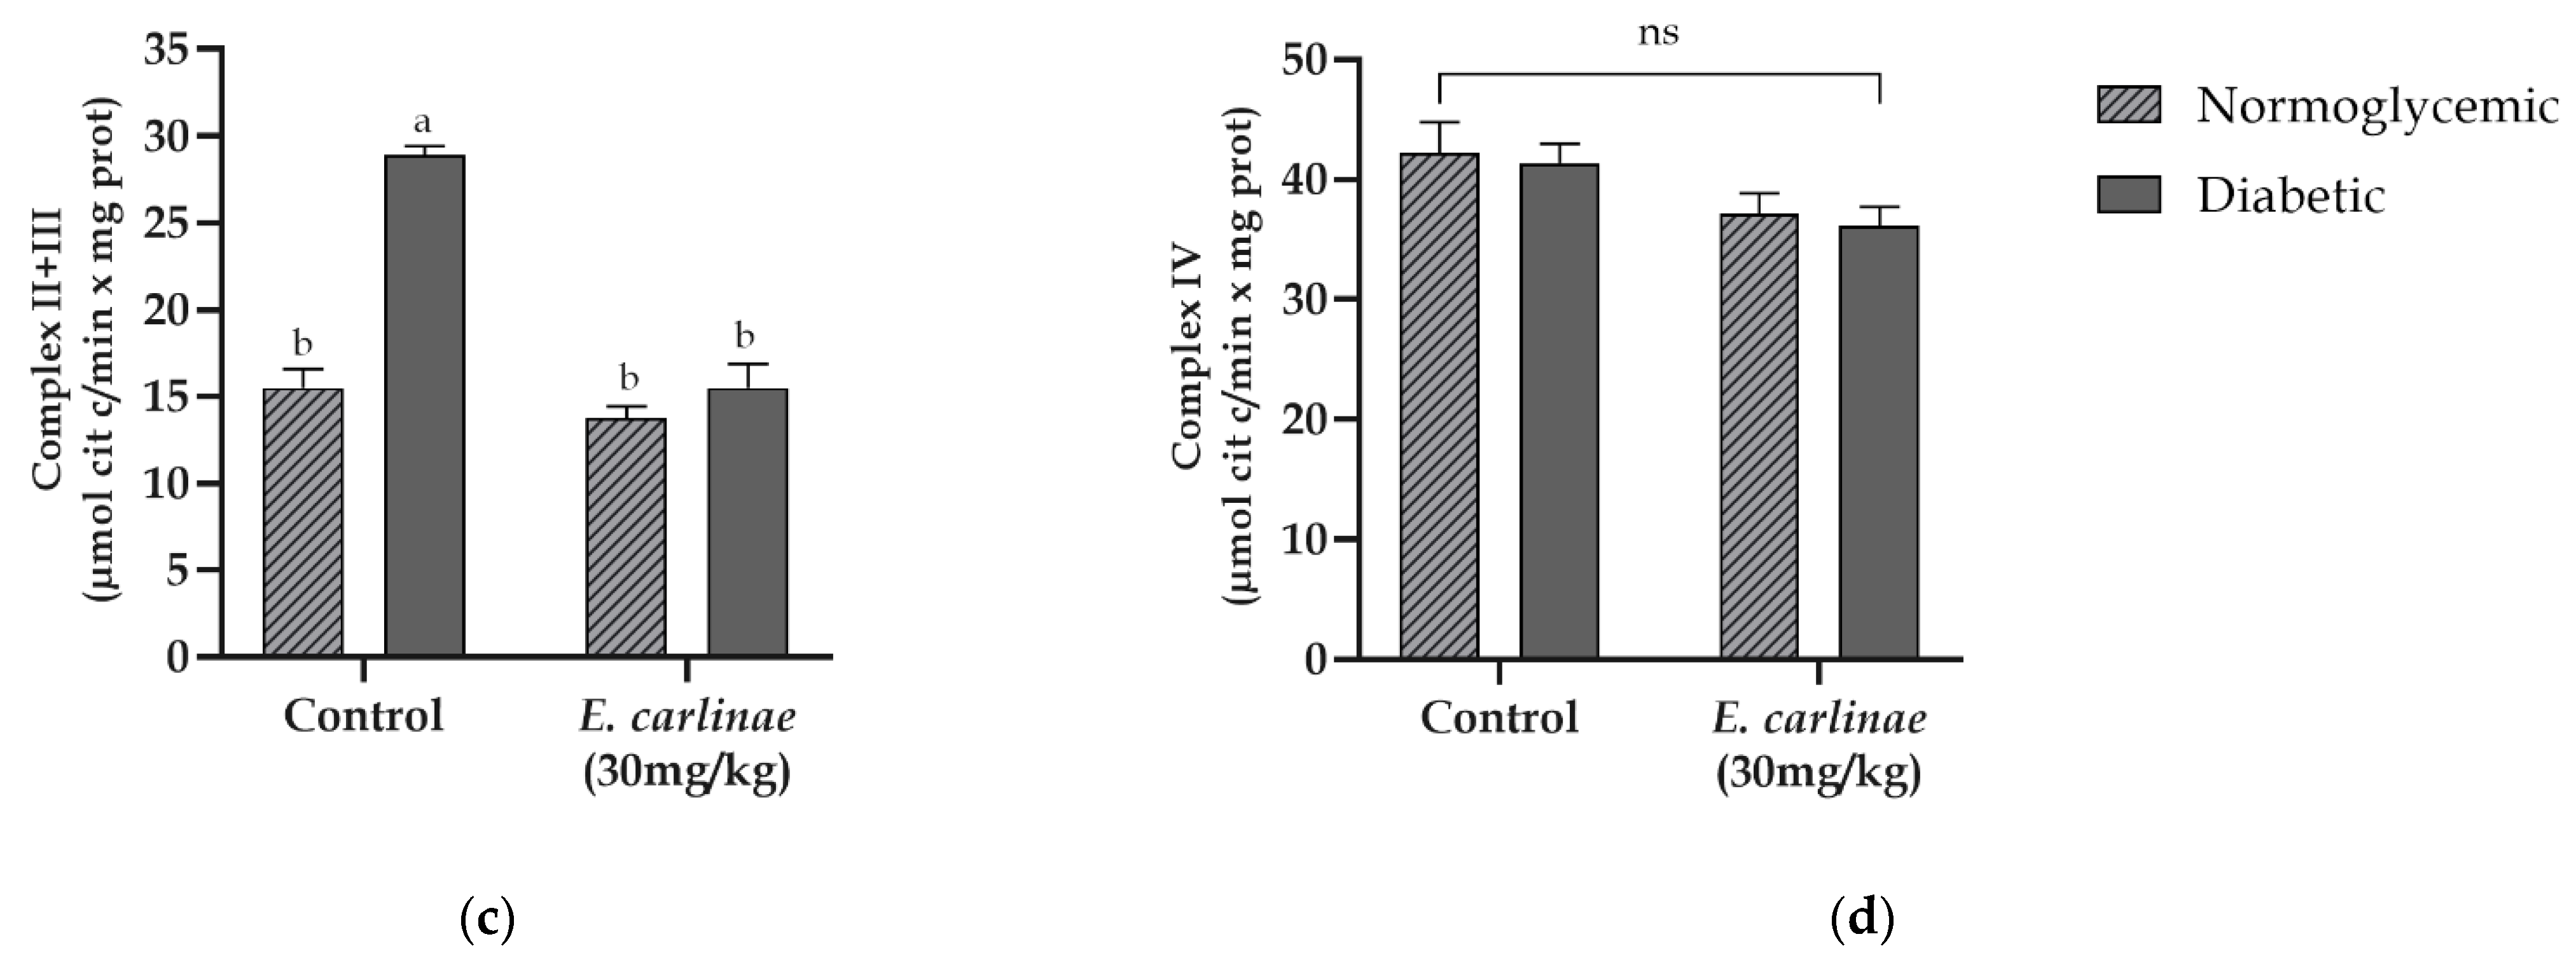
3.7. Effect of the Ethyl Acetate Extract on Mitochondrial Complex Activities
3.8. Effect of the Ethyl Acetate Extract on the Expression of Inflammatory Markers
4. Discussion
5. Conclusions
Author Contributions
Funding
Institutional Review Board Statement
Informed Consent Statement
Data Availability Statement
Acknowledgments
Conflicts of Interest
References
- Ullah, A.; Khan, A.; Khan, I. Diabetes mellitus and oxidative stress—A concise review. Saudi Pharm. J. 2016, 24, 547–553. [Google Scholar] [CrossRef] [Green Version]
- Mohamed, J.; Nazratun Nafizah, A.H.; Zariyantey, A.H.; Budin, S.B. Mechanisms of diabetes-induced liver damage: The role of oxidative stress and inflammation. Sultan Qaboos Univ. Med. J. 2016, 16, e132–e141. [Google Scholar] [CrossRef]
- Højland Ipsen, D.; Lykkesfeldt, J.; Tveden-Nyborg, P. Molecular mechanisms of hepatic lipid accumulation in non-alcoholic fatty liver disease. Cell. Mol. Life Sci. 2018, 75, 3313–3327. [Google Scholar] [CrossRef] [Green Version]
- Kashanian, S.; Fuchs, M. Non-Alcoholic Fatty Liver Disease in Patients with Diabetes Mellitus: A Clinician’s Perspective. Int. J. Dig. Dis. 2015, 1, 1–9. [Google Scholar] [CrossRef]
- Kim, K.S.; Lee, B.W.; Kim, Y.J.; Lee, D.H.; Cha, B.S.; Park, C.Y. Nonalcoholic fatty liver disease and diabetes: Part II: Treatment. Diabetes Metab. J. 2019, 43, 127–143. [Google Scholar] [CrossRef] [PubMed]
- Cheng, C.; Li, Z.; Zhao, X.; Liao, C.; Quan, J.; Bode, A.M.; Cao, Y.; Luo, X. Natural alkaloid and polyphenol compounds targeting lipid metabolism: Treatment implications in metabolic diseases. Eur. J. Pharmacol. 2020, 870, 172922. [Google Scholar] [CrossRef]
- Mohammadipour, F.; Niazi, M.; Veiskaramian, A.; Mokhayeri, Y.; Moayyedkazemi, A. Toward nonalcoholic fatty liver treatment; a review on herbal medicine treatment. J. Crit. Rev. 2020, 7, 554–564. [Google Scholar] [CrossRef]
- Bello-Gonzalez, M.A. Catálogo de Plantas Medicinales de la Comunidad Indígena Nuevo San Juan Parangaricutiro, Michoacán, México; CIRPAC, INIFAP, Eds.; SciELO Analytics: Morelia, Mexico, 2006. [Google Scholar]
- Saavedra-Molina, A.; Salgado-Garciglia, R.; Noriega-Cisneros, R.; Esquivel-Gutiérrez, E.R.; Manzo-Avalos, S.; Cortés-Rojo, C.; Montoya-Pérez, R. Oxidative stress in diabetes and hypertension treated with alternative therapy of medicinal plants. In Reactive Oxygen Species, Lipid Peroxidation and Protein Oxidation; Nova Science Publisher, INC: New York, NY, USA, 2014; pp. 205–218. ISBN 9781634631921. [Google Scholar]
- Noriega-Cisneros, R.; Peña-Montes, D.J.; Huerta-Cervantes, M.; Torres-Martínez, R.; Huerta, M.; Manzo-Avalos, S.; Salgado-Garciglia, R.; Saavedra-Molina, A. Eryngium carlinae Ethanol Extract Corrects Lipid Abnormalities in Wistar Rats with Experimental Diabetes. J. Med. Food 2019, 23, 827–833. [Google Scholar] [CrossRef]
- Castro-Torres, I.G.; De La O-Arciniega, M.; Naranjo-Rodríguez, E.B.; Castro-Torres, V.A.; Domínguez-Ortíz, M.Á.; Martínez-Vázquez, M. The Hypocholesterolemic Effects of Eryngium carlinae F. Delaroche Are Mediated by the Involvement of the Intestinal Transporters ABCG5 and ABCG8. Evid.-Based Complement. Altern. Med. 2017, 2017, 3176232. [Google Scholar] [CrossRef] [Green Version]
- Pérez-Ramírez, I.F.; Enciso-Moreno, J.A.; Guevara-González, R.G.; Gallegos-Corona, M.A.; Loarca-Piña, G.; Reynoso-Camacho, R. Modulation of renal dysfunction by Smilax cordifolia and Eryngium carlinae, and their effect on kidney proteome in obese rats. J. Funct. Foods 2016, 20, 545–555. [Google Scholar] [CrossRef]
- Peña-Montes, D.J.; Huerta-Cervantes, M.; Ríos-Silva, M.; Trujillo, X.; Huerta, M.; Noriega-Cisneros, R.; Salgado-Garciglia, R.; Saavedra-Molina, A. Protective effect of the hexanic extract of Eryngium carlinae inflorescences in vitro, in yeast, and in streptozotocin-induced diabetic male rats. Antioxidants 2019, 8, 73. [Google Scholar] [CrossRef] [PubMed] [Green Version]
- García-Cerrillo, D.; Noriega-Cisneros, R.; Peña-Montes, D.; Huerta-Cervantes, M.; Ríos-Silva, M.; Salgado-Garciglia, R.; Montoya-Pérez, R.; Saavedra-Molina, A. Antioxidant Effects of Eryngium carlinae in Diabetic Rats. Asian J. Appl. Sci. 2018, 6, 308–314. [Google Scholar] [CrossRef] [Green Version]
- Arana-Argáez, V.; Alonso-castro, A.J.; Yáñez-Barrientos, E.; Euan-Canto, A.; Torres-Romero, J.C.; Isiordia-Espinoza, M.A.; Brennan-Bourdon, L.M.; del Carmen Juárez-Vázquez, M.; González-Ibarra, A.A. In vitro and in vivo anti-inflammatory effects of an ethanol extract from the aerial parts of Eryngium carlinae F. Delaroche (Apiaceae). J. Ethnopharmacol. 2021, 266, 113406. [Google Scholar] [CrossRef] [PubMed]
- Van De Wier, B.; Koek, G.H.; Bast, A.; Haenen, G.R.M.M. The potential of flavonoids in the treatment of non-alcoholic fatty liver disease. Crit. Rev. Food Sci. Nutr. 2017, 57, 834–855. [Google Scholar] [CrossRef]
- Xiao, J.; So, K.F.; Liong, E.C.; Tipoe, G.L. Recent advances in the herbal treatment of non-alcoholic fatty liver disease. J. Tradit. Complement. Med. 2013, 3, 88–94. [Google Scholar] [CrossRef] [Green Version]
- Xu, Y.; Guo, W.; Zhang, C.; Chen, F.; Tan, H.Y.; Li, S.; Wang, N.; Feng, Y. Herbal Medicine in the Treatment of Non-Alcoholic Fatty Liver Diseases-Efficacy, Action Mechanism, and Clinical Application. Front. Pharmacol. 2020, 11, 601. [Google Scholar] [CrossRef]
- Kim, D.; Jeong, S.W.; Lee, C.Y. Antioxidant capacity of phenolic phytochemicals from various cultivars of plums. Food Chem. 2003, 81, 321–326. [Google Scholar] [CrossRef]
- Ghorai, N.; Chakraborty, S.; Gucchait, S.; Saha, S.; Biswas, S. Estimation of total Terpenoids concentration in plant tissues using a monoterpene, Linalool as standard reagent. Protoc. Exch. 2012, 5, 1038. [Google Scholar] [CrossRef]
- Juárez-Trujillo, N.; Monribot-Villanueva, J.L.; Jiménez-Fernández, V.M.; Suárez-Montaño, R.; Aguilar-Colorado, Á.S.; Guerrero-Analco, J.A.; Jiménez, M. Phytochemical characterization of Izote (Yucca elephantipes) flowers. J. Appl. Bot. Food Qual. 2018, 91, 202–210. [Google Scholar]
- Monribot-Villanueva, J.L.; Elizalde-Contreras, J.M.; Aluja, M.; Segura-Cabrera, A.; Birke, A.; Guerrero-Analco, J.A.; Ruiz-May, E. Endorsing and extending the repertory of nutraceutical and antioxidant sources in mangoes during postharvest shelf life. Food Chem. 2019, 285, 119–129. [Google Scholar] [CrossRef]
- Blois, M. Antioxidant Determinations by the Use of a Stable Free Radical. Nature 1958, 181, 1199–1200. [Google Scholar] [CrossRef]
- Vijayalakshmi, M.; Ruckmani, K. Ferric reducing anti-oxidant power assay in plant extract. Bangladesh J. Pharmacol. 2016, 11, 570–572. [Google Scholar] [CrossRef] [Green Version]
- Saavedra-Molina, A.; Devlin, T.M. Effect of extra- and intra-mitochondrial calcium on citrulline synthesis. Amino Acids 1997, 12, 293–298. [Google Scholar] [CrossRef]
- Aguilera-Méndez, A.; Fernández-Mejía, C. The hypotriglyceridemic effect of biotin supplementation involves increased levels of cGMP and AMPK activation. BioFactors 2012, 38, 387–394. [Google Scholar] [CrossRef] [PubMed]
- Ortiz-Avila, O.; Gallegos-Corona, M.A.; Sánchez-Briones, L.A.; Calderón-Cortés, E.; Montoya-Pérez, R.; Rodriguez-Orozco, A.R.; Campos-García, J.; Saavedra-Molina, A.; Mejía-Zepeda, R.; Cortés-Rojo, C. Protective effects of dietary avocado oil on impaired electron transport chain function and exacerbated oxidative stress in liver mitochondria from diabetic rats. J. Bioenerg. Biomembr. 2015, 47, 337–353. [Google Scholar] [CrossRef] [PubMed]
- Buege, J.A.; Aust, S.D. Microsomal Lipid Peroxidation. Methods Enzymol. 1978, 52, 302–310. [Google Scholar] [PubMed]
- Jeulin, C.; Soufir, J.C.; Weber, P.; Laval-Martin, D.; Calvayrac, R. Catalase activity in human spermatozoa and seminal plasma. Gamete Res. 1989, 24, 185–196. [Google Scholar] [CrossRef]
- Cortés-Rojo, C.; Calderón-Cortés, E.; Clemente-Guerrero, M.; Estrada-Villagómez, M.; Manzo-Avalos, S.; Mejía-Zepeda, R.; Bolgogh, I.; Saavedra-Molina, A. Elucidation of the effects of lipoperoxidation on the mitochondrial electron transport chain using yeast mitochondria with manipulated fatty acid content. J. Bioenerg. Biomembr. 2009, 41, 15–28. [Google Scholar] [CrossRef] [Green Version]
- Peña-Montes, D.J.; Huerta-Cervantes, M.; Ríos-Silva, M.; Trujillo, X.; Cortés-Rojo, C.; Huerta, M.; Saavedra-Molina, A. Effects of dietary iron restriction on kidney mitochondria function and oxidative stress in streptozotocin-diabetic rats. Mitochondrion 2020, 54, 41–48. [Google Scholar] [CrossRef]
- Erdem, S.A.; Nabavi, S.F.; Orhan, I.E.; Daglia, M.; Izadi, M.; Nabavi, S.M. Blessings in disguise: A review of phytochemical composition and antimicrobial activity of plants belonging to the genus Eryngium. DARU J. Pharm. Sci. 2015, 23, 53. [Google Scholar] [CrossRef] [Green Version]
- Paşayeva, L.; Şafak, E.K.; Arıgün, T.; Fatullayev, H.; Tugay, O. In vitro antioxidant capacity and phytochemical characterization of Eryngium kotschyi Boiss. J. Pharm. Pharmacogn. Res. 2020, 8, 18–31. [Google Scholar] [CrossRef] [PubMed]
- Matejić, J.S.; Stojanović-Radić, Z.Z.; Ristić, M.S.; Veselinović, J.B.; Zlatković, B.K.; Marin, P.D.; Džamić, A.M. Chemical characterization, in vitro biological activity of essential oils and extracts of three Eryngium L. species and molecular docking of selected major compounds. J. Food Sci. Technol. 2018, 55, 2910–2925. [Google Scholar] [CrossRef] [PubMed]
- Kikowska, M.; Chanaj-Kaczmarek, J.; Derda, M.; Budzianowska, A.; Thiem, B.; Ekiert, H.; Szopa, A. The Evaluation of Phenolic Acids and Flavonoids Content and Antiprotozoal Activity of Eryngium Species Biomass Produced by Biotechnological Methods. Molecules 2022, 27, 363. [Google Scholar] [CrossRef]
- Kumar, S.; Pandey, A.K. Chemistry and Biological Activities of Flavonoids: An Overview. Sci. World J. 2013, 2013, 162750. [Google Scholar] [CrossRef] [PubMed] [Green Version]
- Zeb, A. Concep, mechanism, and applications of phenolic antioxidants in foods. J. Food Biochem. 2020, 44, e13394. [Google Scholar] [CrossRef] [PubMed]
- Matejić, J.S.; Stojanović-Radić, Z.Z.; Krivošej, Z.D.; Zlatković, B.K.; Marin, P.D.; Džamić, A.M. Biological Activity of Extracts and Essential Oils of Two Eryngium (Apiaceae) Species from the Balkan Peninsula. Acta Med. Median. 2019, 58, 24–31. [Google Scholar] [CrossRef]
- Bibi, N.; Shah, M.H.; Khan, N.; Al-Hashimi, A.; Elshikh, M.S. Variations in Total Phenolic, Total Flavonoid Contents, and Free Radicals ’ Scavenging Potential of Onion Varieties Planted. Plants 2022, 11, 950. [Google Scholar] [CrossRef]
- Lal, S.B. Diabetes: Causes, Symptoms and Treatments. In Public Health Environment and Social Issues in India; Sériales Publication: Delhi, India, 2016; Chapter 5; pp. 55–67. [Google Scholar]
- Alexopoulos, A.-S.; Qamar, A.; Hutchins, K.; Crowley, M.J.; Batch, B.C.; Guyton, J.R. Triglycerides: Emerging Targets in Diabetes Care? Review of Moderate Hypertriglyceridemia in Diabetes. Curr. Diab. Rep. 2019, 19, 13. [Google Scholar] [CrossRef]
- Noriega-Cisneros, R.; Ortiz-Vila, O.; Esquivel-Gutiérrez, E.; Clemente-Guerrero, M.; Manzo-Avalos, S.; Salgado-Garciglia, R.; Cortés-Rojo, C.; Boldogh, I.; Saavedra-Molina, A. Hypolipidemic activity of Eryngium carlinae on streptozotocin-induced diabetic rats. Biochem. Res. Int. 2012, 2012, 603501. [Google Scholar] [CrossRef] [Green Version]
- Feng, S.; Belwal, T.; Li, L.; Limwachiranon, J.; Liu, X.; Luo, Z. Phytosterols and their derivatives: Potential health-promoting uses against lipid metabolism and associated diseases, mechanism, and safety issues. Compr. Rev. Food Sci. Food Saf. 2020, 19, 1243–1267. [Google Scholar] [CrossRef]
- Murillo-Villicaña, M.; Noriega-Cisneros, R.; Peña-Montes, J.D.; Huerta-Cervantes, M.; Aguilera-Méndez, A.; Cortés-Rojo, C.; Salgado-Garciglia, R.; Montoya-Pérez, R.; Riveros-Rosas, H.; Saavedra-Molina, A. Antilidemic and hepatoprotective effects of ethanol extract of Justicia spicigera in steptozotocin diabetic rats. Nutrients 2022, 14, 1946. [Google Scholar] [CrossRef] [PubMed]
- Nyandwi, J.B.; Ko, Y.S.; Jin, H.; Yun, S.P.; Park, S.W.; Kim, H.J. Rosmarinic acid exhibits a lipid-lowering effect by modulating the expression of reverse cholesterol transporters and lipid metabolism in high-fat diet-fed mice. Biomolecules 2021, 11, 1470. [Google Scholar] [CrossRef] [PubMed]
- Kim, M.; Yoo, G.; Randy, A.; Son, Y.J.; Hong, C.R.; Kim, S.M.; Nho, C.W. Lemon balm and its constituent, rosmarinic acid, alleviate liver damage in an animal model of nonalcoholic steatohepatitis. Nutrients 2020, 12, 1166. [Google Scholar] [CrossRef] [PubMed] [Green Version]
- Aguilera-Méndez, A. Esteatosis hepática no alcohólica: Una enfermedad silente. Rev. Med. Inst. Mex. Seguro Soc. 2018, 56, 544–549. [Google Scholar]
- Wang, K.; Tan, W.; Liu, X.; Deng, L.; Huang, L.; Wang, X.; Gao, X. New insight and potential therapy for NAFLD: CYP2E1 and flavonoids. Biomed. Pharmacother. 2021, 137, 111326. [Google Scholar] [CrossRef]
- Rodríguez, V.; Plavnik, L.; Tolosa de Talamoni, N. Naringin attenuates liver damage in streptozotocin-induced diabetic rats. Biomed. Pharmacother. 2018, 105, 95–102. [Google Scholar] [CrossRef]
- Shi, Z.; Li, T.; Liu, Y.; Cai, T.; Yao, W.; Jiang, J.; He, Y.; Shan, L. Hepatoprotective and Anti-Oxidative Effects of Total Flavonoids From Qu Zhi Qiao (Fruit of Citrus Paradisi cv. Changshanhuyou) on Nonalcoholic Steatohepatitis In Vivo and In Vitro through Nrf2-ARE Signaling Pathway. Front. Pharmacol. 2020, 11, 483. [Google Scholar] [CrossRef] [Green Version]
- Arab, J.P.; Barrera, F.; Arrese, M. The evolving role of liver biopsy in non-alcoholic fatty liver disease. Ann. Hepatol. 2018, 17, 899–902. [Google Scholar] [CrossRef]
- Jiang, S.; Young, J.L.; Wang, K.; Qian, Y.; Cai, L. Diabetic-induced alterations in hepatic glucose and lipid metabolism: The role of type 1 and type 2 diabetes mellitus (Review). Mol. Med. Rep. 2020, 22, 603–611. [Google Scholar] [CrossRef]
- Chen, Z.; Tian, R.; She, Z.; Cai, J.; Li, H. Role of oxidative stress in the pathogenesis of nonalcoholic fatty liver disease. Free Radic. Biol. Med. 2020, 152, 116–141. [Google Scholar] [CrossRef]
- Noor, S.; Mohammad, T.; Abdul, M.; Raza, A.; Azum, N. Biomedical features and therapeutic potential of rosmarinic acid. Arch. Pharm. Res. 2022, 45, 205–228. [Google Scholar] [CrossRef]
- Fadel, O.; El Kirat, K.; Morandat, S. The natural antioxidant rosmarinic acid spontaneously penetrates membranes to inhibit lipid peroxidation in situ. Biochim. Biophys. Acta 2011, 1808, 2973–2980. [Google Scholar] [CrossRef] [PubMed] [Green Version]
- Schmatz, R.; Perreira, L.B.; Stefanello, N.; Mazzanti, C.; Spanevello, R.; Gutierres, J.; Bagatini, M.; Martins, C.C.; Abdalla, F.H.; Daci Da Silva Serres, J.; et al. Effects of resveratrol on biomarkers of oxidative stress and on the activity of delta aminolevulinic acid dehydratase in liver and kidney of streptozotocin-induced diabetic rats. Biochimie 2012, 94, 374–383. [Google Scholar] [CrossRef] [Green Version]
- Lu, Y.; Hong, Y.; Zhang, T.; Chen, Y.; Wei, Z.; Gao, C. Rosmarinic acid exerts anti-inflammatory effect and relieves oxidative stress via Nrf2 activation in carbon tetrachloride-induced liver damage. Food Nutr. Res. 2022, 1, 1–13. [Google Scholar] [CrossRef]
- Petrosillo, G.; Portincasa, P.; Grattagliano, I.; Casanova, G.; Matera, M.; Ruggiero, F.M.; Ferri, D.; Paradies, G. Mitochondrial dysfunction in rat with nonalcoholic fatty liver Involvement of complex I, reactive oxygen species and cardiolipin. Biochim. Biophys. Acta-Mol. Cell Res. 2007, 1767, 1260–1267. [Google Scholar] [CrossRef] [PubMed] [Green Version]
- Moreira, P.; Santos, M.; Moreno, A.; Proenca, T.; Seica, R.; Oliveira, C.R. Effect of Streptozotocin-Induced Diabetes on Rat Brain Mitochondria. J. Neuroendocrinol. 2004, 16, 32–38. [Google Scholar] [CrossRef] [PubMed]
- Lanciano, P.; Khalfaoui-hassani, B.; Selamoglu, N.; Ghelli, A.; Rugolo, M.; Daldal, F. Molecular mechanisms of superoxide production by complex III: A bacterial versus human mitochondrial comparative case study. Biochim. Biophys. Acta 2013, 1827, 1332–1339. [Google Scholar] [CrossRef]
- Sun, B.; Karin, M. NF-κB signaling, liver disease and hepatoprotective agents. Oncogene 2008, 27, 6228–6244. [Google Scholar] [CrossRef] [Green Version]
- Tian, J.; Zhao, Y.; Wang, L.; Li, L. Role of TLR4/MyD88/NF-κB signaling in heart and liver-related complications in a rat model of type 2 diabetes mellitus. J. Int. Med. Res. 2021, 49, 0300060521997590. [Google Scholar] [CrossRef]
- Komeili-Movahhed, T.; Bassirian, M.; Changizi, Z.; Moslehi, A. SIRT1/NF κ B pathway mediates anti-inflammatory and anti-apoptotic effects of rosmarinic acid on in a mouse model of nonalcoholic steatohepatitis. J. Recept. Signal Transduct. 2022, 42, 241–250. [Google Scholar] [CrossRef]
- Feng, X.; Weng, D.; Zhou, F.; Owen, Y.D.; Qin, H.; Zhao, J.; WenYu; Huang, Y.; Chen, J.; Fu, H.; et al. Activation of PPARγ by a Natural Flavonoid Modulator, Apigenin Ameliorates Obesity-Related Inflammation Via Regulation of Macrophage Polarization. EBioMedicine 2016, 9, 61–76. [Google Scholar] [CrossRef] [PubMed] [Green Version]
- Alisi, A.; Carpino, G.; Oliveira, F.L.; Panera, N.; Nobili, V.; Gaudio, E. The Role of Tissue Macrophage-Mediated Inflammation on NAFLD Pathogenesis and Its Clinical Implications. Mediat. Inflamm. 2017, 2017, 8162421. [Google Scholar] [CrossRef] [PubMed] [Green Version]
- Muriel, P. Regulation of nitric oxide synthesis in the liver. J. Appl. Toxicol. 2000, 20, 189–195. [Google Scholar] [CrossRef]


| TFC (mg QE/mL) | TTC (mg LE/mL) |
|---|---|
| 4.097 ± 0.0715 | 0.8105 ± 0.0224 |
| Compound | Retention Time (min) | Concentration (µg/g of Dried Extract) | Compound | Retention Time (min) | Concentration (µg/g of Dried Extract) |
|---|---|---|---|---|---|
| Protocatechuic acid | 2.5 | 23.53 ± 0.93 | Salicylic acid | 9.15 | 8.08 ± 0.42 |
| 4-Hydroxybenzoic acid | 3.76 | 34.58 ± 1.23 | Ellagic acid | 9.98 | 3.34 ± 0.43 |
| Vanillic acid | 5.12 | 7.48 ± 0.20 | Quercetin-3-D-Galactoside | 10.26 | 4.03 ± 0.16 |
| Chlorogenic acid | 5.34 | 64.92 ± 1.24 | p-Anisic acid | 10.45 | 33.71 ± 0.95 |
| Caffeic acid | 5.38 | 26.11 ± 0.88 | Kaempferol-3-O-glucoside | 11.91 | 50.42 ± 1.72 |
| Vanillin | 6.52 | 22.76 ± 0.30 | Rosmarinic acid | 12.8 | 3473.79 ± 146.18 |
| 4-Coumaric acid | 7.21 | 13.79 ± 0.35 | Quercetin | 15.18 | 3.96 ± 0.07 |
| Umbelliferone | 7.64 | 6.57 ± 0.23 | Kaempferol | 17.81 | 22.10 ± 0.45 |
| Ferulic acid | 8.6 | 4.77 ± 0.20 | Nordihydroguaiaretic acid | 22.72 | 5.51 ± 0.50 |
| Group | Glucose (mg/dL) | TG (mg/dL) | Body Weight Gain (%) |
|---|---|---|---|
| Normoglycemic control | 96.556 ± 4.231 b | 50.875 ± 3.861 bc | 20.425 ± 2.339 a |
| Diabetic control | 445.750 ± 20.385 a | 78.417 ± 3.355 a | -18.707 ± 3.484 c |
| Normoglycemic + EC | 96.30 ± 3.491 b | 40.375 ± 2.983 c | 17.668 ± 1.439 a |
| Diabetic + EC | 440.988 ± 18.493 a | 58.125 ± 3.102 b | 1.400 ± 3.484 b |
| Group | AST (U/L) | ALT (U/L) | ALP (U/L) | Liver TG |
|---|---|---|---|---|
| Normoglycemic control | 257.625 ± 25.230 c | 74.5 ± 6.039 c | 150.250 ± 19.118 c | 0.805 ± 0.068 b |
| Diabetic control | 462.571 ± 19.895 a | 223.571 ± 14.371 a | 2144.625 ± 91.351 a | 1.992 ± 0.022 a |
| Normoglycemic + EC | 201.125 ± 18.218 c | 55.75 ± 2.821 c | 136.5 ± 14.891 c | 0.860 ± 0.048 b |
| Diabetic + EC | 339.750 ± 17.045 b | 137.125 ± 7.988 b | 1137.143 ± 109.381 b | 0.951 ± 0.060 b |
Disclaimer/Publisher’s Note: The statements, opinions and data contained in all publications are solely those of the individual author(s) and contributor(s) and not of MDPI and/or the editor(s). MDPI and/or the editor(s) disclaim responsibility for any injury to people or property resulting from any ideas, methods, instructions or products referred to in the content. |
© 2023 by the authors. Licensee MDPI, Basel, Switzerland. This article is an open access article distributed under the terms and conditions of the Creative Commons Attribution (CC BY) license (https://creativecommons.org/licenses/by/4.0/).
Share and Cite
Trejo-Hurtado, C.M.; Landa-Moreno, C.I.; la Cruz, J.L.-d.; Peña-Montes, D.J.; Montoya-Pérez, R.; Salgado-Garciglia, R.; Manzo-Avalos, S.; Cortés-Rojo, C.; Monribot-Villanueva, J.L.; Guerrero-Analco, J.A.; et al. An Ethyl Acetate Extract of Eryngium carlinae Inflorescences Attenuates Oxidative Stress and Inflammation in the Liver of Streptozotocin-Induced Diabetic Rats. Antioxidants 2023, 12, 1235. https://doi.org/10.3390/antiox12061235
Trejo-Hurtado CM, Landa-Moreno CI, la Cruz JL-d, Peña-Montes DJ, Montoya-Pérez R, Salgado-Garciglia R, Manzo-Avalos S, Cortés-Rojo C, Monribot-Villanueva JL, Guerrero-Analco JA, et al. An Ethyl Acetate Extract of Eryngium carlinae Inflorescences Attenuates Oxidative Stress and Inflammation in the Liver of Streptozotocin-Induced Diabetic Rats. Antioxidants. 2023; 12(6):1235. https://doi.org/10.3390/antiox12061235
Chicago/Turabian StyleTrejo-Hurtado, Cristian M., Cinthia I. Landa-Moreno, Jenaro Lemus-de la Cruz, Donovan J. Peña-Montes, Rocío Montoya-Pérez, Rafael Salgado-Garciglia, Salvador Manzo-Avalos, Christian Cortés-Rojo, Juan Luis Monribot-Villanueva, José Antonio Guerrero-Analco, and et al. 2023. "An Ethyl Acetate Extract of Eryngium carlinae Inflorescences Attenuates Oxidative Stress and Inflammation in the Liver of Streptozotocin-Induced Diabetic Rats" Antioxidants 12, no. 6: 1235. https://doi.org/10.3390/antiox12061235