
Gluten-Free Bread Enriched with Artichoke Leaf Extract In Vitro Exerted Antioxidant and Anti-Inflammatory Properties

 , , ,
, , ,  , and
, and 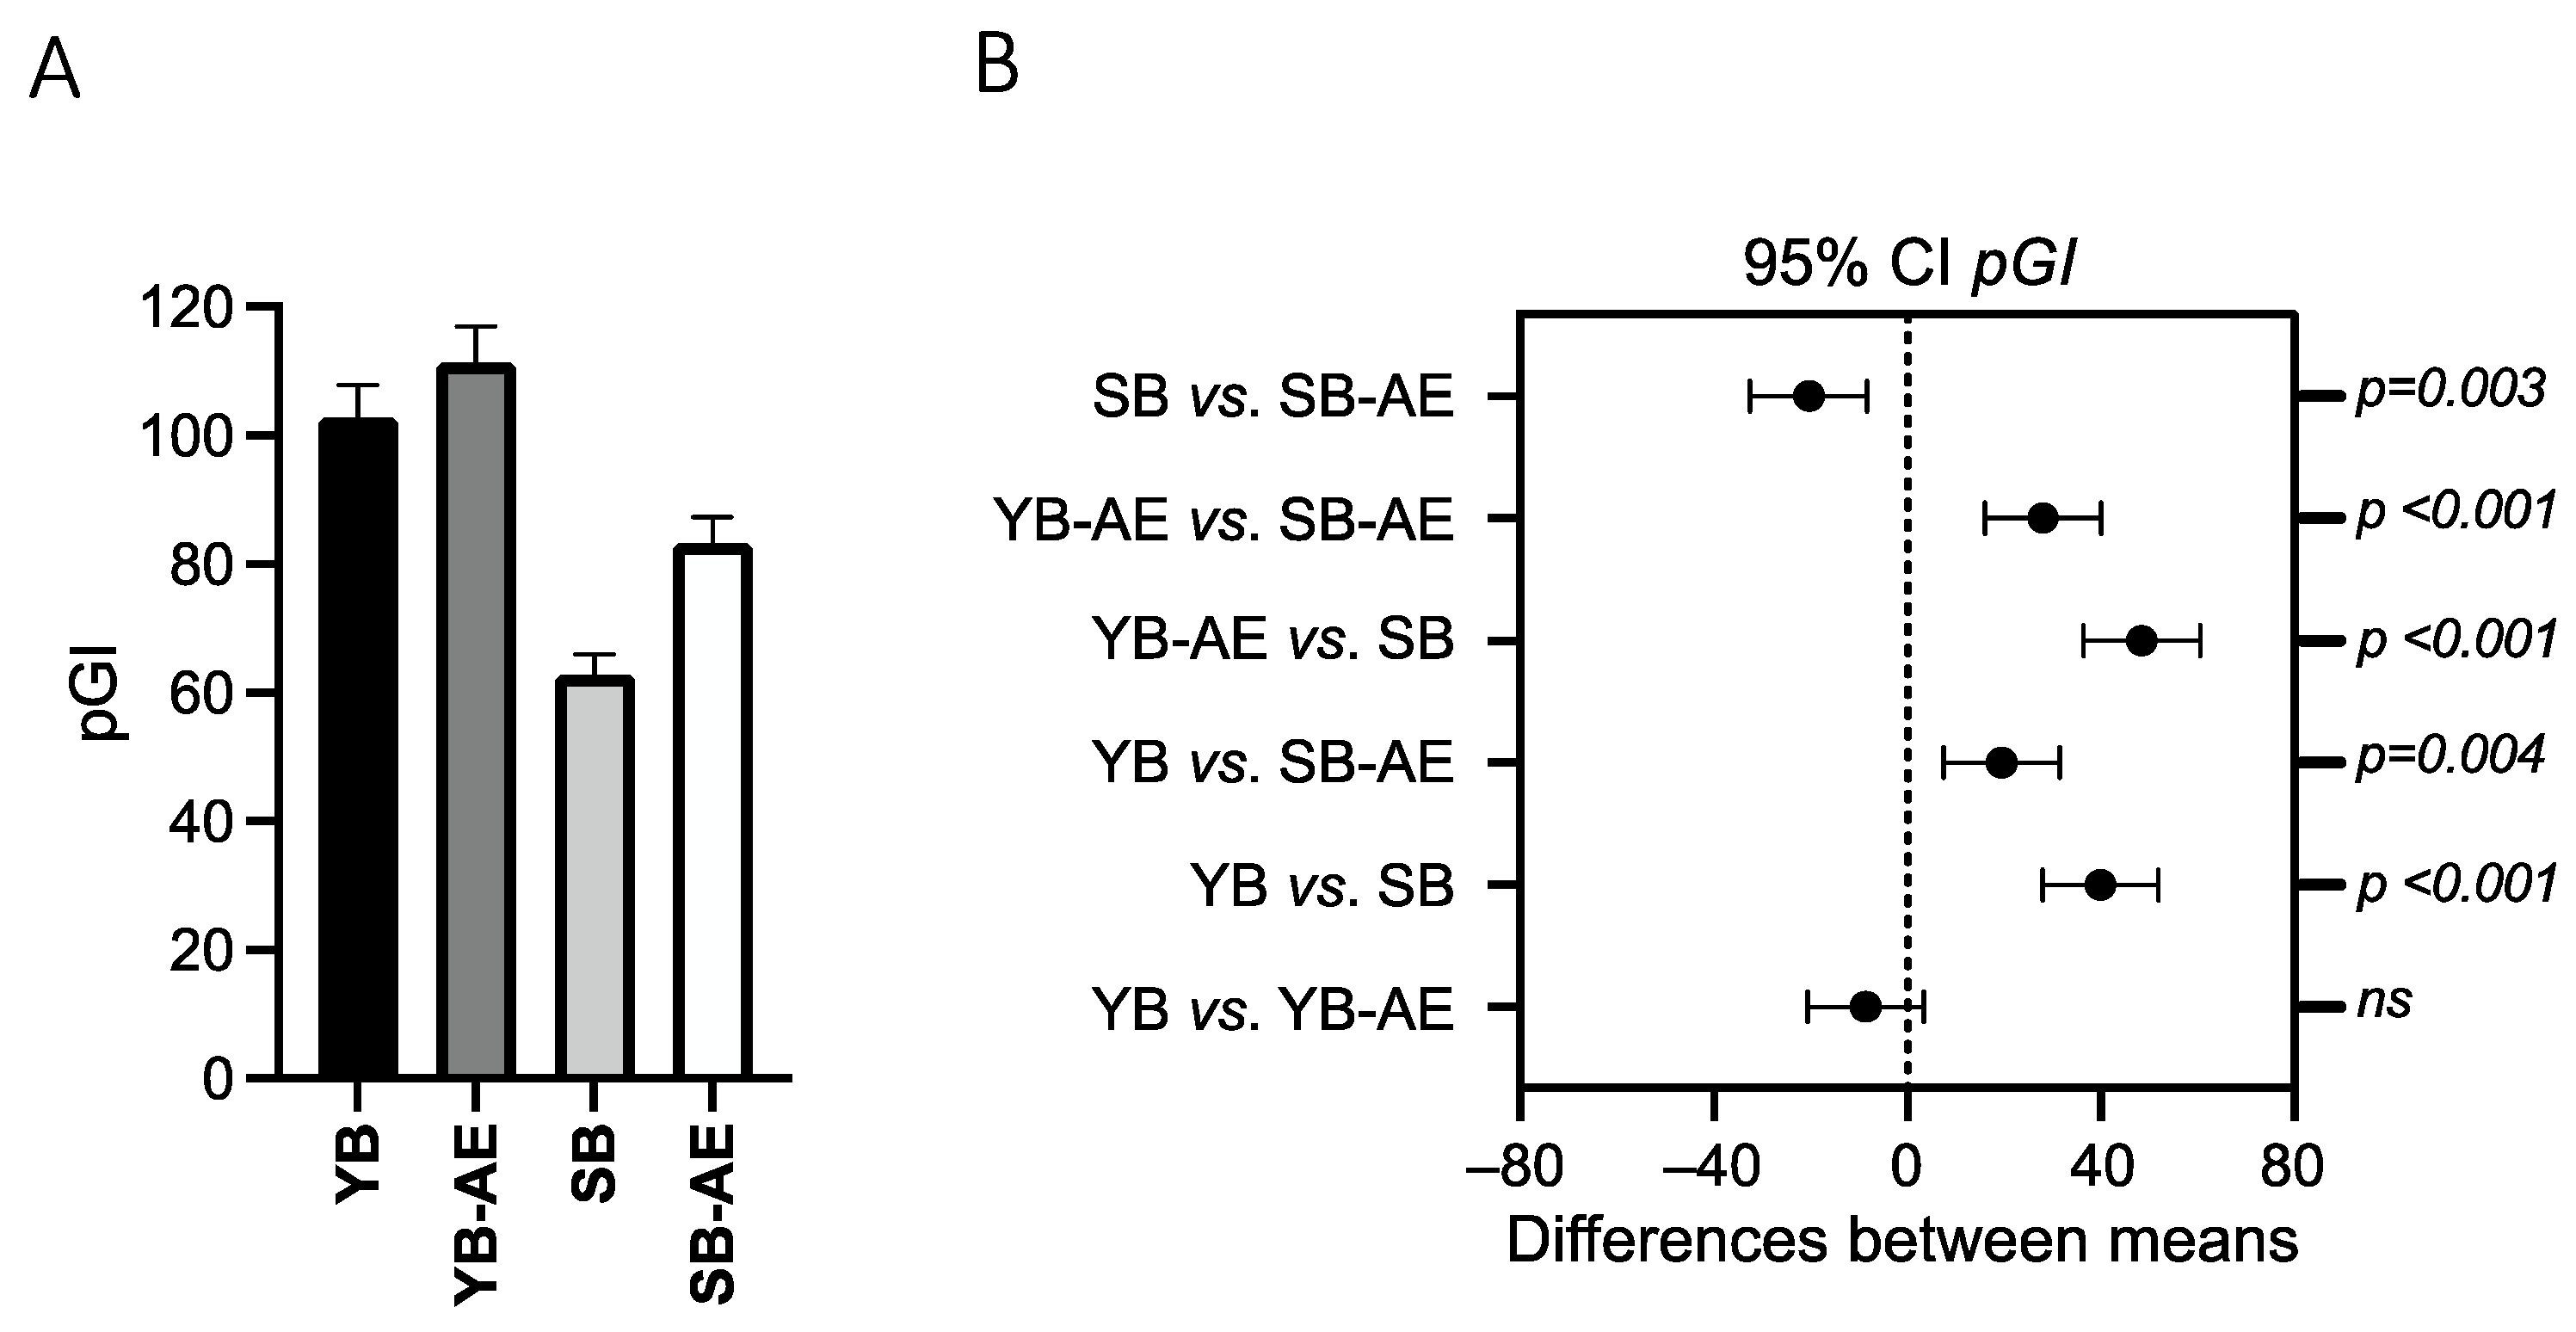
Abstract
:1. Introduction
2. Materials and Methods
2.1. Sourdough Preparation and Selection
2.2. Artichoke Leaf Extract
2.3. Bread Preparation
2.4. Bread Characterization
2.4.1. Predicted Glycemic Index (pGI)
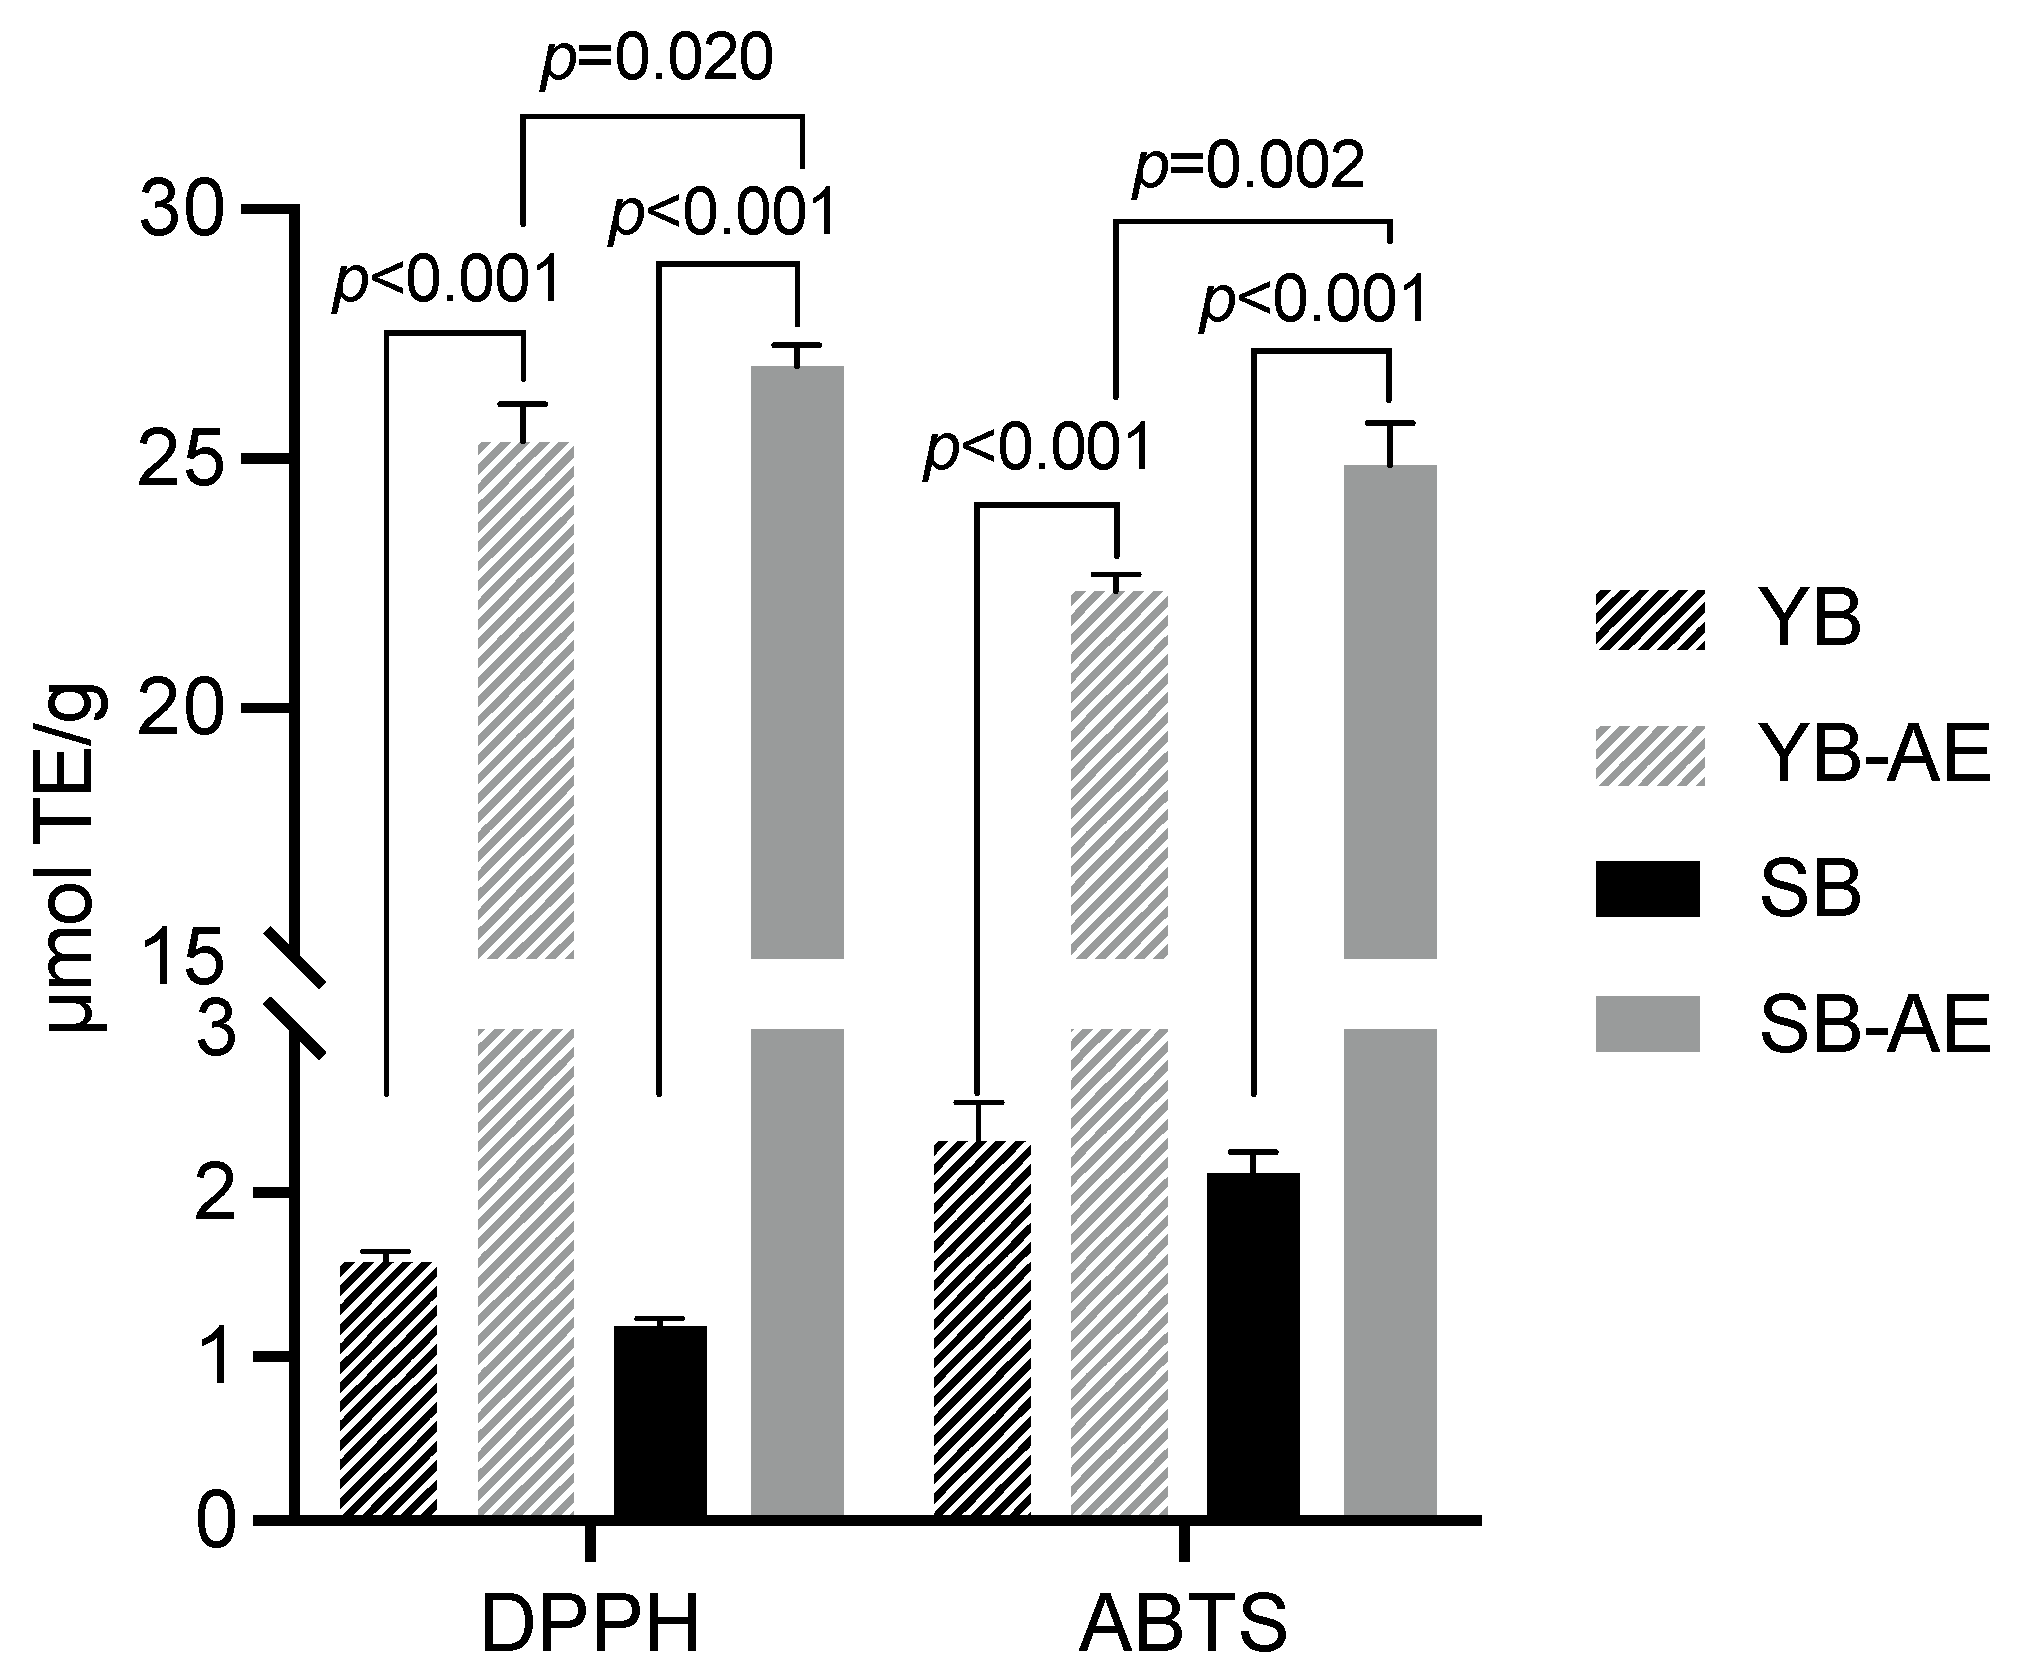
2.4.2. Antioxidant Activity
2.5. In Vitro Bread Digestion and Simulated Colonic Fermentation
2.6. Microbiota and Volatilome Profiling of Fermented Fecal Batches
2.6.1. Enumeration of Microbes from Fecal Batches
2.6.2. Fecal Volatile Organic Compound Profiling of Fecal Batches
2.7. In Vitro Assays of Digested Bread Samples on Cell Cultures
2.7.1. Cell Culture Conditions
2.7.2. MTT Assay
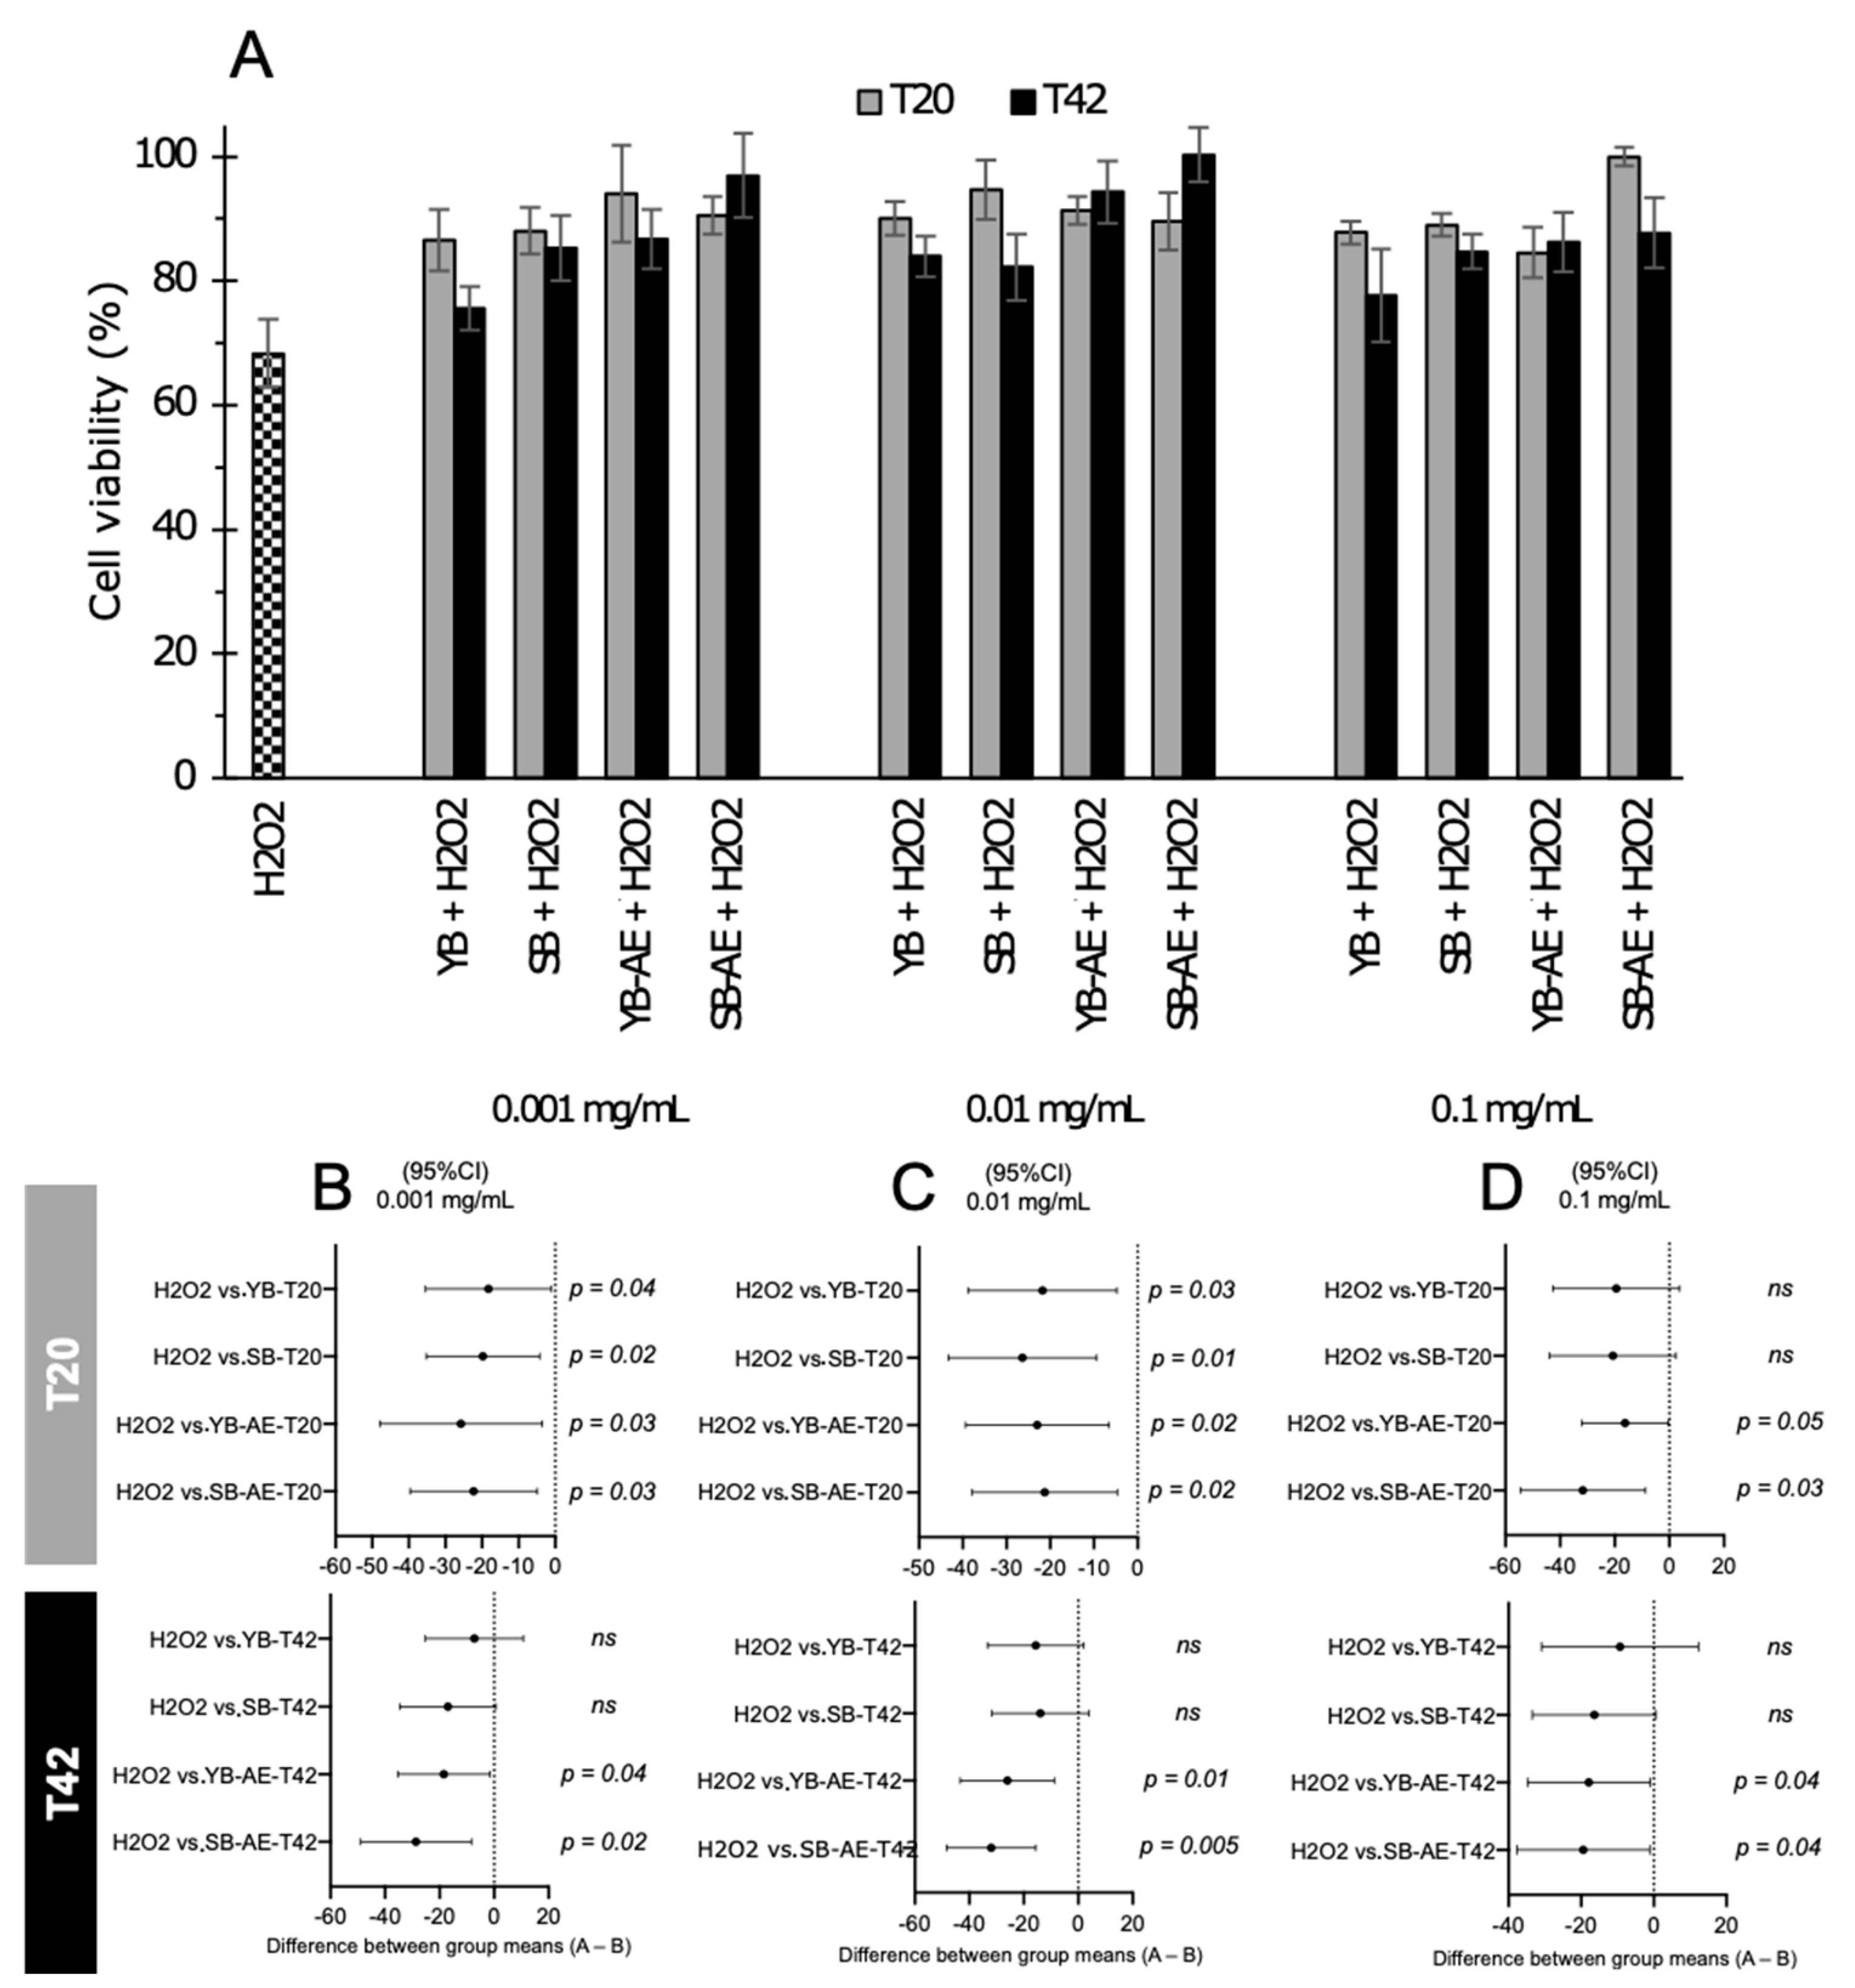
2.7.3. Protection from Induced Oxidative Stress
2.7.4. Cytokines Assay
2.8. Statistics
3. Results
3.1. Sourdough Characterization
3.2. Bread Characterization
3.2.1. pGI
3.2.2. Antioxidant Activity
3.3. In Vitro Effects of Digested Bread
3.3.1. Culturable Microbiota of Fecal Batches
3.3.2. Fecal Volatile Organic Compounds in Fecal Batches
3.4. Ex vivo Effects of Digested Bread Samples after Simulated Colonic Fermentation
3.4.1. Cytotoxicity
3.4.2. Anti-Inflammatory Effects
4. Discussion
5. Conclusions
Supplementary Materials
Author Contributions
Funding
Institutional Review Board Statement
Informed Consent Statement
Data Availability Statement
Acknowledgments
Conflicts of Interest
References
- Wilderjans, E.; Pareyt, B.; Goesaert, H.; Brijs, K.; Delcour, J.A. The role of gluten in a pound cake system: A model approach based on gluten-starch blends. Food Chem. 2008, 110, 909–915. [Google Scholar] [CrossRef] [PubMed]
- Singh, P.; Arora, A.; Strand, T.A.; Leffler, D.A.; Catassi, C.; Green, P.H.; Kelly, C.P.; Ahuja, V.; Makharia, G.K. Global prevalence of celiac disease: Systematic review and meta-analysis. Clin. Gastroenterol. Hepatol. Off. Clin. Pract. J. Am. Gastroenterol. Assoc. 2018, 16, 823–836. [Google Scholar] [CrossRef] [PubMed] [Green Version]
- Sapone, A.; Bai, J.C.; Ciacci, C.; Dolinsek, J.; Green, P.H.R.; Hadjivassiliou, M.; Kaukinen, K.; Rostami, K.; Sanders, D.S.; Schumann, M.; et al. Spectrum of gluten-related disorders: Consensus on new nomenclature and classification. BMC Med. 2012, 10, 13. [Google Scholar] [CrossRef] [Green Version]
- Terazono, E. Healthy Appetites Drive Jump in Sales of Gluten-Free Foods. Available online: https://www.ft.com/content/4ec0f2f2-2c0a-11e7-9ec8-168383da43b7 (accessed on 10 March 2023).
- Revanappa, S.B.; Nandini, C.D.; Salimath, P.V. Structural characterisation of pentosans from hemicellulose b of wheat varieties with varying chapati-making quality. Food Chem. 2010, 119, 27–33. [Google Scholar] [CrossRef]
- Tako, E.; Glahn, R.P.; Knez, M.; Stangoulis, J.C. The effect of wheat prebiotics on the gut bacterial population and iron status of iron deficient broiler chickens. Nutr. J. 2014, 13, 58. [Google Scholar] [CrossRef] [PubMed]
- Caio, G.; Lungaro, L.; Segata, N.; Guarino, M.; Zoli, G.; Volta, U.; De Giorgio, R. Effect of gluten-free diet on gut microbiota composition in patients with celiac disease and non-celiac gluten/wheat sensitivity. Nutrients 2020, 12, 1832. [Google Scholar] [CrossRef]
- De Palma, G.; Nadal, I.; Collado, M.C.; Sanz, Y. Effects of a gluten-free diet on gut microbiota and immune function in healthy adult human subjects. Br. J. Nutr. 2009, 102, 1154–1160. [Google Scholar] [CrossRef] [Green Version]
- Vacca, M.; Porrelli, A.; Calabrese, F.M.; Lippolis, T.; Iacobellis, I.; Celano, G.; Pinto, D.; Russo, F.; Giannelli, G.; De Angelis, M. How metabolomics provides novel insights on celiac disease and gluten-free diet: A narrative review. Front. Microbiol. 2022, 13, 859467. [Google Scholar] [CrossRef]
- Uspenskaya, I.D.; Erzutova, M.V.; Korkotashvili, L.V.; Kolesov, S.A.; Shirokova, N.Y. The significance of increased levels of end nitric oxide metabolites in blood serum of children with celiac disease. Bratisl. Lek. Listy 2014, 115, 712–717. [Google Scholar] [CrossRef] [Green Version]
- Högberg, L.; Webb, C.; Fälth-Magnusson, K.; Forslund, T.; Magnusson, K.-E.; Danielsson, L.; Ivarsson, A.; Sandström, O.; Sundqvist, T. Children with screening-detected coeliac disease show increased levels of nitric oxide products in urine. Acta Paediatr. 2011, 100, 1023–1027. [Google Scholar] [CrossRef]
- Murray, I.A.; Daniels, I.; Coupland, K.; Smith, J.A.; Long, R.G. Increased activity and expression of INOS in human duodenal enterocytes from patients with celiac disease. Am. J. Physiol. Gastrointest. Liver Physiol. 2002, 283, G319–G326. [Google Scholar] [CrossRef] [PubMed] [Green Version]
- Stojiljković, V.; Todorović, A.; Pejić, S.; Kasapović, J.; Saicić, Z.S.; Radlović, N.; Pajović, S.B. Antioxidant status and lipid peroxidation in small intestinal mucosa of children with celiac disease. Clin. Biochem. 2009, 42, 1431–1437. [Google Scholar] [CrossRef] [PubMed]
- Rowicka, G.; Czaja-Bulsa, G.; Chełchowska, M.; Riahi, A.; Strucińska, M.; Weker, H.; Ambroszkiewicz, J. Oxidative and antioxidative status of children with celiac disease treated with a gluten free-diet. Oxidative Med. Cell. Longev. 2018, 2018, 1324820. [Google Scholar] [CrossRef] [PubMed] [Green Version]
- Diaz-Castro, J.; Muriel-Neyra, C.; Martin-Masot, R.; Moreno-Fernandez, J.; Maldonado, J.; Nestares, T. Oxidative stress, DNA stability and evoked inflammatory signaling in young celiac patients consuming a gluten-free diet. Eur. J. Nutr. 2020, 59, 1577–1584. [Google Scholar] [CrossRef]
- Szaflarska-Poplawska, A.; Siomek, A.; Czerwionka-Szaflarska, M.; Gackowski, D.; Rózalski, R.; Guz, J.; Szpila, A.; Zarakowska, E.; Olinski, R. Oxidatively damaged DNA/oxidative stress in children with celiac disease. Cancer Epidemiol. Biomark. 2010, 19, 1960–1965. [Google Scholar] [CrossRef] [PubMed] [Green Version]
- Zeb, A. Concept, mechanism, and applications of phenolic antioxidants in foods. J. Food Biochem. 2020, 44, e13394. [Google Scholar] [CrossRef]
- Myrtsi, E.D.; Koulocheri, S.D.; Iliopoulos, V.; Haroutounian, S.A. High-Throughput quantification of 32 bioactive antioxidant phenolic compounds in grapes, wines and vinification byproducts by LC-MS/MS. Antioxidants 2021, 10, 1174. [Google Scholar] [CrossRef]
- Tang, J.; Dunshea, F.R.; Suleria, H.A.R. LC-ESI-QTOF/MS Characterization of phenolic compounds from medicinal plants (hops and juniper berries) and their antioxidant activity. Foods 2019, 9, 7. [Google Scholar] [CrossRef] [Green Version]
- Sun, Y.; Tao, W.; Huang, H.; Ye, X.; Sun, P. Flavonoids, phenolic acids, carotenoids and antioxidant activity of fresh eating citrus fruits, using the coupled in vitro digestion and human intestinal HepG2 cells model. Food Chem. 2019, 279, 321–327. [Google Scholar] [CrossRef]
- Vacca, M.; Celano, G.; Lenucci, M.S.; Fontana, S.; Forgia, F.M.L.; Minervini, F.; Scarano, A.; Santino, A.; Dalfino, G.; Gesualdo, L.; et al. In vitro selection of probiotics, prebiotics, and antioxidants to develop an innovative synbiotic (NatuREN G) and testing its effect in reducing uremic toxins in fecal batches from CKD patients. Microorganisms 2021, 9, 1316. [Google Scholar] [CrossRef]
- Cardoso-Ugarte, G.A.; Sosa-Morales, M.E. Essential oils from herbs and spices as natural antioxidants: Diversity of promising food applications in the past decade. Food Rev. Int. 2022, 38, 403–433. [Google Scholar] [CrossRef]
- Negro, D.; Montesano, V.; Grieco, S.; Crupi, P.; Sarli, G.; De Lisi, A.; Sonnante, G. Polyphenol compounds in artichoke plant tissues and varieties. J. Food Sci. 2012, 77, C244–C252. [Google Scholar] [CrossRef] [PubMed]
- Zuorro, A.; Maffei, G.; Lavecchia, R. Effect of solvent type and extraction conditions on the recovery of phenolic compounds from artichoke waste. Chem. Eng. Trans. 2014, 39, 463–468. [Google Scholar] [CrossRef]
- Jiménez-Moreno, N.; Cimminelli, M.J.; Volpe, F.; Ansó, R.; Esparza, I.; Mármol, I.; Rodríguez-Yoldi, M.J.; Ancín-Azpilicueta, C. Phenolic composition of artichoke waste and its antioxidant capacity on differentiated Caco-2 cells. Nutrients 2019, 11, 1723. [Google Scholar] [CrossRef] [Green Version]
- Garcia-Castello, E.M.; Mayor, L.; Calvo-Ramirez, A.; Ruiz-Melero, R.; Rodriguez-Lopez, A.D. Response surface optimization of inulin and polyphenol extraction from artichoke (Cynara scolymus (L.)) solid wastes. Appl. Sci. 2022, 12, 7957. [Google Scholar] [CrossRef]
- Turker, I.; Isleroglu, H. Optimization of extraction conditions of bioactive compounds by ultrasonic-assisted extraction from artichoke wastes. Acta Chim. Slov. 2021, 68, 658–666. [Google Scholar] [CrossRef]
- Melini, V.; Melini, F. Gluten-free diet: Gaps and needs for a healthier diet. Nutrients 2019, 11, 170. [Google Scholar] [CrossRef] [Green Version]
- Romão, B.; Falcomer, A.L.; Palos, G.; Cavalcante, S.; Botelho, R.B.A.; Nakano, E.Y.; Raposo, A.; Shakeel, F.; Alshehri, S.; Mahdi, W.A.; et al. Glycemic index of gluten-free bread and their main ingredients: A systematic review and meta-analysis. Foods 2021, 10, 506. [Google Scholar] [CrossRef]
- Bernini, P.; Bertini, I.; Calabrò, A.; la Marca, G.; Lami, G.; Luchinat, C.; Renzi, D.; Tenori, L. Are patients with potential celiac disease really potential? The answer of metabonomics. J. Proteome Res. 2011, 10, 714–721. [Google Scholar] [CrossRef] [Green Version]
- Bertini, I.; Calabrò, A.; De Carli, V.; Luchinat, C.; Nepi, S.; Porfirio, B.; Renzi, D.; Saccenti, E.; Tenori, L. The metabonomic signature of celiac disease. J. Proteome Res. 2009, 8, 170–177. [Google Scholar] [CrossRef]
- Upadhyay, D.; Singh, A.; Das, P.; Mehtab, J.; Dattagupta, S.; Ahuja, V.; Makharia, G.K.; Jagannathan, N.R.; Sharma, U. Abnormalities in metabolic pathways in celiac disease investigated by the metabolic profiling of small intestinal mucosa, blood plasma and urine by NMR spectroscopy. NMR Biomed. 2020, 33, e4305. [Google Scholar] [CrossRef] [PubMed]
- De Vuyst, L.; Comasio, A.; Kerrebroeck, S.V. Sourdough production: Fermentation strategies, microbial ecology, and use of non-flour ingredients. Crit. Rev. Food Sci. Nutr. 2021, 1–33. [Google Scholar] [CrossRef] [PubMed]
- De Angelis, M.; Damiano, N.; Rizzello, C.G.; Cassone, A.; Di Cagno, R.; Gobbetti, M. Sourdough fermentation as a tool for the manufacture of low-glycemic index white wheat bread enriched in dietary fibre. Eur. Food Res. Technol. 2009, 229, 593–601. [Google Scholar] [CrossRef]
- Wolter, A.; Hager, A.-S.; Zannini, E.; Arendt, E.K. Influence of sourdough on in vitro starch digestibility and predicted glycemic indices of gluten-free breads. Food Funct. 2014, 5, 564–572. [Google Scholar] [CrossRef] [PubMed]
- Demirkesen-Bicak, H.; Arici, M.; Yaman, M.; Karasu, S.; Sagdic, O. Effect of different fermentation condition on estimated glycemic index, in vitro starch digestibility, and textural and sensory properties of sourdough bread. Foods 2021, 10, 514. [Google Scholar] [CrossRef]
- Rizzello, C.G.; Calasso, M.; Campanella, D.; De Angelis, M.; Gobbetti, M. Use of sourdough fermentation and mixture of wheat, chickpea, lentil and bean flours for enhancing the nutritional, texture and sensory characteristics of white bread. Int. J. Food Microbiol. 2014, 180, 78–87. [Google Scholar] [CrossRef]
- Perri, G.; Coda, R.; Rizzello, C.G.; Celano, G.; Ampollini, M.; Gobbetti, M.; De Angelis, M.; Calasso, M. Sourdough fermentation of whole and sprouted lentil flours: In situ formation of dextran and effects on the nutritional, texture and sensory characteristics of white bread. Food Chem. 2021, 355, 129638. [Google Scholar] [CrossRef]
- Liljeberg, H.; Åkerberg, A.; Björck, I. Resistant starch formation in bread as influenced by choice of ingredients or baking conditions. Food Chem. 1996, 56, 389–394. [Google Scholar] [CrossRef]
- Goñi, I.; Garcia-Alonso, A.; Saura-Calixto, F. A starch hydrolysis procedure to estimate glycemic index. Nutr. Res. 1997, 17, 427–437. [Google Scholar] [CrossRef]
- Martínez-Las Heras, R.; Pinazo, A.; Heredia, A.; Andrés, A. Evaluation studies of persimmon plant (Diospyros kaki) for physiological benefits and bioaccessibility of antioxidants by in vitro simulated gastrointestinal digestion. Food Chem. 2017, 214, 478–485. [Google Scholar] [CrossRef]
- De Angelis, M.; Siragusa, S.; Vacca, M.; Di Cagno, R.; Cristofori, F.; Schwarm, M.; Pelzer, S.; Flügel, M.; Speckmann, B.; Francavilla, R.; et al. Selection of gut-resistant bacteria and construction of microbial consortia for improving gluten digestion under simulated gastrointestinal conditions. Nutrients 2021, 13, 992. [Google Scholar] [CrossRef] [PubMed]
- Pérez-Burillo, S.; Molino, S.; Navajas-Porras, B.; Valverde-Moya, Á.J.; Hinojosa-Nogueira, D.; López-Maldonado, A.; Pastoriza, S.; Rufián-Henares, J.Á. An in vitro batch fermentation protocol for studying the contribution of food to gut microbiota composition and functionality. Nat. Protoc. 2021, 16, 3186–3209. [Google Scholar] [CrossRef] [PubMed]
- Portincasa, P.; Celano, G.; Serale, N.; Vitellio, P.; Calabrese, F.M.; Chira, A.; David, L.; Dumitrascu, D.L.; De Angelis, M. Clinical and metabolomic effects of Lactiplantibacillus plantarum and Pediococcus acidilactici in fructose intolerant patients. Nutrients 2022, 14, 2488. [Google Scholar] [CrossRef] [PubMed]
- Mosmann, T. Rapid colorimetric assay for cellular growth and survival: Application to proliferation and cytotoxicity assays. J. Immunol. Methods 1983, 65, 55–63. [Google Scholar] [CrossRef]
- Coda, R.; Rizzello, C.G.; Pinto, D.; Gobbetti, M. Selected lactic acid bacteria synthesize antioxidant peptides during sourdough fermentation of cereal flours. Appl. Environ. Microbiol. 2012, 78, 1087–1096. [Google Scholar] [CrossRef] [Green Version]
- Martirosyan, D.M.; Singh, J. A new definition of functional food by ffc: What makes a new definition unique? Funct. Foods Health Dis. 2015, 5, 209–223. [Google Scholar] [CrossRef]
- Lavecchia, R.; Maffei, G.; Paccassoni, F.; Piga, L.; Zuorro, A. Artichoke waste as a source of phenolic antioxidants and bioenergy. Waste Biomass Valorization 2019, 10, 2975–2984. [Google Scholar] [CrossRef]
- Zhu, X.; Zhang, H.; Lo, R. Phenolic compounds from the leaf extract of artichoke (Cynara scolymus L.) and their antimicrobial activities. J. Agric. Food. Chem. 2004, 52, 7272–7278. [Google Scholar] [CrossRef]
- Pasqualone, A.; Punzi, R.; Trani, A.; Summo, C.; Paradiso, V.M.; Caponio, F.; Gambacorta, G. Enrichment of fresh pasta with antioxidant extracts obtained from artichoke canning by-products by ultrasound-assisted technology and quality characterisation of the end product. Int. J. Food Sci. Technol. 2017, 52, 2078–2087. [Google Scholar] [CrossRef]
- Amoriello, T.; Mellara, F.; Ruggeri, S.; Ciorba, R.; Ceccarelli, D.; Ciccoritti, R. Artichoke by-products valorization for phenols-enriched fresh egg pasta: A sustainable food design project. Sustainability 2022, 14, 14778. [Google Scholar] [CrossRef]
- Iftikhar, M.; Iftikhar, A.; Zhang, H.; Gong, L.; Wang, J. Transport, metabolism and remedial potential of functional food extracts (FFEs) in Caco-2 cells monolayer: A review. Food Res. Int. 2020, 136, 109240. [Google Scholar] [CrossRef] [PubMed]
- Wijeratne, S.S.; Cuppett, S.L.; Schlegel, V. Hydrogen peroxide induced oxidative stress damage and antioxidant enzyme response in Caco-2 human colon cells. J. Agric. Food Chem. 2005, 53, 8768–8774. [Google Scholar] [CrossRef] [PubMed]
- Rizzello, C.G.; De Angelis, M.; Coda, R.; Gobbetti, M. Use of selected sourdough lactic acid bacteria to hydrolyze wheat and rye proteins responsible for cereal allergy. Eur. Food Res. Technol. 2006, 223, 405–411. [Google Scholar] [CrossRef]
- Montemurro, M.; Pontonio, E.; Rizzello, C.G. Design of a “clean-label” gluten-free bread to meet consumers demand. Foods 2021, 10, 462. [Google Scholar] [CrossRef]
- Lu, H.; Tian, Z.; Cui, Y.; Liu, Z.; Ma, X. Chlorogenic acid: A comprehensive review of the dietary sources, processing effects, bioavailability, beneficial properties, mechanisms of action, and future directions. Compr. Rev. Food Sci. Food Saf. 2020, 19, 3130–3158. [Google Scholar] [CrossRef]
- Bustos, A.Y.; Gerez, C.L.; Mohtar Mohtar, L.G.; Paz Zanini, V.I.; Nazareno, M.A.; Taranto, M.P.; Iturriaga, L.B. Lactic acid fermentation improved textural behaviour, phenolic compounds and antioxidant activity of Chia (Salvia hispanica L.) dough. Food Technol. Biotechnol. 2017, 55, 381–389. [Google Scholar] [CrossRef]
- Chen, X.; Yuan, M.; Wang, Y.; Zhou, Y.; Sun, X. Influence of fermentation with different lactic acid bacteria and in vitro digestion on the change of phenolic compounds in fermented kiwifruit pulps. Int. J. Food Sci. Technol. 2022, 57, 2670–2679. [Google Scholar] [CrossRef]
- Gomes, F.; Dias, M.I.; Lima, Â.; Barros, L.; Rodrigues, M.E.; Ferreira, I.C.F.R.; Henriques, M. Satureja montana L. and Origanum majorana L. decoctions: Antimicrobial activity, mode of action and phenolic characterization. Antibiotiotics 2020, 9, 294. [Google Scholar] [CrossRef]
- Takó, M.; Kerekes, E.B.; Zambrano, C.; Kotogán, A.; Papp, T.; Krisch, J.; Vágvölgyi, C. Plant phenolics and phenolic-enriched extracts as antimicrobial agents against food-contaminating microorganisms. Antioxidants 2020, 9, 165. [Google Scholar] [CrossRef] [Green Version]
- Fritsch, C.; Heinrich, V.; Vogel, R.F.; Toelstede, S. Phenolic acid degradation potential and growth behavior of lactic acid bacteria in sunflower substrates. Food Microbiol. 2016, 57, 178–186. [Google Scholar] [CrossRef]
- Curiel, J.A.; Rodríguez, H.; Landete, J.M.; de las Rivas, B.; Muñoz, R. Ability of Lactobacillus brevis strains to degrade food phenolic acids. Food Chem. 2010, 120, 225–229. [Google Scholar] [CrossRef] [Green Version]
- Liang, N.; Kitts, D.D. Role of chlorogenic acids in controlling oxidative and inflammatory stress conditions. Nutrients 2016, 8, 16. [Google Scholar] [CrossRef] [PubMed] [Green Version]
- Hwang, S.J.; Kim, Y.-W.; Park, Y.; Lee, H.-J.; Kim, K.-W. Anti-inflammatory effects of chlorogenic acid in lipopolysaccharide-stimulated RAW 264.7 cells. Inflamm. Res. 2014, 63, 81–90. [Google Scholar] [CrossRef] [PubMed]
- Girsang, E.; Ginting, C.N.; Lister, I.N.E.; Gunawan, K.Y.; Widowati, W. Anti-inflammatory and antiaging properties of chlorogenic acid on UV-induced fibroblast cell. PeerJ 2021, 9, e11419. [Google Scholar] [CrossRef]
- Pandino, G.; Lombardo, S.; Mauro, R.P.; Mauromicale, G. Variation in polyphenol profile and head morphology among clones of globe artichoke selected from a landrace. Sci. Hortic. 2012, 138, 259–265. [Google Scholar] [CrossRef]
- Petropoulos, S.A.; Pereira, C.; Ntatsi, G.; Danalatos, N.; Barros, L.; Ferreira, I.C.F.R. Nutritional value and chemical composition of greek artichoke genotypes. Food Chem. 2018, 267, 296–302. [Google Scholar] [CrossRef]
- Liu, S.; Zhao, W.; Liu, X.; Cheng, L. Metagenomic analysis of the gut microbiome in atherosclerosis patients identify cross-cohort microbial signatures and potential therapeutic target. FASEB J. 2020, 34, 14166–14181. [Google Scholar] [CrossRef]
- Saito, Y.; Sato, T.; Nomoto, K.; Tsuji, H. Identification of phenol- and p-cresol-producing intestinal bacteria by using media supplemented with tyrosine and its metabolites. FEMS Microbiol. Ecol. 2018, 94, fiy125. [Google Scholar] [CrossRef]
- Gao, J.; Xu, K.; Liu, H.; Liu, G.; Bai, M.; Peng, C.; Li, T.; Yin, Y. Impact of the gut microbiota on intestinal immunity mediated by tryptophan metabolism. Front. Cell. Infect. Microbiol. 2018, 8, 13. [Google Scholar] [CrossRef] [Green Version]
- Agus, A.; Planchais, J.; Sokol, H. Gut microbiota regulation of tryptophan metabolism in health and disease. Cell Host Microbe 2018, 23, 716–724. [Google Scholar] [CrossRef] [Green Version]
- Lamas, B.; Natividad, J.M.; Sokol, H. Aryl hydrocarbon receptor and intestinal immunity. Mucosal Immunol. 2018, 11, 1024–1038. [Google Scholar] [CrossRef] [PubMed] [Green Version]
- Dong, F.; Perdew, G.H. The Aryl hydrocarbon receptor as a mediator of host-microbiota interplay. Gut Microbes 2020, 12, 1859812. [Google Scholar] [CrossRef] [PubMed]
- Lamas, B.; Hernandez-Galan, L.; Galipeau, H.J.; Constante, M.; Clarizio, A.; Jury, J.; Breyner, N.M.; Caminero, A.; Rueda, G.; Hayes, C.L.; et al. Aryl hydrocarbon receptor ligand production by the gut microbiota is decreased in celiac disease leading to intestinal inflammation. Sci. Transl. Med. 2020, 12, eaba0624. [Google Scholar] [CrossRef] [PubMed]
- Afnan; Saleem, A.; Akhtar, M.F.; Sharif, A.; Akhtar, B.; Siddique, R.; Ashraf, G.M.; Alghamdi, B.S.; Alharthy, S.A. Anticancer, cardio-protective and anti-inflammatory potential of natural-sources-derived phenolic acids. Molecules 2022, 27, 7286. [Google Scholar] [CrossRef]


Disclaimer/Publisher’s Note: The statements, opinions and data contained in all publications are solely those of the individual author(s) and contributor(s) and not of MDPI and/or the editor(s). MDPI and/or the editor(s) disclaim responsibility for any injury to people or property resulting from any ideas, methods, instructions or products referred to in the content. |
© 2023 by the authors. Licensee MDPI, Basel, Switzerland. This article is an open access article distributed under the terms and conditions of the Creative Commons Attribution (CC BY) license (https://creativecommons.org/licenses/by/4.0/).
Share and Cite
Vacca, M.; Pinto, D.; Annunziato, A.; Ressa, A.; Calasso, M.; Pontonio, E.; Celano, G.; De Angelis, M. Gluten-Free Bread Enriched with Artichoke Leaf Extract In Vitro Exerted Antioxidant and Anti-Inflammatory Properties. Antioxidants 2023, 12, 845. https://doi.org/10.3390/antiox12040845
Vacca M, Pinto D, Annunziato A, Ressa A, Calasso M, Pontonio E, Celano G, De Angelis M. Gluten-Free Bread Enriched with Artichoke Leaf Extract In Vitro Exerted Antioxidant and Anti-Inflammatory Properties. Antioxidants. 2023; 12(4):845. https://doi.org/10.3390/antiox12040845
Chicago/Turabian StyleVacca, Mirco, Daniela Pinto, Alessandro Annunziato, Arianna Ressa, Maria Calasso, Erica Pontonio, Giuseppe Celano, and Maria De Angelis. 2023. "Gluten-Free Bread Enriched with Artichoke Leaf Extract In Vitro Exerted Antioxidant and Anti-Inflammatory Properties" Antioxidants 12, no. 4: 845. https://doi.org/10.3390/antiox12040845