
Response of a Human Lens Epithelial Cell Line to Hyperglycemic and Oxidative Stress: The Role of Aldose Reductase
 , , , , and
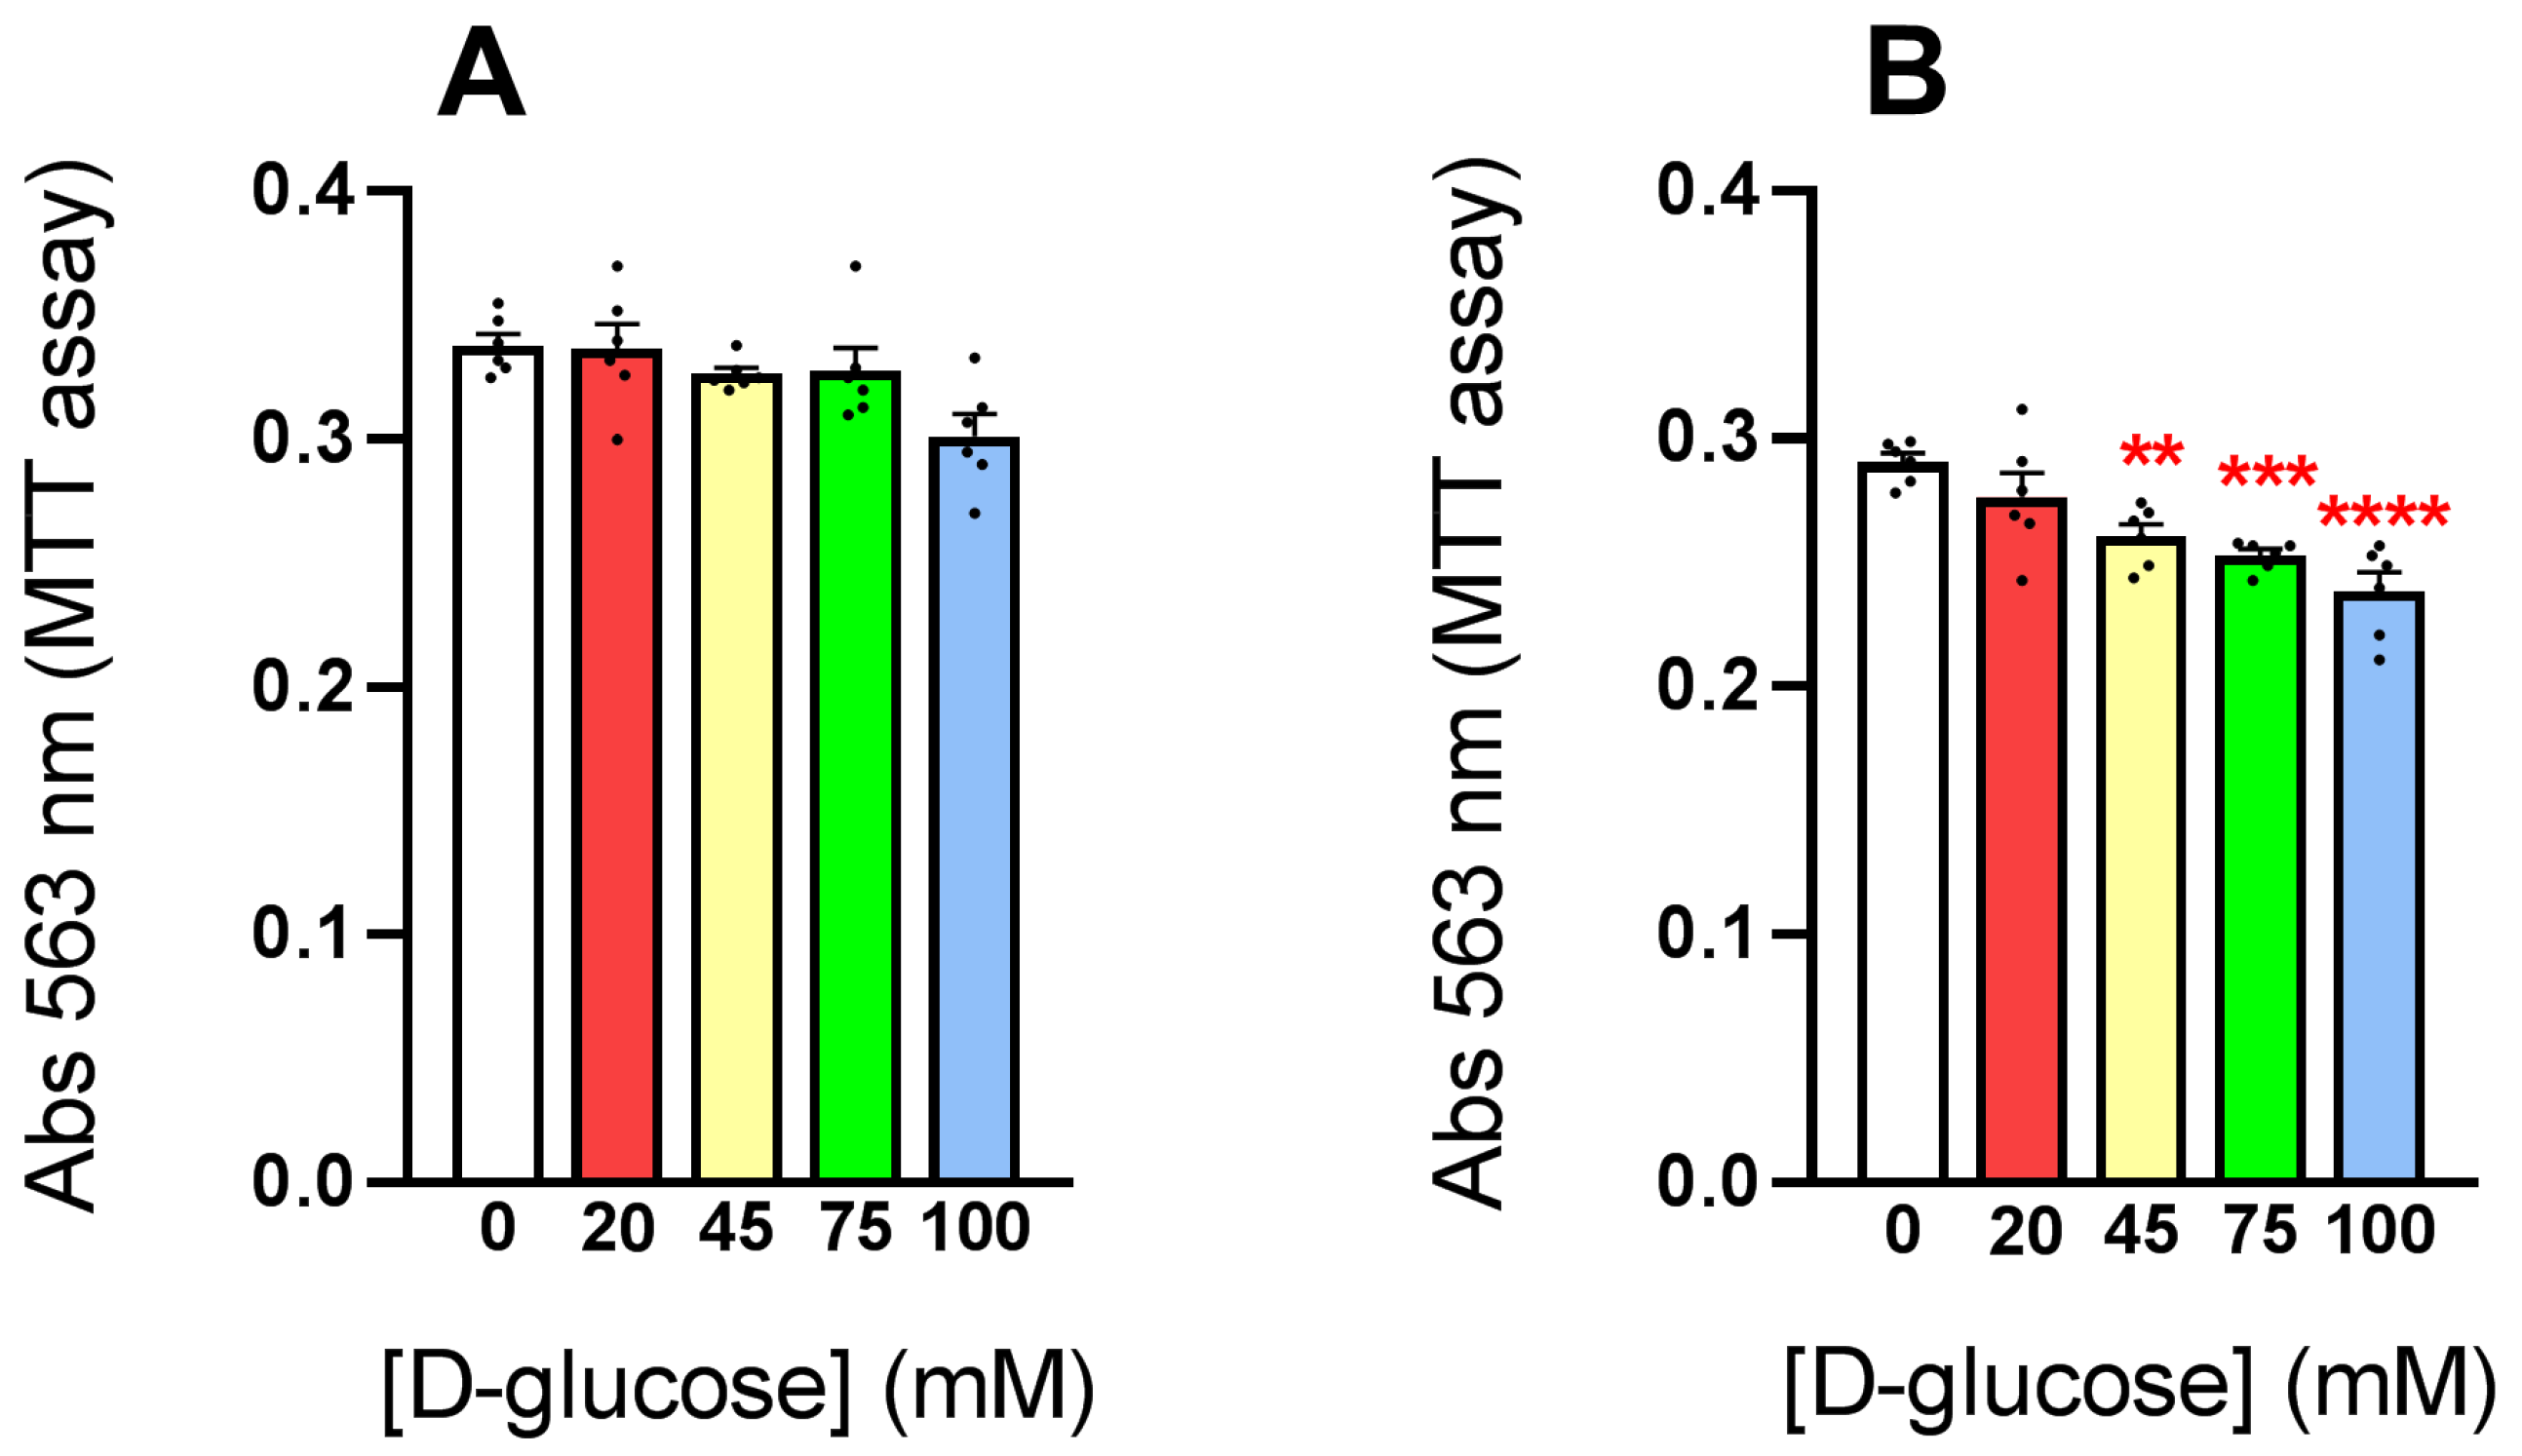
Abstract
:1. Introduction
2. Materials and Methods
2.1. Materials
2.2. Cell Cultures and Transfection
2.3. Measurement of Cell Vitality
2.4. Quantification of the Firefly Luciferase Expression
2.5. Sorbitol Dehydrogenase Assay and Purification
2.6. Sorbitol Determination
2.7. Western Blotting
2.8. Glutathione Determination
2.9. Other Methods
3. Results and Discussion
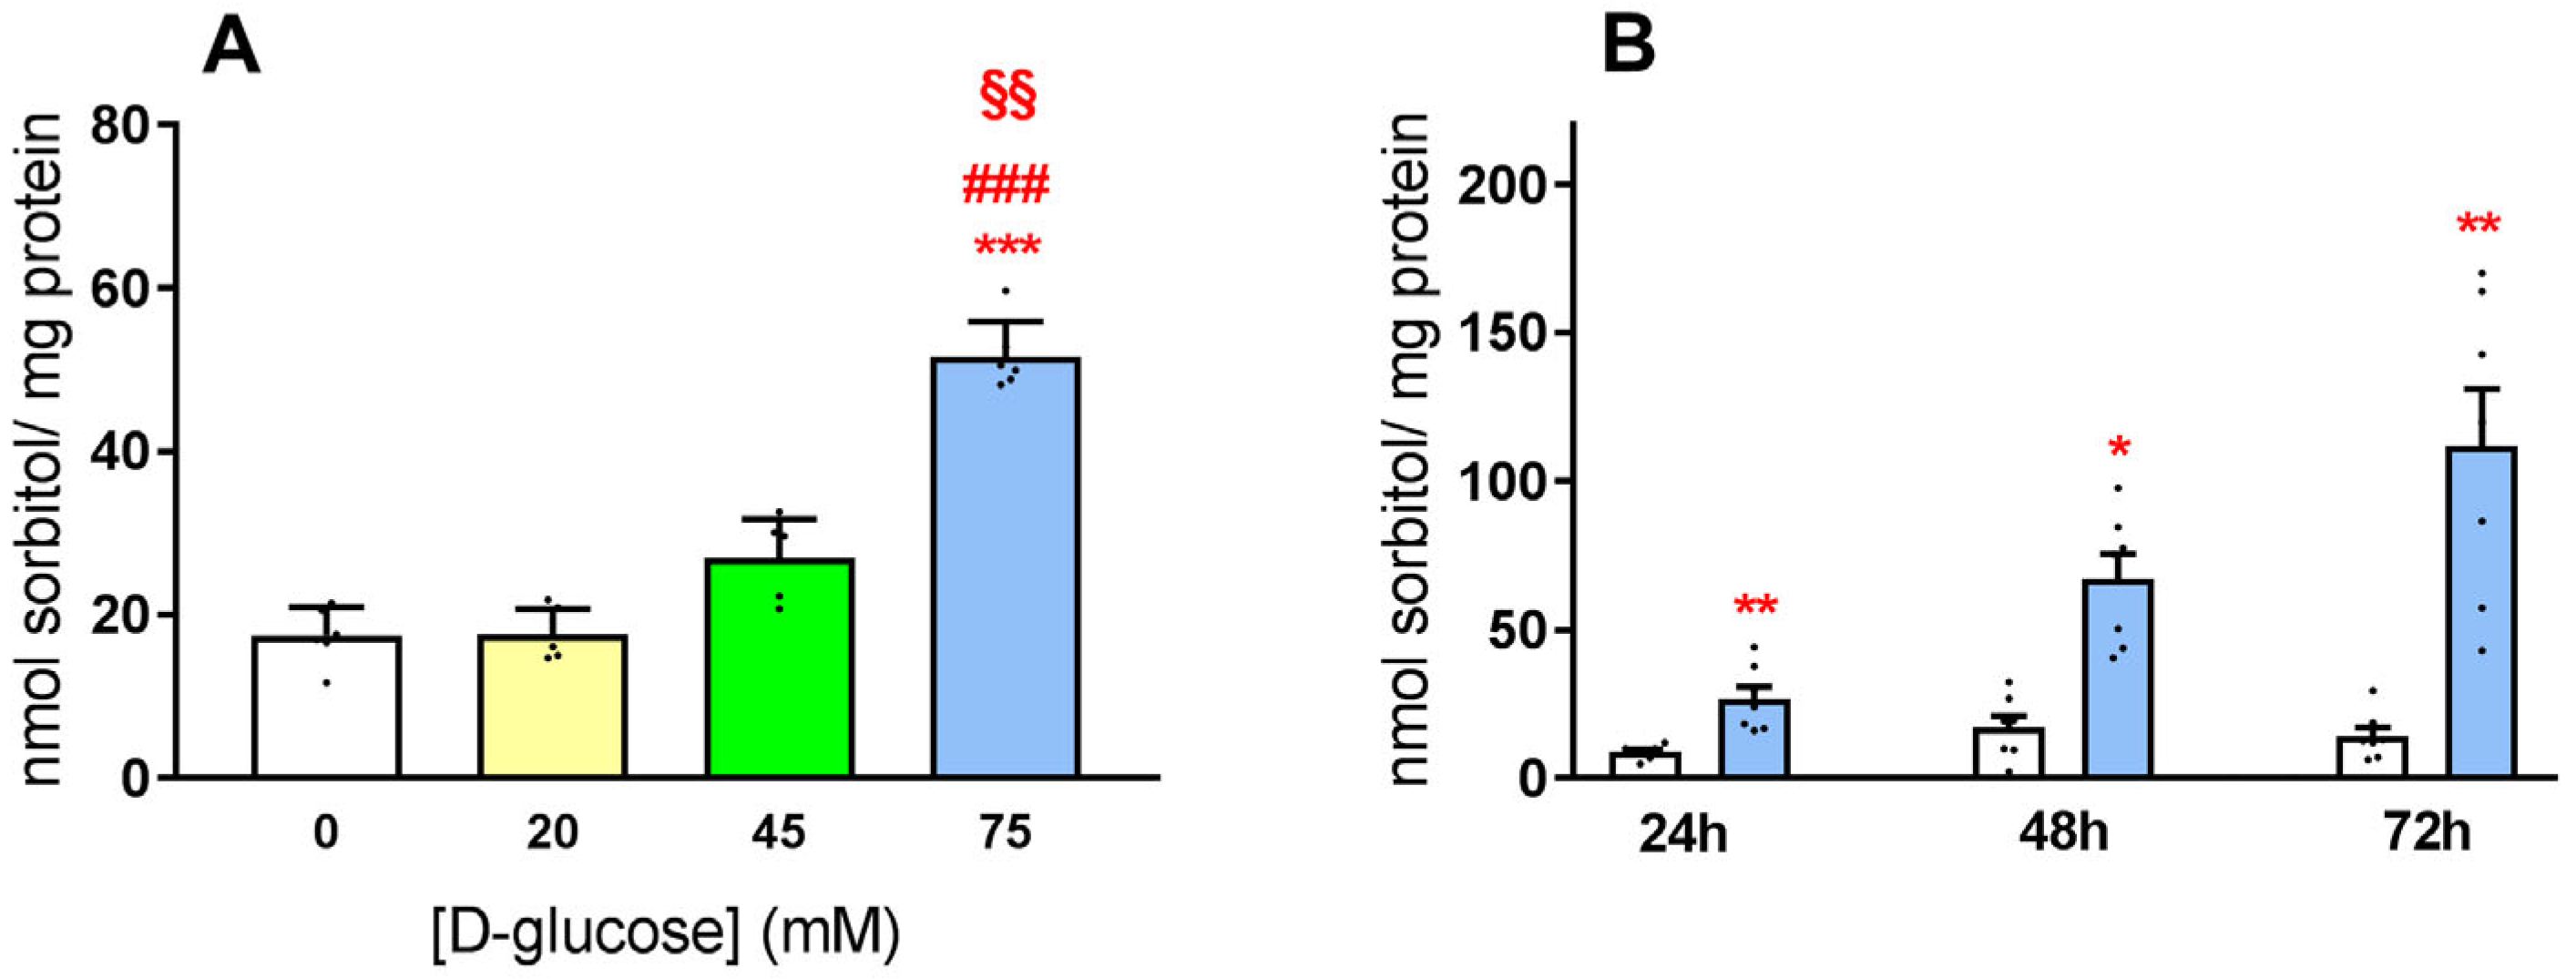
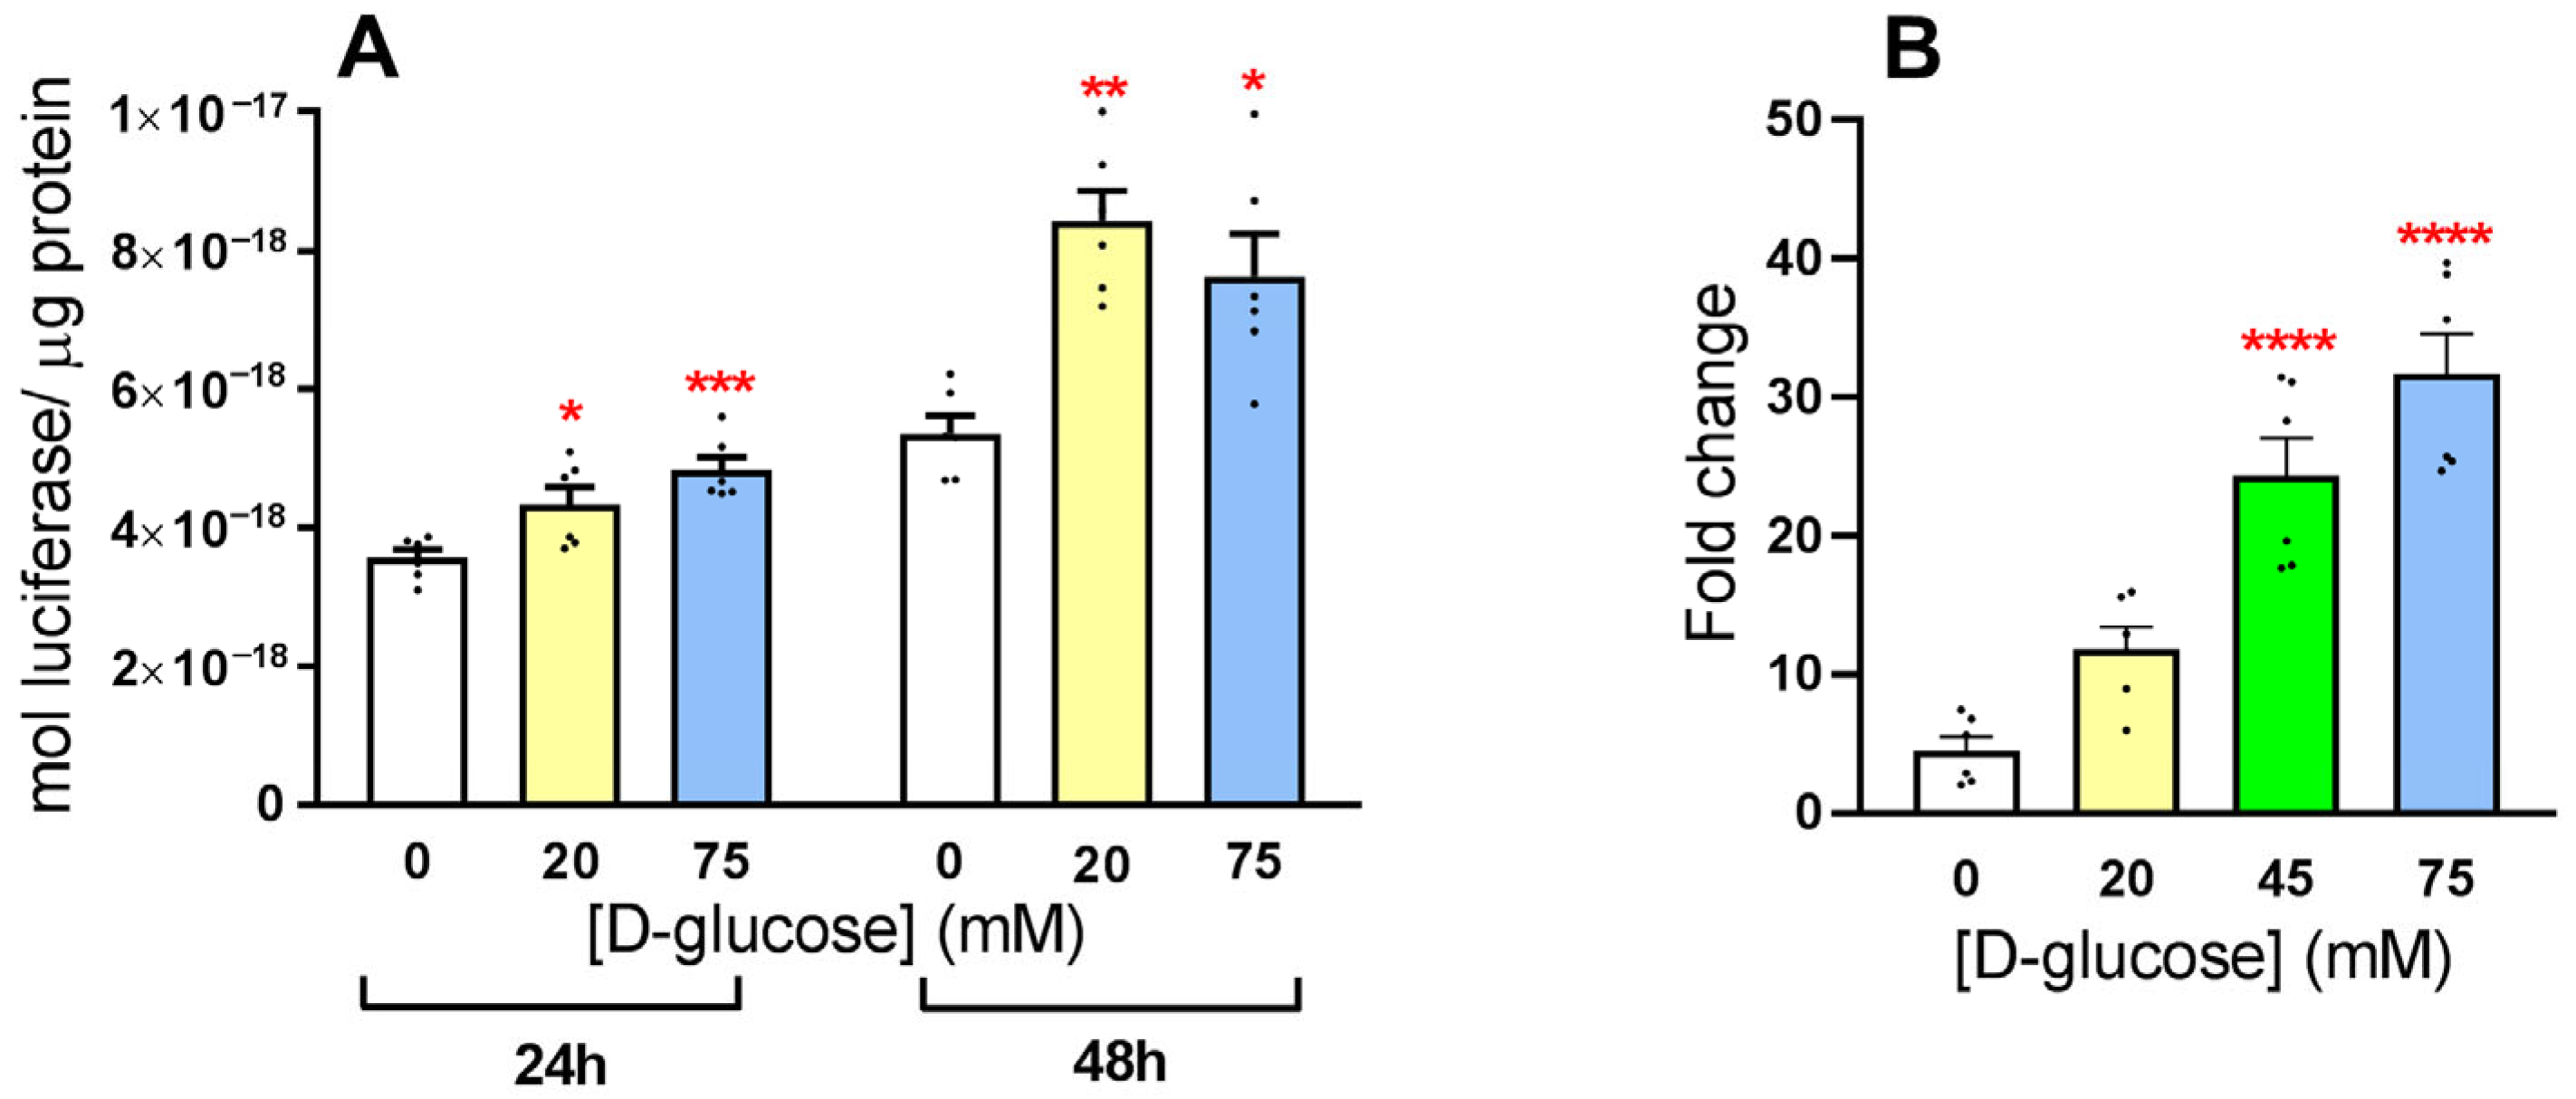
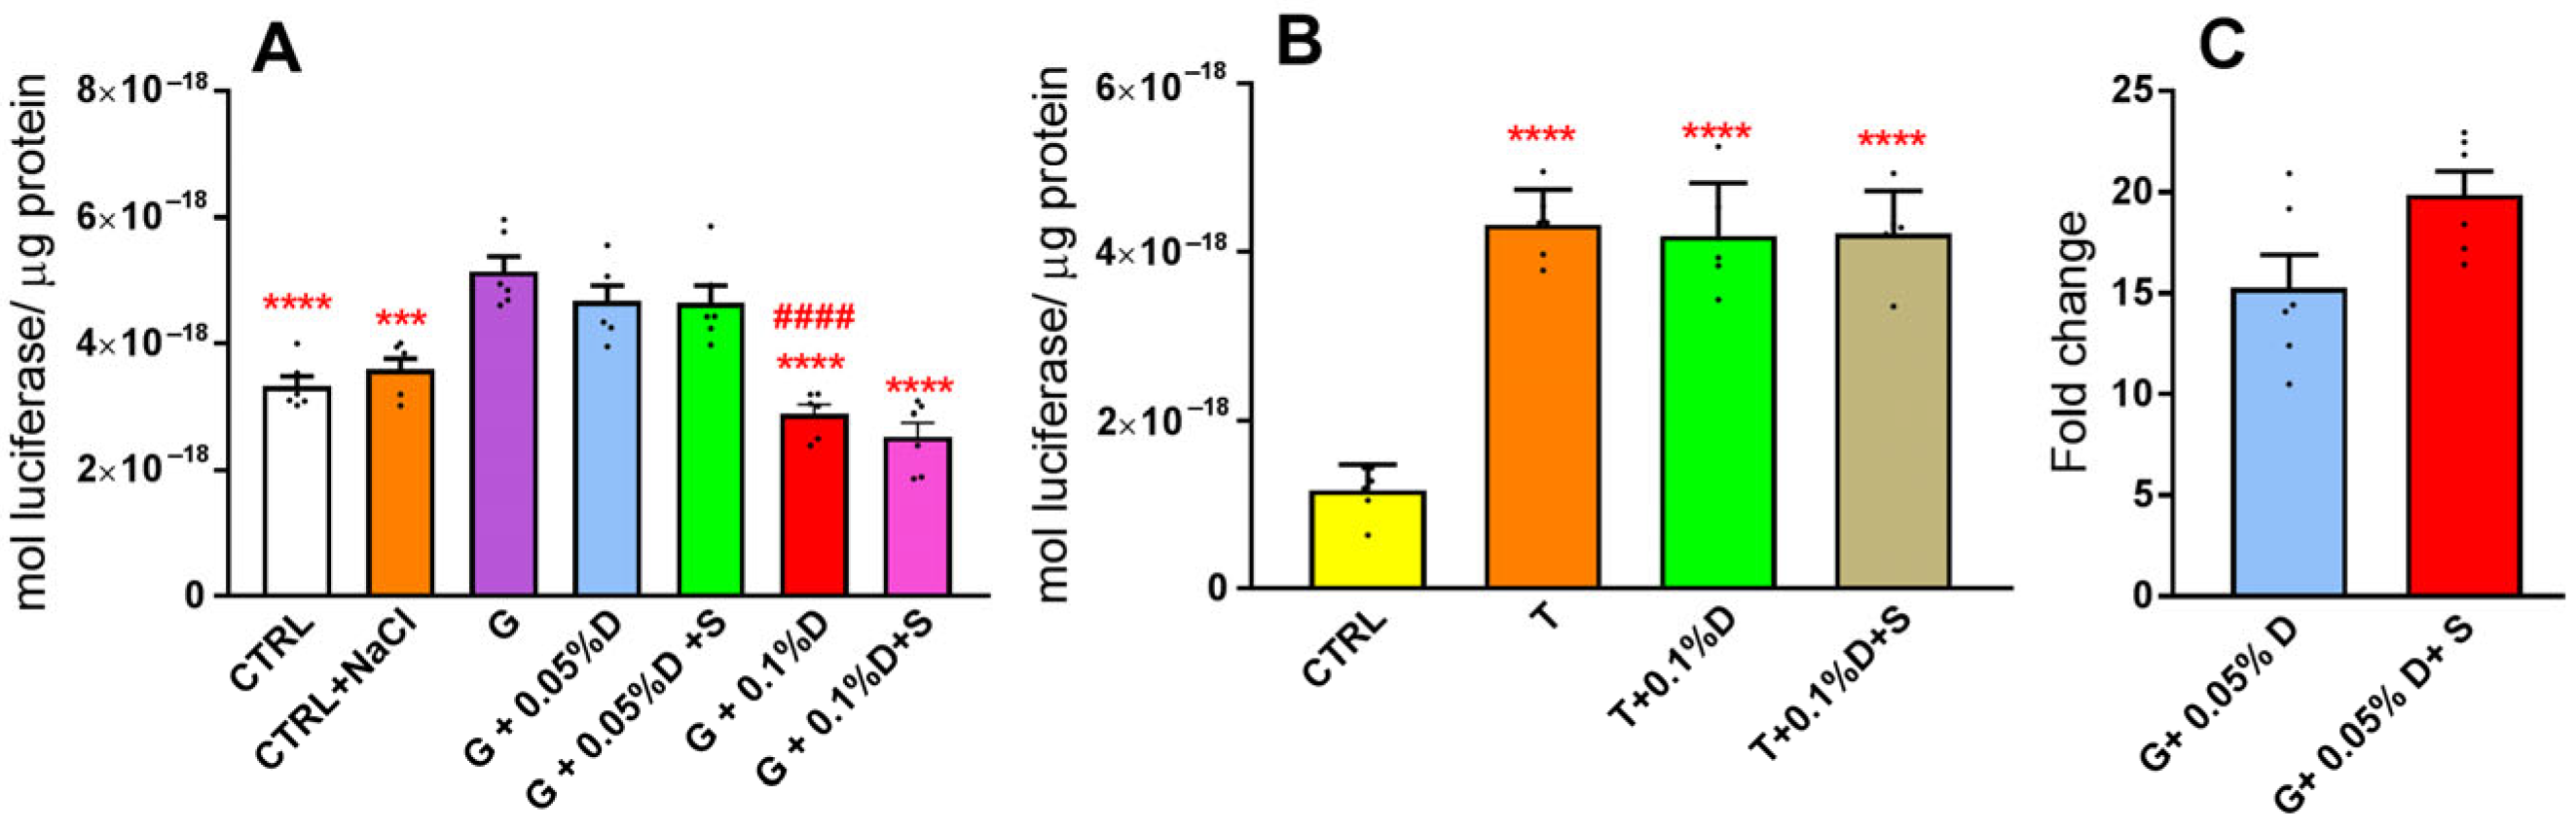
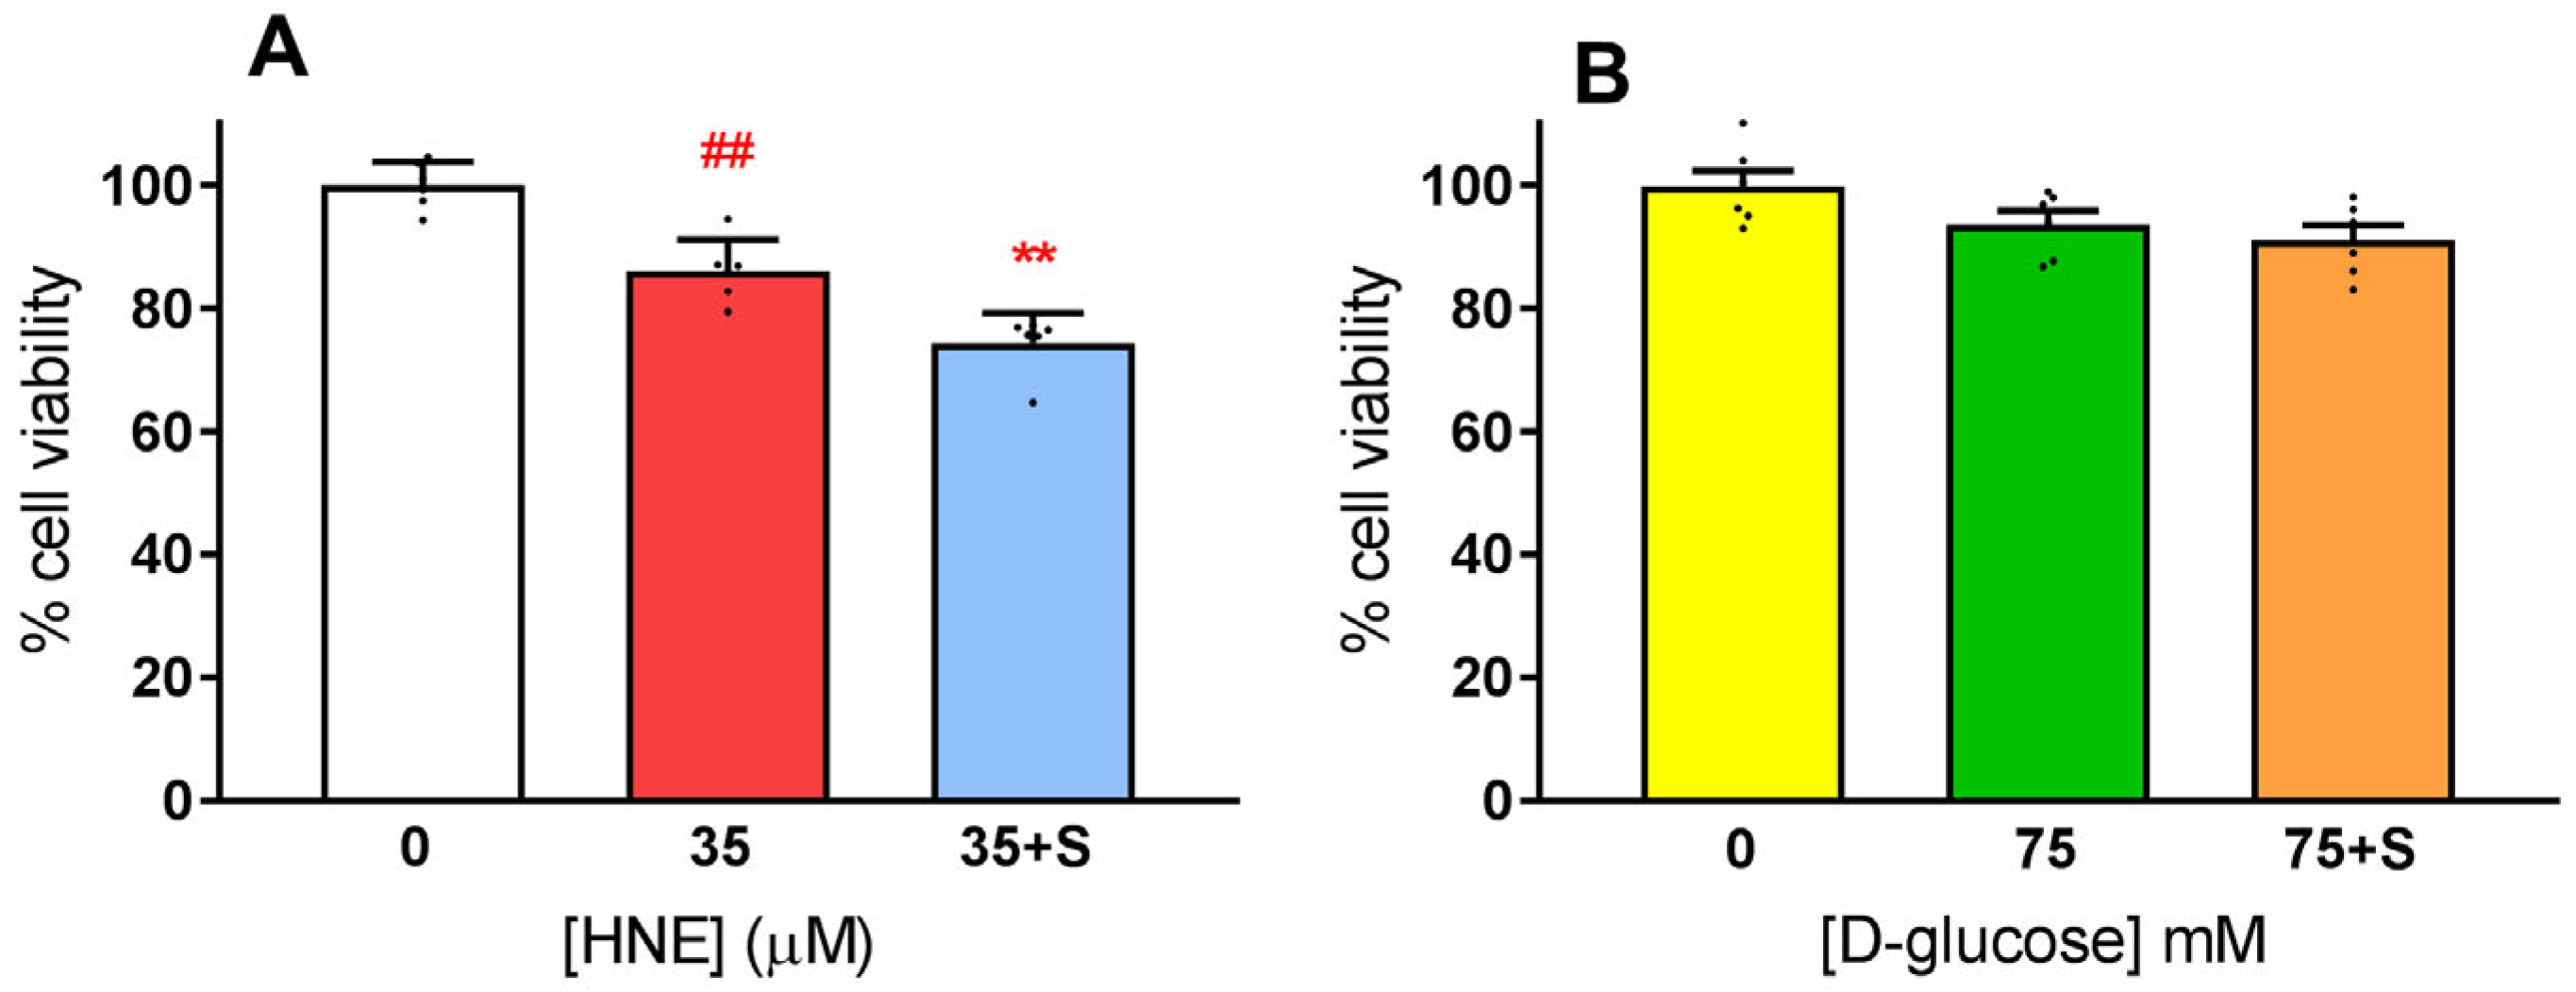
3.1. Exposure of HLE Cells to Hyperglycemic Stress
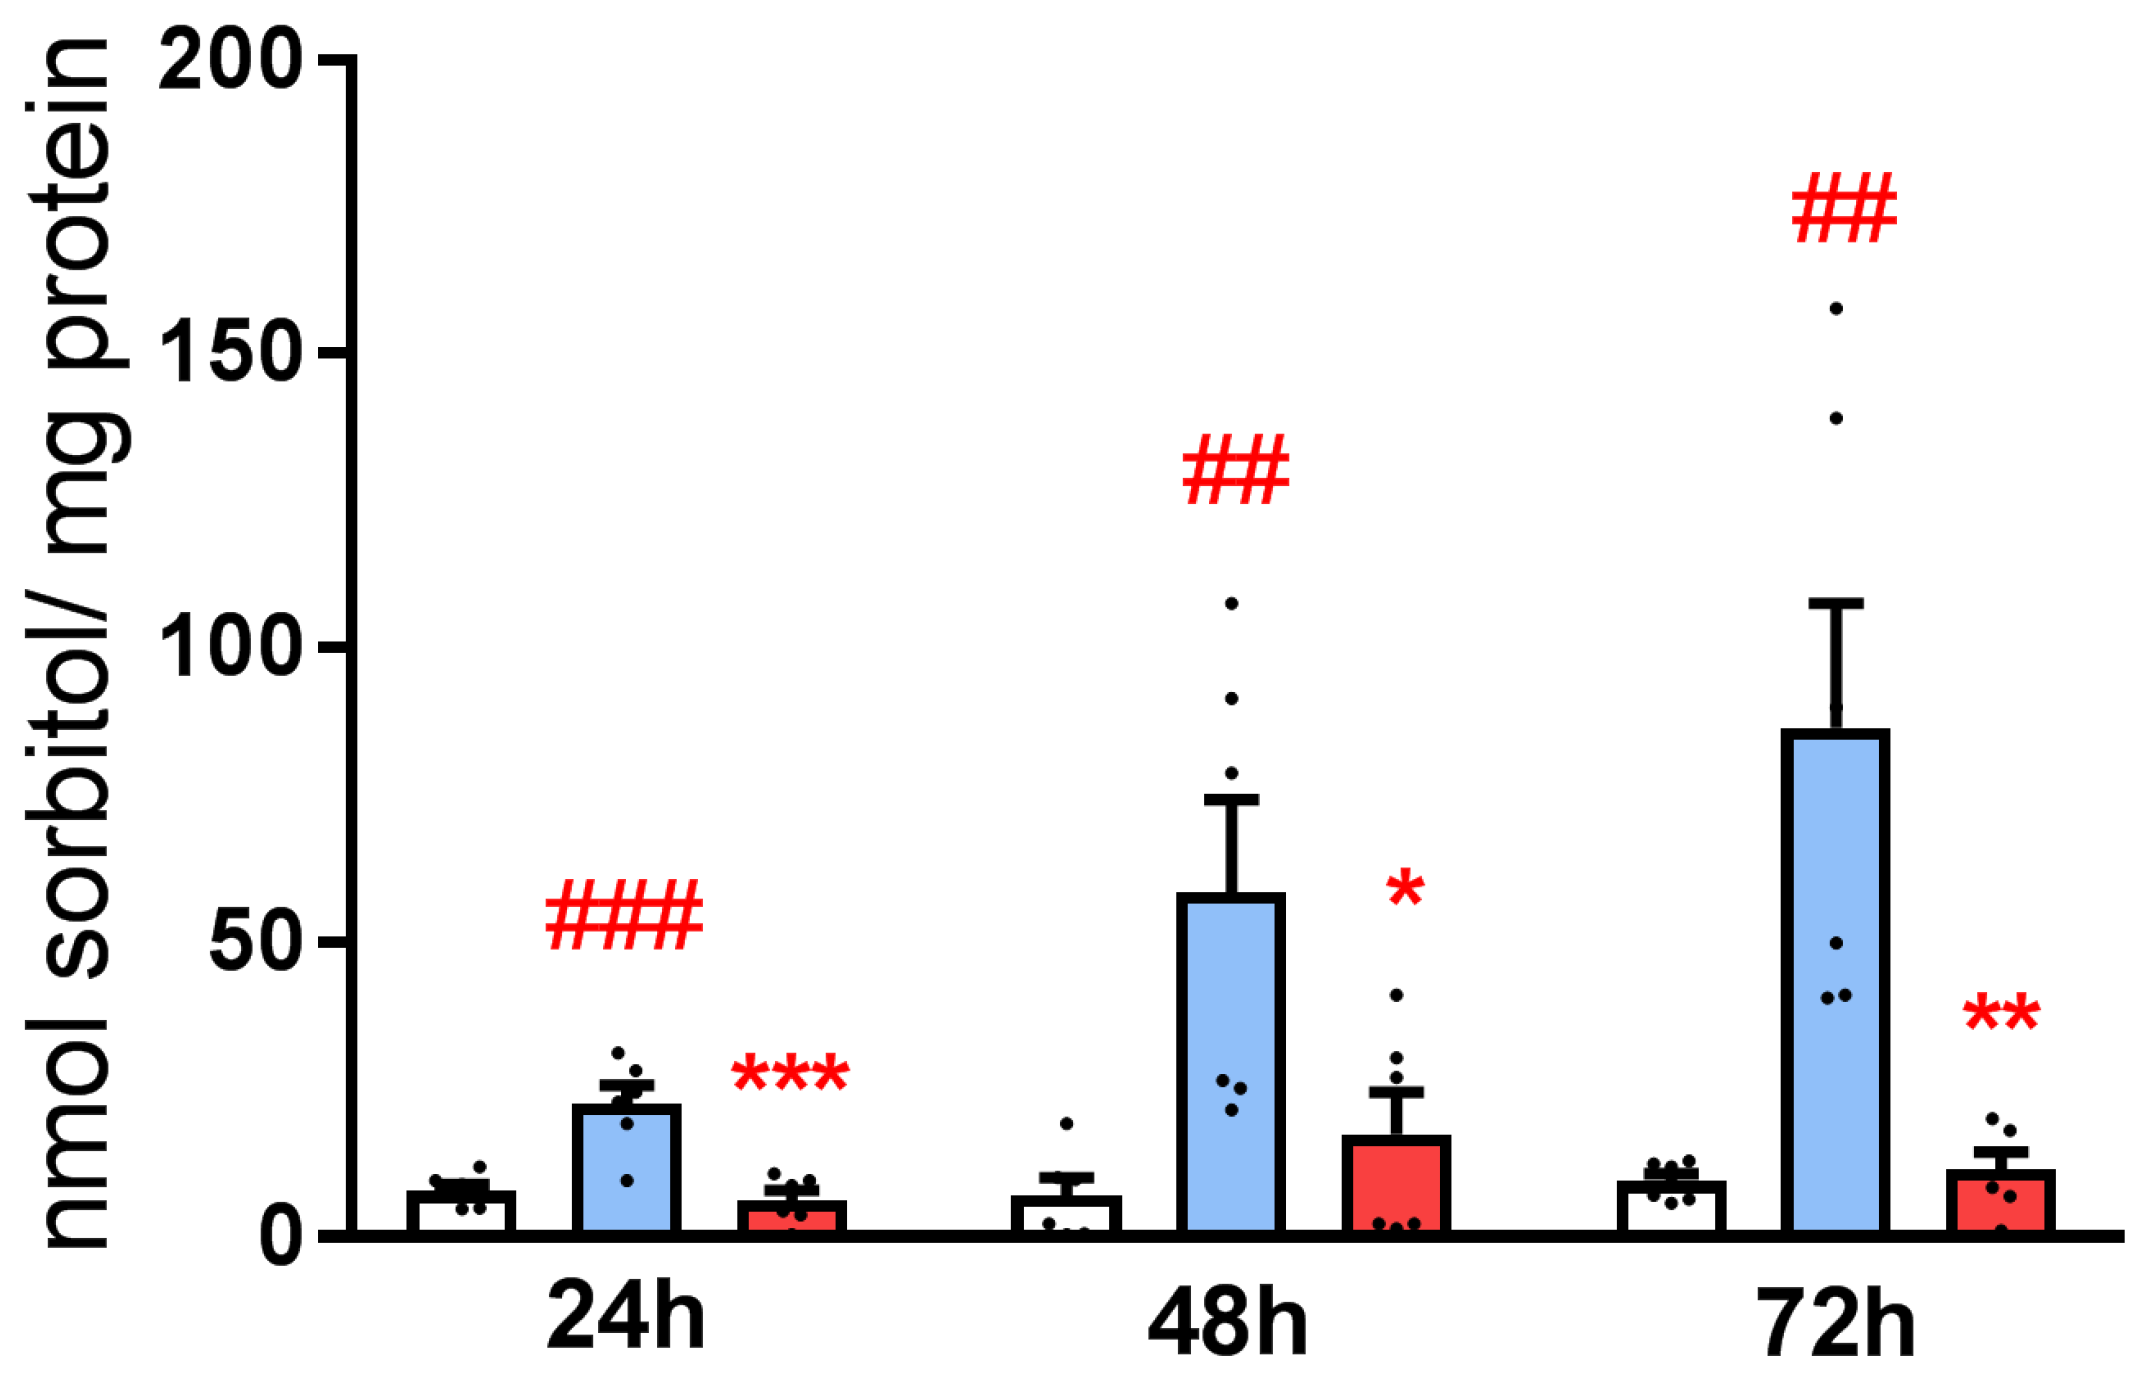
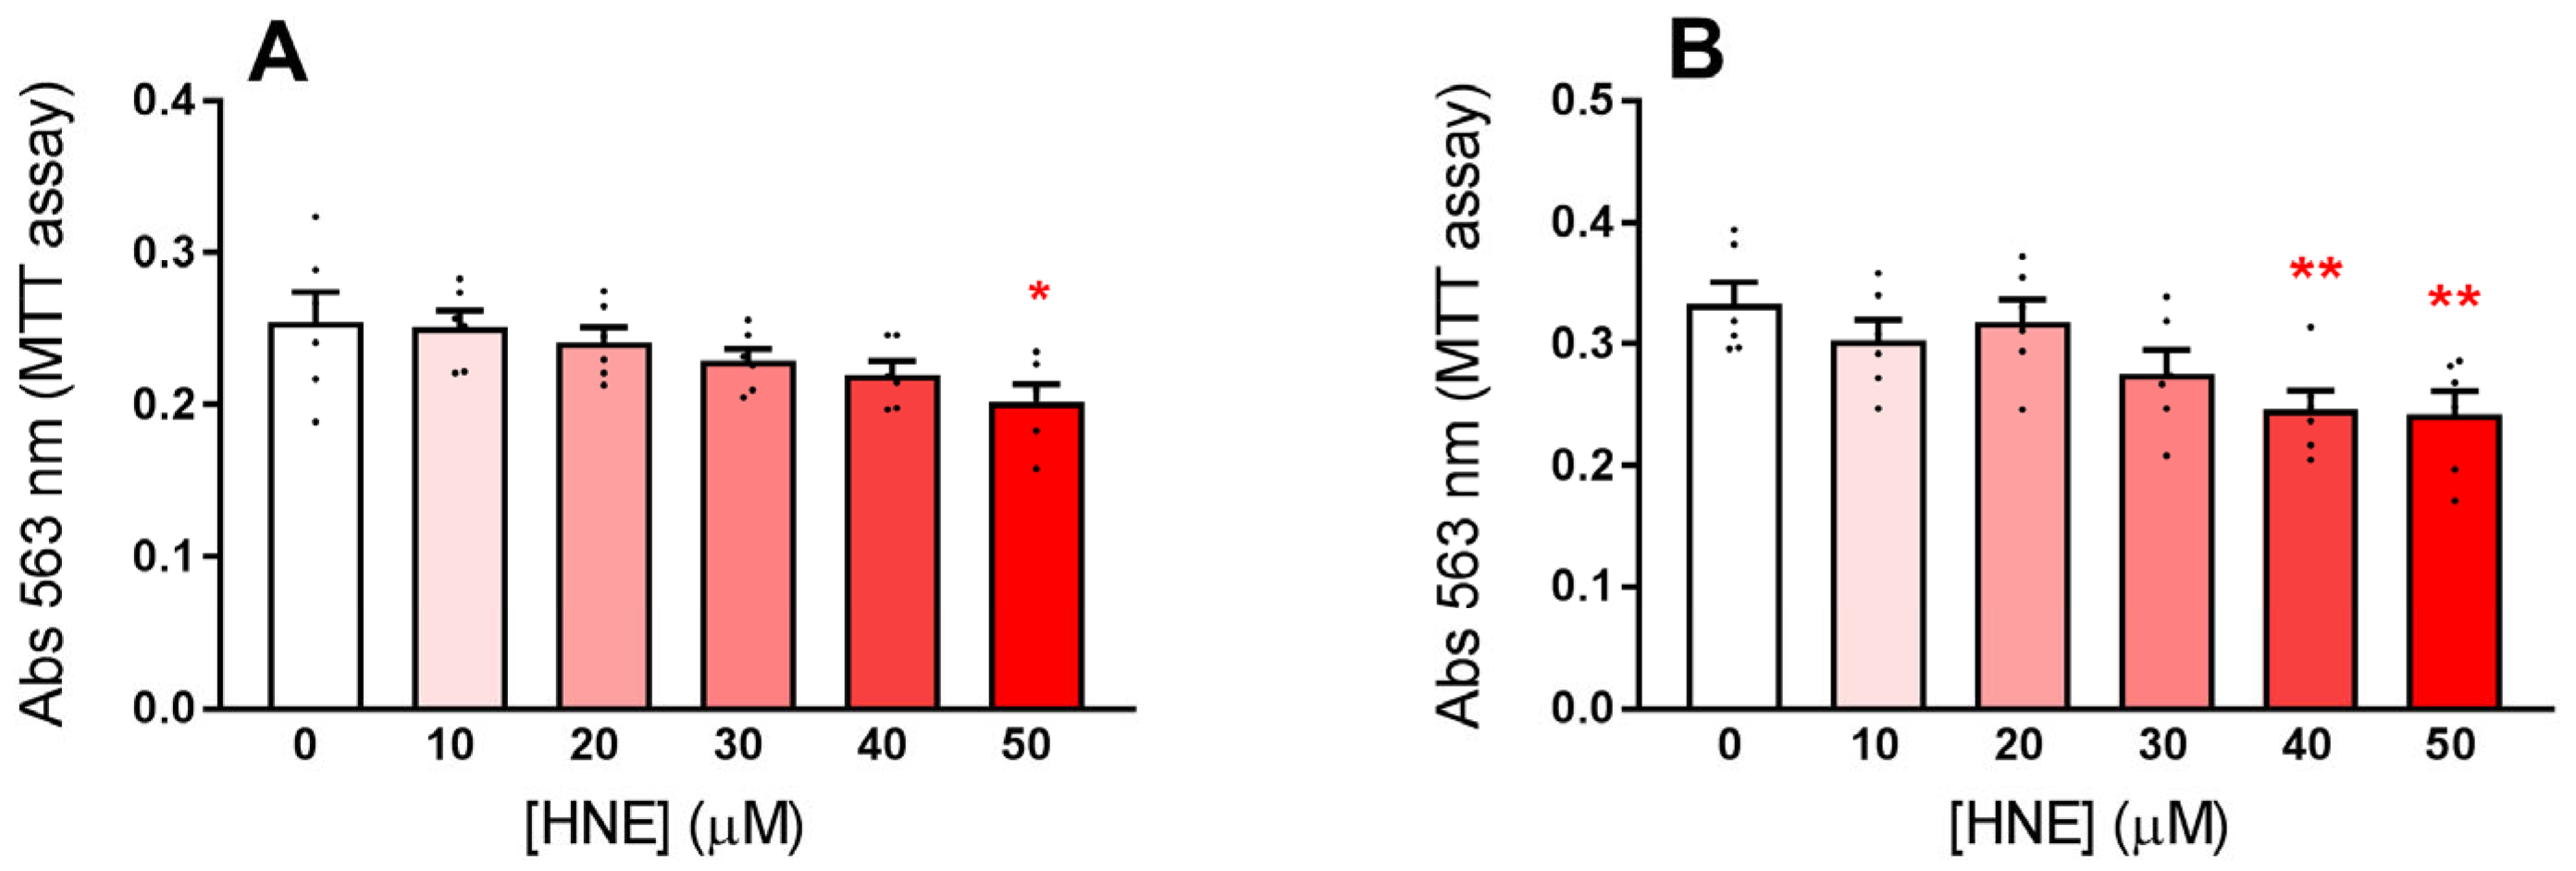
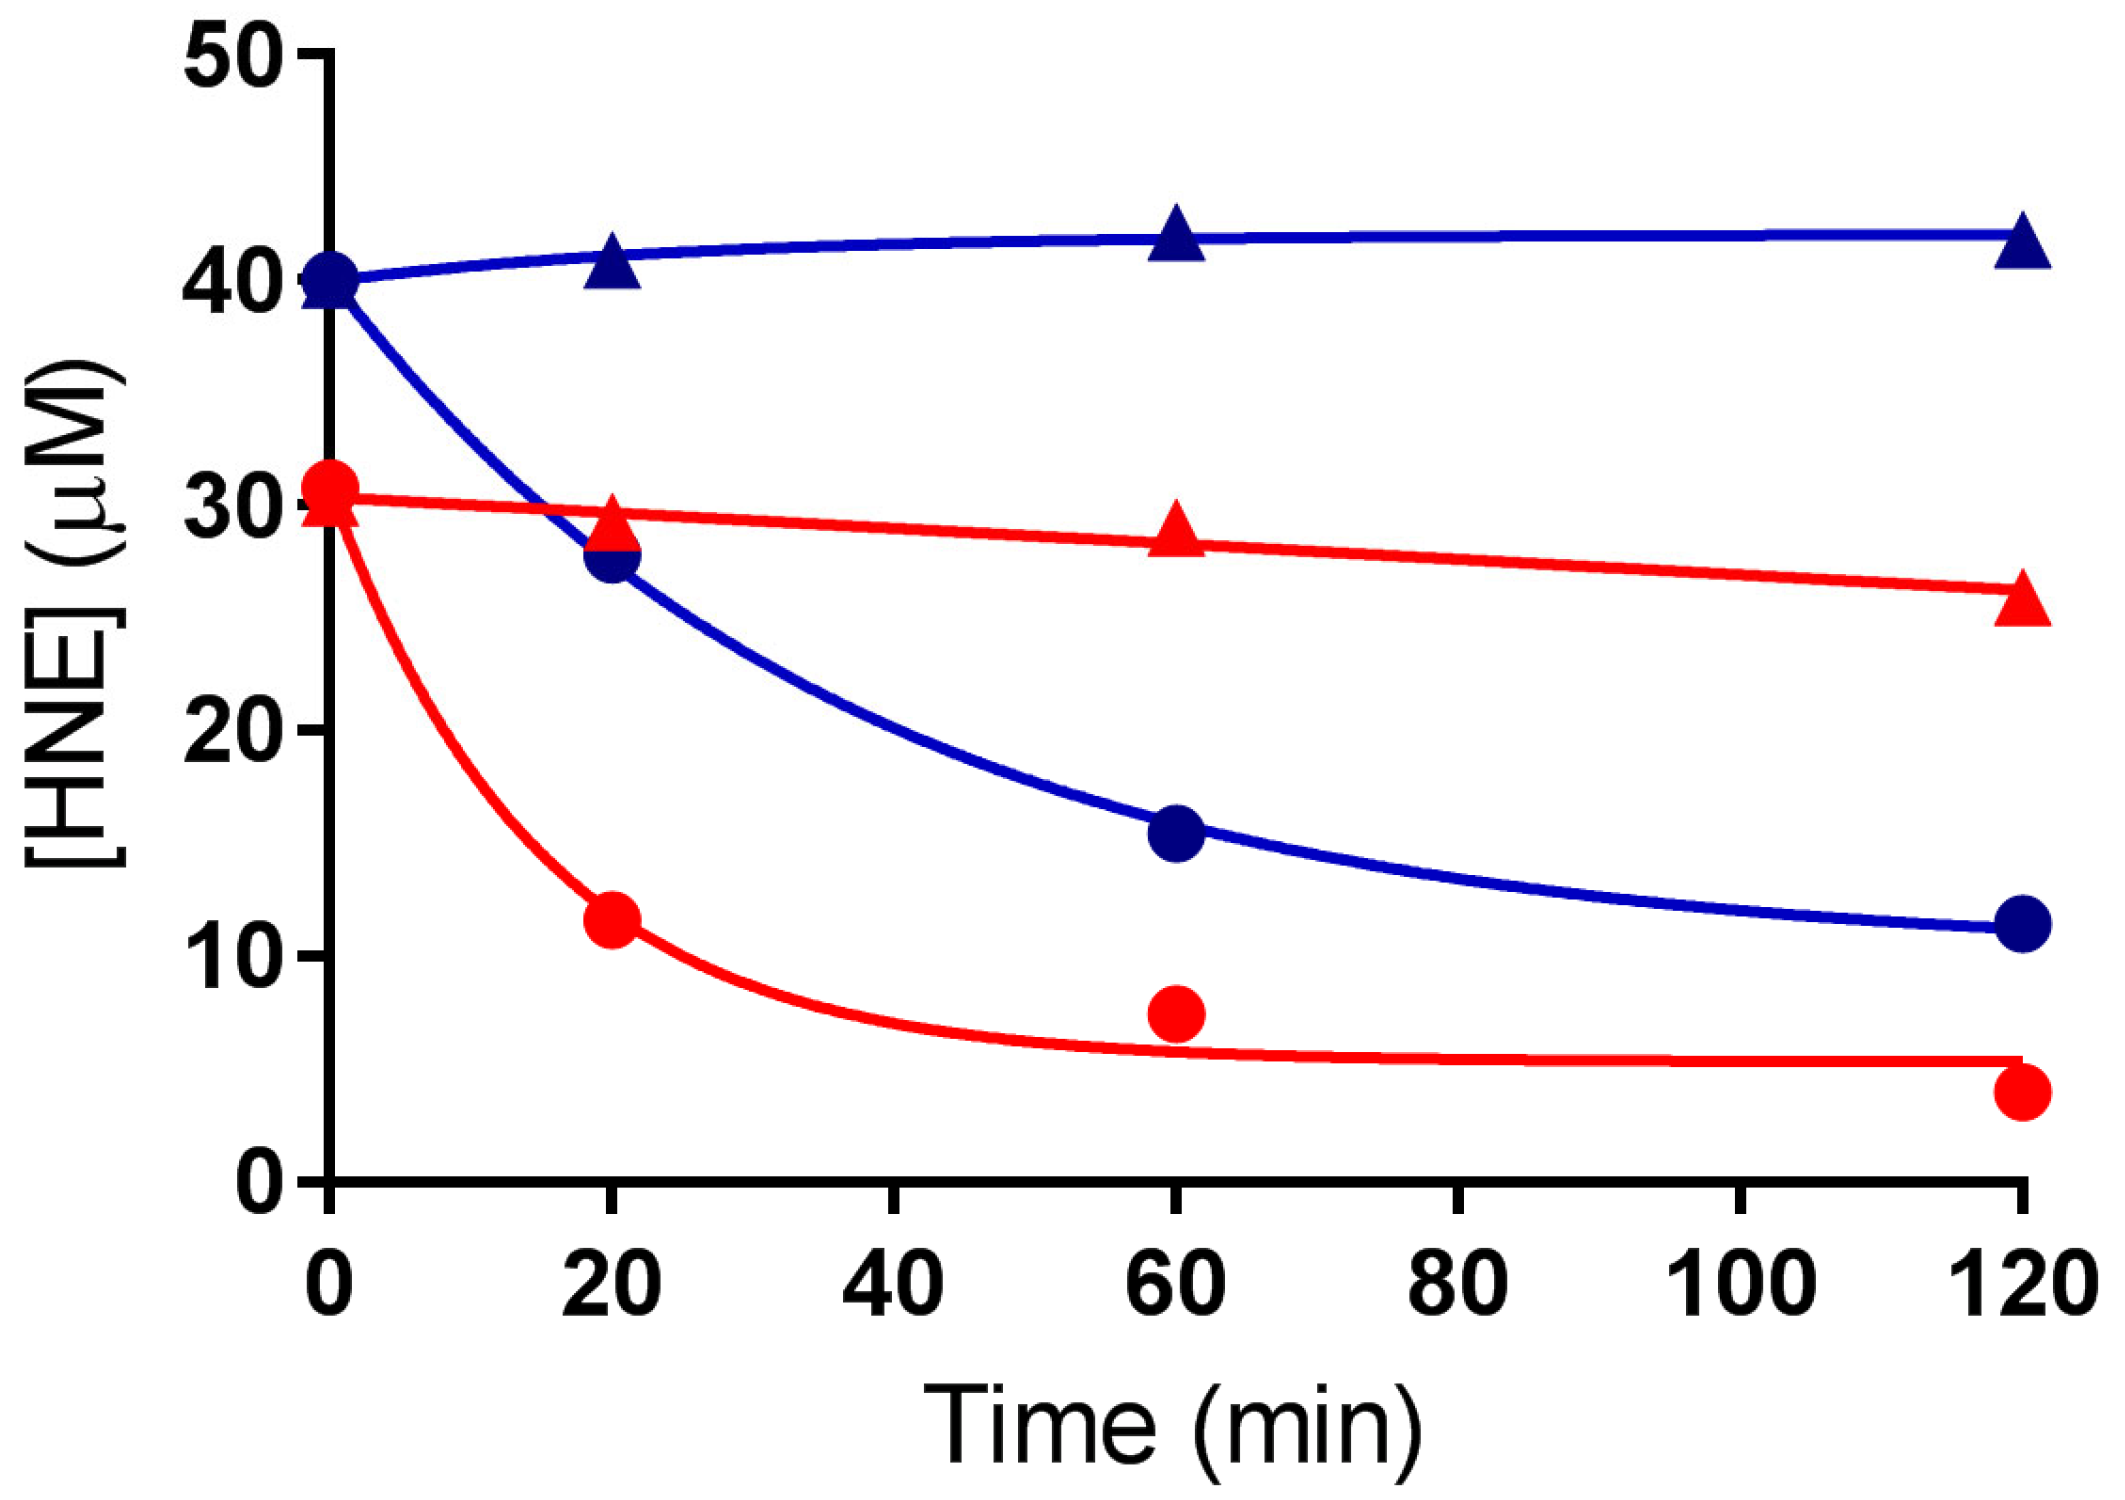
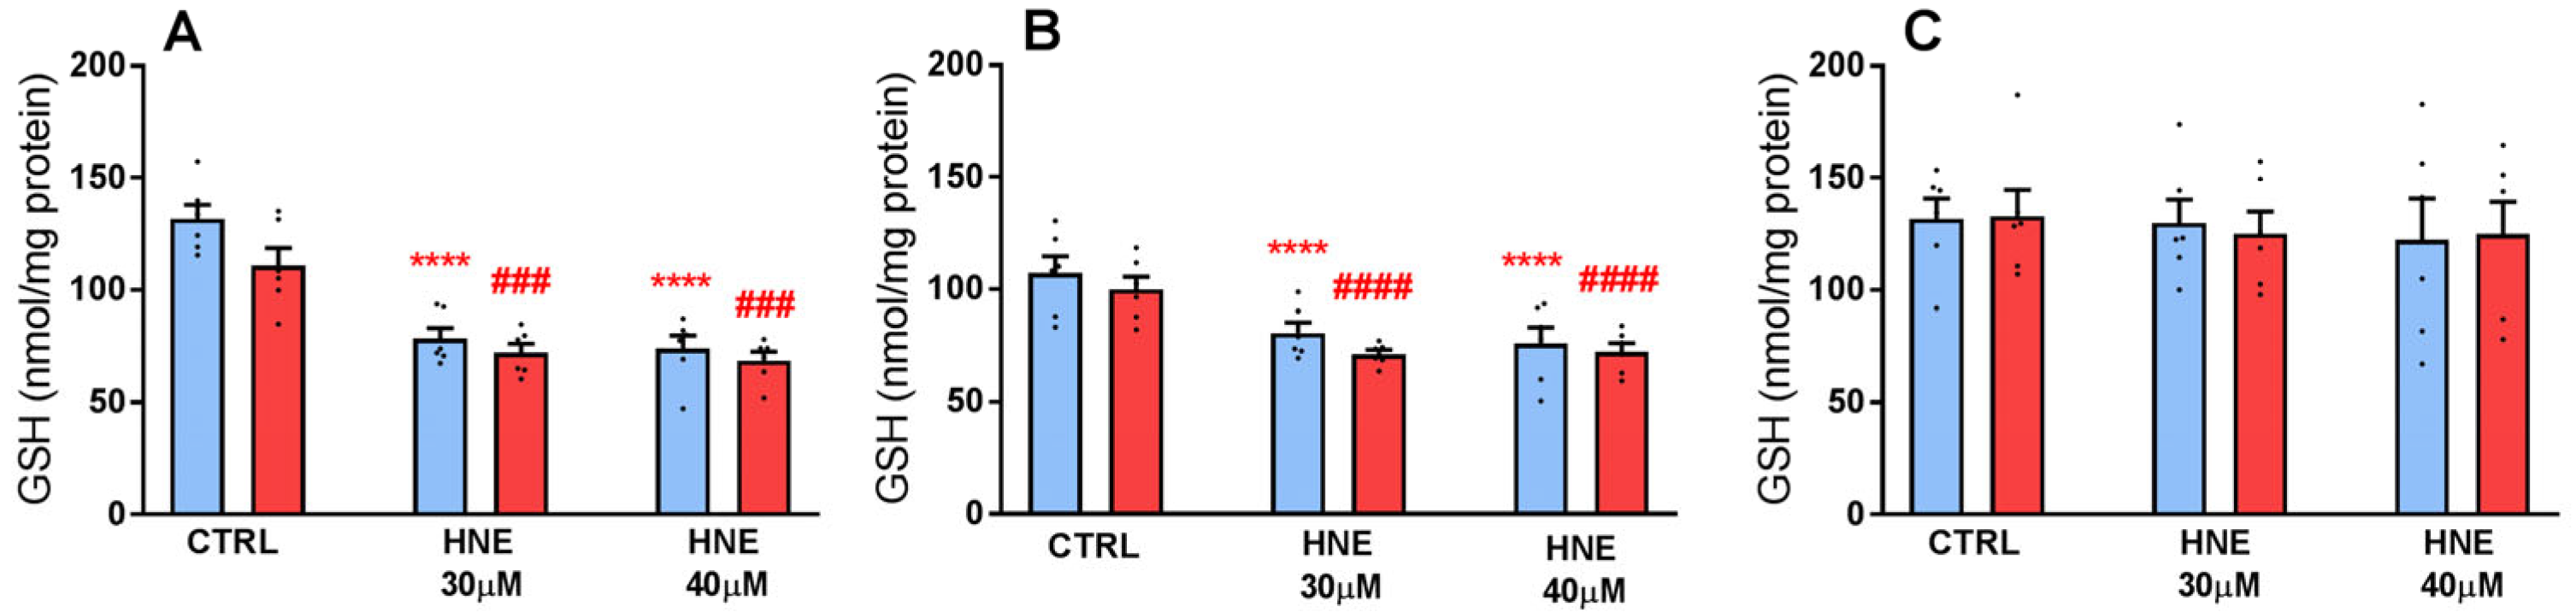
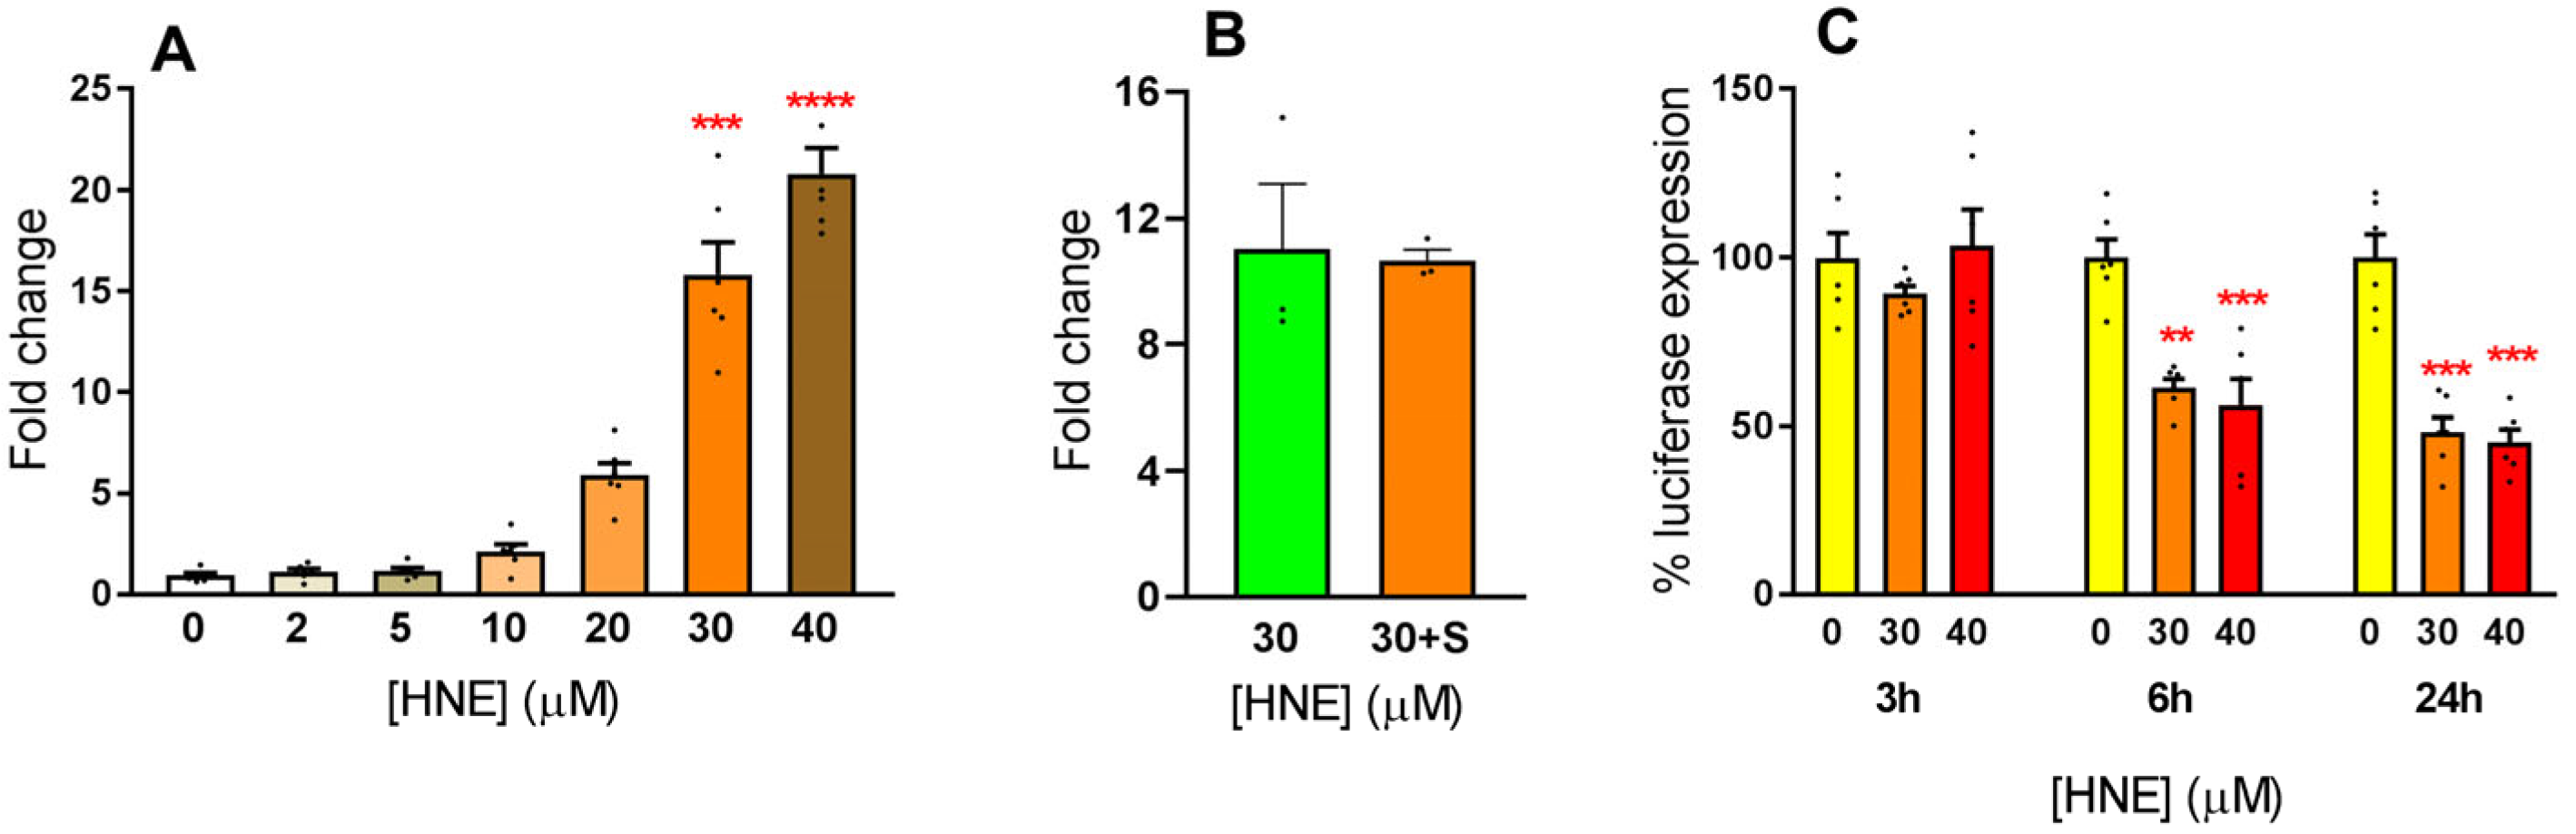
3.2. Exposure of HLE to Oxidative Stress
4. Conclusions
Supplementary Materials
Author Contributions
Funding
Institutional Review Board Statement
Informed Consent Statement
Data Availability Statement
Acknowledgments
Conflicts of Interest
References
- Global Burden of Disease Collaborative Network. Global Burden of Disease Study 2019. Results. Institute for Health Metrics and Evaluation 2020. Available online: https://vizhub.healthdata.org/gbd-results/ (accessed on 15 January 2023).
- Giri, B.; Dey, S.; Das, T.; Sarkar, M.; Banerjee, J.; Dash, S.K. Chronic Hyperglycemia Mediated Physiological Alteration and Metabolic Distortion Leads to Organ Dysfunction, Infection, Cancer Progression and Other Pathophysiological Consequences: An Update on Glucose Toxicity. Biomed. Pharmacother. 2018, 107, 306–328. [Google Scholar] [CrossRef] [PubMed]
- Obrosova, I.G.; Chung, S.S.M.; Kador, P.F. Diabetic Cataracts: Mechanisms and Management. Diabetes Metab. Res. Rev. 2010, 26, 172–180. [Google Scholar] [CrossRef] [PubMed]
- Oyama, T.; Miyasita, Y.; Watanabe, H.; Shirai, K. The Role of Polyol Pathway in High Glucose-Induced Endothelial Cell Damages. Diabetes Res. Clin. Pract. 2006, 73, 227–234. [Google Scholar] [CrossRef] [PubMed]
- Thakur, S.; Gupta, S.K.; Ali, V.; Singh, P.; Verma, M. Aldose Reductase: A Cause and a Potential Target for the Treatment of Diabetic Complications. Arch. Pharm. Res. 2021, 44, 655–667. [Google Scholar] [CrossRef]
- Gonzalez, R.G.; Barnett, P.; Aguayo, J.; Cheng, H.M.; Chylack, L.T. Direct Measurement of Polyol Pathway Activity in the Ocular Lens. Diabetes 1984, 33, 196–199. [Google Scholar] [CrossRef] [Green Version]
- Morrison, A.D.; Clements, R.S.; Travis, S.B.; Oski, F.; Winegrad, A.I. Glucose Utilization by the Polyol Pathway in Human Erythrocytes. Biochem. Biophys. Res. Commun. 1970, 40, 199–205. [Google Scholar] [CrossRef]
- Kinoshita, J.H. A Thirty Year Journey in the Polyol Pathway. Exp. Eye Res. 1990, 50, 567–573. [Google Scholar] [CrossRef]
- Dunlop, M. Aldose Reductase and the Role of the Polyol Pathway in Diabetic Nephropathy. Kidney Int. 2000, 58, S3–S12. [Google Scholar] [CrossRef] [Green Version]
- Singh Grewal, A.; Bhardwaj, S.; Pandita, D.; Lather, V.; Singh Sekhon, B. Updates on Aldose Reductase Inhibitors for Management of Diabetic Complications and Non-Diabetic Diseases. MRMC 2015, 16, 120–162. [Google Scholar] [CrossRef]
- Liu, H.; Luo, Y.; Zhang, T.; Zhang, Y.; Wu, Q.; Yuan, L.; Chung, S.S.M.; Oates, P.J.; Yang, J.Y. Genetic Deficiency of Aldose Reductase Counteracts the Development of Diabetic Nephropathy in C57BL/6 Mice. Diabetologia 2011, 54, 1242–1251. [Google Scholar] [CrossRef] [Green Version]
- Benlarbi-Ben Khedher, M.; Hajri, K.; Dellaa, A.; Baccouche, B.; Hammoum, I.; Boudhrioua-Mihoubi, N.; Dhifi, W.; Ben Chaouacha-Chekir, R. Astaxanthin Inhibits Aldose Reductase Activity in Psammomys Obesus, a Model of Type 2 Diabetes and Diabetic Retinopathy. Food Sci. Nutr. 2019, 7, 3979–3985. [Google Scholar] [CrossRef] [PubMed]
- Srivastava, S.; Chandra, A.; Bhatnagar, A.; Srivastava, S.K.; Ansari, N.H. Lipid Peroxidation Product, 4-Hydroxynonenal and Its Conjugate with GSH Are Excellent Substrates of Bovine Lens Aldose Reductase. Biochem. Biophys. Res. Commun. 1995, 217, 741–746. [Google Scholar] [CrossRef]
- Vander Jagt, D.L.; Kolb, N.S.; Vander Jagt, T.J.; Chino, J.; Martinez, F.J.; Hunsaker, L.A.; Royer, R.E. Substrate Specificity of Human Aldose Reductase: Identification of 4-Hydroxynonenal as an Endogenous Substrate. Biochim. Et Biophys. Acta (BBA)-Protein Struct. Mol. Enzymol. 1995, 1249, 117–126. [Google Scholar] [CrossRef]
- Del-Corso, A.; Balestri, F.; Di Bugno, E.; Moschini, R.; Cappiello, M.; Sartini, S.; La-Motta, C.; Da-Settimo, F.; Mura, U. A New Approach to Control the Enigmatic Activity of Aldose Reductase. PLoS ONE 2013, 8, e74076. [Google Scholar] [CrossRef] [PubMed] [Green Version]
- Balestri, F.; Moschini, R.; Mura, U.; Cappiello, M.; Del Corso, A. In Search of Differential Inhibitors of Aldose Reductase. Biomolecules 2022, 12, 485. [Google Scholar] [CrossRef]
- Jaganjac, M.; Tirosh, O.; Cohen, G.; Sasson, S.; Zarkovic, N. Reactive Aldehydes—Second Messengers of Free Radicals in Diabetes Mellitus. Free. Radic. Res. 2013, 47, 39–48. [Google Scholar] [CrossRef] [Green Version]
- Volpe, C.M.O.; Villar-Delfino, P.H.; dos Anjos, P.M.F.; Nogueira-Machado, J.A. Cellular Death, Reactive Oxygen Species (ROS) and Diabetic Complications. Cell Death. Dis. 2018, 9, 119. [Google Scholar] [CrossRef] [Green Version]
- Fiorentino, T.; Prioletta, A.; Zuo, P.; Folli, F. Hyperglycemia-Induced Oxidative Stress and Its Role in Diabetes Mellitus Related Cardiovascular Diseases. CPD 2013, 19, 5695–5703. [Google Scholar] [CrossRef]
- Burgos-Morón, E.; Abad-Jiménez, Z.; Martínez de Marañón, A.; Iannantuoni, F.; Escribano-López, I.; López-Domènech, S.; Salom, C.; Jover, A.; Mora, V.; Roldan, I.; et al. Relationship Between Oxidative Stress, ER Stress, and Inflammation in Type 2 Diabetes: The Battle Continues. JCM 2019, 8, 1385. [Google Scholar] [CrossRef] [Green Version]
- Hung, H.; Tsai, S.; Sie, S.; Kuo, Y. High Glucose Enhances Lipopolysaccharide-induced Inflammation in Cultured BV2 Microglial Cell Line. Immun. Inflam Amp Dis. 2022, 10, e610. [Google Scholar] [CrossRef]
- Kiritoshi, S.; Nishikawa, T.; Sonoda, K.; Kukidome, D.; Senokuchi, T.; Matsuo, T.; Matsumura, T.; Tokunaga, H.; Brownlee, M.; Araki, E. Reactive Oxygen Species from Mitochondria Induce Cyclooxygenase-2 Gene Expression in Human Mesangial Cells. Diabetes 2003, 52, 2570–2577. [Google Scholar] [CrossRef] [PubMed]
- Hotamisligil, G.S. Inflammation and Metabolic Disorders. Nature 2006, 444, 860–867. [Google Scholar] [CrossRef]
- Persaud, S.J.; Burns, C.J.; Belin, V.D.; Jones, P.M. Glucose-Induced Regulation of COX-2 Expression in Human Islets of Langerhans. Diabetes 2004, 53, S190–S192. [Google Scholar] [CrossRef] [Green Version]
- Madonna, R.; Giovannelli, G.; Confalone, P.; Renna, F.V.; Geng, Y.-J.; De Caterina, R. High Glucose-Induced Hyperosmolarity Contributes to COX-2 Expression and Angiogenesis: Implications for Diabetic Retinopathy. Cardiovasc. Diabetol. 2016, 15, 18. [Google Scholar] [CrossRef] [Green Version]
- Poli, G.; Schaur, R.J.; Siems, W.G.; Leonarduzzi, G. 4-Hydroxynonenal: A Membrane Lipid Oxidation Product of Medicinal Interest. Med. Res. Rev. 2008, 28, 569–631. [Google Scholar] [CrossRef] [PubMed]
- Elrayess, M.A.; Almuraikhy, S.; Kafienah, W.; Al-Menhali, A.; Al-Khelaifi, F.; Bashah, M.; Zarkovic, K.; Zarkovic, N.; Waeg, G.; Alsayrafi, M.; et al. 4-Hydroxynonenal Causes Impairment of Human Subcutaneous Adipogenesis and Induction of Adipocyte Insulin Resistance. Free. Radic. Biol. Med. 2017, 104, 129–137. [Google Scholar] [CrossRef] [PubMed] [Green Version]
- Jaganjac, M.; Zarkovic, N. Lipid Peroxidation Linking Diabetes and Cancer: The Importance of 4-Hydroxynonenal. Antioxid. Redox Signal. 2022, 37, 1222–1233. [Google Scholar] [CrossRef]
- Esterbauer, H.; Schaur, R.J.; Zollner, H. Chemistry and Biochemistry of 4-Hydroxynonenal, Malonaldehyde and Related Aldehydes. Free. Radic. Biol. Med. 1991, 11, 81–128. [Google Scholar] [CrossRef]
- Guéraud, F.; Atalay, M.; Bresgen, N.; Cipak, A.; Eckl, P.M.; Huc, L.; Jouanin, I.; Siems, W.; Uchida, K. Chemistry and Biochemistry of Lipid Peroxidation Products. Free. Radic. Res. 2010, 44, 1098–1124. [Google Scholar] [CrossRef]
- Zheng, R.; Dragomir, A.-C.; Mishin, V.; Richardson, J.R.; Heck, D.E.; Laskin, D.L.; Laskin, J.D. Differential Metabolism of 4-Hydroxynonenal in Liver, Lung and Brain of Mice and Rats. Toxicol. Appl. Pharmacol. 2014, 279, 43–52. [Google Scholar] [CrossRef] [Green Version]
- Siems, W.; Grune, T. Intracellular Metabolism of 4-Hydroxynonenal. Mol. Asp. Med. 2003, 24, 167–175. [Google Scholar] [CrossRef]
- Murphy, T.C.; Amarnath, V.; Gibson, K.M.; Picklo Sr, M.J. Oxidation of 4-Hydroxy-2-Nonenal by Succinic Semialdehyde Dehydrogenase (ALDH5A): Oxidation of HNE by ALDH5A. J. Neurochem. 2004, 86, 298–305. [Google Scholar] [CrossRef] [PubMed]
- Kong, D.; Kotraiah, V. Modulation of Aldehyde Dehydrogenase Activity Affects (±)-4-Hydroxy-2E-Nonenal (HNE) Toxicity and HNE-Protein Adduct Levels in PC12 Cells. J. Mol. Neurosci. 2012, 47, 595–603. [Google Scholar] [CrossRef]
- Shen, Y.; Zhong, L.; Johnson, S.; Cao, D. Human Aldo–Keto Reductases 1B1 and 1B10: A Comparative Study on Their Enzyme Activity toward Electrophilic Carbonyl Compounds. Chem. Biol. Interact. 2011, 191, 192–198. [Google Scholar] [CrossRef] [Green Version]
- Moschini, R.; Peroni, E.; Rotondo, R.; Renzone, G.; Melck, D.; Cappiello, M.; Srebot, M.; Napolitano, E.; Motta, A.; Scaloni, A.; et al. NADP+-Dependent Dehydrogenase Activity of Carbonyl Reductase on Glutathionylhydroxynonanal as a New Pathway for Hydroxynonenal Detoxification. Free. Radic. Biol. Med. 2015, 83, 66–76. [Google Scholar] [CrossRef] [PubMed]
- Rotondo, R.; Moschini, R.; Renzone, G.; Tuccinardi, T.; Balestri, F.; Cappiello, M.; Scaloni, A.; Mura, U.; Del-Corso, A. Human Carbonyl Reductase 1 as Efficient Catalyst for the Reduction of Glutathionylated Aldehydes Derived from Lipid Peroxidation. Free. Radic. Biol. Med. 2016, 99, 323–332. [Google Scholar] [CrossRef] [PubMed]
- Moschini, R.; Rotondo, R.; Renzone, G.; Balestri, F.; Cappiello, M.; Scaloni, A.; Mura, U.; Del-Corso, A. Kinetic Features of Carbonyl Reductase 1 Acting on Glutathionylated Aldehydes. Chem. Biol. Interact. 2017, 276, 127–132. [Google Scholar] [CrossRef] [Green Version]
- Hoffmann, A.; Baltimore, D. Circuitry of Nuclear Factor KappaB Signaling. Immunol. Rev. 2006, 210, 171–186. [Google Scholar] [CrossRef] [PubMed]
- Suryavanshi, S.V.; Kulkarni, Y.A. NF-Κβ: A Potential Target in the Management of Vascular Complications of Diabetes. Front. Pharmacol. 2017, 8, 798. [Google Scholar] [CrossRef] [Green Version]
- Tammali, R.; Ramana, K.V.; Singhal, S.S.; Awasthi, S.; Srivastava, S.K. Aldose Reductase Regulates Growth Factor-Induced Cyclooxygenase-2 Expression and Prostaglandin E2 Production in Human Colon Cancer Cells. Cancer Res. 2006, 66, 9705–9713. [Google Scholar] [CrossRef] [Green Version]
- Ramana, K.V.; Bhatnagar, A.; Srivastava, S.; Yadav, U.C.; Awasthi, S.; Awasthi, Y.C.; Srivastava, S.K. Mitogenic Responses of Vascular Smooth Muscle Cells to Lipid Peroxidation-Derived Aldehyde 4-Hydroxy-Trans-2-Nonenal (HNE). J. Biol. Chem. 2006, 281, 17652–17660. [Google Scholar] [CrossRef] [PubMed] [Green Version]
- Srivastava, S.; Ramana, K.V.; Bhatnagar, A.; Srivastava, S.K. Synthesis, Quantification, Characterization, and Signaling Properties of Glutathionyl Conjugates of Enals. In Methods in Enzymology; Elsevier: Amsterdam, The Netherlands, 2010; Volume 474, pp. 297–313. ISBN 978-0-12-381003-8. [Google Scholar]
- Ramana, K.V.; Friedrich, B.; Srivastava, S.; Bhatnagar, A.; Srivastava, S.K. Activation of Nulcear Factor-ΚB by Hyperglycemia in Vascular Smooth Muscle Cells Is Regulated by Aldose Reductase. Diabetes 2004, 53, 2910–2920. [Google Scholar] [CrossRef] [PubMed] [Green Version]
- Sarikaya, M.; Yazihan, N.; Daş Evcimen, N. Relationship between Aldose Reductase Enzyme and the Signaling Pathway of Protein Kinase C in an in Vitro Diabetic Retinopathy Model. Can. J. Physiol. Pharmacol. 2020, 98, 243–251. [Google Scholar] [CrossRef] [PubMed]
- Yang, B.; Hodgkinson, A.; Oates, P.J.; Millward, B.A.; Demaine, A.G. High Glucose Induction of DNA-Binding Activity of the Transcription Factor NFκB in Patients with Diabetic Nephropathy. Biochim. Et Biophys. Acta (BBA) Mol. Basis Dis. 2008, 1782, 295–302. [Google Scholar] [CrossRef] [Green Version]
- Ramana, K.V.; Friedrich, B.; Bhatnagar, A.; Srivastava, S.K. Aldose Reductase Mediates Cytotoxic Signals of Hyperglycemia and TNF-α in Human Lens Epithelial Cells. FASEB J. 2003, 17, 315–317. [Google Scholar] [CrossRef] [PubMed]
- Balestri, F.; Barracco, V.; Renzone, G.; Tuccinardi, T.; Pomelli, C.S.; Cappiello, M.; Lessi, M.; Rotondo, R.; Bellina, F.; Scaloni, A.; et al. Stereoselectivity of Aldose Reductase in the Reduction of Glutathionyl-Hydroxynonanal Adduct. Antioxidants 2019, 8, 502. [Google Scholar] [CrossRef] [Green Version]
- Brichac, J.; Ho, K.K.; Honzatko, A.; Wang, R.; Lu, X.; Weiner, H.; Picklo, M.J. Enantioselective Oxidation of Trans -4-Hydroxy-2-Nonenal Is Aldehyde Dehydrogenase Isozyme and Mg2+ Dependent. Chem. Res. Toxicol. 2007, 20, 887–895. [Google Scholar] [CrossRef]
- Balogh, L.M.; Roberts, A.G.; Shireman, L.M.; Greene, R.J.; Atkins, W.M. The Stereochemical Course of 4-Hydroxy-2-Nonenal Metabolism by Glutathione S-Transferases. J. Biol. Chem. 2008, 283, 16702–16710. [Google Scholar] [CrossRef] [PubMed] [Green Version]
- Vermeulen, L.; De Wilde, G.; Notebaert, S.; Vanden Berghe, W.; Haegeman, G. Regulation of the Transcriptional Activity of the Nuclear Factor-ΚB P65 Subunit. Biochem. Pharmacol. 2002, 64, 963–970. [Google Scholar] [CrossRef] [PubMed]
- Chang, K.-C.; Petrash, J.M. Aldo-Keto Reductases: Multifunctional Proteins as Therapeutic Targets in Diabetes and Inflammatory Disease. In Alcohol and Cancer; Vasiliou, V., Zakhari, S., Mishra, L., Seitz, H.K., Eds.; Advances in Experimental Medicine and Biology; Springer International Publishing: Cham, Switzerland, 2018; Volume 1032, pp. 173–202. ISBN 978-3-319-98787-3. [Google Scholar]
- Balestri, F.; Poli, G.; Pineschi, C.; Moschini, R.; Cappiello, M.; Mura, U.; Tuccinardi, T.; Del Corso, A. Aldose Reductase Differential Inhibitors in Green Tea. Biomolecules 2020, 10, 1003. [Google Scholar] [CrossRef]
- Mosmann, T. Rapid Colorimetric Assay for Cellular Growth and Survival: Application to Proliferation and Cytotoxicity Assays. J. Immunol. Methods 1983, 65, 55–63. [Google Scholar] [CrossRef]
- Feoktistova, M.; Geserick, P.; Leverkus, M. Crystal Violet Assay for Determining Viability of Cultured Cells. Cold. Spring Harb. Protoc. 2016, 2016, pdb.prot087379. [Google Scholar] [CrossRef] [PubMed]
- Marini, I.; Bucchioni, L.; Borella, P.; Del Corso, A.; Mura, U. Sorbitol Dehydrogenase from Bovine Lens: Purification and Properties. Arch. Biochem. Biophys. 1997, 340, 383–391. [Google Scholar] [CrossRef] [PubMed]
- Rivero-Gutiérrez, B.; Anzola, A.; Martínez-Augustin, O.; de Medina, F.S. Stain-Free Detection as Loading Control Alternative to Ponceau and Housekeeping Protein Immunodetection in Western Blotting. Anal. Biochem. 2014, 467, 1–3. [Google Scholar] [CrossRef] [Green Version]
- Cappiello, M.; Del Corso, A.; Camici, M.; Mura, U. Thiol and Disulfide Determination by Free Zone Capillar Electrophoresis. J. Biochem. Biophys. Methods 1993, 26, 335–341. [Google Scholar] [CrossRef]
- Bradford, M.M. A Rapid and Sensitive Method for the Quantitation of Microgram Quantities of Protein Utilizing the Principle of Protein-Dye Binding. Anal. Biochem. 1976, 72, 248–254. [Google Scholar] [CrossRef]
- Gérard-Monnier, D.; Erdelmeier, I.; Régnard, K.; Moze-Henry, N.; Yadan, J.-C.; Chaudière, J. Reactions of 1-Methyl-2-Phenylindole with Malondialdehyde and 4-Hydroxyalkenals. Analytical Applications to a Colorimetric Assay of Lipid Peroxidation. Chem. Res. Toxicol. 1998, 11, 1176–1183. [Google Scholar] [CrossRef] [PubMed]
- Misuri, L.; Cappiello, M.; Balestri, F.; Moschini, R.; Barracco, V.; Mura, U.; Del-Corso, A. The Use of Dimethylsulfoxide as a Solvent in Enzyme Inhibition Studies: The Case of Aldose Reductase. J. Enzym. Inhib. Med. Chem. 2017, 32, 1152–1158. [Google Scholar] [CrossRef]
- De Abreu Costa, L.; Henrique Fernandes Ottoni, M.; dos Santos, M.; Meireles, A.; Gomes de Almeida, V.; de Fátima Pereira, W.; Alves de Avelar-Freitas, B.; Eustáquio Alvim Brito-Melo, G. Dimethyl Sulfoxide (DMSO) Decreases Cell Proliferation and TNF-α, IFN-γ, and IL-2 Cytokines Production in Cultures of Peripheral Blood Lymphocytes. Molecules 2017, 22, 1789. [Google Scholar] [CrossRef] [Green Version]
- Elisia, I.; Nakamura, H.; Lam, V.; Hofs, E.; Cederberg, R.; Cait, J.; Hughes, M.R.; Lee, L.; Jia, W.; Adomat, H.H.; et al. DMSO Represses Inflammatory Cytokine Production from Human Blood Cells and Reduces Autoimmune Arthritis. PLoS ONE 2016, 11, e0152538. [Google Scholar] [CrossRef] [Green Version]
- Hayden, M.S.; Ghosh, S. Regulation of NF-ΚB by TNF Family Cytokines. Semin. Immunol. 2014, 26, 253–266. [Google Scholar] [CrossRef] [PubMed] [Green Version]
- Peroni, E.; Scali, V.; Balestri, F.; Cappiello, M.; Mura, U.; Del Corso, A.; Moschini, R. Pathways of 4-Hydroxy-2-Nonenal Detoxification in a Human Astrocytoma Cell Line. Antioxidants 2020, 9, 385. [Google Scholar] [CrossRef]
- Choudhary, S.; Srivastava, S.; Xiao, T.; Andley, U.P.; Srivastava, S.K.; Ansari, N.H. Metabolism of Lipid Derived Aldehyde, 4-Hydroxynonenal in Human Lens Epithelial Cells and Rat Lens. Investig. Ophthalmol. Vis. Sci. 2003, 44, 2675. [Google Scholar] [CrossRef] [PubMed] [Green Version]
- Kumagai, T.; Nakamura, Y.; Osawa, T.; Uchida, K. Role of P38 Mitogen-Activated Protein Kinase in the 4-Hydroxy-2-Nonenal-Induced Cyclooxygenase-2 Expression. Arch. Biochem. Biophys. 2002, 397, 240–245. [Google Scholar] [CrossRef]
- Kumagai, T.; Matsukawa, N.; Kaneko, Y.; Kusumi, Y.; Mitsumata, M.; Uchida, K. A Lipid Peroxidation-Derived Inflammatory Mediator. J. Biol. Chem. 2004, 279, 48389–48396. [Google Scholar] [CrossRef] [Green Version]
- Dou, X.; Li, S.; Wang, Z.; Gu, D.; Shen, C.; Yao, T.; Song, Z. Inhibition of NF-ΚB Activation by 4-Hydroxynonenal Contributes to Liver Injury in a Mouse Model of Alcoholic Liver Disease. Am. J. Pathol. 2012, 181, 1702–1710. [Google Scholar] [CrossRef] [PubMed] [Green Version]
- Pladzyk, A.; Ramana, K.V.; Ansari, N.H.; Srivastava, S.K. Aldose Reductase Prevents Aldehyde Toxicity in Cultured Human Lens Epithelial Cells. Exp. Eye Res. 2006, 83, 408–416. [Google Scholar] [CrossRef]


Disclaimer/Publisher’s Note: The statements, opinions and data contained in all publications are solely those of the individual author(s) and contributor(s) and not of MDPI and/or the editor(s). MDPI and/or the editor(s) disclaim responsibility for any injury to people or property resulting from any ideas, methods, instructions or products referred to in the content. |
© 2023 by the authors. Licensee MDPI, Basel, Switzerland. This article is an open access article distributed under the terms and conditions of the Creative Commons Attribution (CC BY) license (https://creativecommons.org/licenses/by/4.0/).
Share and Cite
Sardelli, G.; Scali, V.; Signore, G.; Balestri, F.; Cappiello, M.; Mura, U.; Del Corso, A.; Moschini, R. Response of a Human Lens Epithelial Cell Line to Hyperglycemic and Oxidative Stress: The Role of Aldose Reductase. Antioxidants 2023, 12, 829. https://doi.org/10.3390/antiox12040829
Sardelli G, Scali V, Signore G, Balestri F, Cappiello M, Mura U, Del Corso A, Moschini R. Response of a Human Lens Epithelial Cell Line to Hyperglycemic and Oxidative Stress: The Role of Aldose Reductase. Antioxidants. 2023; 12(4):829. https://doi.org/10.3390/antiox12040829
Chicago/Turabian StyleSardelli, Gemma, Viola Scali, Giovanni Signore, Francesco Balestri, Mario Cappiello, Umberto Mura, Antonella Del Corso, and Roberta Moschini. 2023. "Response of a Human Lens Epithelial Cell Line to Hyperglycemic and Oxidative Stress: The Role of Aldose Reductase" Antioxidants 12, no. 4: 829. https://doi.org/10.3390/antiox12040829