
Total Flavonoids of Rhizoma Drynariae Mitigates Aflatoxin B1-Induced Liver Toxicity in Chickens via Microbiota-Gut-Liver Axis Interaction Mechanisms
 , , and
Abstract
:
1. Introduction
2. Materials and Methods
2.1. Chemicals
2.2. Animal Care and Experimental Design
2.3. Sample Collection
2.4. Histological Analysis
2.5. Oil Red O Staining for Detection of Liver Lipid Accumulation
2.6. Biochemical Analysis
2.7. Determination of Related Gene Expression Levels
2.8. Western Blot Analysis
2.9. DNA Extraction, Sequencing of the 16S rRNA Gene and Microbiota Data Analysis
2.10. LC-MS/MS Analyses
2.11. Statistical Analysis
3. Results
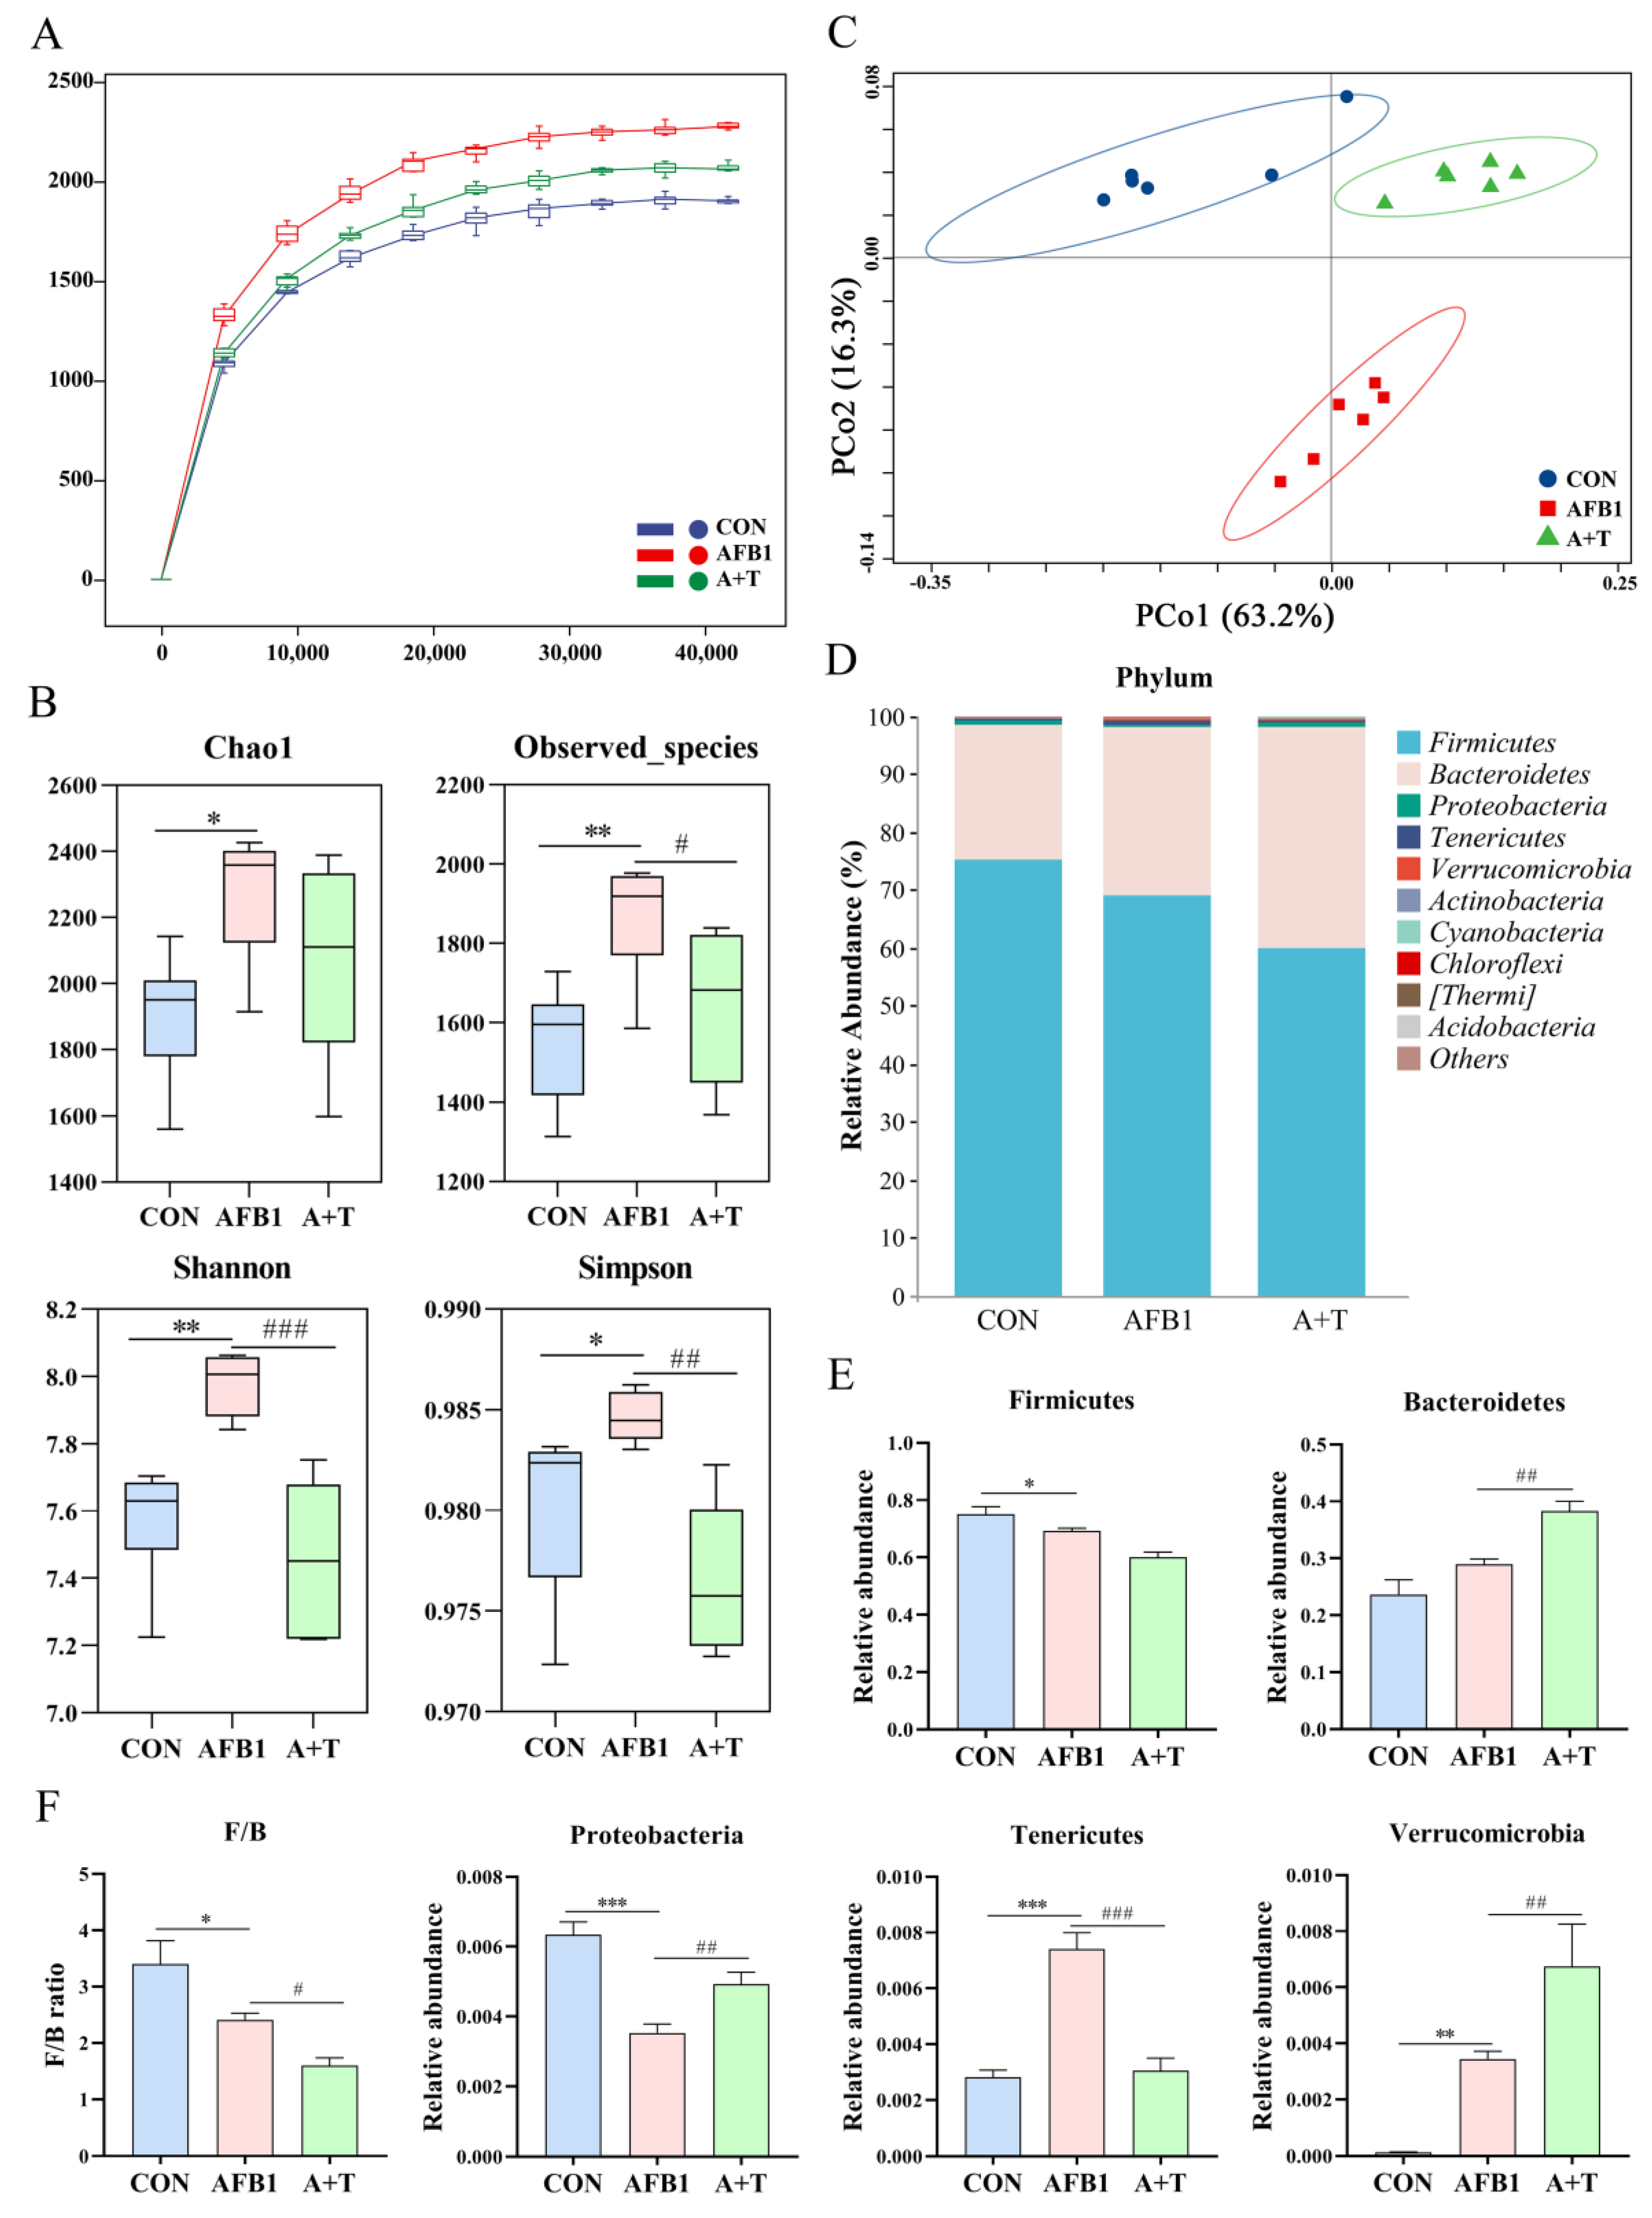
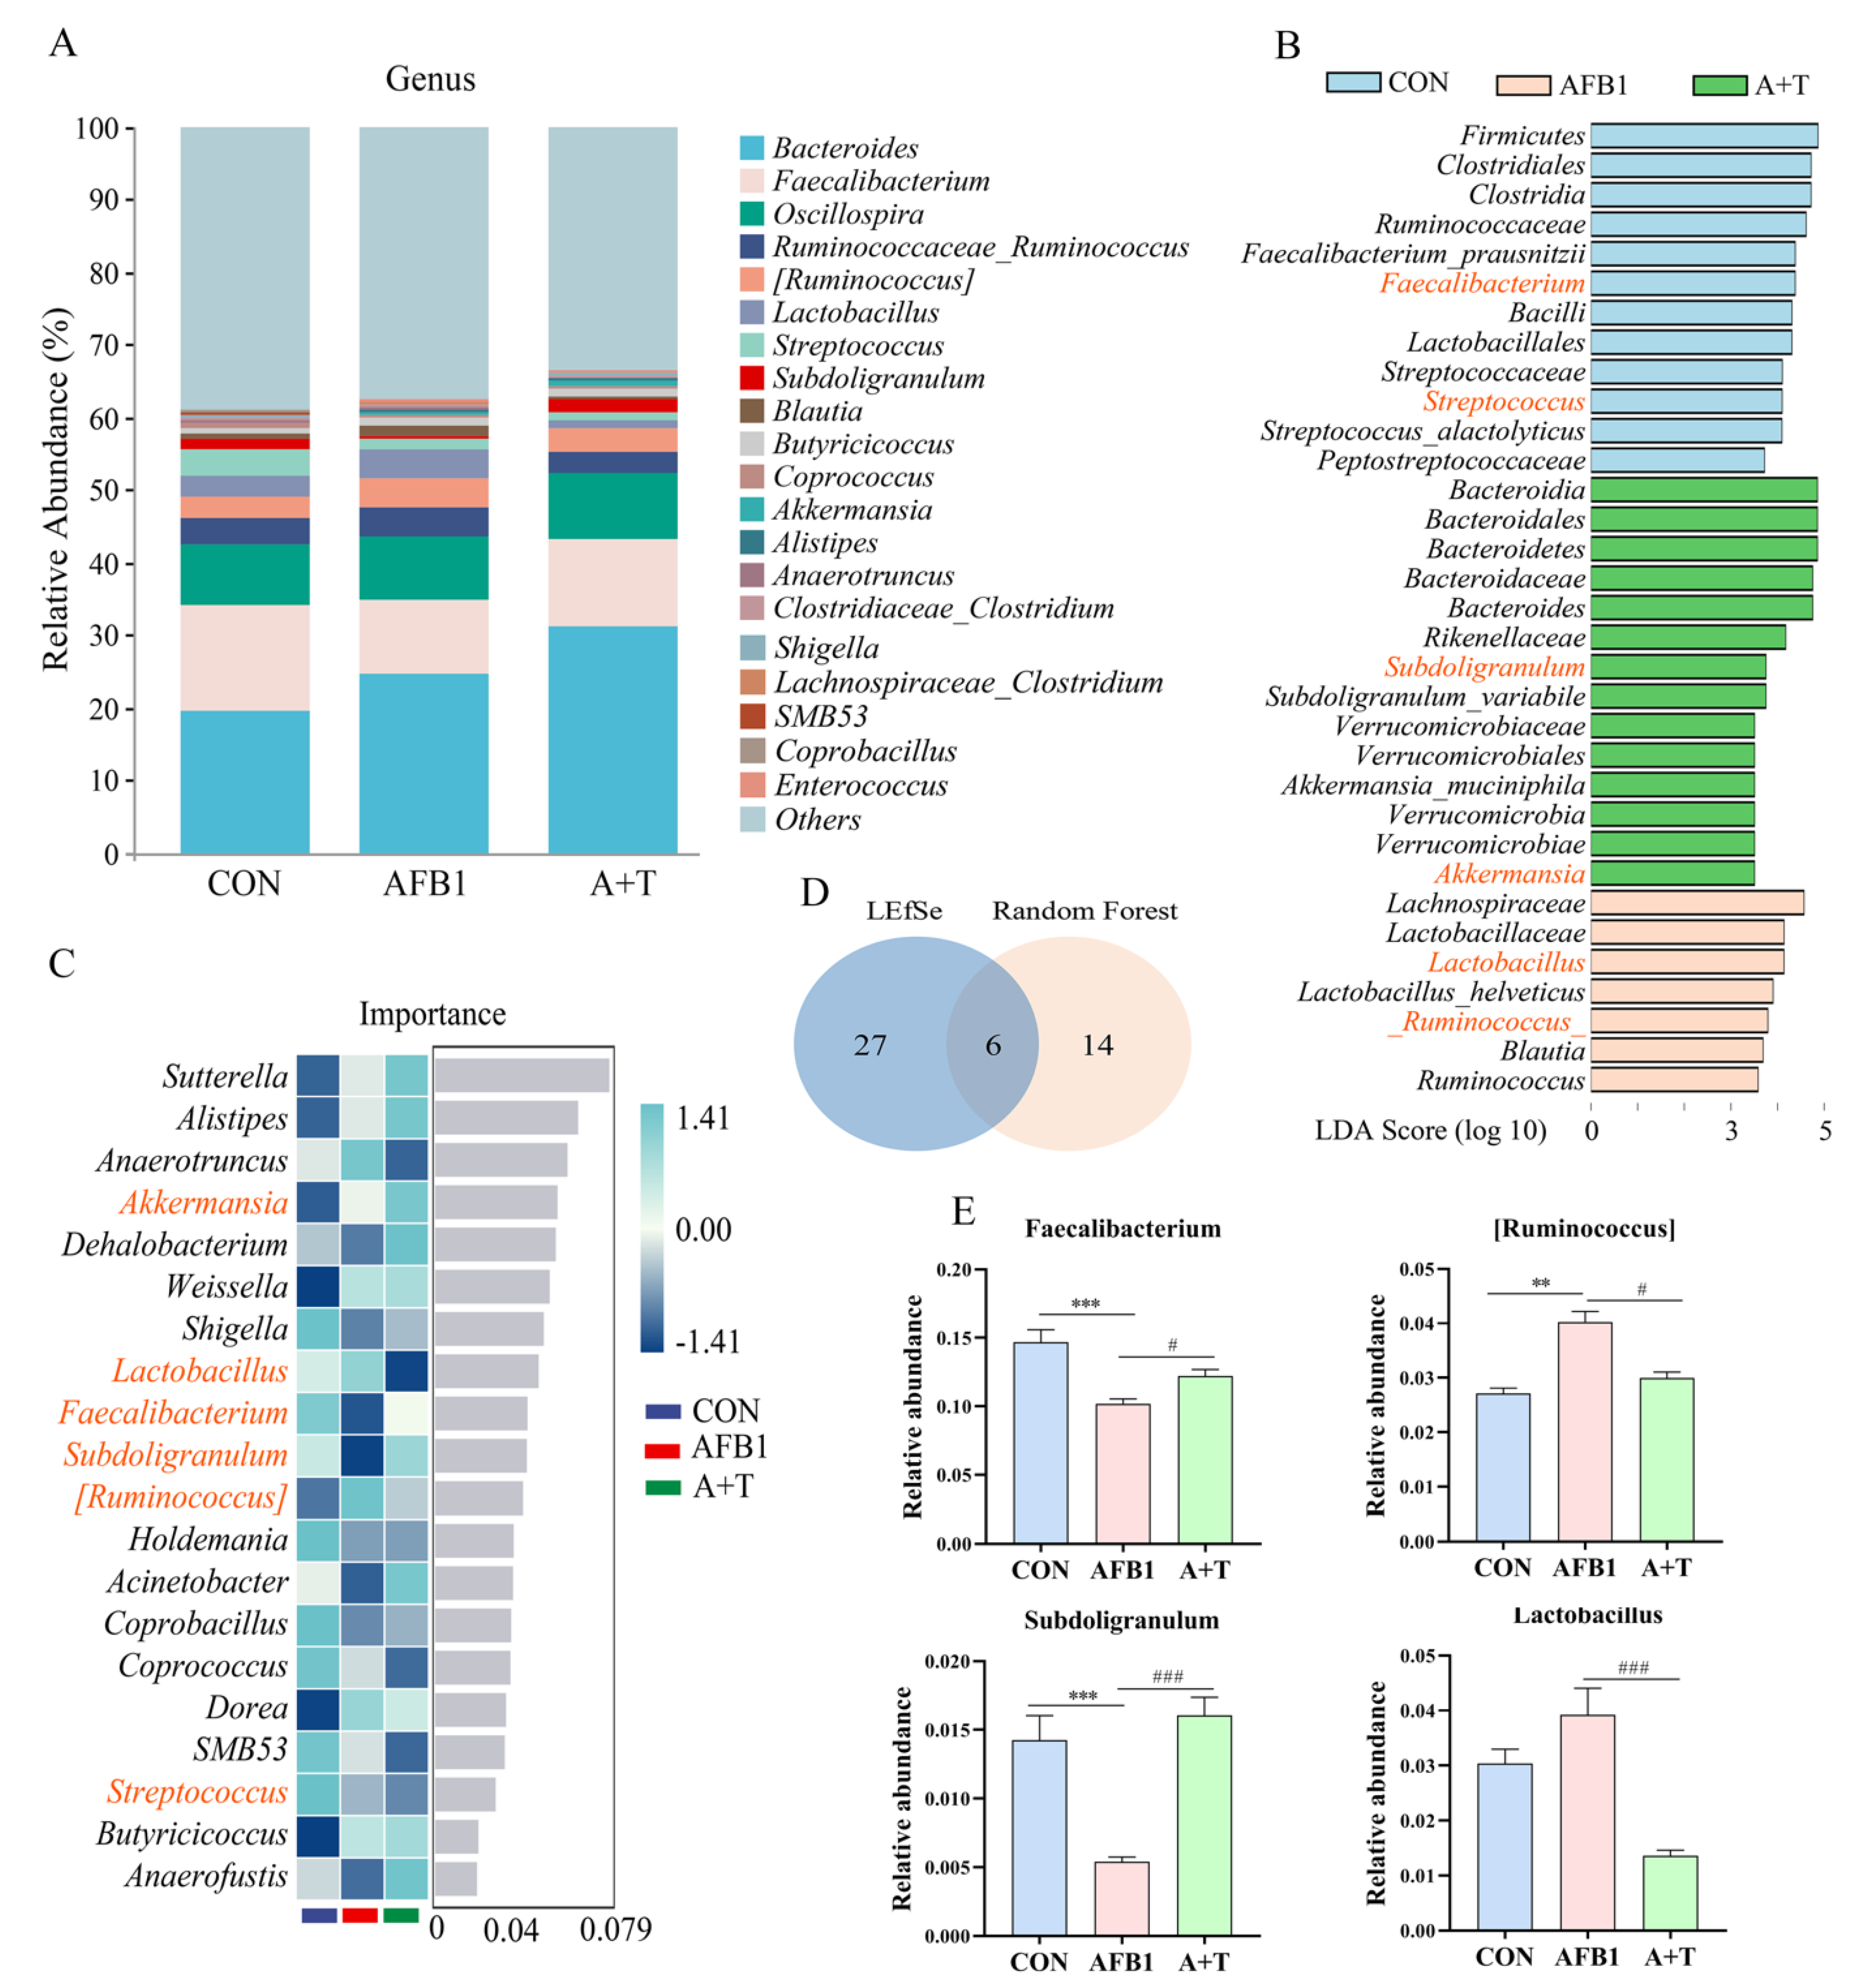
3.1. TFRD Reverses the Alteration of Gut Microbiota Caused by AFB1 Exposure
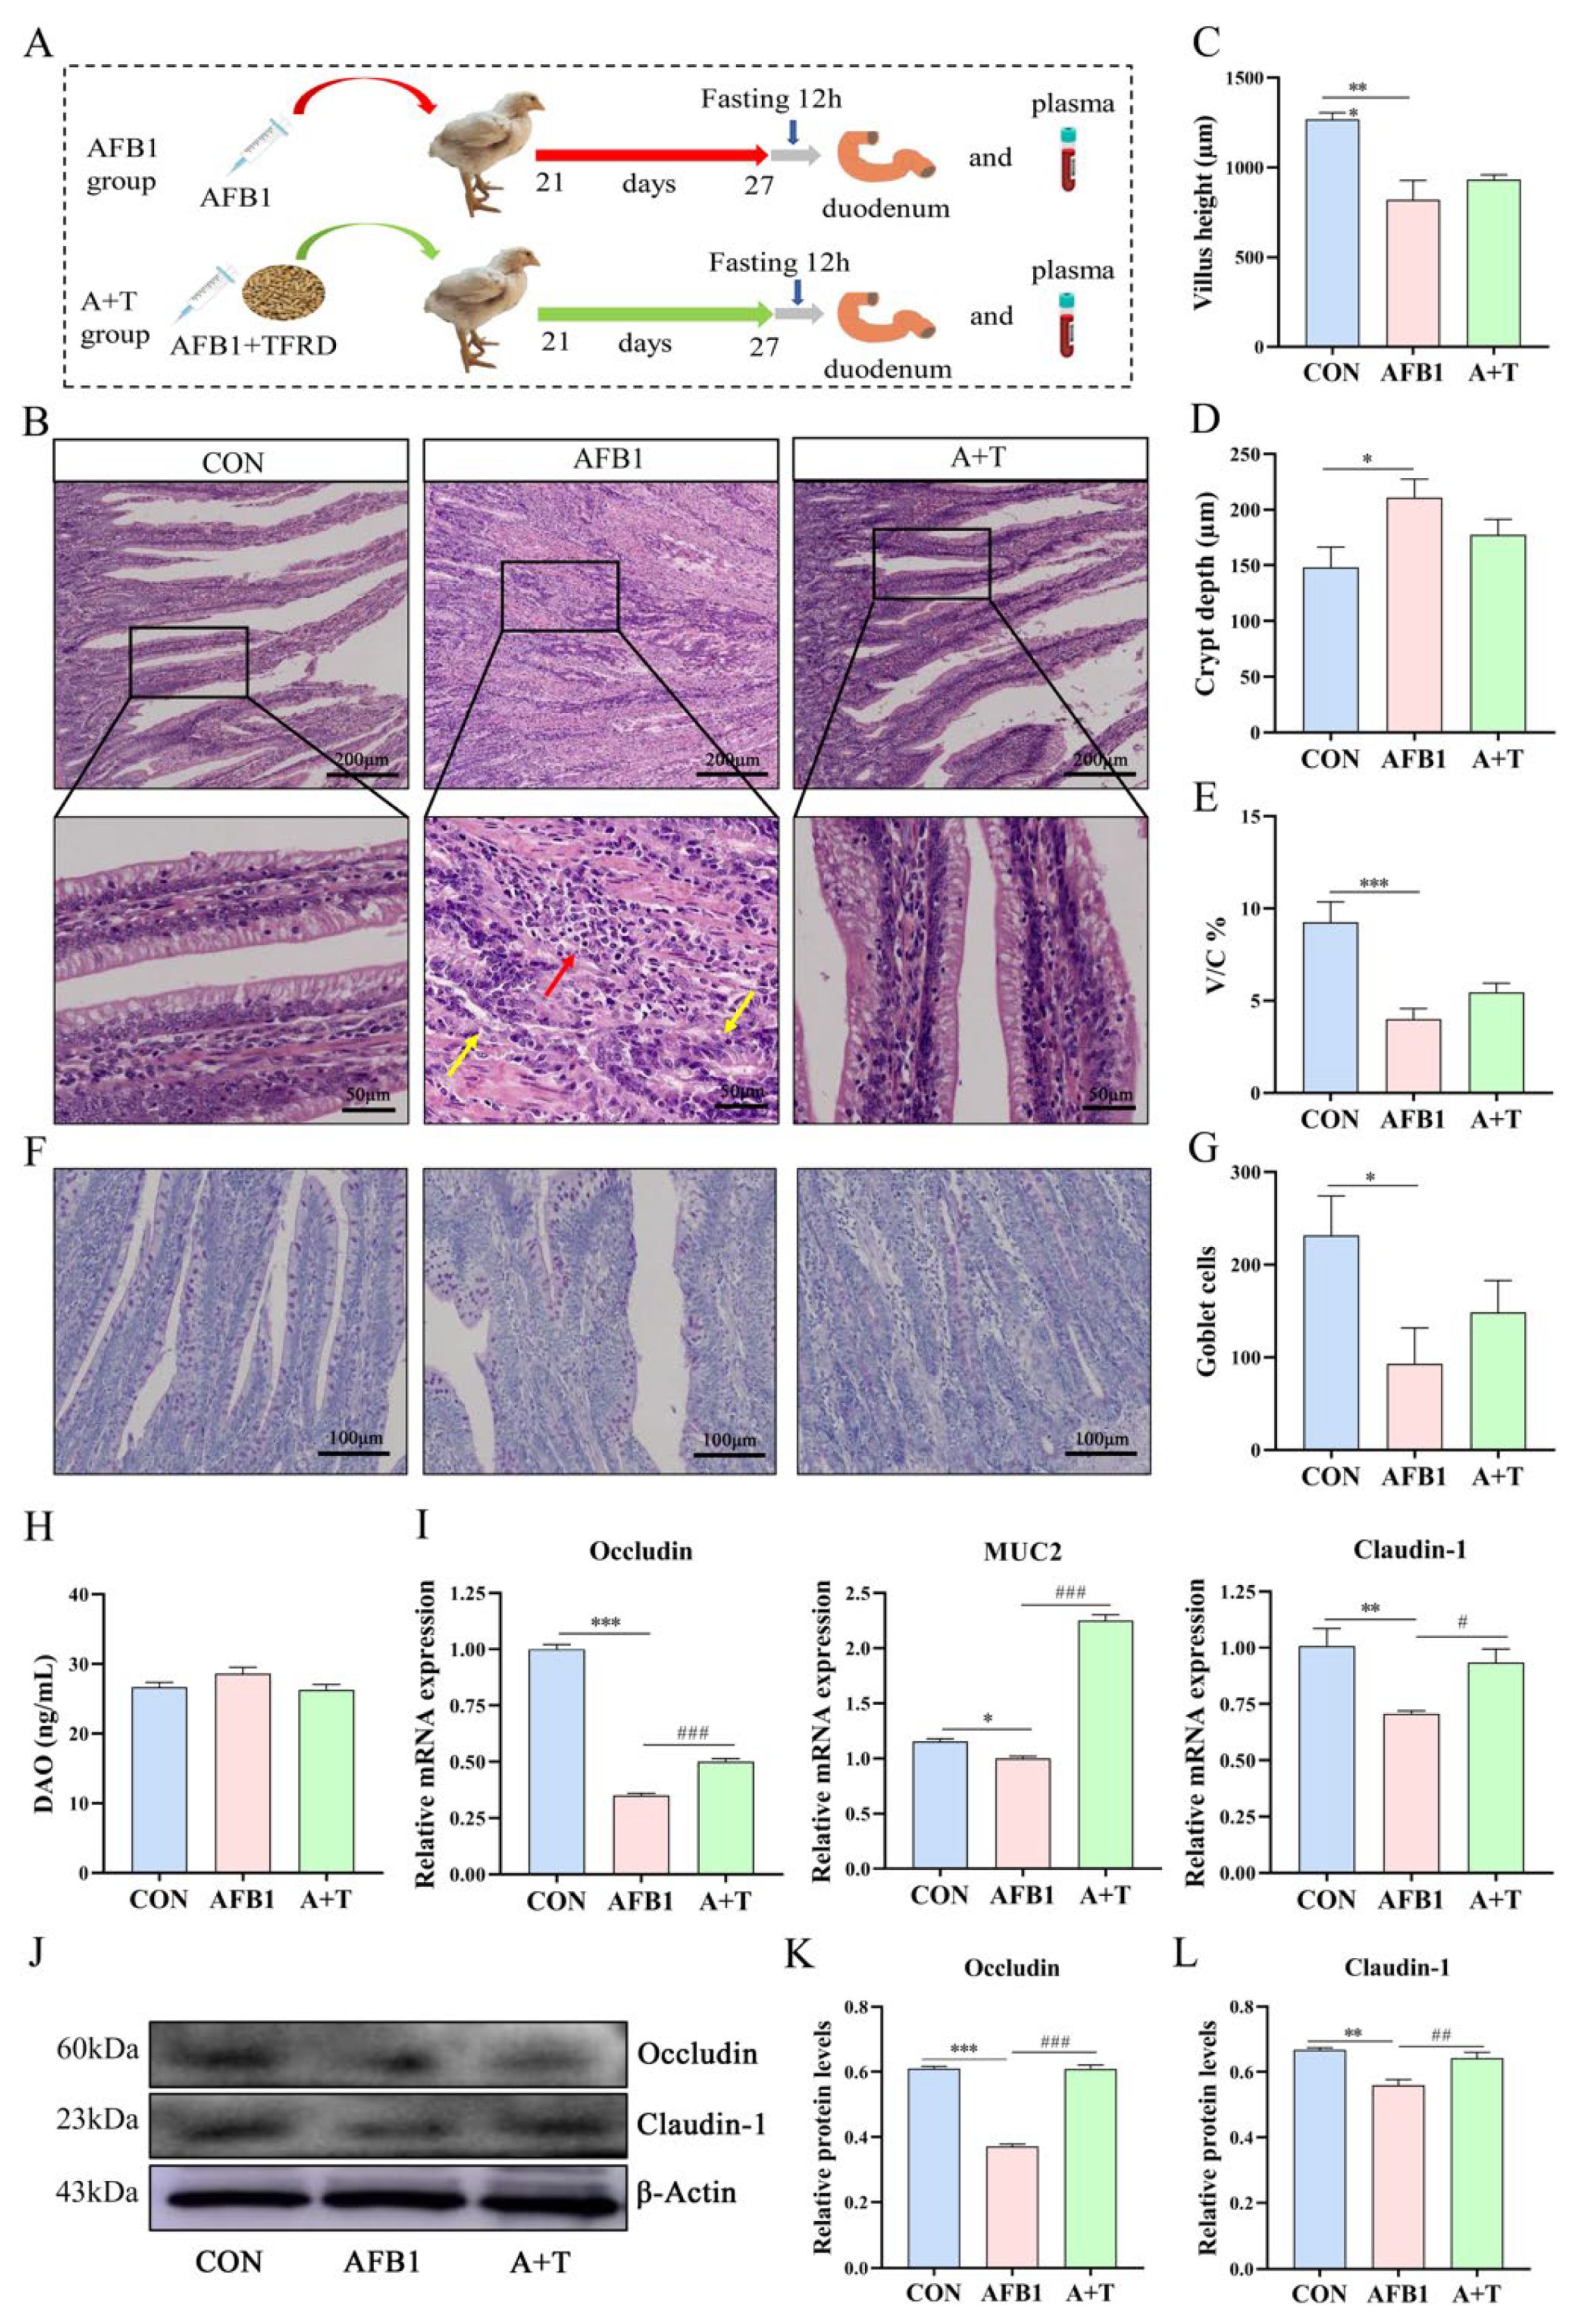
3.2. TFRD Improves the Intestinal Barrier Dysfunction Caused by AFB1 Exposure
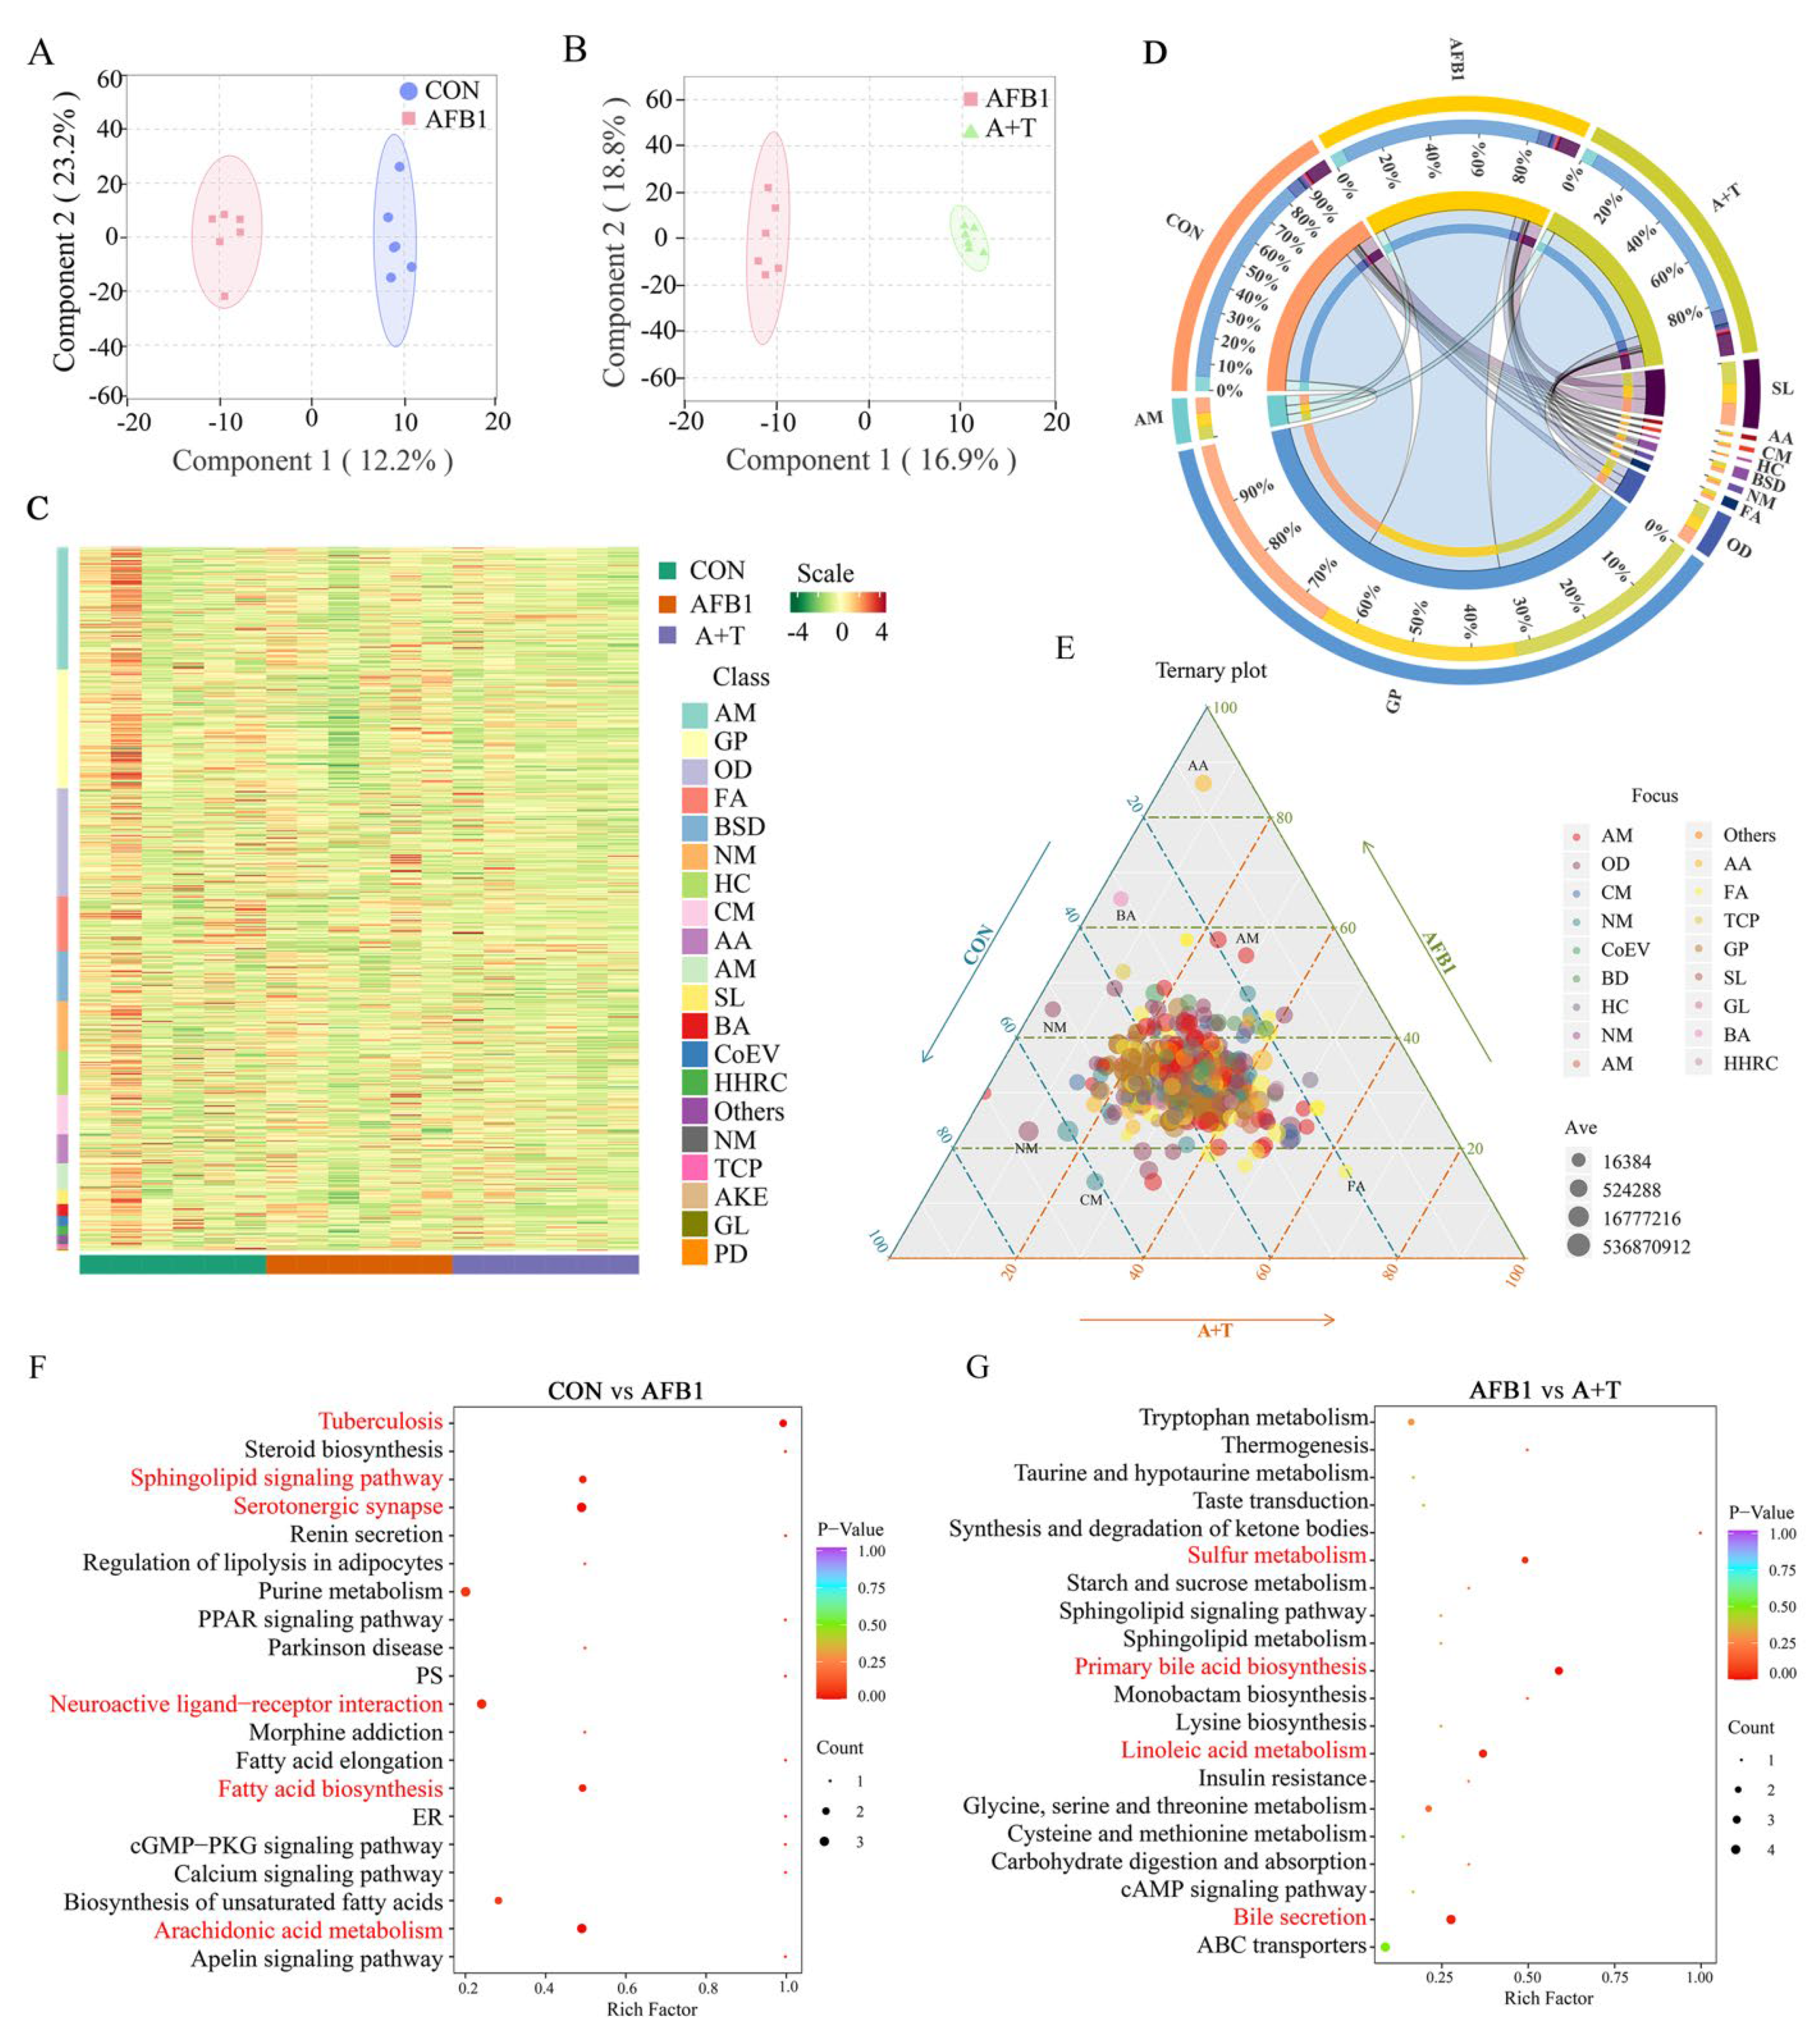
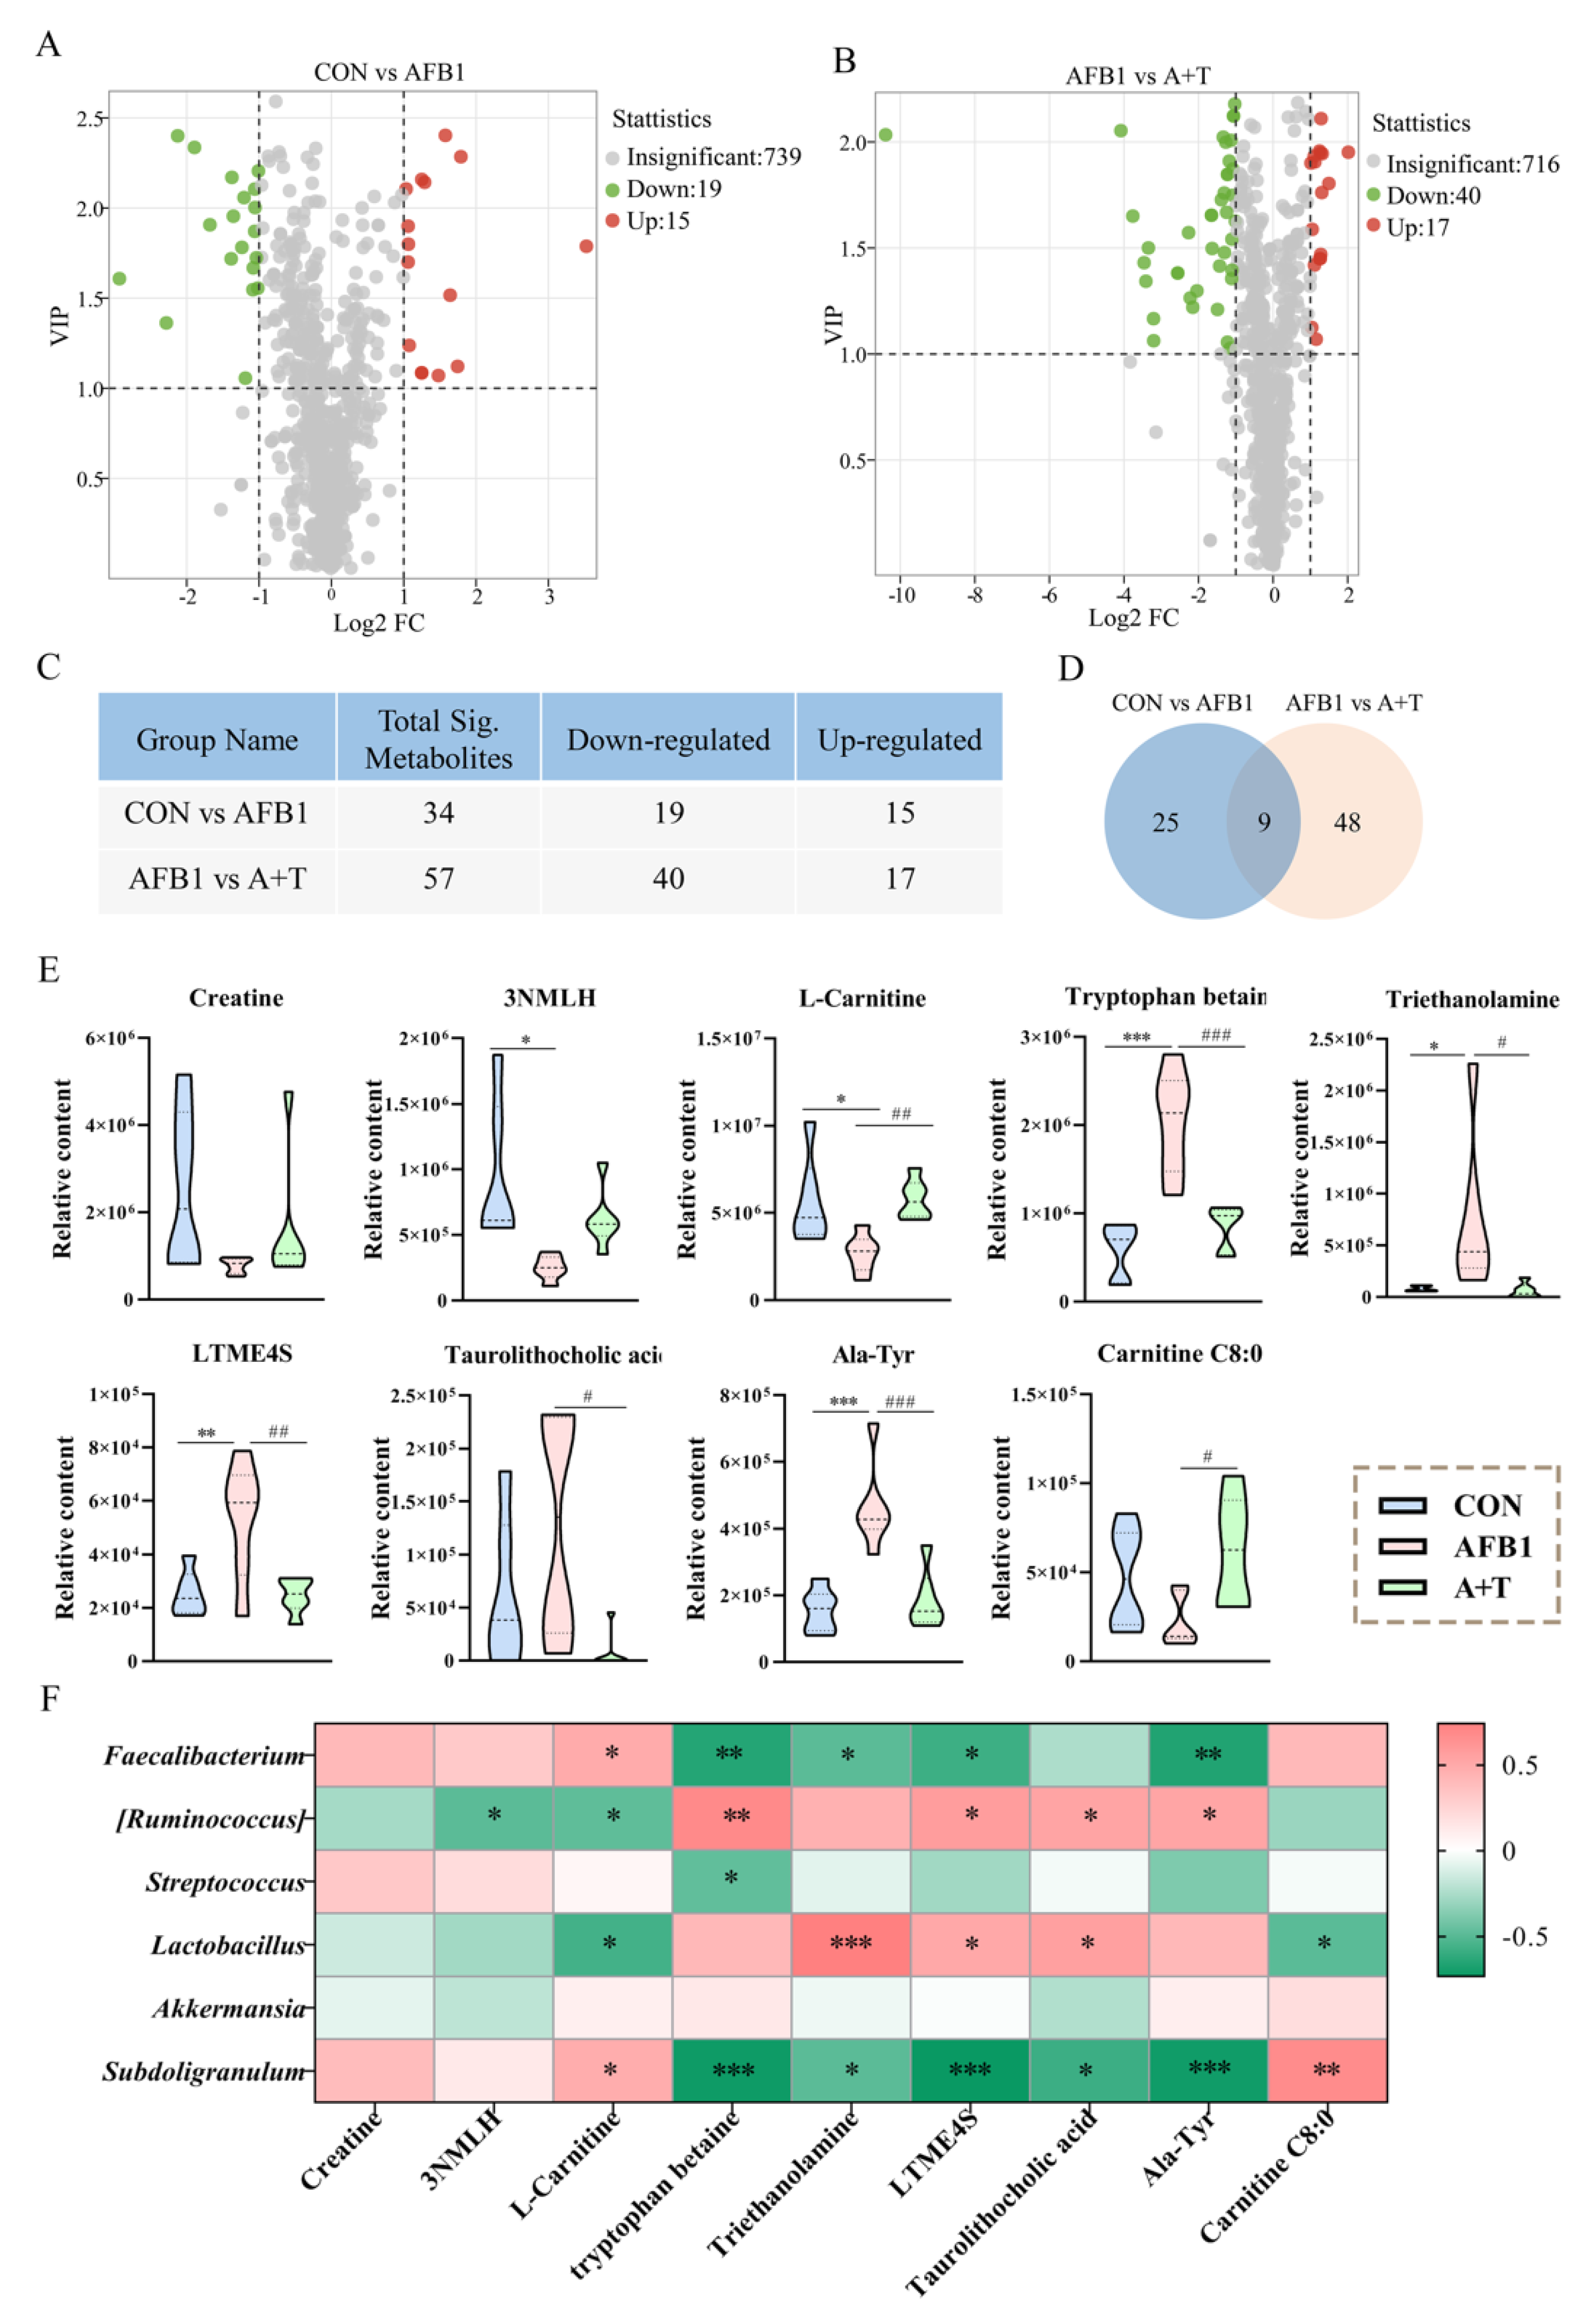
3.3. TFRD Regulates Plasma Metabolism
3.4. TFRD Alleviates AFB1-Induced Liver Injury
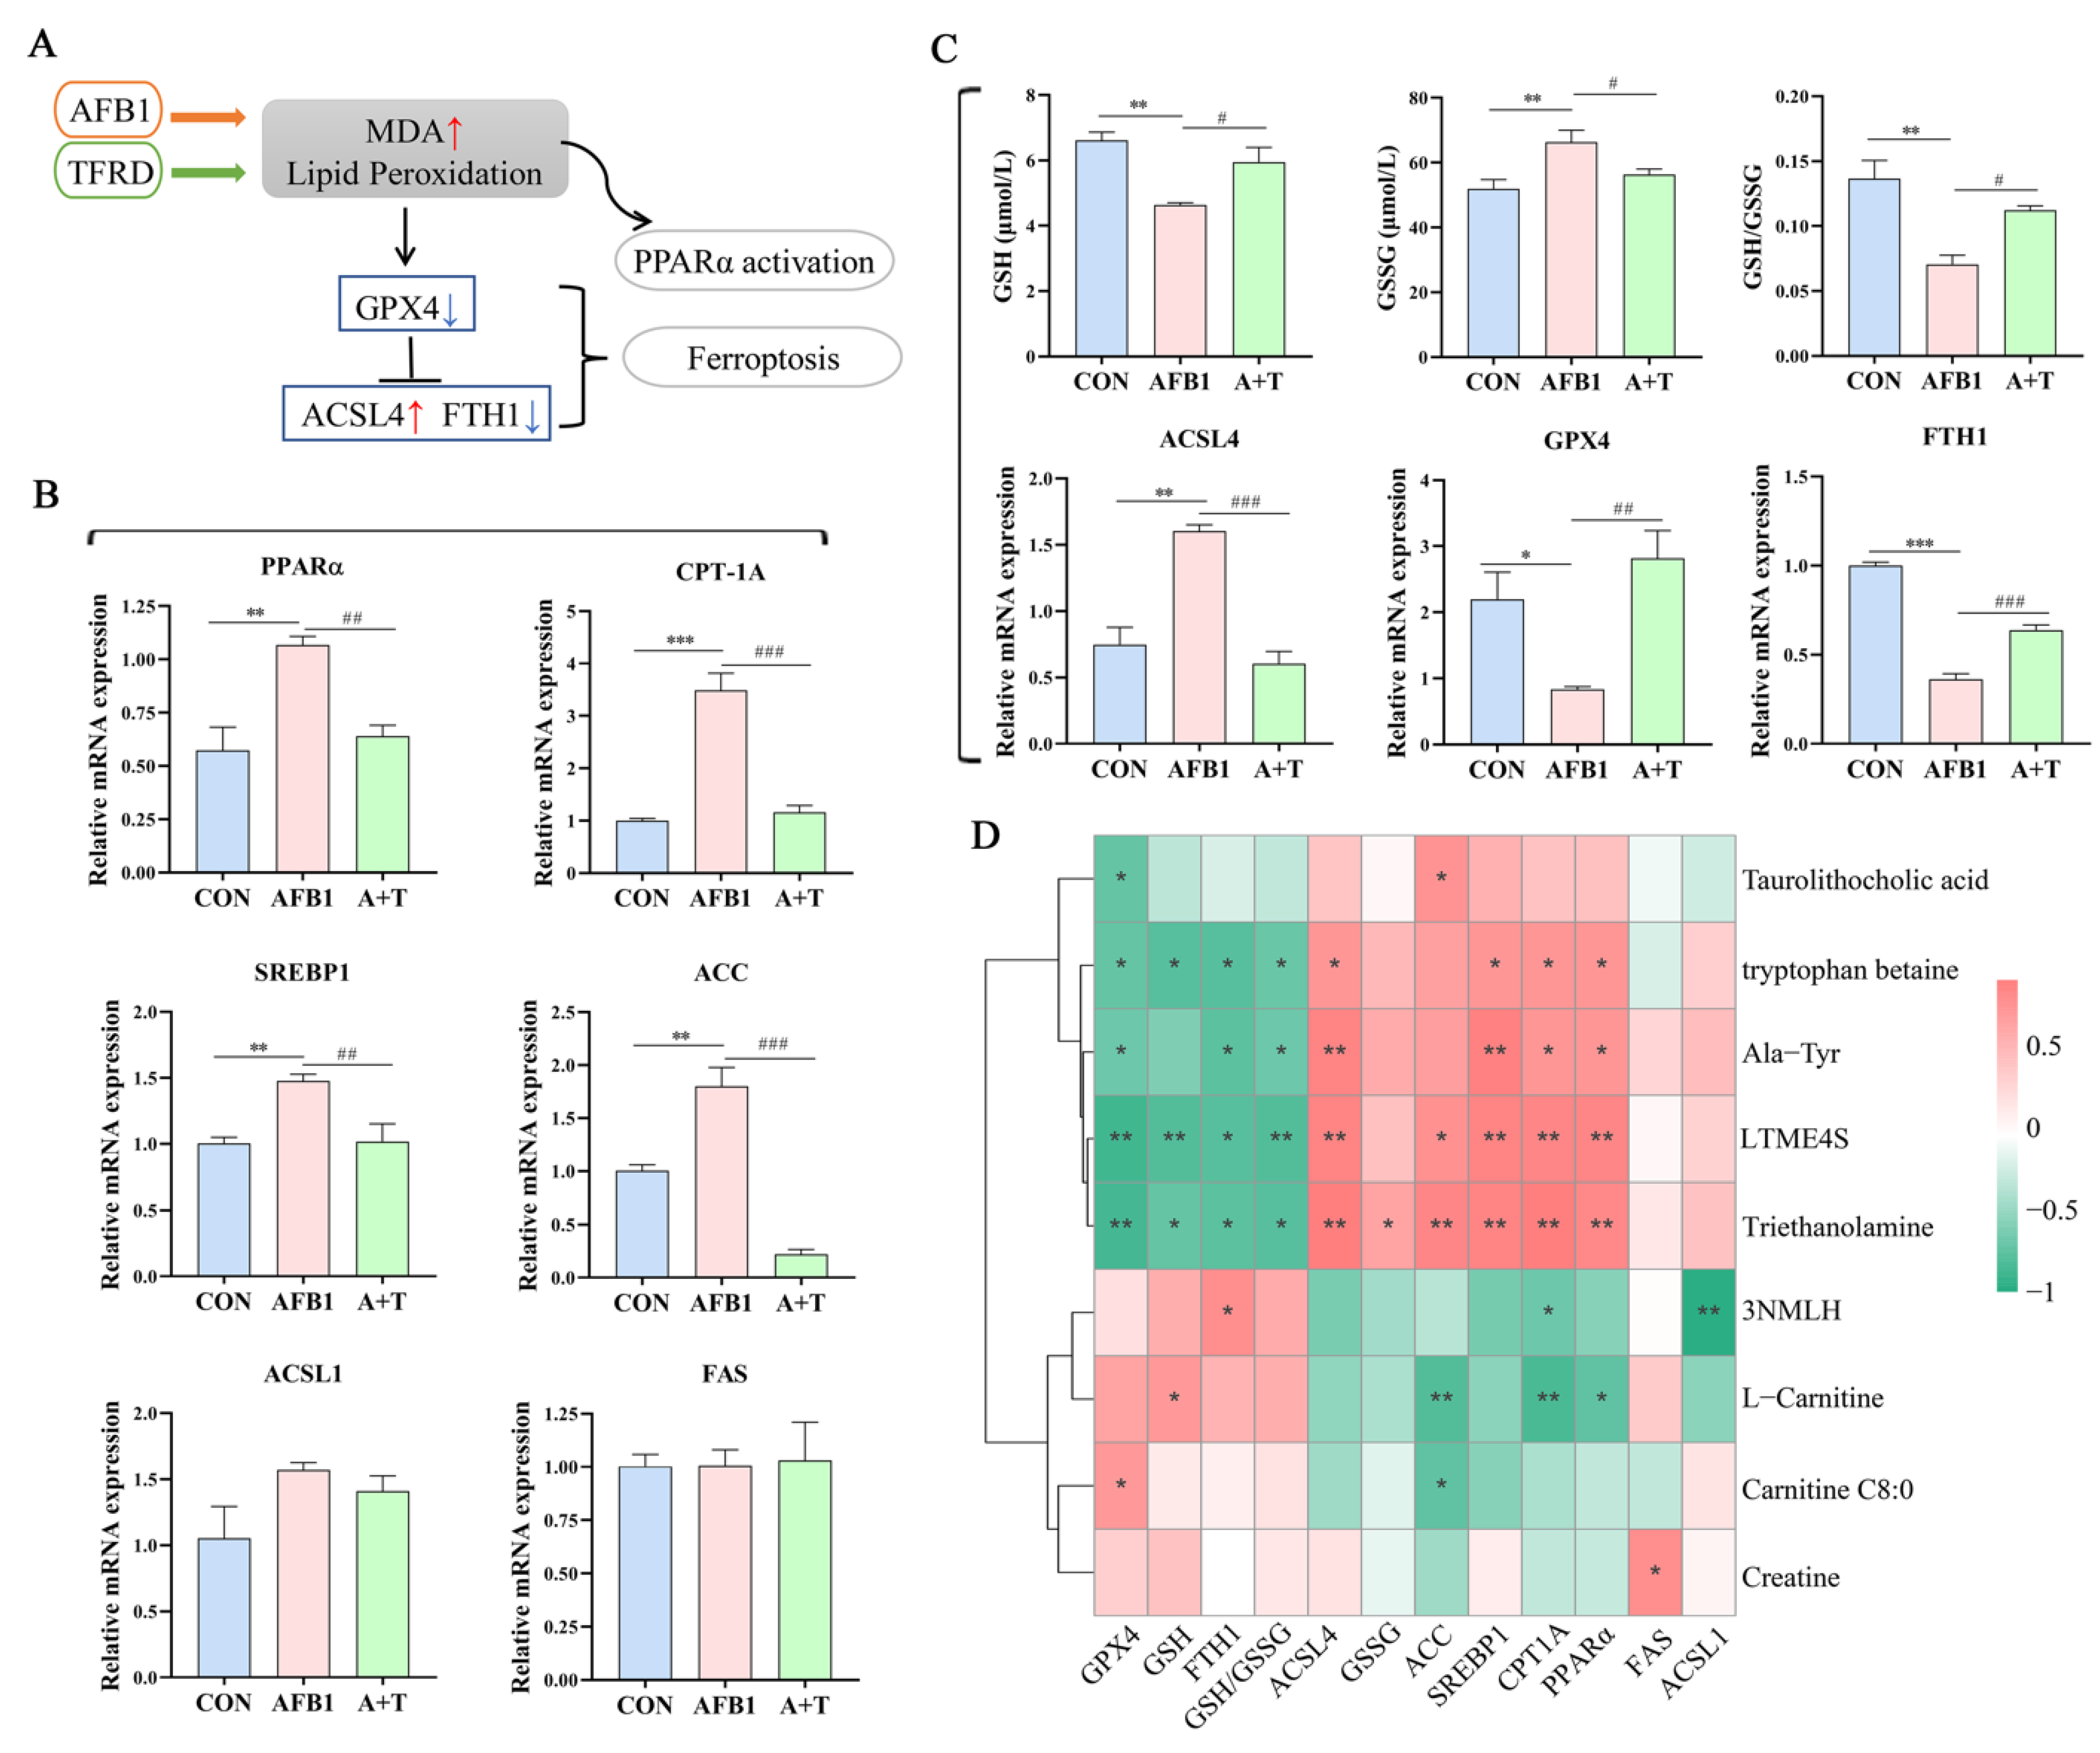
3.5. TFRD Protects against AFB1-Induced Hepatic Ferroptosis and Dyslipidaemia
4. Discussion
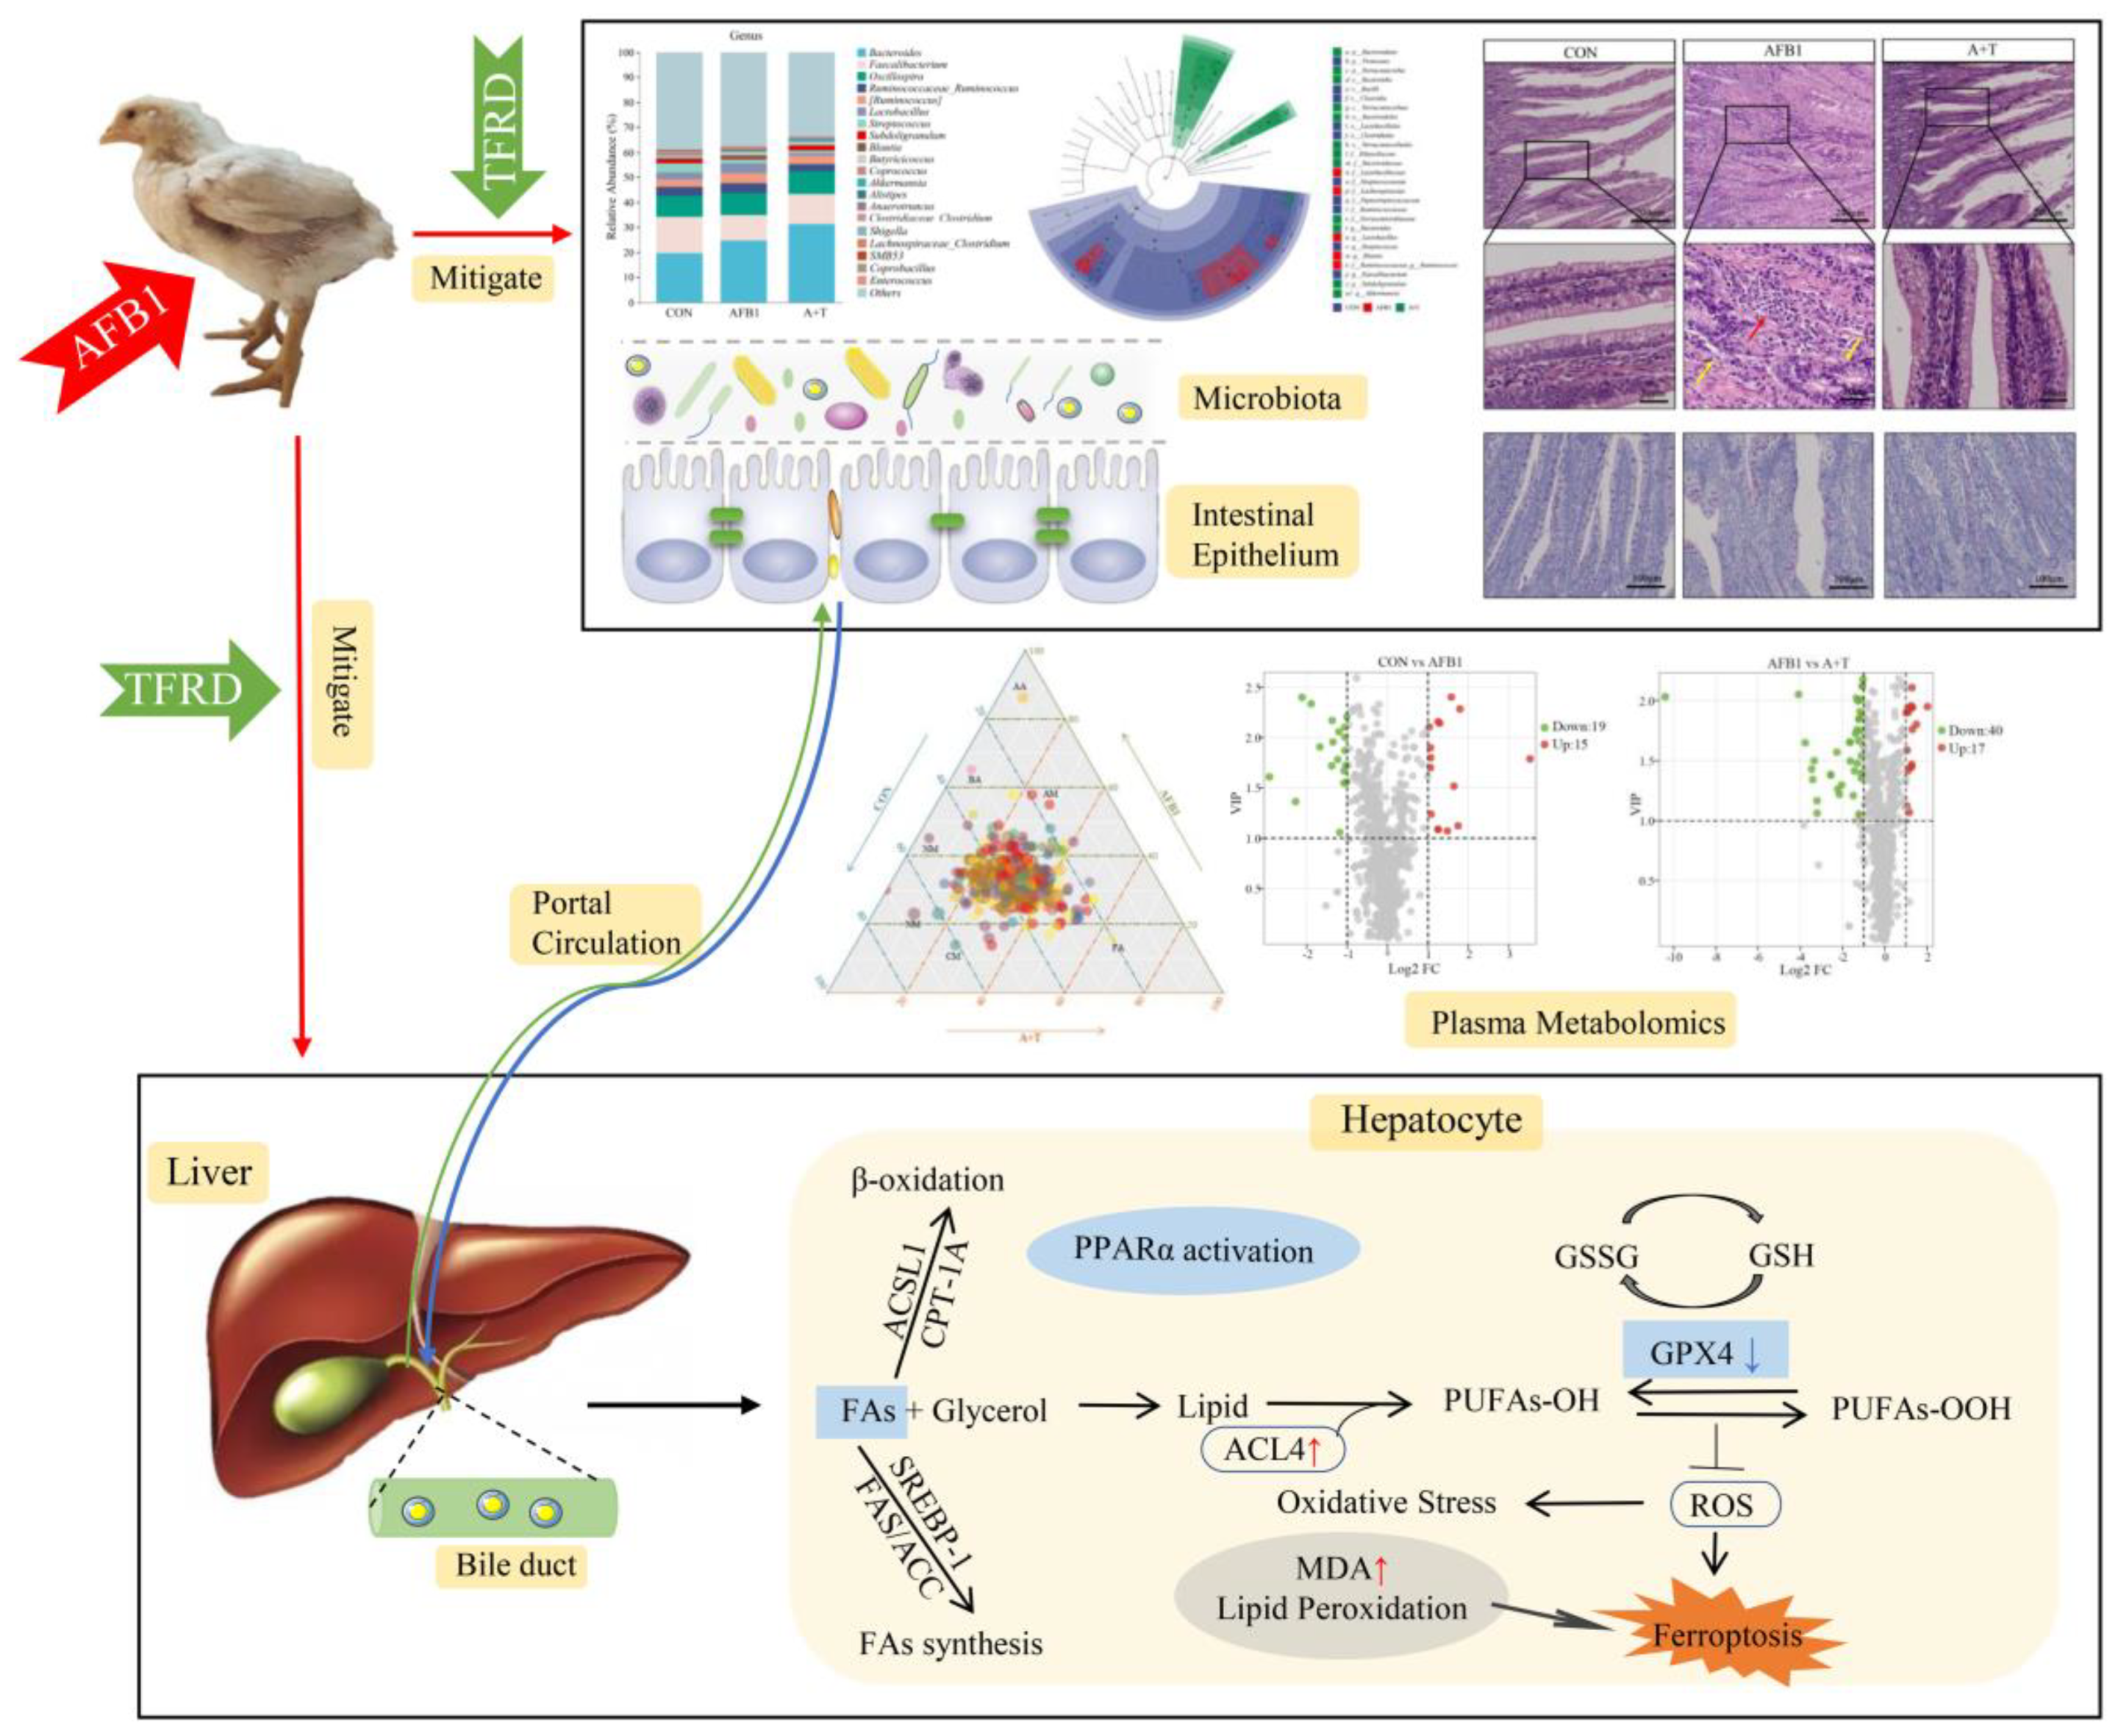
5. Conclusions
Supplementary Materials
Author Contributions
Funding
Institutional Review Board Statement
Informed Consent Statement
Data Availability Statement
Acknowledgments
Conflicts of Interest
References
- Lin, L.; Fu, P.; Chen, N.; Gao, N.; Cao, Q.; Yue, K.; Xu, T.; Zhang, C.; Zhang, C.; Liu, F.; et al. Total flavonoids of Rhizoma Drynariae protect hepatocytes against aflatoxin B1-induced oxidative stress and apoptosis in broiler chickens. Ecotoxicol. Environ. Saf. 2022, 230, 113148. [Google Scholar] [CrossRef]
- Rushing, B.R.; Selim, M.I. Aflatoxin B1: A review on metabolism, toxicity, occurrence in food, occupational exposure, and detoxification methods. Food Chem. Toxicol. 2019, 124, 81–100. [Google Scholar] [CrossRef]
- Zhao, L.; Feng, Y.; Deng, J.; Zhang, N.Y.; Zhang, W.P.; Liu, X.L.; Rajput, S.A.; Qi, D.S.; Sun, L.H. Selenium deficiency aggravates aflatoxin B1-induced immunotoxicity in chick spleen by regulating 6 selenoprotein genes and redox/inflammation/apoptotic signaling. J. Nutr. 2019, 149, 894–901. [Google Scholar] [CrossRef]
- Mughal, M.J.; Peng, X.; Kamboh, A.A.; Zhou, Y.; Fang, J. Aflatoxin B1 induced systemic toxicity in poultry and rescue effects of selenium and zinc. Biol. Trace Elem. Res. 2017, 178, 292–300. [Google Scholar] [CrossRef]
- Yue, K.; Liu, K.-L.; Zhu, Y.-D.; Ding, W.-L.; Xu, B.-W.; Shaukat, A.; He, Y.-F.; Lin, L.-X.; Zhang, C.; Huang, S.-C. Novel Insights into Total Flavonoids of Rhizoma Drynariae against Meat Quality Deterioration Caused by Dietary Aflatoxin B1 Exposure in Chickens. Antioxidants 2022, 12, 83. [Google Scholar] [CrossRef]
- Liu, S.; Kang, W.; Mao, X.; Ge, L.; Du, H.; Li, J.; Hou, L.; Liu, D.; Yin, Y.; Liu, Y.; et al. Melatonin mitigates aflatoxin B1-induced liver injury via modulation of gut microbiota/intestinal FXR/liver TLR4 signaling axis in mice. J. Pineal. Res. 2022, 73, e12812. [Google Scholar] [CrossRef]
- Wang, Q.; Jia, F.; Guo, C.; Wang, Y.; Zhang, X.; Cui, Y.; Song, M.; Cao, Z.; Li, Y. PINK1/Parkin-mediated mitophagy as a protective mechanism against AFB1-induced liver injury in mice. Food Chem. Toxicol. 2022, 164, 113043. [Google Scholar] [CrossRef]
- Sobral, M.M.C.; Gonçalves, T.; Martins, Z.E.; Bäuerl, C.; Cortés-Macías, E.; Collado, M.C.; Ferreira, I.M.P.L.V.O. Mycotoxin Interactions along the Gastrointestinal Tract: In Vitro Semi-Dynamic Digestion and Static Colonic Fermentation of a Contaminated Meal. Toxins 2022, 14, 28. [Google Scholar] [CrossRef]
- Tyszka, M.; Biliński, J.; Basak, G.W. Advances in intestinal barrier preservation and restoration in the allogeneic hematopoietic cell transplantation setting. J. Clin. Med. 2021, 10, 2508. [Google Scholar] [CrossRef]
- Vancamelbeke, M.; Vermeire, S. The intestinal barrier: A fundamental role in health and disease. Expert Rev. Gastroenterol. Hepatol. 2017, 11, 821–834. [Google Scholar] [CrossRef]
- Cao, Q.-Q.; Lin, L.-X.; Xu, T.-T.; Lu, Y.; Zhang, C.-D.; Yue, K.; Huang, S.-C.; Dong, H.-J.; Jian, F.-C. Aflatoxin B1 alters meat quality associated with oxidative stress, inflammation, and gut-microbiota in sheep. Ecotoxicol. Environ. Saf. 2021, 225, 112754. [Google Scholar] [CrossRef]
- Gao, Y.; Bao, X.; Meng, L.; Liu, H.; Wang, J.; Zheng, N. Aflatoxin B1 and aflatoxin M1 induce compromised intestinal integrity through clathrin-mediated endocytosis. Toxins 2021, 13, 184. [Google Scholar] [CrossRef]
- Valdes, A.M.; Walter, J.; Segal, E.; Spector, T.D. Role of the gut microbiota in nutrition and health. BMJ 2018, 361, k2179. [Google Scholar] [CrossRef] [Green Version]
- Guerre, P. Mycotoxin and gut microbiota interactions. Toxins 2020, 12, 769. [Google Scholar] [CrossRef]
- Xia, D.; Yang, L.; Li, Y.; Chen, J.; Zhang, X.; Wang, H.; Zhai, S.; Jiang, X.; Meca, G.; Wang, S.; et al. Melatonin alleviates ochratoxin A-induced liver inflammation involved intestinal microbiota homeostasis and microbiota-independent manner. J. Hazard. Mater. 2021, 413, 125239. [Google Scholar] [CrossRef]
- Pauletto, M.; Giantin, M.; Tolosi, R.; Bassan, I.; Barbarossa, A.; Zaghini, A.; Dacasto, M. Curcumin mitigates AFB1-induced hepatic toxicity by triggering cattle antioxidant and anti-inflammatory pathways: A whole transcriptomic in vitro study. Antioxidants 2020, 9, 1059. [Google Scholar] [CrossRef]
- Zhang, Q.; Feng, Z.; Lu, J.; Lu, J.; Guan, S.; Chen, Y. Aflatoxin B1 inhibited autophagy flux by inducing lysosomal alkalinization in HepG2 cells. Toxicol. Mech. Methods. 2021, 31, 450–456. [Google Scholar] [CrossRef]
- Choi, S.-Y.; Kim, T.H.; Hong, M.-W.; Park, T.S.; Lee, H.; Lee, S.-J. Transcriptomic alterations induced by aflatoxin B1 and ochratoxin A in LMH cell line. Poult. Sci. 2020, 99, 5265–5274. [Google Scholar] [CrossRef]
- Gao, M.; Monian, P.; Quadri, N.; Ramasamy, R.; Jiang, X. Glutaminolysis and transferrin regulate ferroptosis. Mol. Cell 2015, 59, 298–308. [Google Scholar] [CrossRef] [Green Version]
- Gao, M.; Yi, J.; Zhu, J.; Minikes, A.M.; Monian, P.; Thompson, C.B.; Jiang, X. Role of mitochondria in ferroptosis. Mol. Cell 2019, 73, 354–363.e3. [Google Scholar] [CrossRef] [Green Version]
- Zhang, X.; Li, X. Abnormal iron and lipid metabolism mediated ferroptosis in kidney diseases and its therapeutic potential. Metabolites 2022, 12, 58. [Google Scholar] [CrossRef]
- Zhao, L.; Feng, Y.; Xu, Z.-J.; Zhang, N.-Y.; Zhang, W.-P.; Zuo, G.; Khalil, M.M.; Sun, L.-H. Selenium mitigated aflatoxin B1-induced cardiotoxicity with potential regulation of 4 selenoproteins and ferroptosis signaling in chicks. Food Chem. Toxicol. 2021, 154, 112320. [Google Scholar] [CrossRef]
- Jiang, X.; Stockwell, B.R.; Conrad, M. Ferroptosis: Mechanisms, biology and role in disease. Nat. Rev. Mol. Cell Biol. 2021, 22, 266–282. [Google Scholar] [CrossRef]
- Wu, L.; Tian, X.; Zuo, H.; Zheng, W.; Li, X.; Yuan, M.; Tian, X.; Song, H. miR-124-3p delivered by exosomes from heme oxygenase-1 modified bone marrow mesenchymal stem cells inhibits ferroptosis to attenuate ischemia-reperfusion injury in steatotic grafts. J. Nanobiotechnol. 2022, 20, 196. [Google Scholar] [CrossRef]
- Wu, Y.; Jiao, H.; Yue, Y.; He, K.; Jin, Y.; Zhang, J.; Zhang, J.; Wei, Y.; Luo, H.; Hao, Z.; et al. Ubiquitin ligase E3 HUWE1/MULE targets transferrin receptor for degradation and suppresses ferroptosis in acute liver injury. Cell Death Differ. 2022, 29, 1705–1718. [Google Scholar] [CrossRef]
- Bougarne, N.; Weyers, B.; Desmet, S.J.; Deckers, J.; Ray, D.W.; Staels, B.; De Bosscher, K. Molecular actions of PPARα in lipid metabolism and inflammation. Endocr. Rev. 2018, 39, 760–802. [Google Scholar] [CrossRef] [Green Version]
- Liu, L.; Xu, X.; Cheng, D.; Yao, X.; Pan, S. Structure-activity relationship of citrus polymethoxylated flavones and their inhibitory effects on aspergillus niger. J. Agric. Food Chem. 2012, 60, 4336–4341. [Google Scholar] [CrossRef]
- Wang, Y.; Gao, H.; Xie, J.; Li, X.; Huang, Z. Effects of some flavonoids on the mycotoxin citrinin reduction by Monascus aurantiacus Li AS3.4384 during liquid-state fermentation. AMB Express 2020, 10, 26. [Google Scholar] [CrossRef]
- Xu, T.; Zheng, J.; Jin, W.; Li, L.; Lin, L.; Shaukat, A.; Zhang, C.; Cao, Q.; Ashraf, M.; Huang, S. Total Flavonoids of Rhizoma Drynariae ameliorate bone growth in experimentally induced tibial dyschondroplasia in chickens via regulation of OPG/RANKL axis. Front. Pharmacol. 2022, 13, 881057. [Google Scholar]
- Xu, T.T.; Chen, P.; Zhang, C.D.; Shaukat, A.; Lin, L.X.; Yue, K.; Ding, W.L.; Tong, X.; Liu, K.L.; He, Y.F.; et al. Gut microbiome dysregulation drives bone damage in broiler tibial dyschondroplasia by disrupting glucose homeostasis. NPJ Biofilms Microbiomes 2023, 9, 1. [Google Scholar] [CrossRef]
- Huang, S.; Zhang, C.; Xu, T.; Shaukat, A.; He, Y.; Chen, P.; Lin, L.; Yue, K.; Cao, Q.; Tong, X. Integrated fecal microbiome and metabolomics reveals a novel potential biomarker for predicting tibial dyschondroplasia in chickens. Front. Physiol. 2022, 13, 887207. [Google Scholar] [CrossRef]
- Engin, A.B.; Engin, A. DNA damage checkpoint response to aflatoxin B1. Environ. Toxicol. Pharmacol. 2018, 65, 90–96. [Google Scholar] [CrossRef]
- Sayin, S.I.; Wahlström, A.; Felin, J.; Jäntti, S.; Marschall, H.U.; Bamberg, K.; Angelin, B.; Hyötyläinen, T.; Orešič, M.; Bäckhed, F. Gut microbiota regulates bile acid metabolism by reducing the levels of tauro-beta-muricholic acid, a naturally occurring FXR antagonist. Cell Metab. 2013, 17, 225–235. [Google Scholar] [CrossRef] [Green Version]
- Chen, J.; Thomsen, M.; Vitetta, L. Interaction of gut microbiota with dysregulation of bile acids in the pathogenesis of nonalcoholic fatty liver disease and potential therapeutic implications of probiotics. J. Cell Biochem. 2019, 120, 2713–2720. [Google Scholar] [CrossRef]
- Zhu, J.; Xiong, Y.; Zhang, Y.; Wen, J.; Cai, N.; Cheng, K.; Liang, H.; Zhang, W. The molecular mechanisms of regulating oxidative stress-induced ferroptosis and therapeutic strategy in tumors. Oxidative Med. Cell. Longev. 2020, 2020, 8810785. [Google Scholar] [CrossRef]
- Li, S.; Liu, R.; Wei, G.; Guo, G.; Yu, H.; Zhang, Y.; Ishfaq, M.; Fazilani, S.A.; Zhang, X. Curcumin protects against aflatoxin B1-induced liver injury in broilers via the modulation of long non-coding RNA expression. Ecotoxicol. Environ. Saf. 2021, 208, 111725. [Google Scholar] [CrossRef]
- Barcelos, G.R.M.; Grotto, D.; Angeli, J.P.F.; Serpeloni, J.M.; Rocha, B.A.; Bastos, J.K.; Barbosa, F., Jr. Evaluation of antigenotoxic effects of plant flavonoids quercetin and rutin on HepG2 cells. Phytother. Res. 2011, 25, 1381–1388. [Google Scholar] [CrossRef]
- Ma, X.; Sun, J.; Ye, Y.; Ji, J.; Sun, X. Application of triple co-cultured cell spheroid model for exploring hepatotoxicity and metabolic pathway of AFB1. Sci. Total Environ. 2022, 807 Pt 1, 150840. [Google Scholar] [CrossRef]
- Wittig, B.M.; Zeitz, M. The gut as an organ of immunology. Int. J. Color. Dis. 2003, 18, 181–187. [Google Scholar] [CrossRef]
- Gwak, M.-G.; Chang, S.-Y. Gut-brain connection: Microbiome, gut barrier, and environmental sensors. Immune Netw. 2021, 21, e20. [Google Scholar] [CrossRef]
- Yang, J.; Wu, J.; Li, Y.; Zhang, Y.; Cho, W.C.; Ju, X.; van Schothorst, E.M.; Zheng, Y. Gut bacteria formation and influencing factors. FEMS Microbiol. Ecol. 2021, 97, fiab043. [Google Scholar] [CrossRef]
- Chen, J.; Lv, Z.; Cheng, Z.; Wang, T.; Li, P.; Wu, A.; Nepovimova, E.; Long, M.; Wu, W.; Kuca, K. Bacillus amyloliquefaciens B10 inhibits aflatoxin B1-induced cecal inflammation in mice by regulating their intestinal flora. Food Chem. Toxicol. 2021, 156, 112438. [Google Scholar] [CrossRef]
- Li, Z.; Wang, W.; Liu, D.; Guo, Y. Effects of Lactobacillus acidophilus on the growth performance and intestinal health of broilers challenged with Clostridium perfringens. J. Anim. Sci. Biotechnol. 2018, 9, 25. [Google Scholar] [CrossRef] [Green Version]
- Khare, A.; Gaur, S. Cholesterol-lowering effects of Lactobacillus species. Curr. Microbiol. 2020, 77, 638–644. [Google Scholar] [CrossRef]
- An, J.; Liu, Y.; Wang, Y.; Fan, R.; Hu, X.; Zhang, F.; Yang, J.; Chen, J. The role of intestinal mucosal barrier in autoimmune disease: A potential target. Front. Immunol. 2022, 13, 871713. [Google Scholar] [CrossRef]
- Zeisel, M.B.; Dhawan, P.; Baumert, T.F. Tight junction proteins in gastrointestinal and liver disease. Gut 2019, 68, 547–561. [Google Scholar] [CrossRef]
- Förster, C. Tight junctions and the modulation of barrier function in disease. Histochem. Cell Biol. 2008, 130, 55–70. [Google Scholar] [CrossRef] [Green Version]
- Li, F.; Huang, H.; Zhang, Y.; Chen, H.; Zhou, X.; He, Y.; Meng, X.; Zhao, X. Effect of Lactobacillus fermentum HFY06 combined with arabinoxylan on reducing lipid accumulation in mice fed with high-fat diet. Oxid. Med. Cell. Longev. 2022, 2022, 1068845. [Google Scholar] [CrossRef]
- Gāliņa, D.; Ansonska, L.; Valdovska, A. Effect of probiotics and herbal products on intestinal histomorphological and immunological development in piglets. Vet. Med. Int. 2020, 2020, 3461768. [Google Scholar] [CrossRef]
- Yang, J.; Palmiotti, A.; Kuipers, F. Emerging roles of bile acids in control of intestinal functions. Curr. Opin. Clin. Nutr. Metab. Care 2021, 24, 127–133. [Google Scholar] [CrossRef]
- Chiang, J.Y.L. Bile acid metabolism and signaling. Compr. Physiol. 2013, 3, 1191–1212. [Google Scholar] [PubMed] [Green Version]
- Hylemon, P.B.; Takabe, K.; Dozmorov, M.; Nagahashi, M.; Zhou, H. Bile acids as global regulators of hepatic nutrient metabolism. Liver Res. 2017, 1, 10–16. [Google Scholar] [CrossRef] [PubMed]
- Cai, J.-S.; Chen, J.-H. The mechanism of enterohepatic circulation in the formation of gallstone disease. J. Membr. Biol. 2014, 247, 1067–1082. [Google Scholar] [CrossRef] [PubMed] [Green Version]
- Ma, Y.; Nenkov, M.; Chen, Y.; Press, A.T.; Kaemmerer, E.; Gassler, N. Fatty acid metabolism and acyl-CoA synthetases in the liver-gut axis. World J. Hepatol. 2021, 13, 1512–1533. [Google Scholar] [CrossRef]
- Cai, S.-Y.; Boyer, J.L. The role of bile acids in cholestatic liver injury. Ann. Transl. Med. 2021, 9, 737. [Google Scholar] [CrossRef]
- Agus, A.; Clément, K.; Sokol, H. Gut microbiota-derived metabolites as central regulators in metabolic disorders. Gut 2021, 70, 1174–1182. [Google Scholar] [CrossRef]
- Rotimi, O.A.; Rotimi, S.O.; Duru, C.U.; Ebebeinwe, O.J.; Abiodun, A.O.; Oyeniyi, B.O.; Faduyile, F.A. Acute aflatoxin B1–induced hepatotoxicity alters gene expression and disrupts lipid and lipoprotein metabolism in rats. Toxicol. Rep. 2017, 4, 408–414. [Google Scholar] [CrossRef]
- Chen, Y.-Y.; Lin, Y.; Han, P.-Y.; Jiang, S.; Che, L.; He, C.-Y.; Lin, Y.-C.; Lin, Z.-N. HBx combined with AFB1 triggers hepatic steatosis via COX-2-mediated necrosome formation and mitochondrial dynamics disorder. J. Cell Mol. Med. 2019, 23, 5920–5933. [Google Scholar] [CrossRef] [Green Version]
- Yang, W.S.; Stockwell, B.R. Ferroptosis: Death by lipid peroxidation. Trends Cell Biol. 2016, 26, 165–176. [Google Scholar] [CrossRef] [Green Version]
- Wang, Y.; Chen, Q.; Shi, C.; Jiao, F.; Gong, Z. Mechanism of glycyrrhizin on ferroptosis during acute liver failure by inhibiting oxidative stress. Mol. Med. Rep. 2019, 20, 4081–4090. [Google Scholar] [CrossRef] [Green Version]
- Chen, J.; Li, X.; Ge, C.; Min, J.; Wang, F. The multifaceted role of ferroptosis in liver disease. Cell Death Differ. 2022, 29, 467–480. [Google Scholar] [CrossRef]
- Silva, M.M.; Rocha, C.R.R.; Kinker, G.S.; Pelegrini, A.L.; Menck, C.F.M. The balance between NRF2/GSH antioxidant mediated pathway and DNA repair modulates cisplatin resistance in lung cancer cells. Sci. Rep. 2019, 9, 17639. [Google Scholar] [CrossRef] [Green Version]
- Qin, Y.; Qiao, Y.; Wang, D.; Tang, C.; Yan, G. Ferritinophagy and ferroptosis in cardiovascular disease: Mechanisms and potential applications. Biomed. Pharmacother. 2021, 141, 111872. [Google Scholar] [CrossRef]
- Panaroni, C.; Fulzele, K.; Soucy, R.; Siu, K.T.; Mukaihara, K.; Huang, C.; Chattopadhyay, S.; Raje, N. Arachidonic acid induces ferroptosis-mediated cell-death in multiple myeloma. Blood 2018, 132 (Suppl. 1), 4498. [Google Scholar] [CrossRef]
- Yan, T.; Luo, Y.; Yan, N.; Hamada, K.; Zhao, N.; Xia, Y.; Wang, P.; Zhao, C.; Qi, D.; Yang, S.; et al. Intestinal peroxisome proliferator-activated receptor α-fatty acid binding protein 1 axis modulates nonalcoholic steatohepatitis. Hepatology 2022, 77, 32538. [Google Scholar] [CrossRef]
- Zhang, W.; Li, J.Y.; Wei, X.C.; Wang, Q.; Yang, J.Y.; Hou, H.; Du, Z.W.; Wu, X.A. Effects of dibutyl phthalate on lipid metabolism in liver and hepatocytes based on PPARα/SREBP-1c/FAS/GPAT/AMPK signal pathway. Food Chem. Toxicol. 2021, 149, 112029. [Google Scholar] [CrossRef]
- Hu, C.; Sun, B.; Liu, M.; Yu, J.; Zhou, X.; Chen, L. Fecal transplantation from young zebrafish donors efficiently ameliorates the lipid metabolism disorder of aged recipients exposed to perfluorobutanesulfonate. Sci. Total Environ. 2022, 823, 153758. [Google Scholar] [CrossRef]
- Tian, W.; Wang, D.; Wang, Z.; Jiang, K.; Li, Z.; Tian, Y.; Kang, X.; Liu, X.; Li, H. Evolution, expression profile, and regulatory characteristics of ACSL gene family in chicken (Gallus gallus). Gene 2021, 764, 145094. [Google Scholar] [CrossRef]
- Zeng, S.; Wu, F.; Chen, M.; Li, Y.; You, M.; Zhang, Y.; Yang, P.; Wei, L.; Ruan, X.Z.; Zhao, L.; et al. Inhibition of fatty acid translocase (FAT/CD36) palmitoylation enhances hepatic fatty acid β-oxidation by increasing its localization to mitochondria and interaction with long-chain acyl-CoA synthetase 1. Antioxid. Redox Signal. 2022, 36, 1081–1100. [Google Scholar] [CrossRef]
- Li, C.; Yang, W.; Zhang, J.; Zheng, X.; Yao, Y.; Tu, K.; Liu, Q. SREBP-1 has a prognostic role and contributes to invasion and metastasis in human hepatocellular carcinoma. Int. J. Mol. Sci. 2014, 15, 7124–7138. [Google Scholar] [CrossRef]
- Guo, D.; Bell, E.H.; Mischel, P.; Chakravarti, A. Targeting SREBP-1-driven lipid metabolism to treat cancer. Curr. Pharm. Des. 2014, 20, 2619–2626. [Google Scholar] [CrossRef] [Green Version]


Disclaimer/Publisher’s Note: The statements, opinions and data contained in all publications are solely those of the individual author(s) and contributor(s) and not of MDPI and/or the editor(s). MDPI and/or the editor(s) disclaim responsibility for any injury to people or property resulting from any ideas, methods, instructions or products referred to in the content. |
© 2023 by the authors. Licensee MDPI, Basel, Switzerland. This article is an open access article distributed under the terms and conditions of the Creative Commons Attribution (CC BY) license (https://creativecommons.org/licenses/by/4.0/).
Share and Cite
Huang, S.; Lin, L.; Wang, S.; Ding, W.; Zhang, C.; Shaukat, A.; Xu, B.; Yue, K.; Zhang, C.; Liu, F. Total Flavonoids of Rhizoma Drynariae Mitigates Aflatoxin B1-Induced Liver Toxicity in Chickens via Microbiota-Gut-Liver Axis Interaction Mechanisms. Antioxidants 2023, 12, 819. https://doi.org/10.3390/antiox12040819
Huang S, Lin L, Wang S, Ding W, Zhang C, Shaukat A, Xu B, Yue K, Zhang C, Liu F. Total Flavonoids of Rhizoma Drynariae Mitigates Aflatoxin B1-Induced Liver Toxicity in Chickens via Microbiota-Gut-Liver Axis Interaction Mechanisms. Antioxidants. 2023; 12(4):819. https://doi.org/10.3390/antiox12040819
Chicago/Turabian StyleHuang, Shucheng, Luxi Lin, Shiqiong Wang, Wenli Ding, Chaodong Zhang, Aftab Shaukat, Bowen Xu, Ke Yue, Cai Zhang, and Fang Liu. 2023. "Total Flavonoids of Rhizoma Drynariae Mitigates Aflatoxin B1-Induced Liver Toxicity in Chickens via Microbiota-Gut-Liver Axis Interaction Mechanisms" Antioxidants 12, no. 4: 819. https://doi.org/10.3390/antiox12040819