


Antioxidant, Anti-Inflammatory and Anti-Diabetic Activities of Tectona grandis Methanolic Extracts, Fractions, and Isolated Compounds
Abstract
:
1. Introduction
2. Materials and Methods
2.1. Plant Material
2.2. General Experimental Procedures
2.3. Extraction, Isolation and Purification
2.4. DPPH Free Radical Scavenging Assay
2.5. ABTS Radical Cation Scavenging Assay
2.6. Ferric Reducing Antioxidant Power Assay
2.7. DNA Oxidative Damage Assay
2.8. Protein Oxidative Damage Assay
2.9. Anti-Inflammatory Activity and Cell Viability Assay
2.10. α-Glucosidase Inhibition Assay
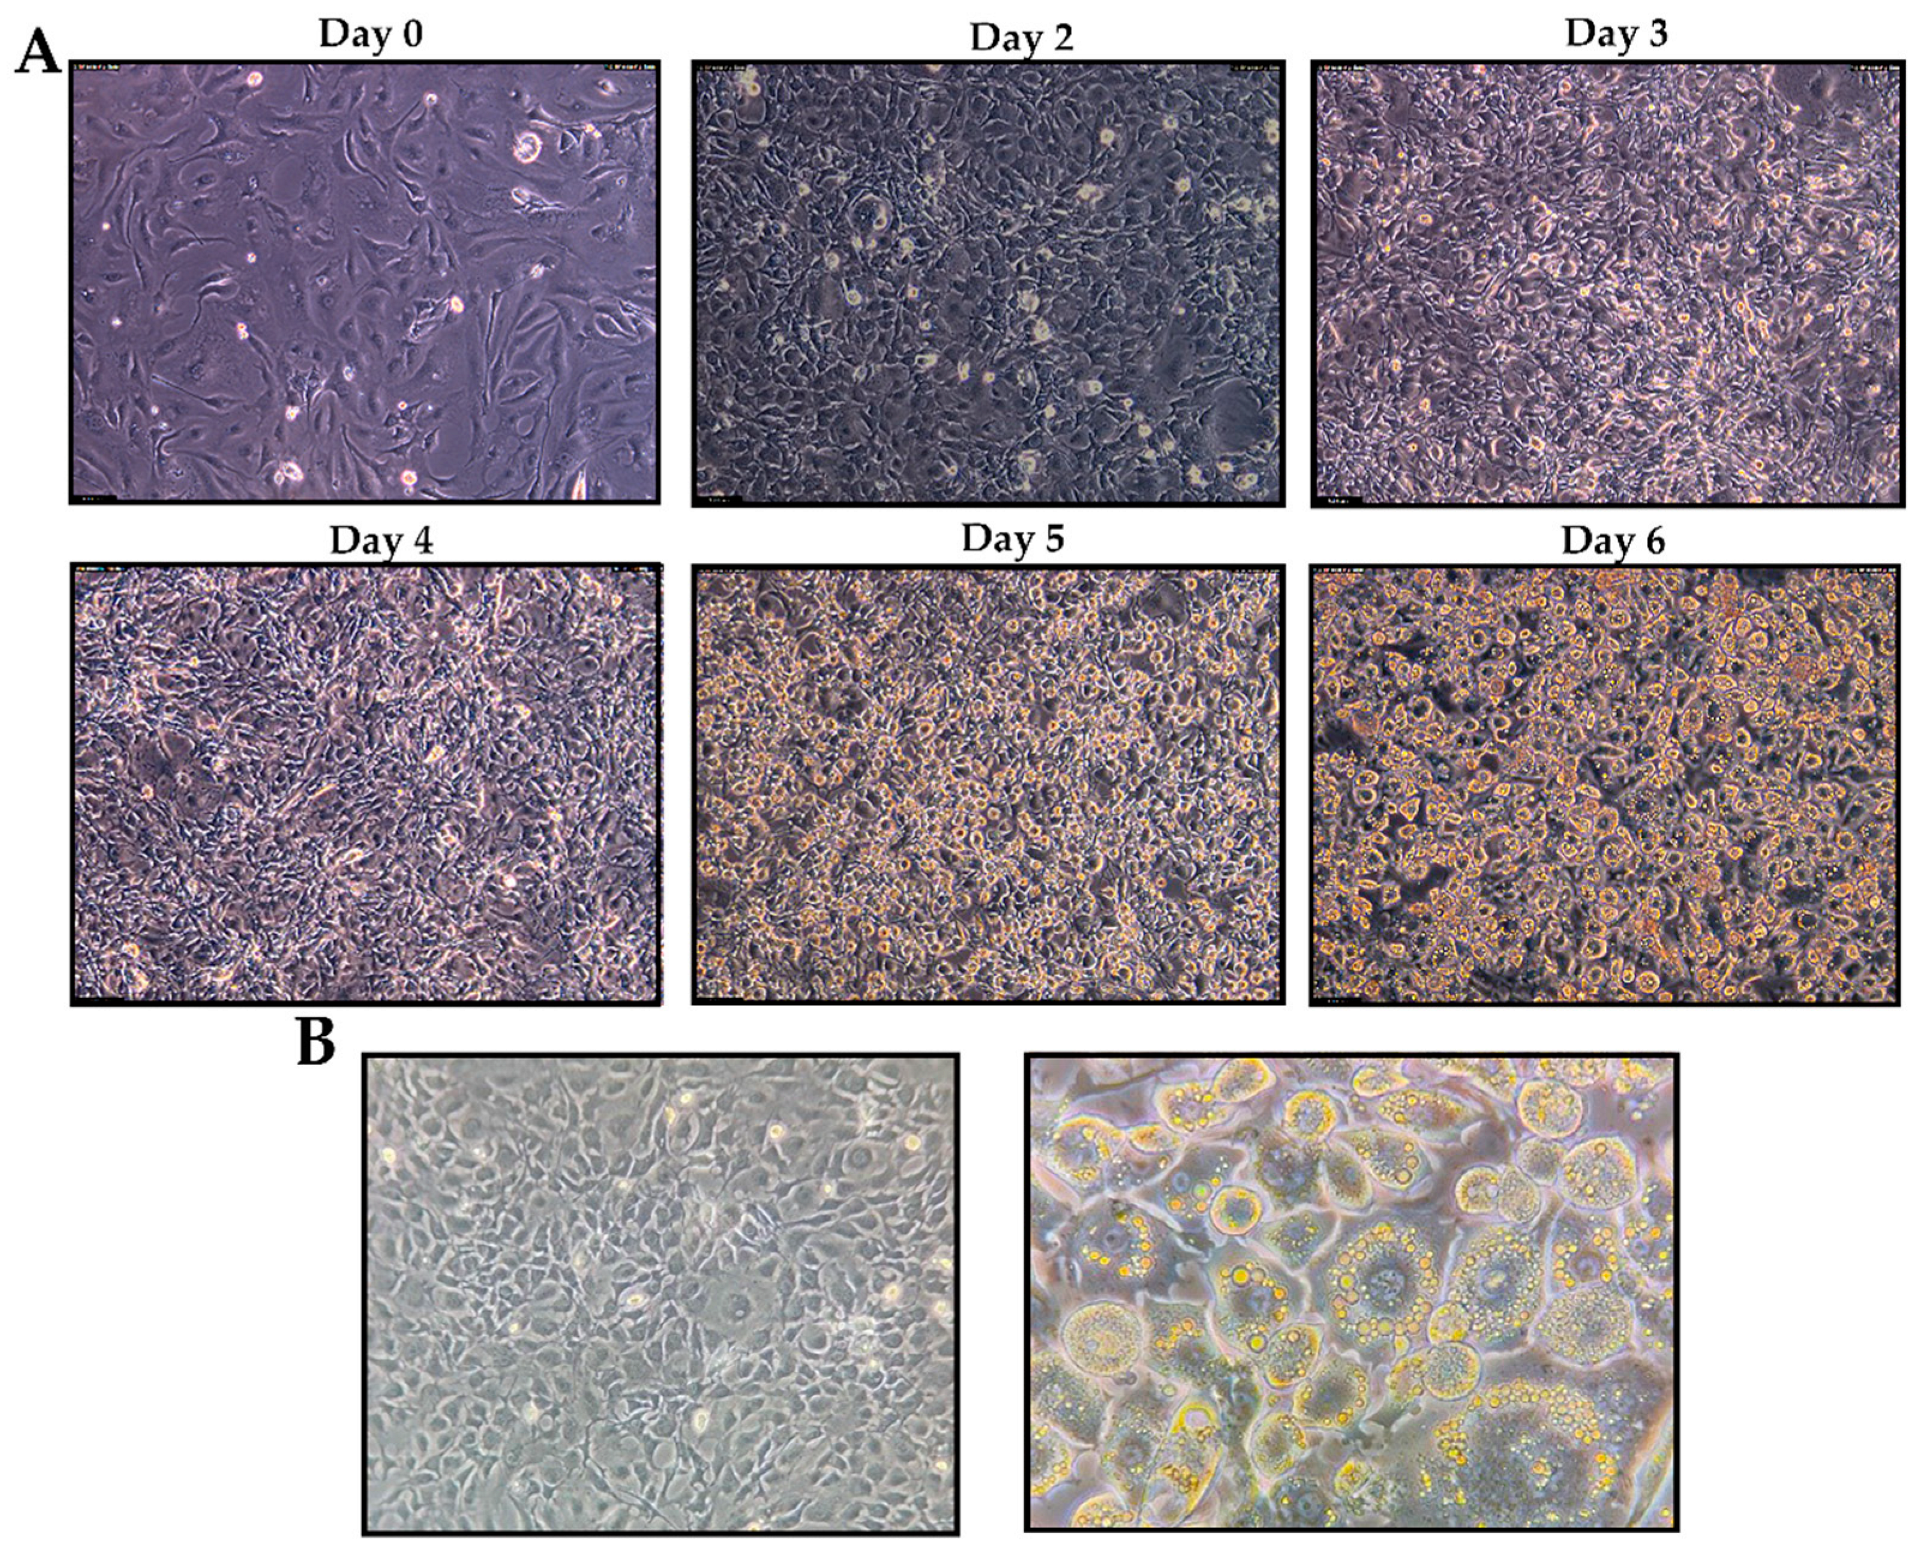
2.11. Glucose Uptake and Cell Viability Assay
2.12. Statistical Analysis
3. Results and Discussion
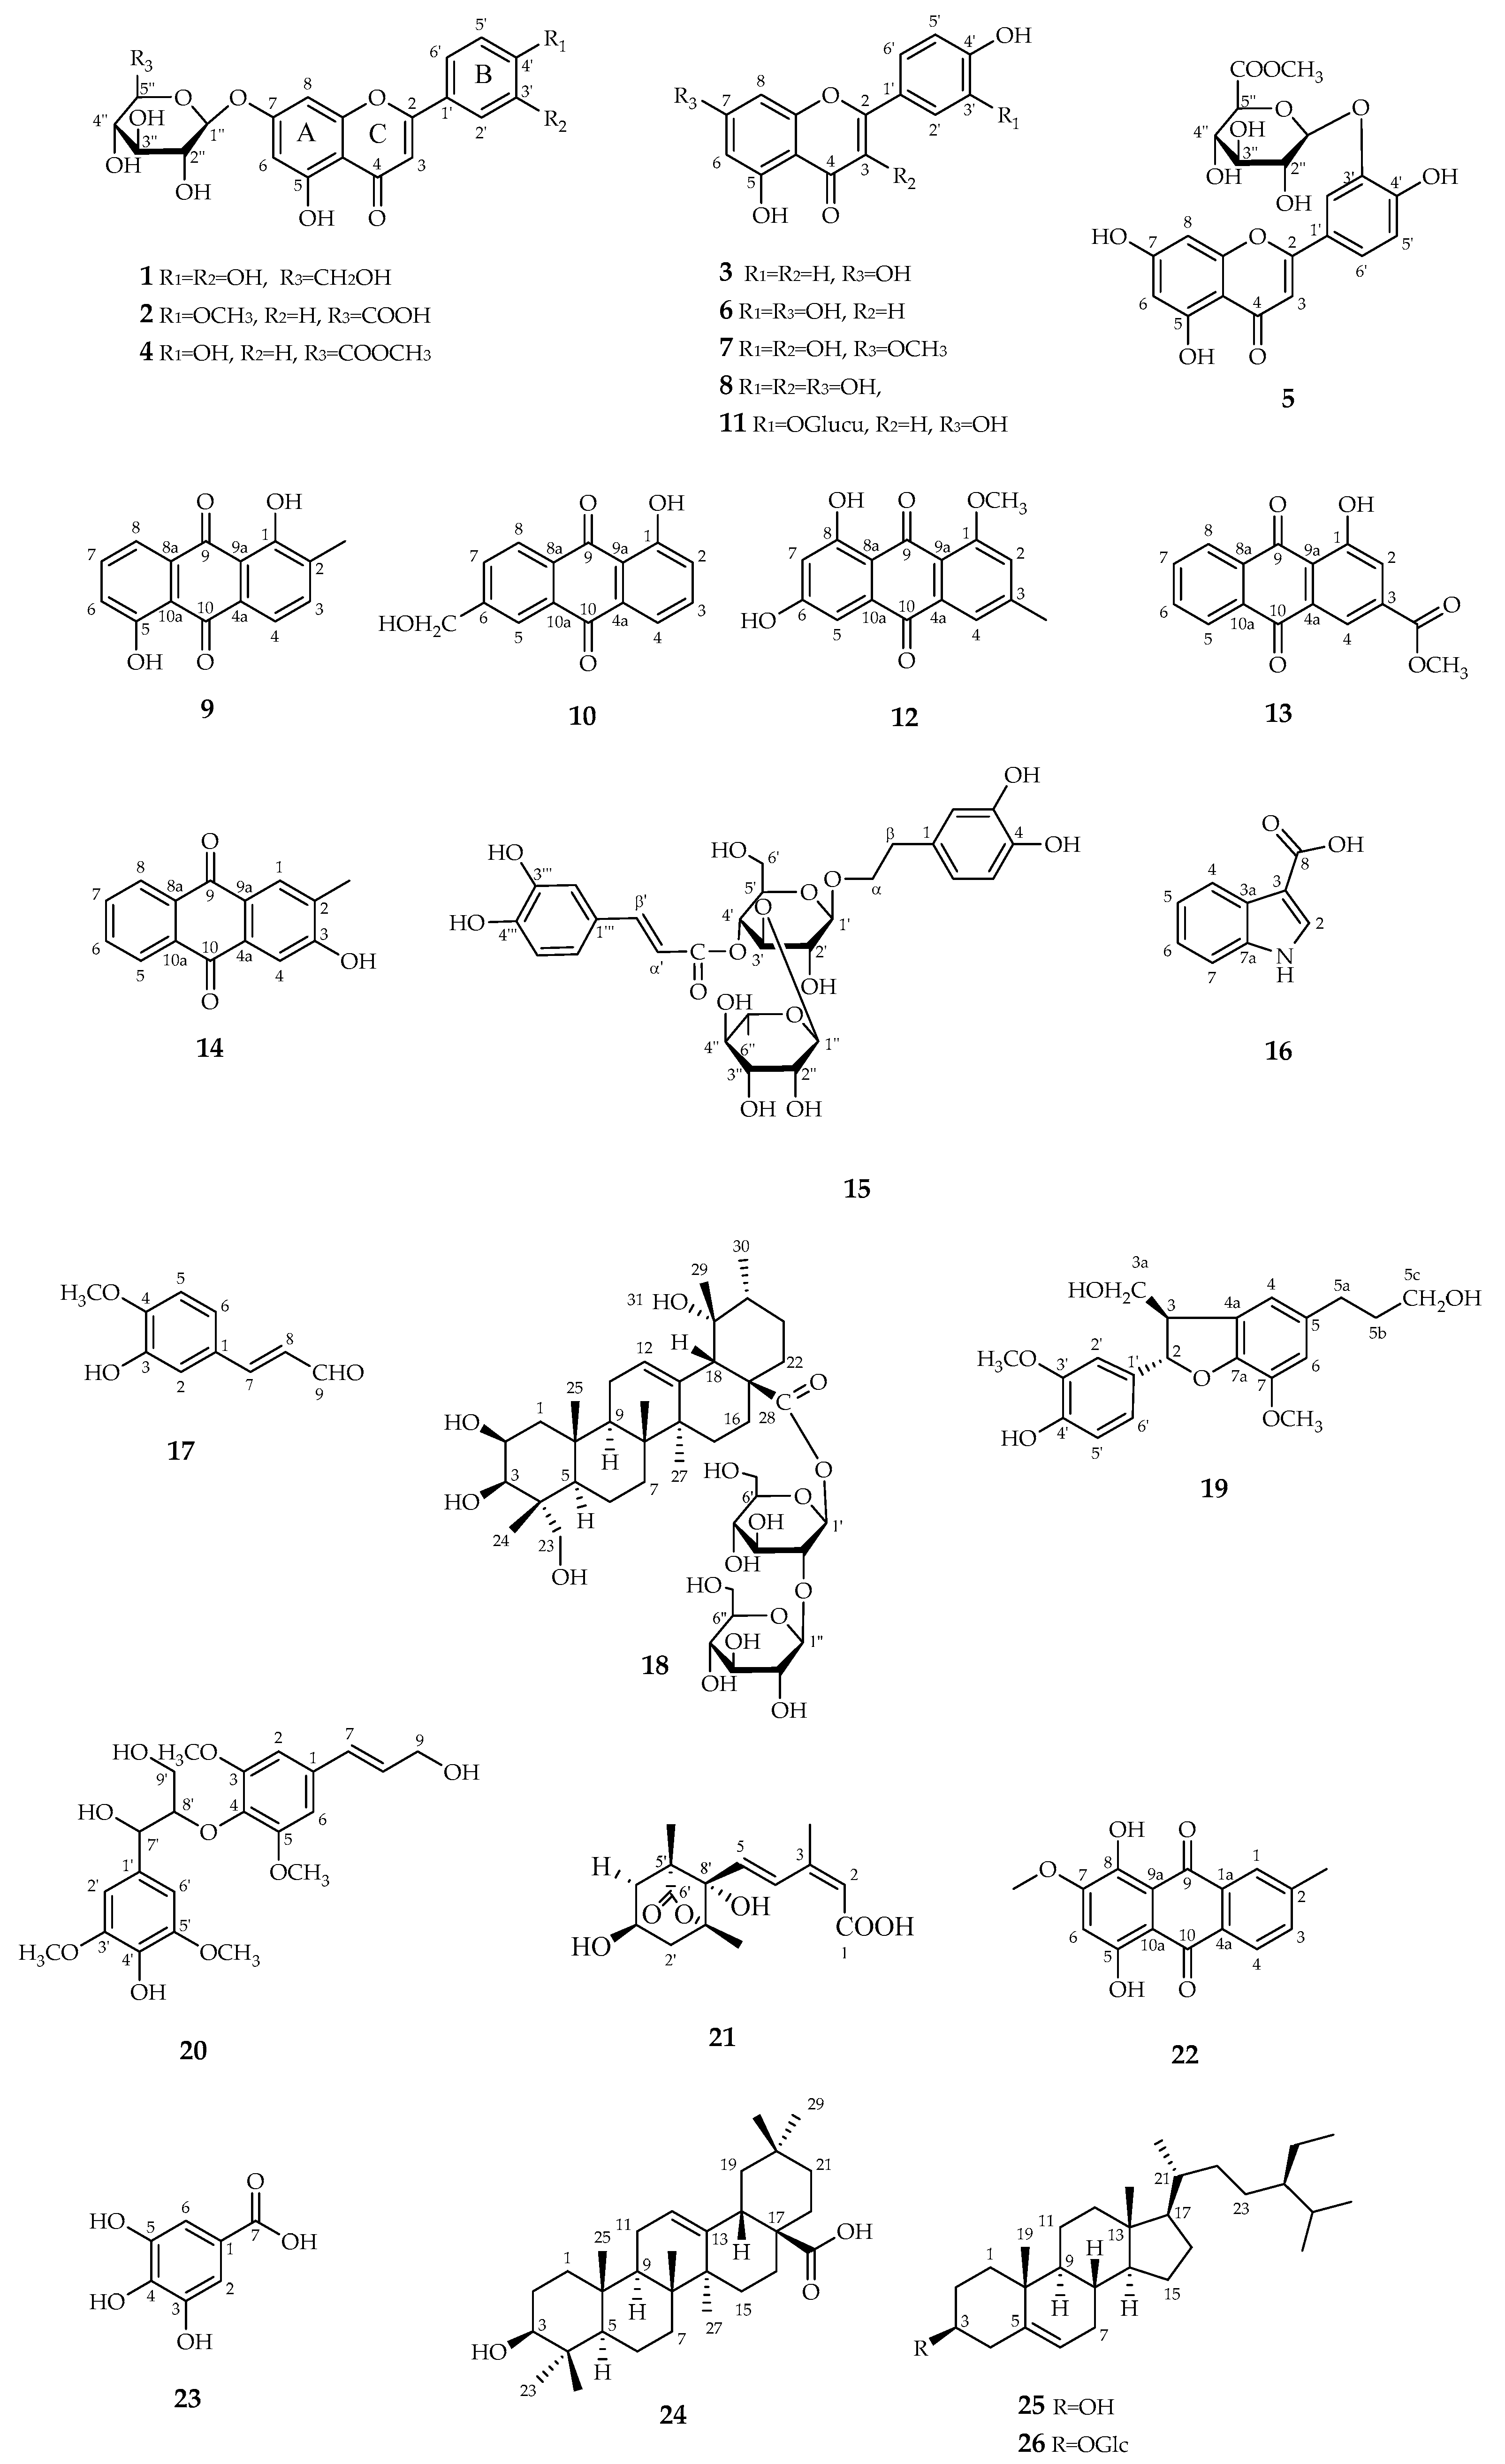
3.1. Structure Elucidation
3.2. Antioxidant Activity Assays
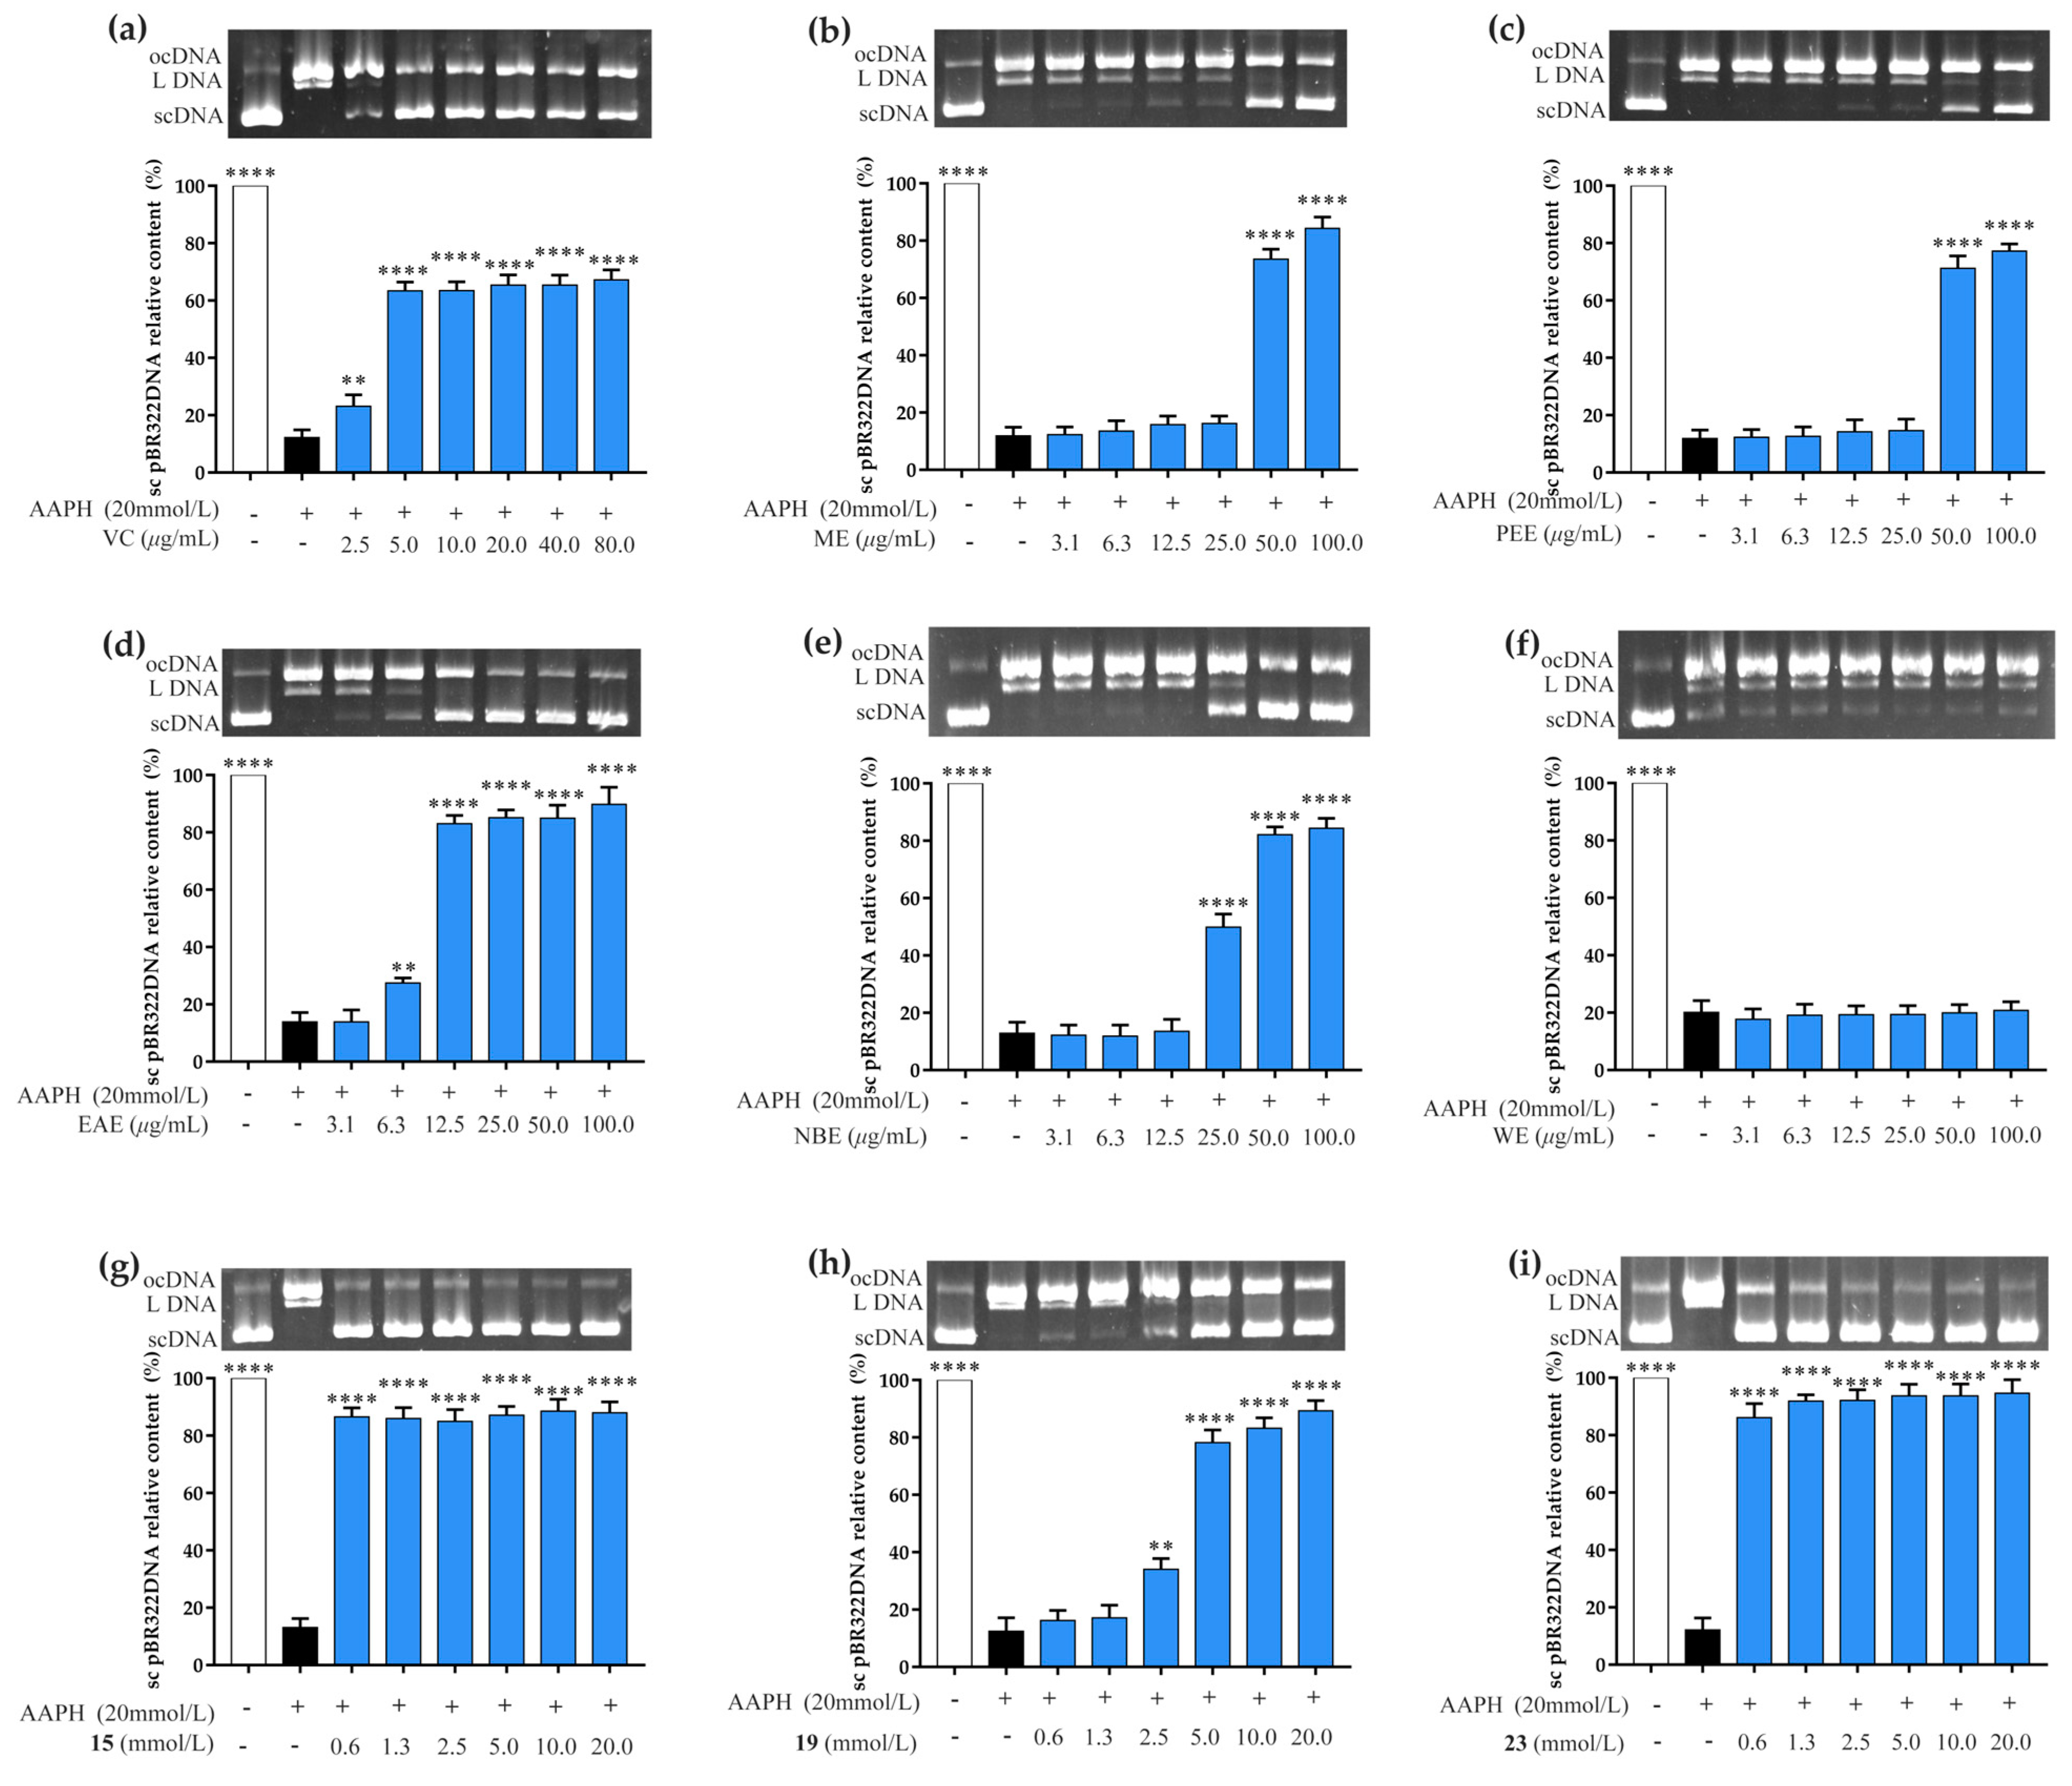
3.3. Prevention of AAPH-Induced DNA Oxidative Damage Assay
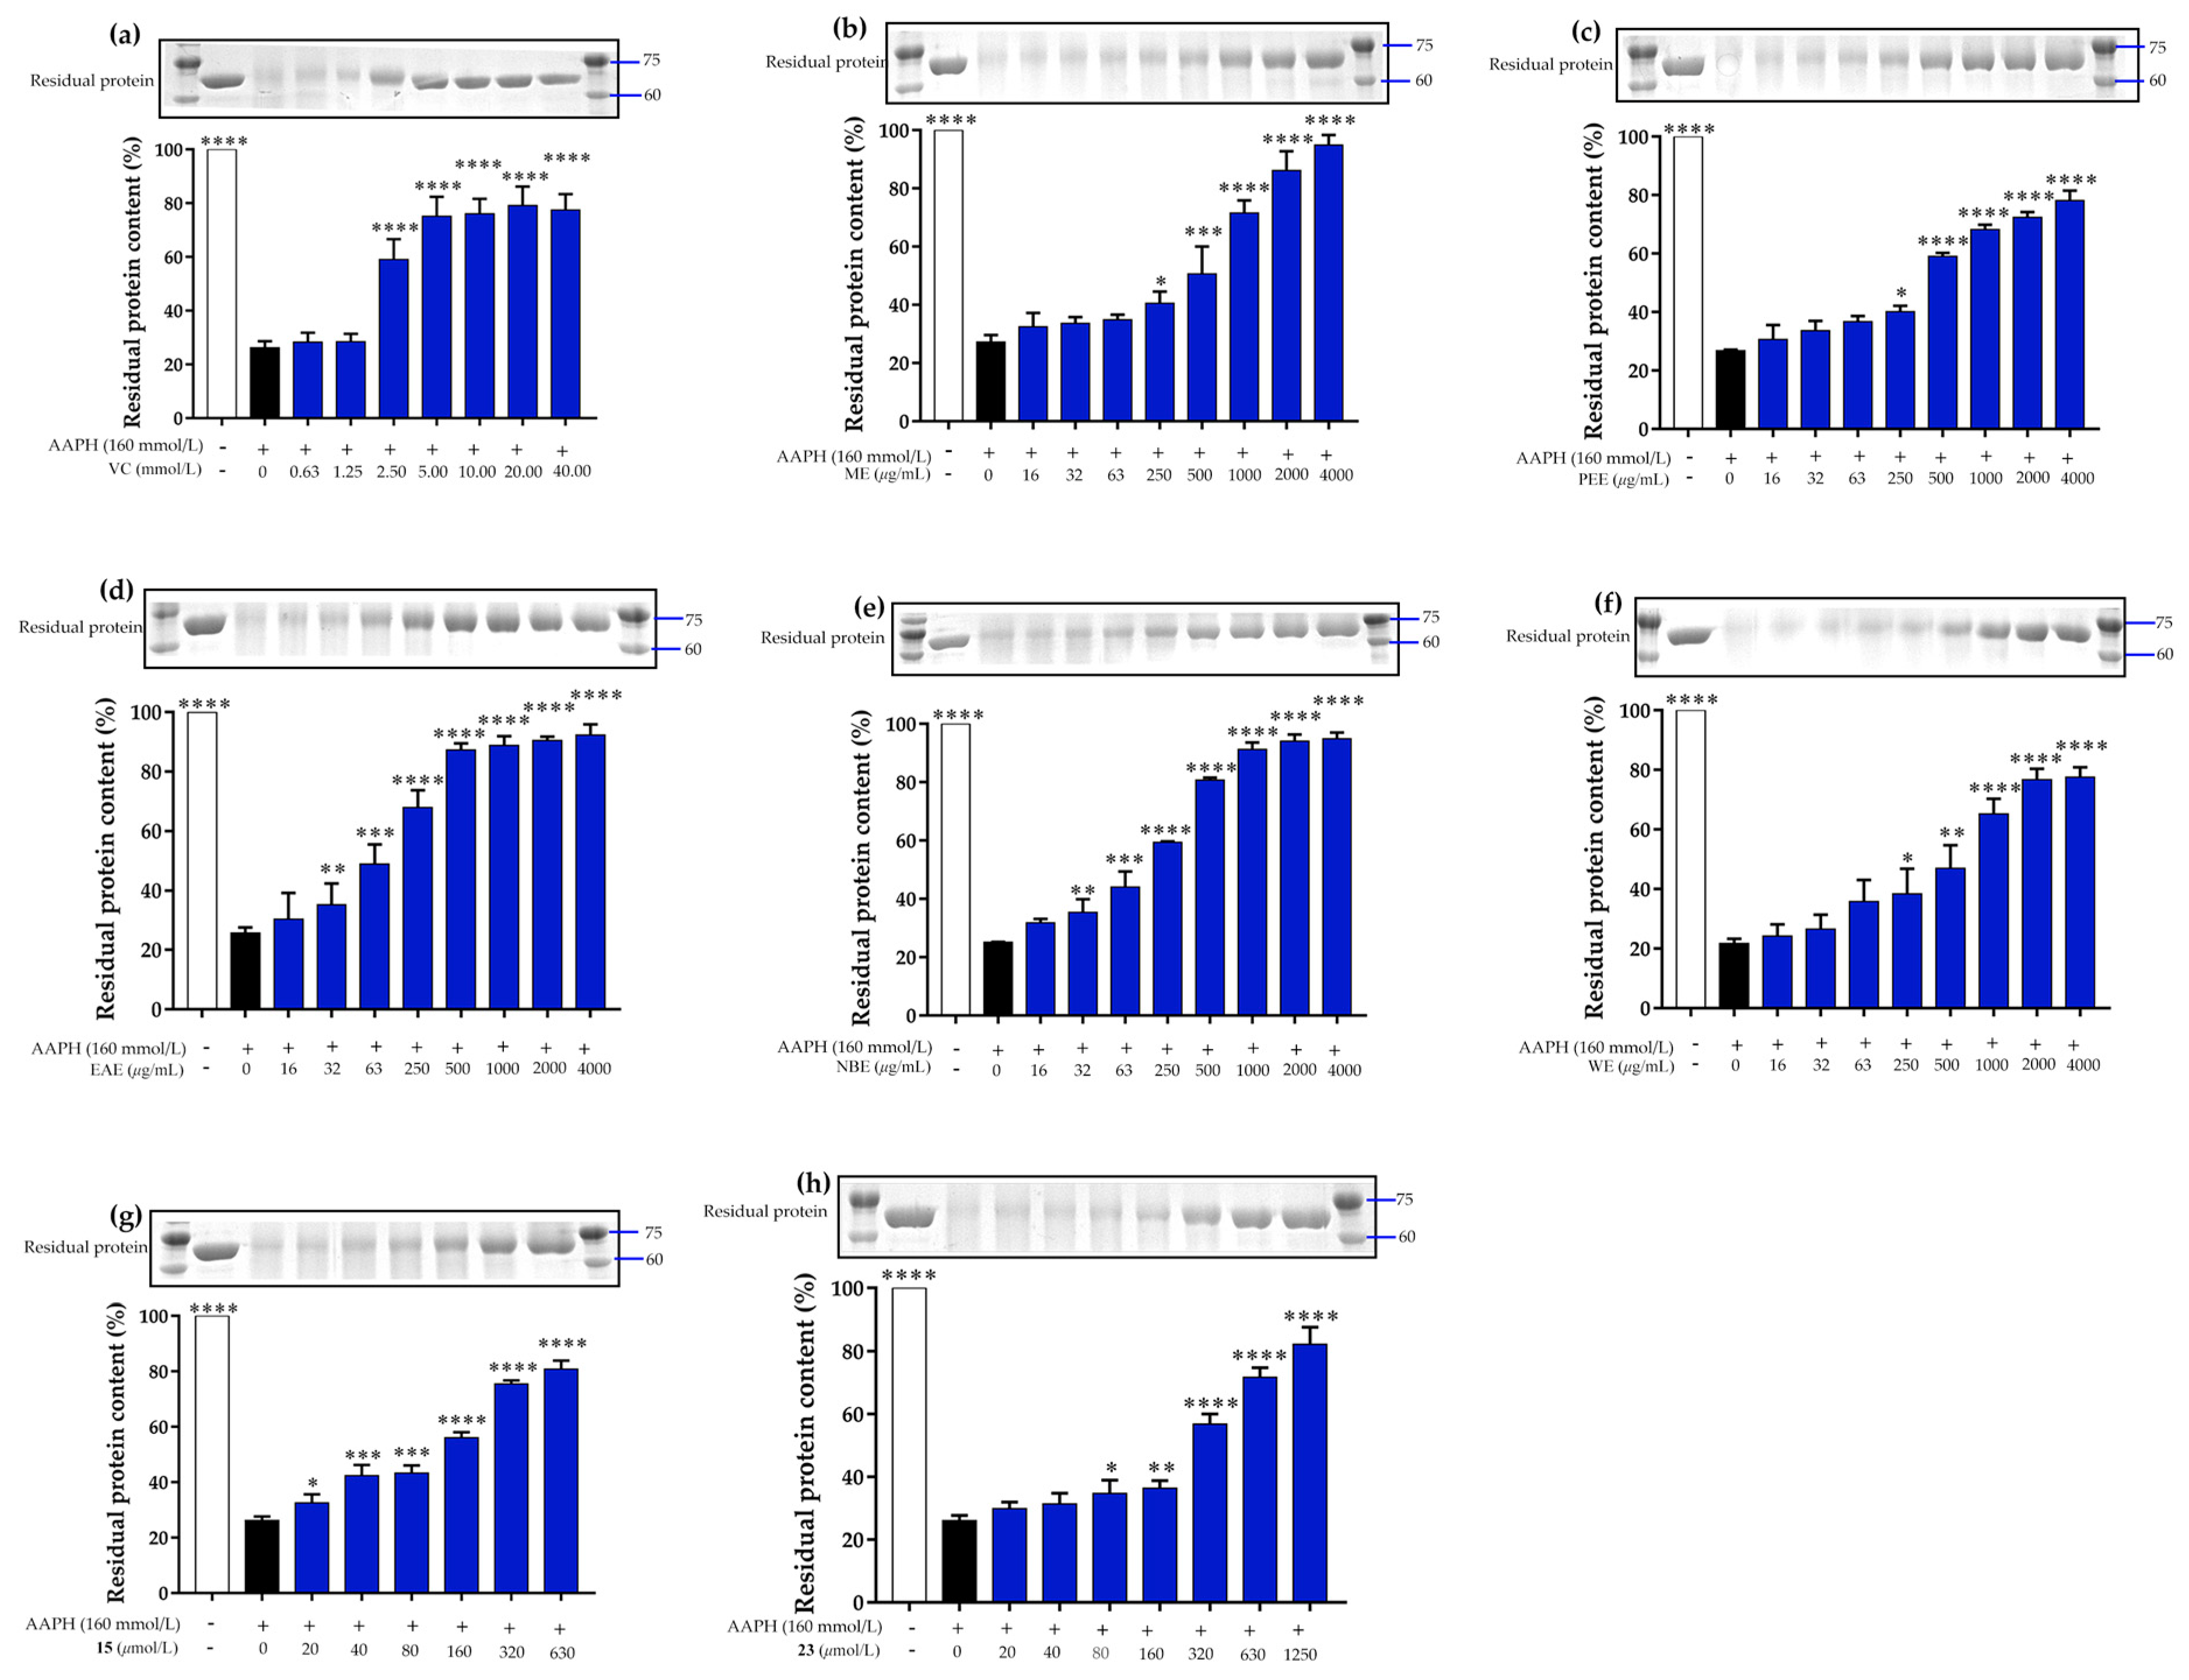
3.4. Prevention of AAPH-Induced Protein Oxidative Damage Assay
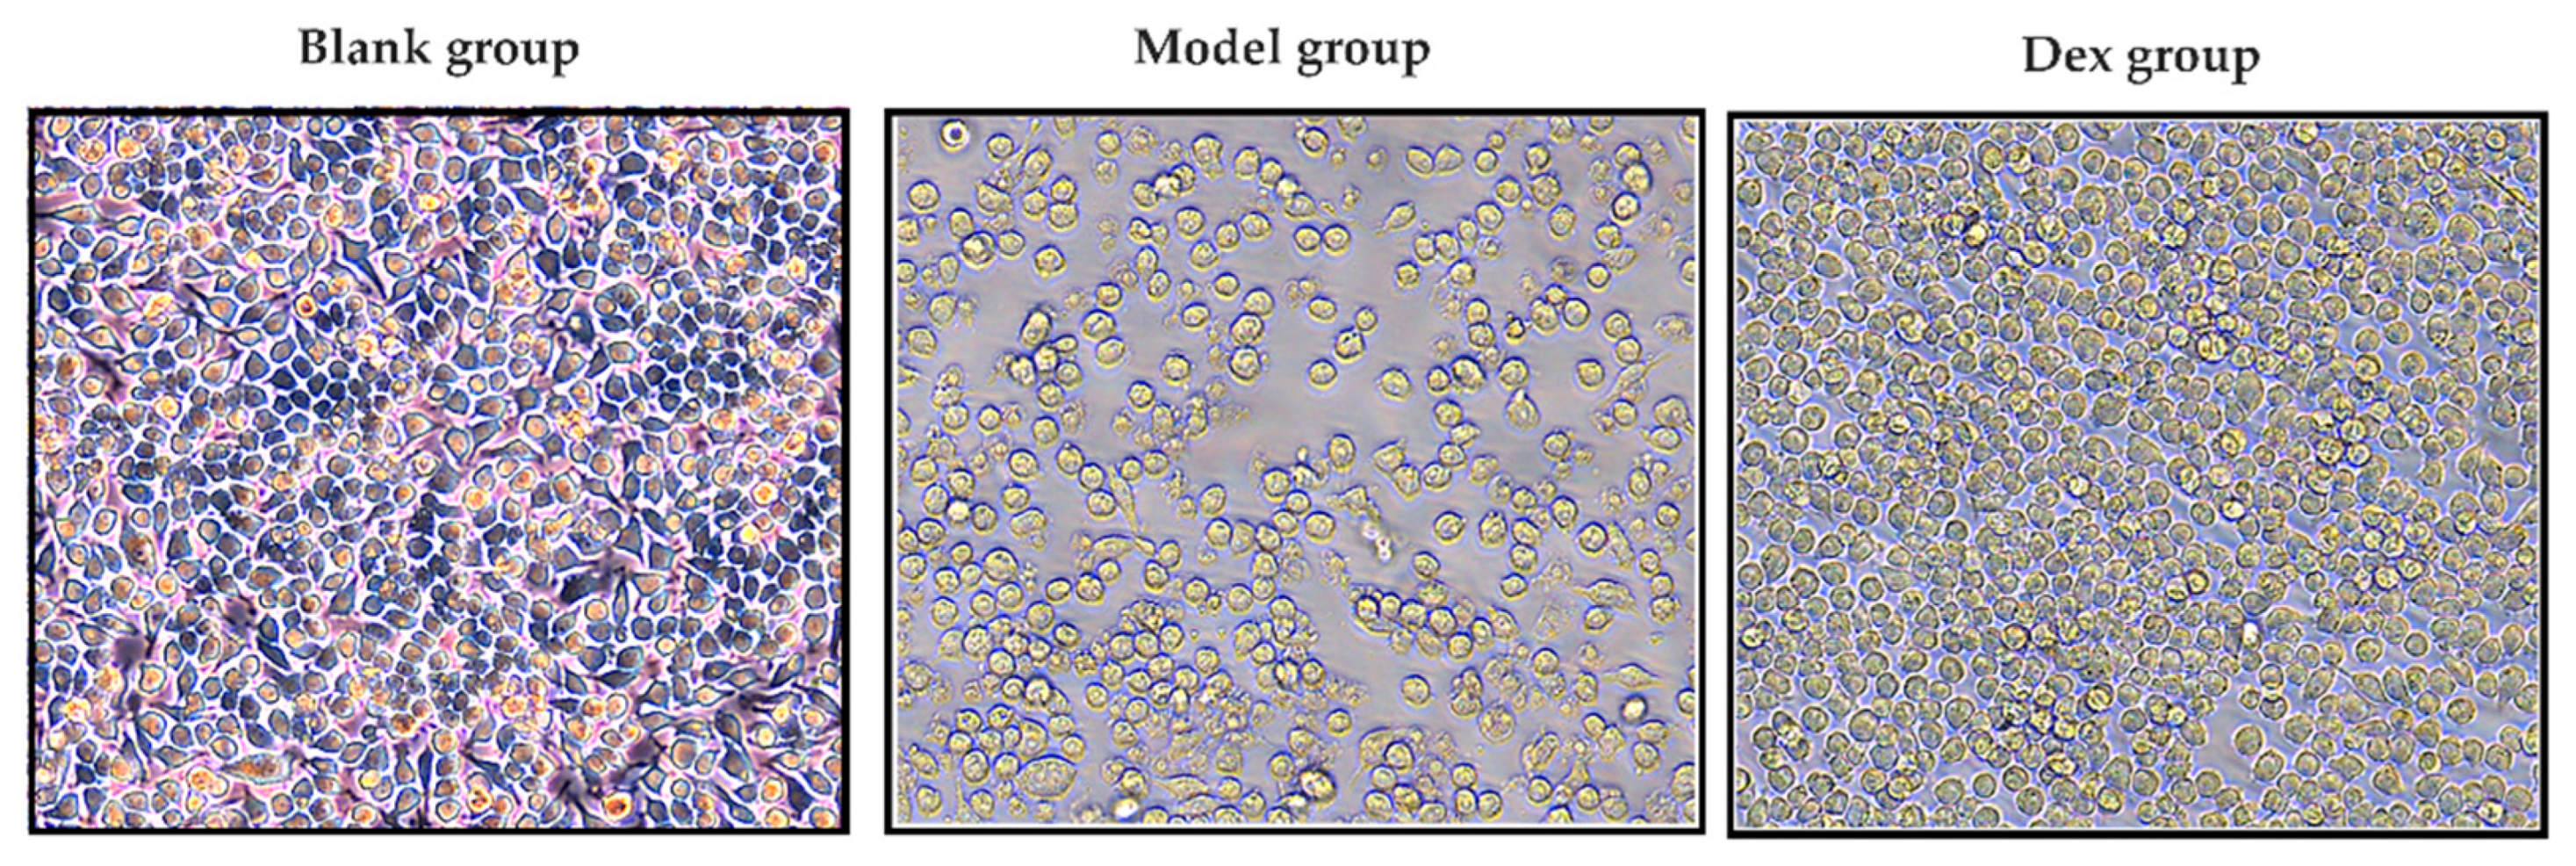
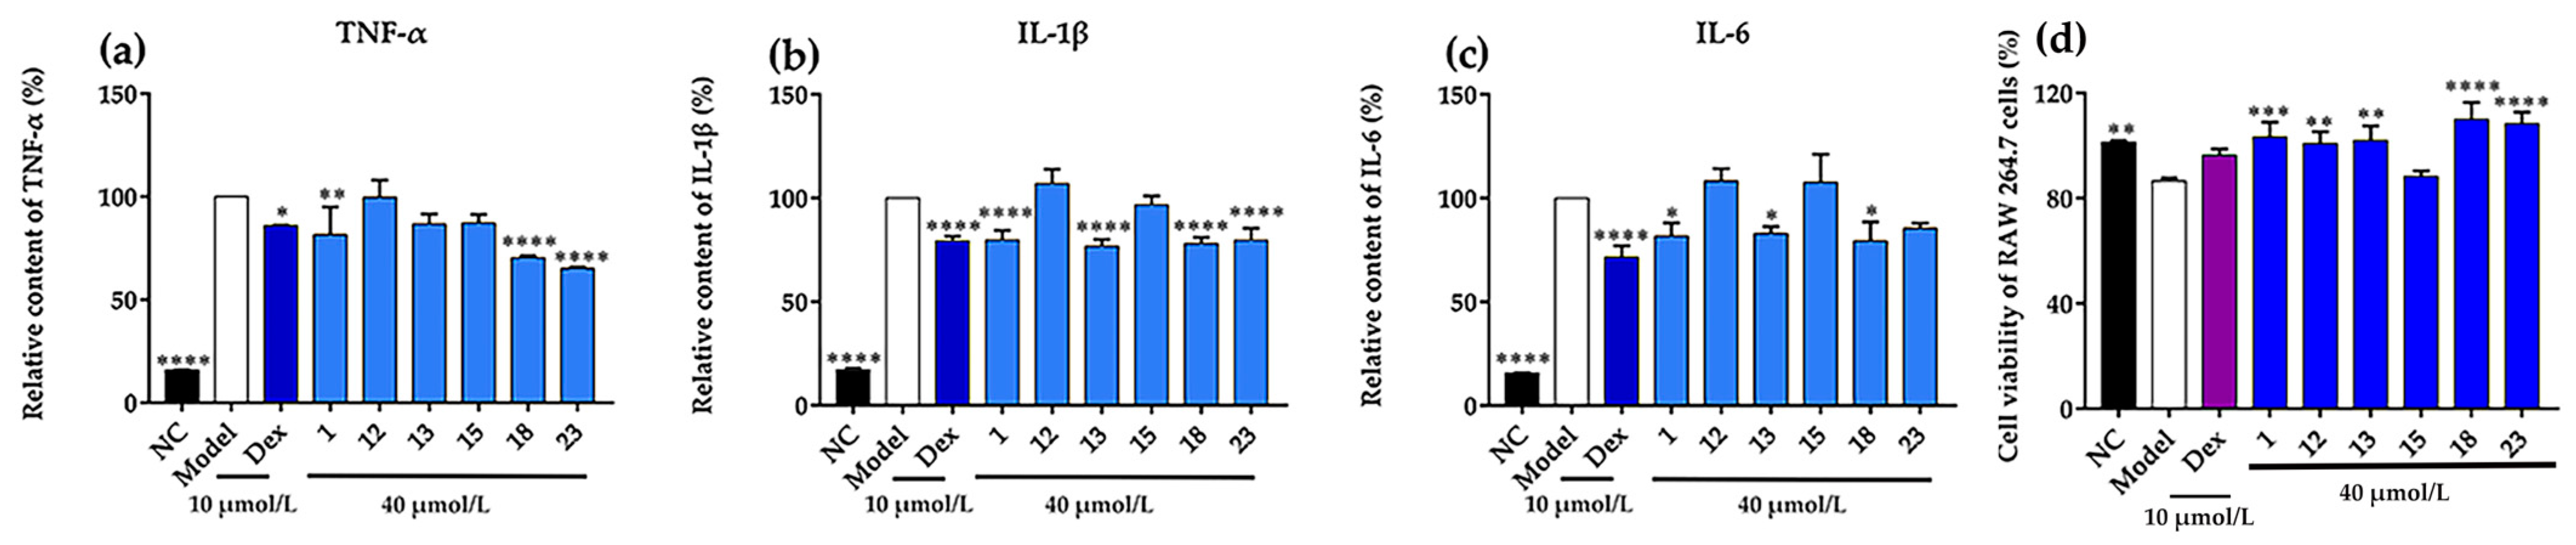
3.5. Anti-Inflammatory Activity Assay
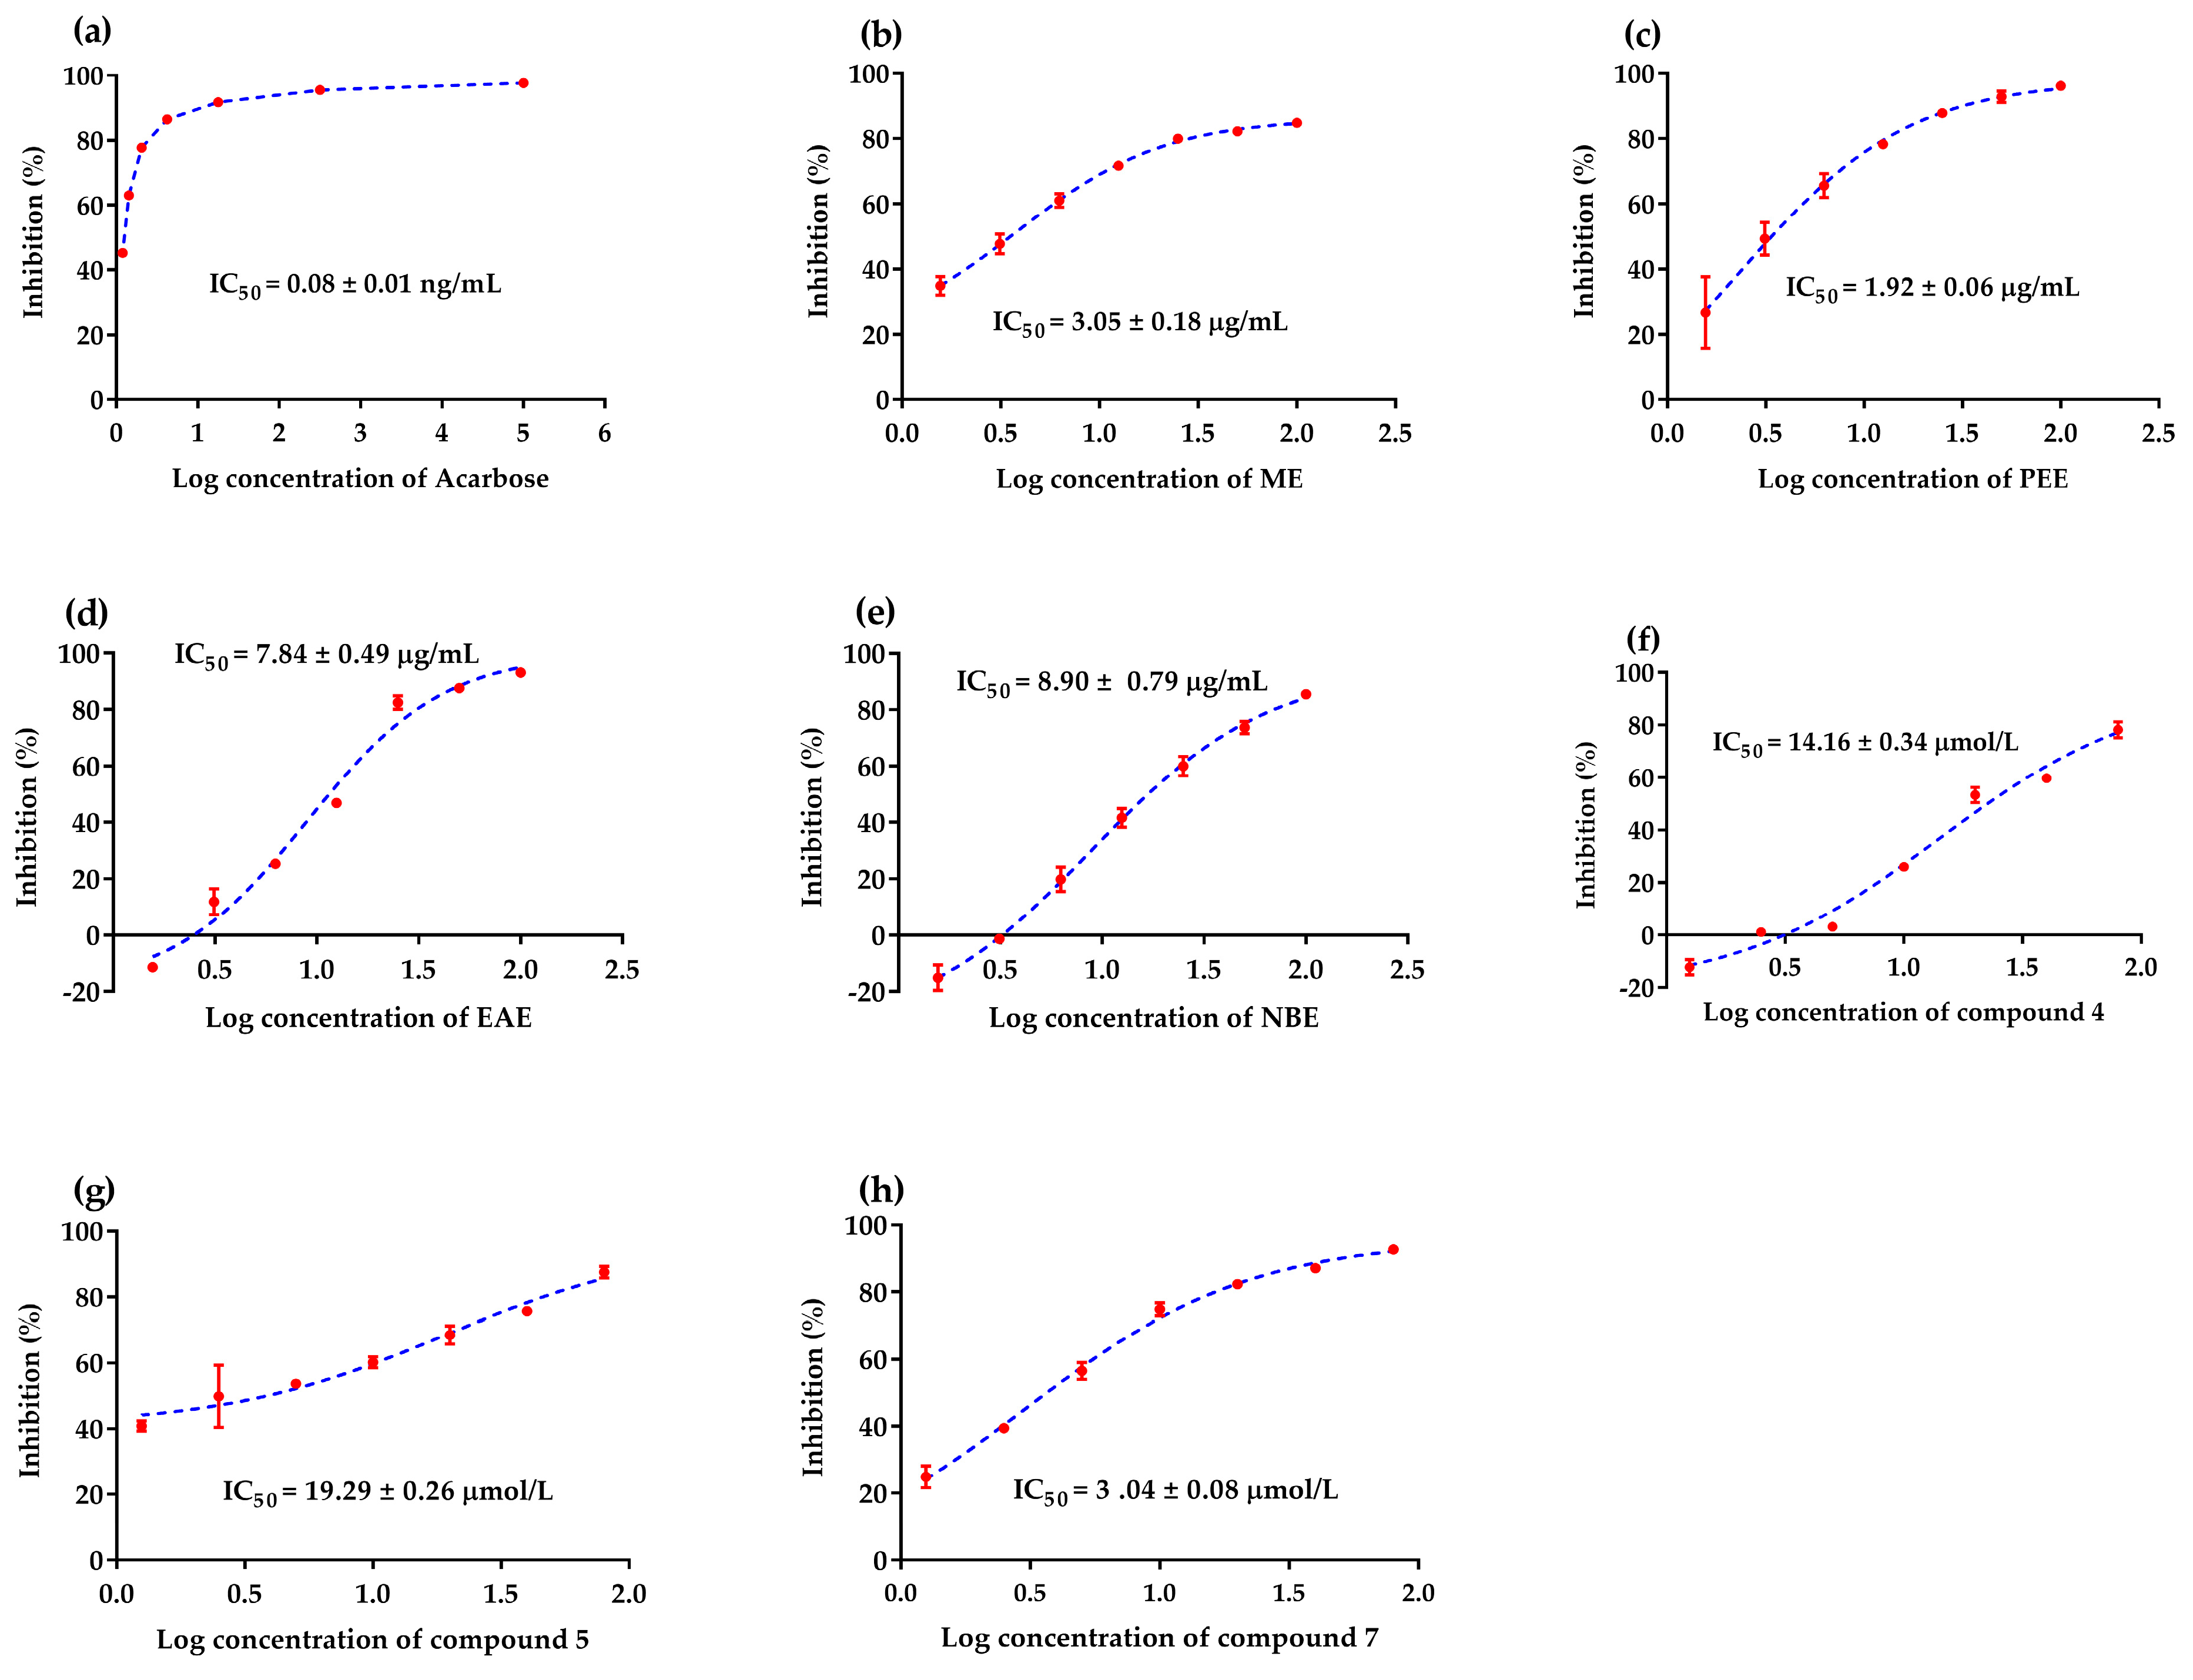
3.6. α-Glucosidase Inhibition Assay
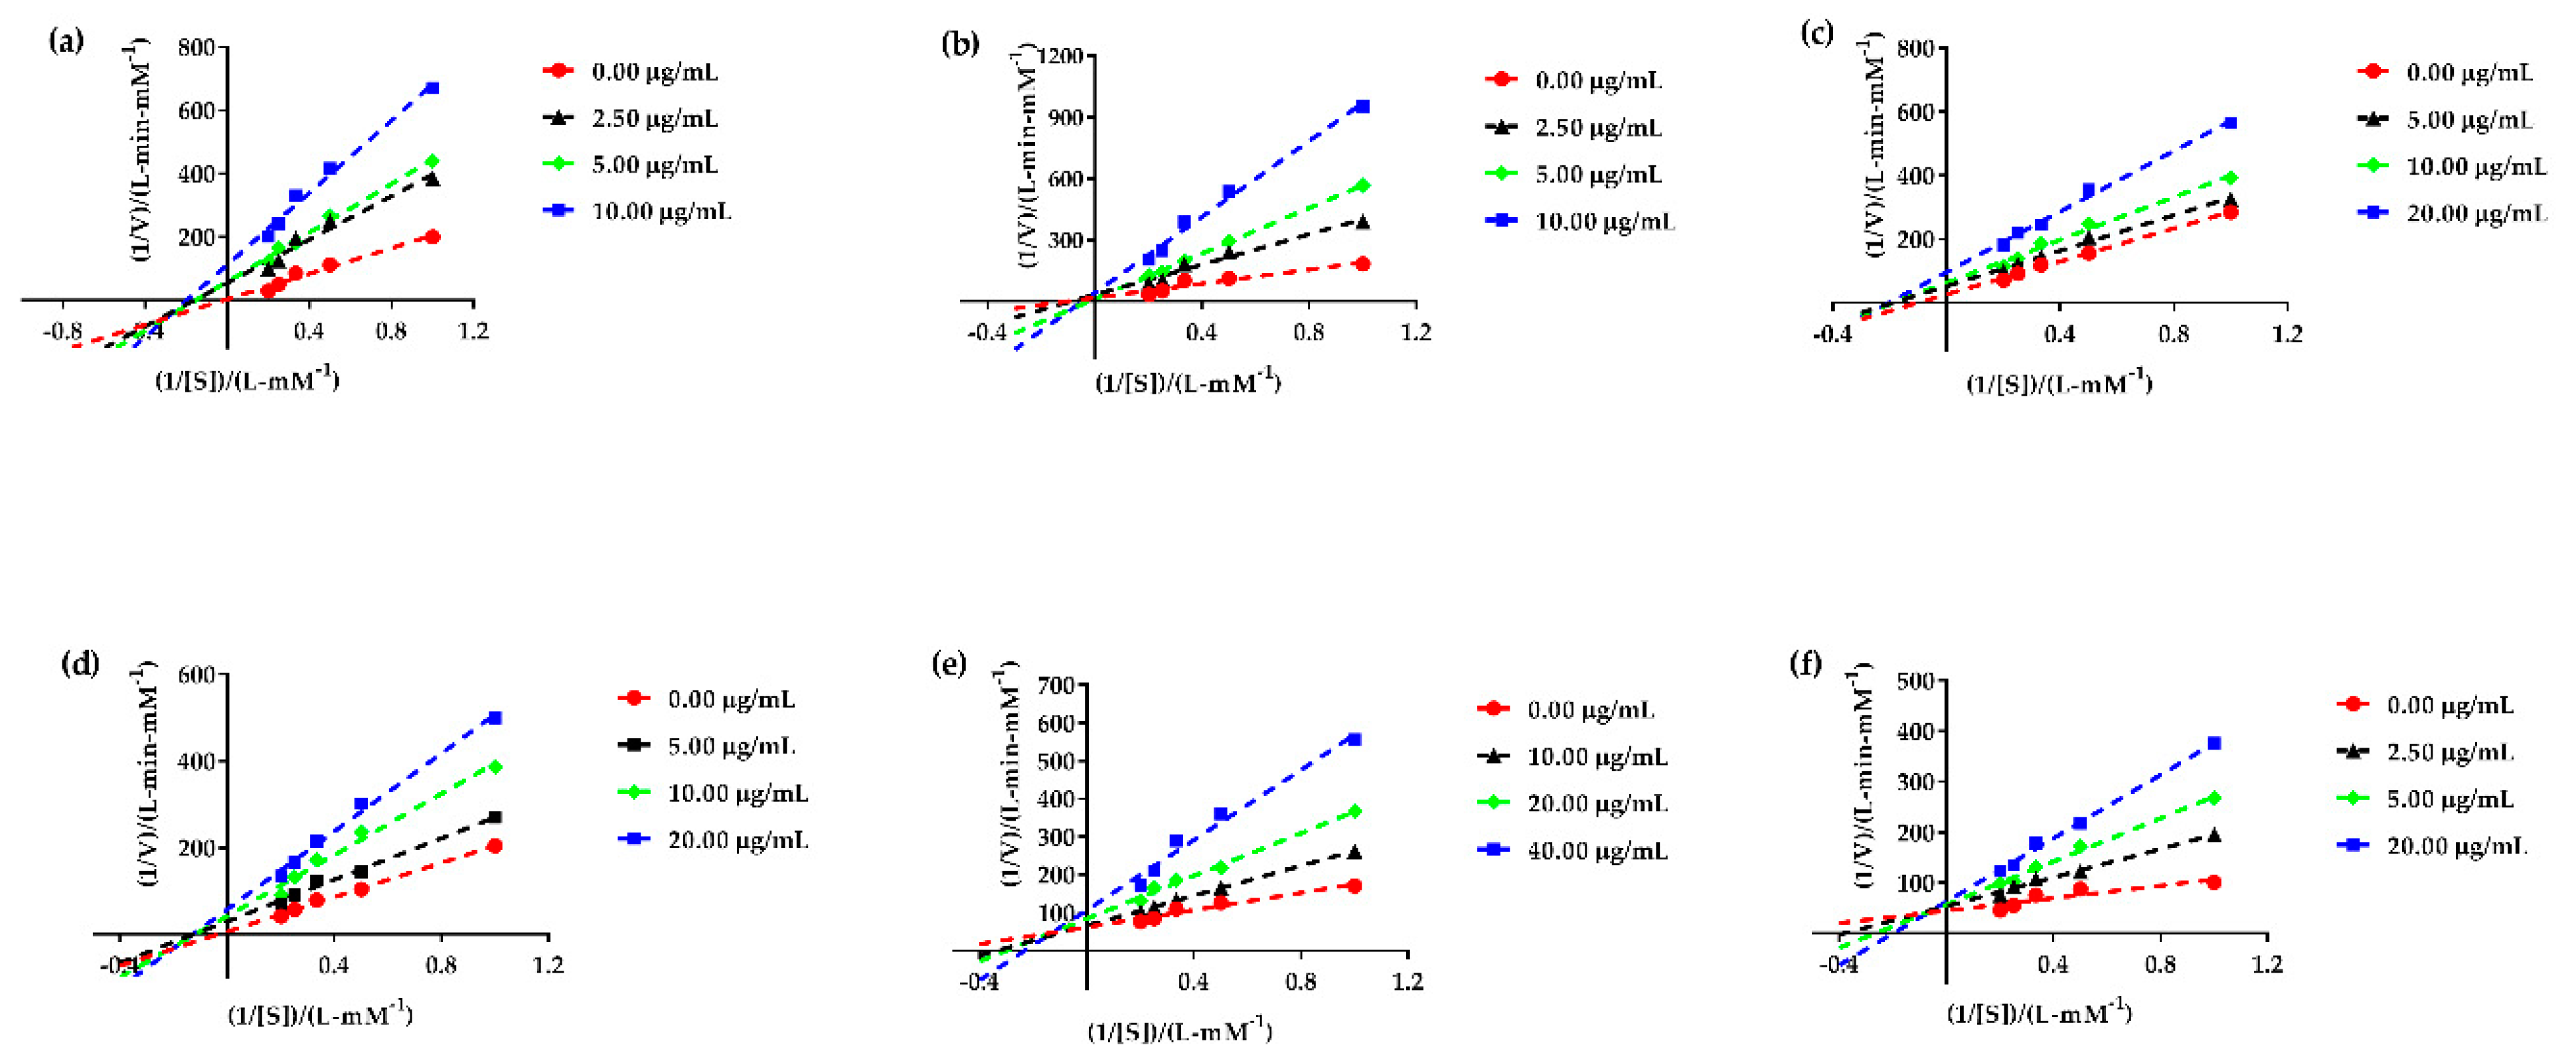
3.7. α-Glucosidase Enzyme Kinetic Assay
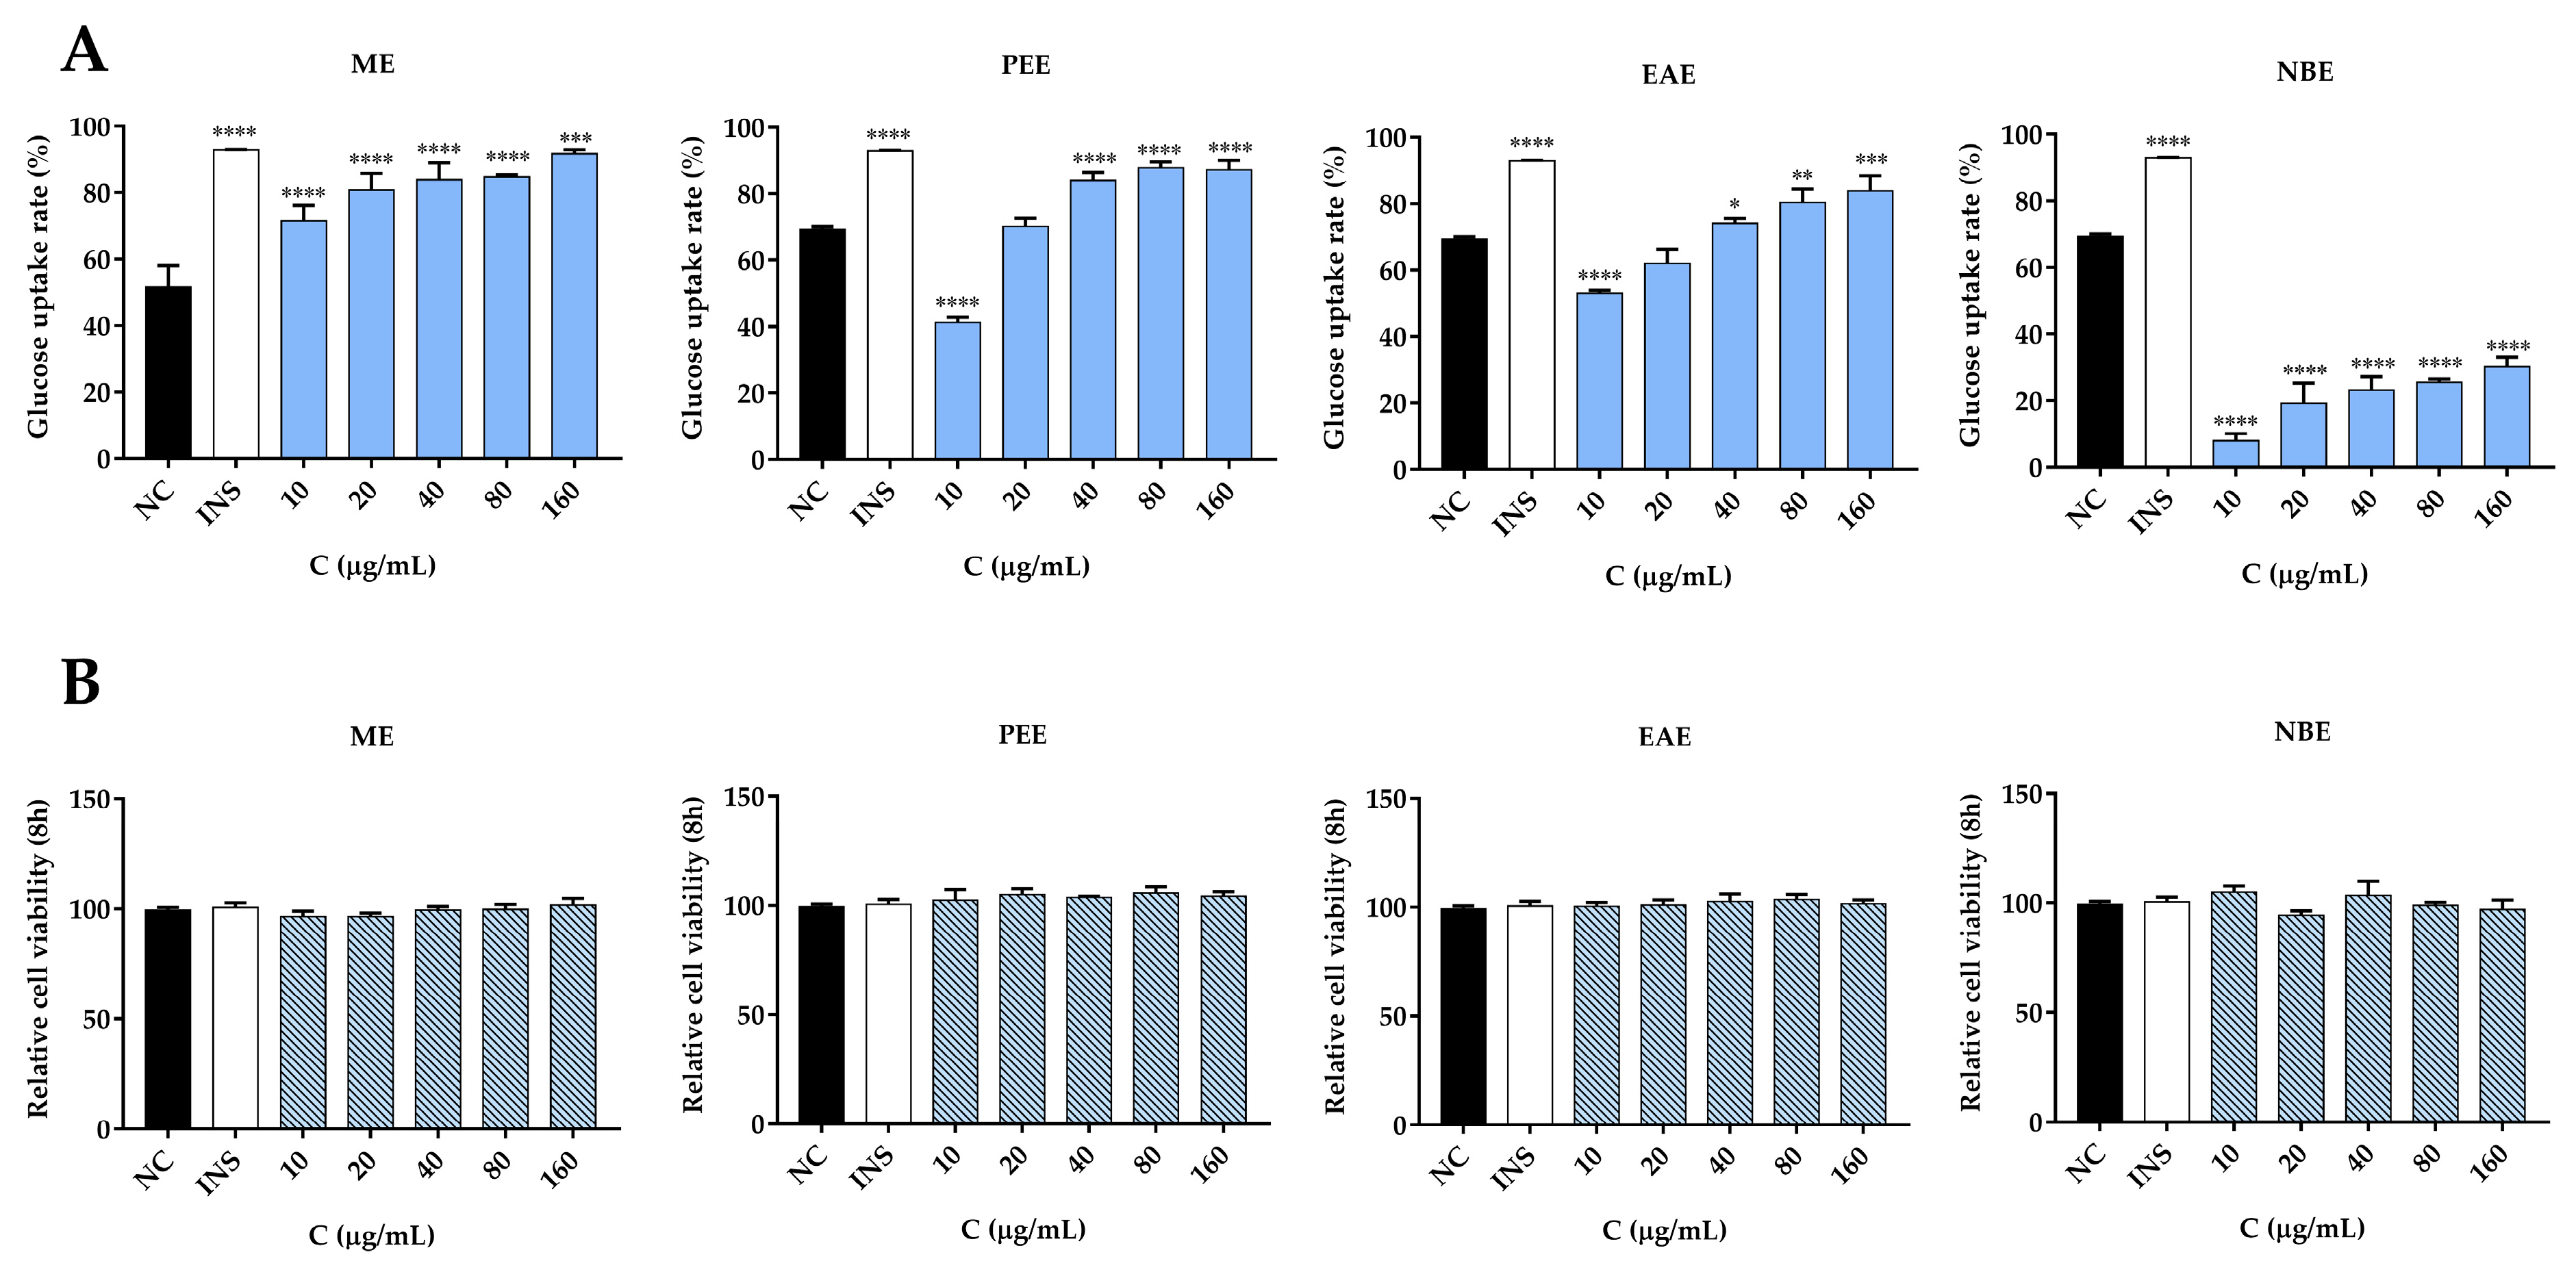
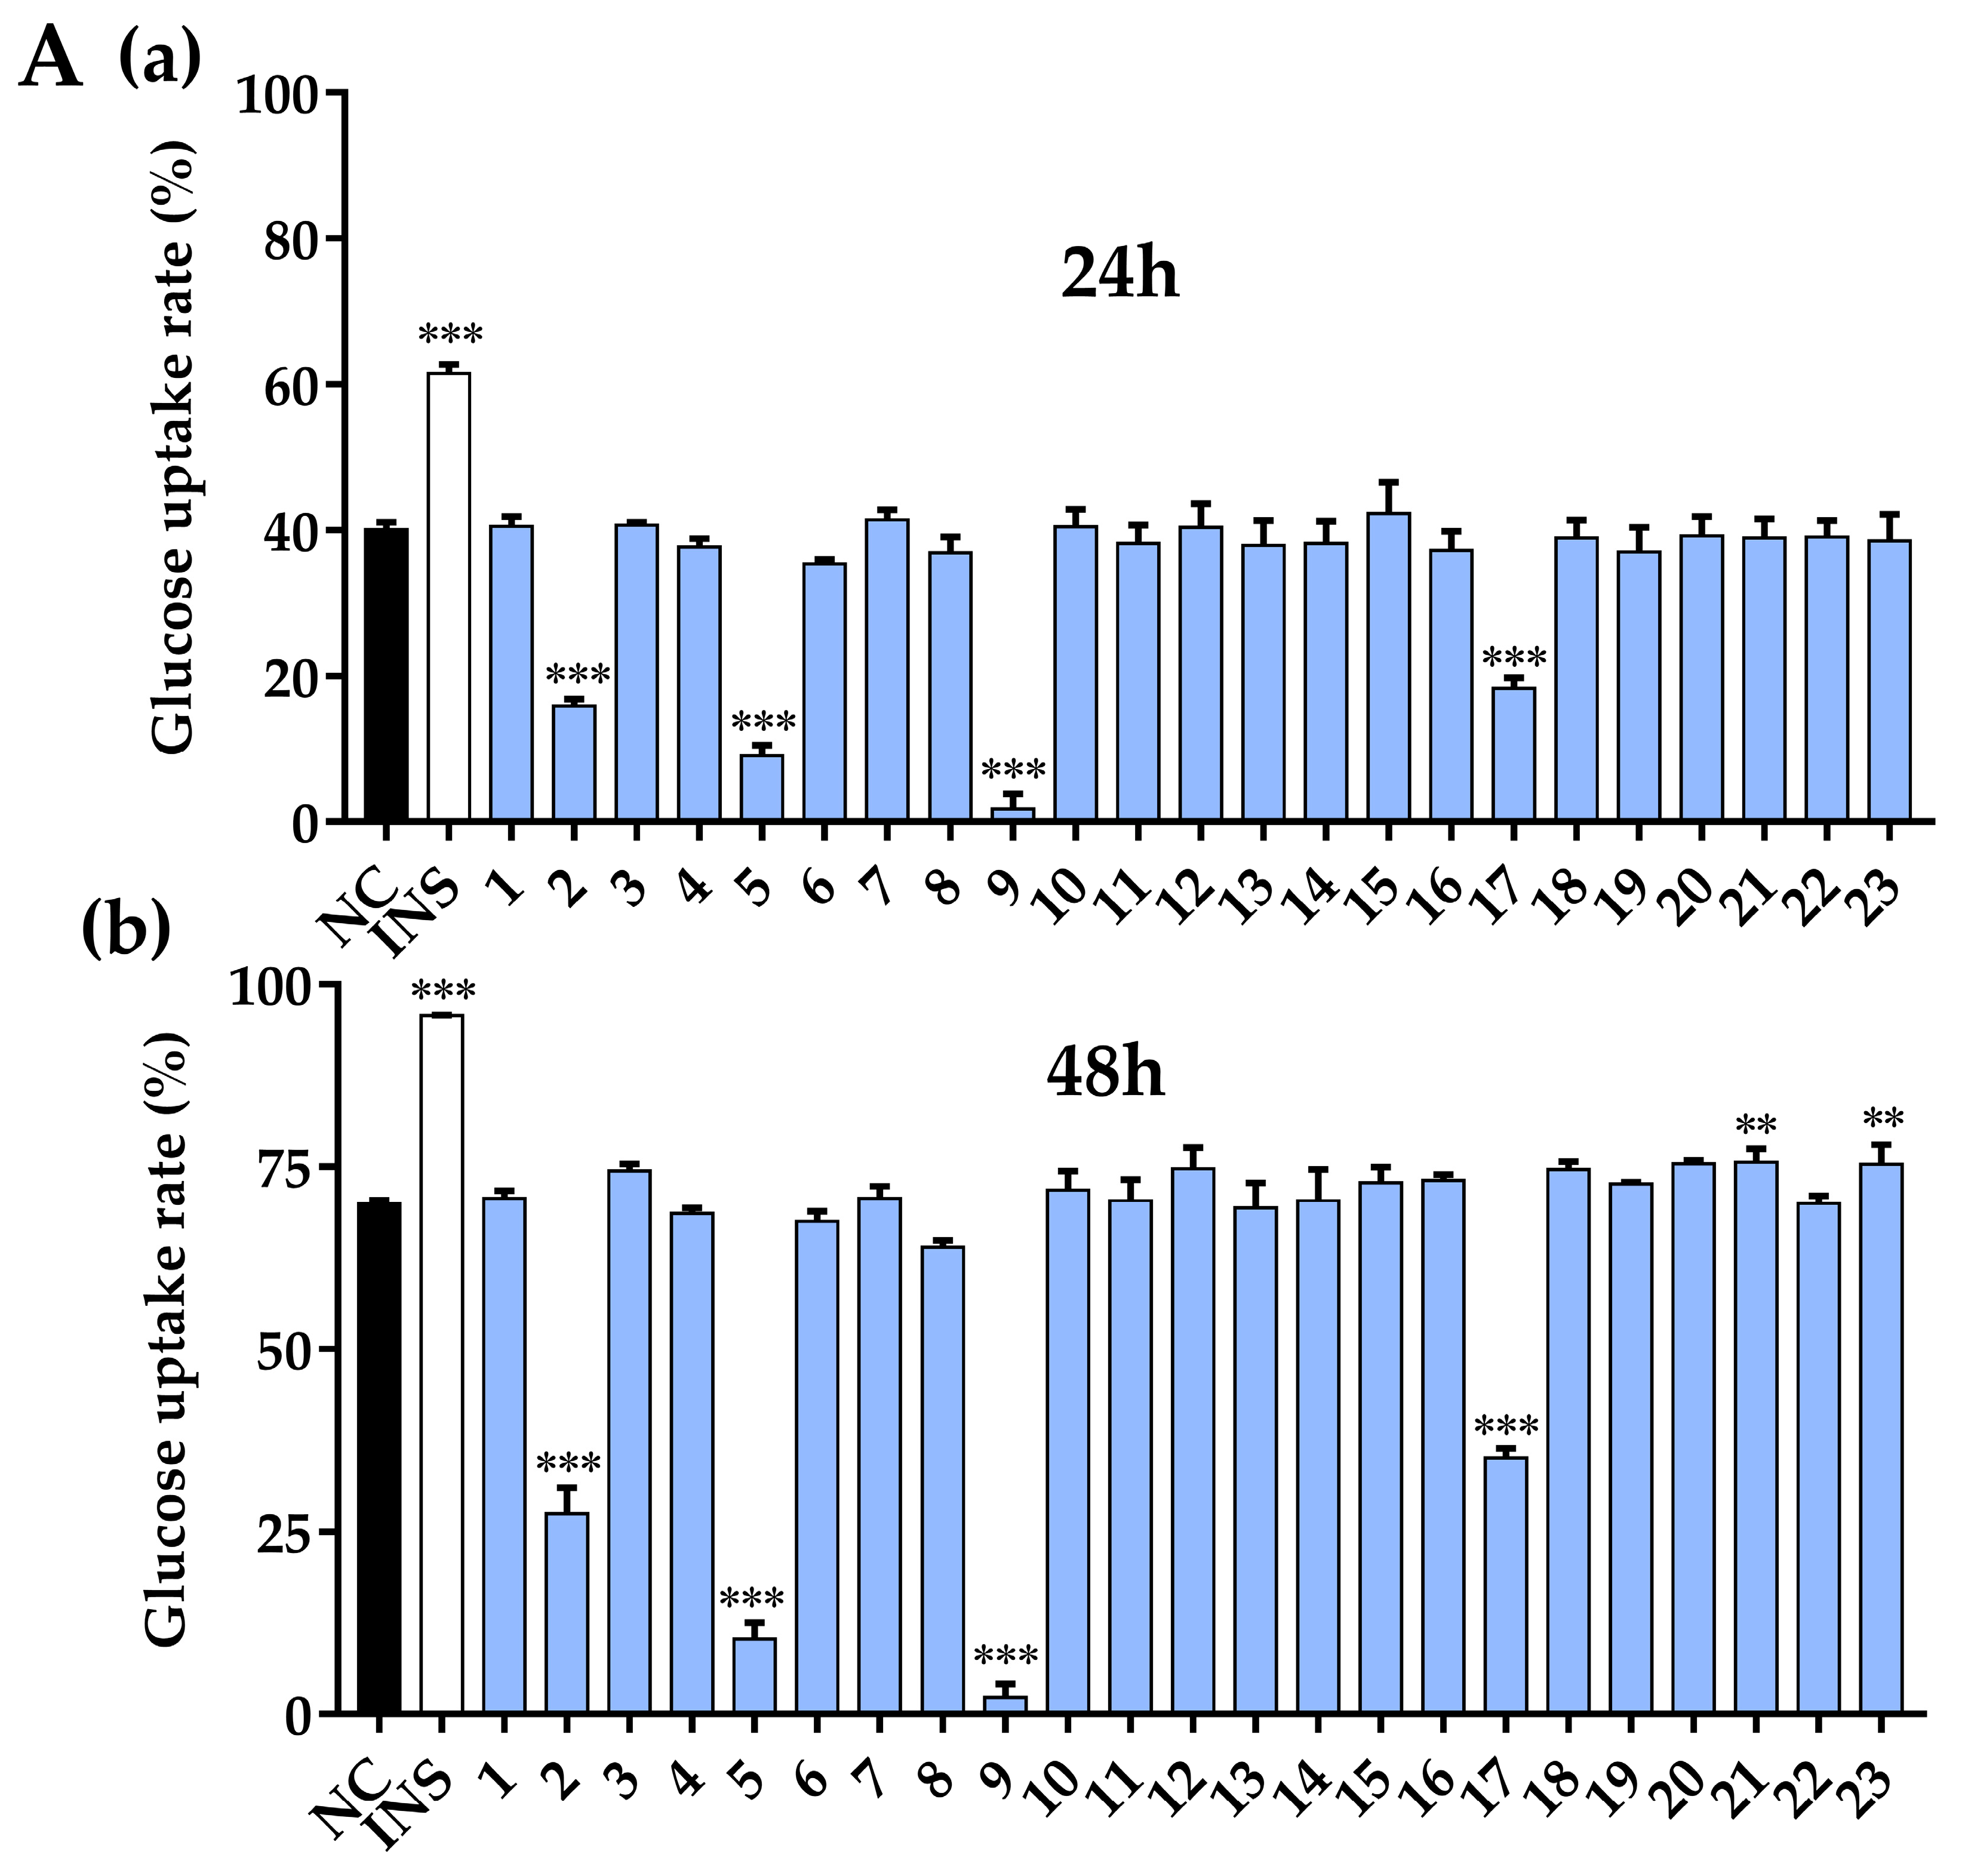
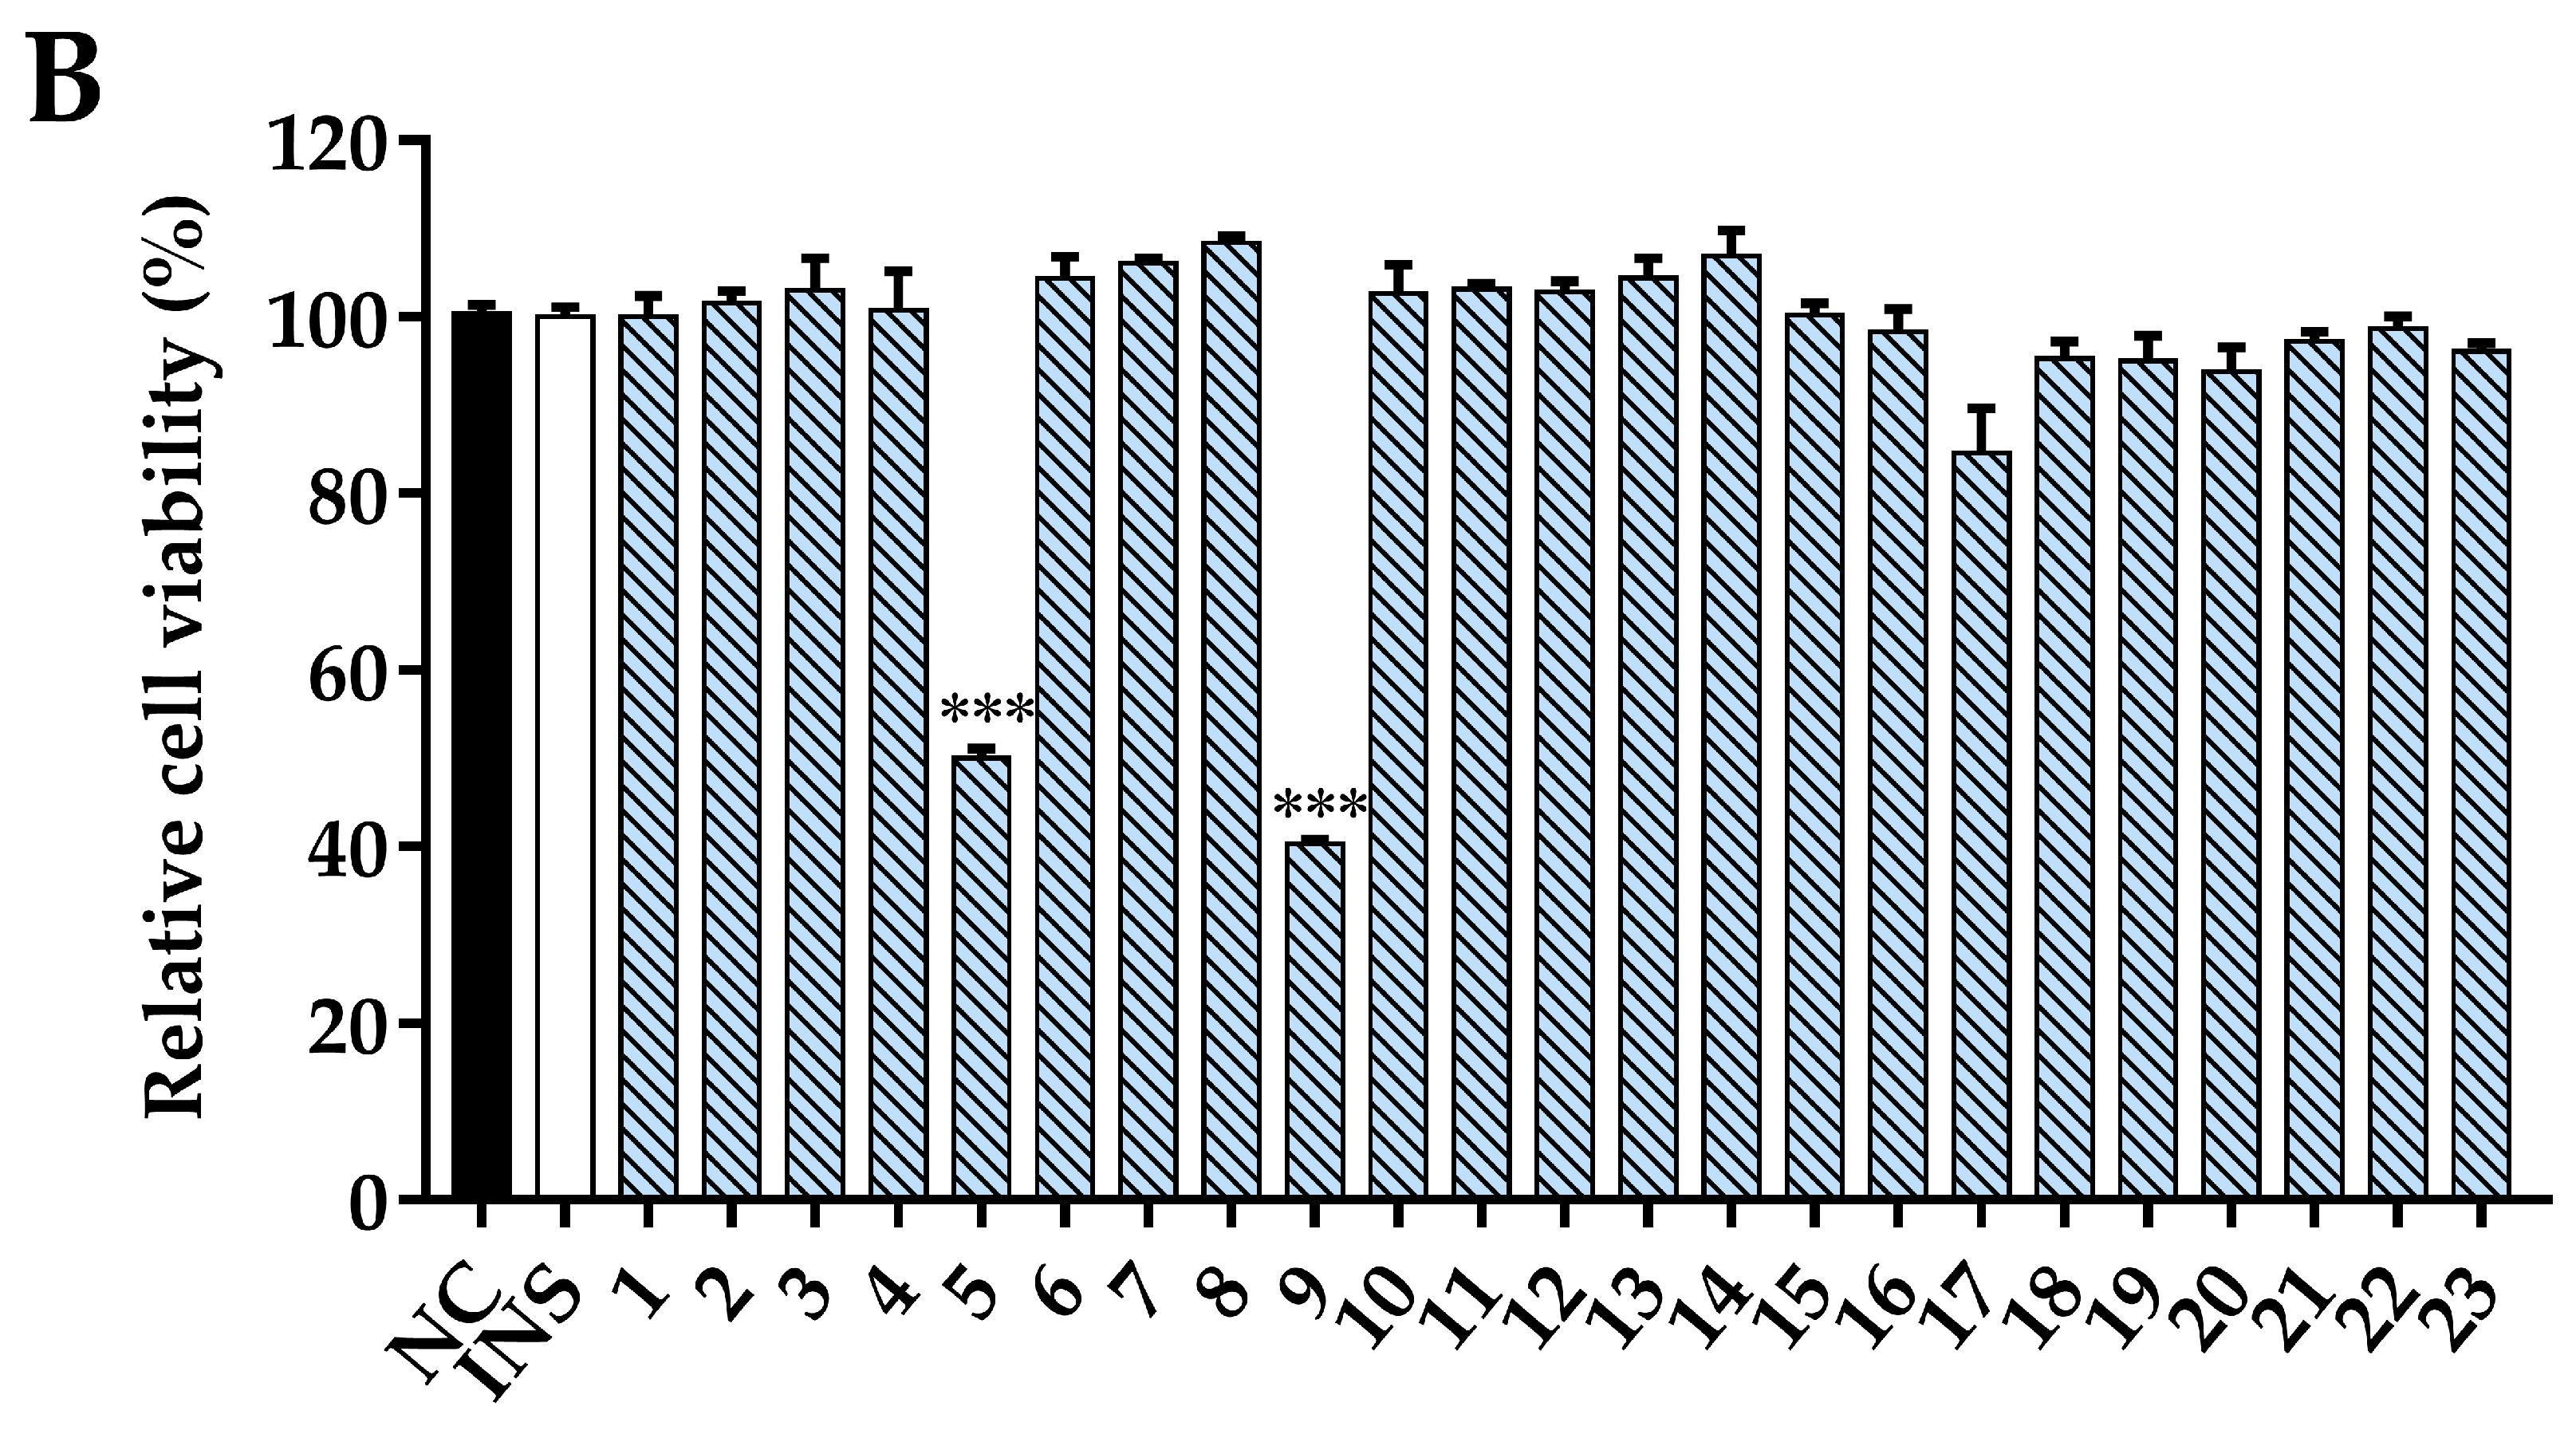
3.8. Glucose Uptake Activity and Cell Viability Assay
4. Conclusions
Author Contributions
Funding
Institutional Review Board Statement
Informed Consent Statement
Data Availability Statement
Acknowledgments
Conflicts of Interest
References
- Kun, N.L.; Zai, Z.Z.; Hua, M.M. Development status, countermeasures and prospects of precious Teak plantation in China. Fujian Fore Sci. Tec. 2011, 38, 173–178. [Google Scholar]
- Pooja, V.; Dinesh, K.Y.; Poonam, K. Tectona grandis (teak)–A review on its phytochemical and therapeutic potential. Nat. Prod. Res. 2018, 33, 2338–2354. [Google Scholar] [CrossRef]
- Pooja, V.; Barkha, D.W.; Poonam, K.; Hiroshi, A.; Yoshinori, F. Tectonaquinones A, B and C: Three new naphthoquinone derivatives from the heartwood of Tectona grandis. Nat. Prod. Res. 2022, 33, 1707–1715. [Google Scholar] [CrossRef]
- Ramachandran, S.; Rajasekaran, A.; Kumar, K.M. Antidiabetic, antihyperlipidemic and antioxidant potential of methanol extract of Tectona grandis flowers in streptozotocin induced diabetic rats. Asian Pac. J. Trop. Med. 2011, 4, 624–631. [Google Scholar] [CrossRef] [PubMed] [Green Version]
- Krishnasamy, R. Antioxidant and antidiabetic activity of Tectona grandis Linn. in alloxan induced albino rats. J. Pharma. Res. 2013, 6, 174–177. [Google Scholar]
- Varma, S.B.; Jaybhaye, D.L. Antihyperglycemic activity of Tectona grandis Linn. bark extract on alloxan induced diabetes in rats. Int. J. Ayurveda Res. 2010, 1, 163–166. [Google Scholar]
- Nidavani, R.; Am, M. Teak (Tectona grandis Linn.): A renowned timber plant with potential medicinal values. J. Pharma. Pharma. Sci. 2014, 6, 48–54. [Google Scholar]
- Pooja; Sharma, V.; Samanta, K.C. Hypoglycemic activity of methanolic extract of Tectona grandis Linn. Root in alloxan induced diabetic rats. J. Appl. Pharma. Sci. 2011, 1, 106–109. [Google Scholar]
- Ghaisas, M.; Navghare, V.; Takawale, A.; Zope, V.; Tanwar, M.; Deshpande, A. Effect of Tectona grandis Linn. on dexamethasone-induced insulin resistance in mice. J Ethnopharmacol. 2009, 122, 304–307. [Google Scholar] [CrossRef]
- Varma, S.B.; Giri, S.P. Study of wound healing activity of Tectona grandis Linn. leaf extract on rats. Anc. Sci. Life. 2013, 32, 241–244. [Google Scholar]
- Rao, K.V.; McBride, T.J.; Oleson, J.J. Recognition and evaluation of lapachol as an antitumor agent. Cancer Res. 1968, 28, 1952–1954. [Google Scholar]
- Bitchagno, G.T.; Fonkeng, L.S.; Kopa, T.K. Antibacterial activity of ethanolic extract and compounds from fruits of Tectona grandis (Verbenaceae). BMC Complem. Altern. Med. 2015, 15, 265–271. [Google Scholar] [CrossRef] [PubMed] [Green Version]
- Asif, M. In vivo analgesic and antiinflammatory effects of Tectona grandis linn. stem bark extracts. MJPS 2011, 9, 1–11. [Google Scholar]
- Krishna, M.S.; Nair, J.A. Antibacterial, cytotoxic and antioxidant potentials from different extracts of leaves, bark andwood of Tectona grandis. Int. J. Pharma. Sci. Drug Res. 2010, 2, 155–158. [Google Scholar]
- Giri, S.P.; Varma, S.B. Analgesic and anti-inflammatory activity of Tectona grandis Linn. stem extract. J. Basic Clin. Physiol. Pharmacol. 2015, 26, 479–484. [Google Scholar] [CrossRef] [PubMed]
- Barnham, K.J.; Masters, C.L.; Bush, A.I. Neurodegenerative diseases and oxidative stress. Nat. Rev. Drug Discov. 2004, 3, 205–214. [Google Scholar] [CrossRef] [PubMed]
- Reuter, S.; Gupta, S.C.; Chaturvedi, M.M.; Aggarwal, B.B. Oxidative stress, inflammation, and cancer: How are they linked? Free Radic. Biol. Med. 2010, 49, 1603–1616. [Google Scholar] [CrossRef] [Green Version]
- Asmat, U.; Abad, K.; Ismail, K. Diabetes mellitus and oxidative stress-A concise review. Saudi Pharm. 2016, 24, 547–553. [Google Scholar] [CrossRef] [PubMed] [Green Version]
- Tang, J.Y.; Peng, S.Y.; Cheng, Y.B.; Wang, C.L.; Farooqi, A.A.; Yu, T.J.; Hou, M.F.; Wang, S.C.; Yen, C.H.; Chan, L.P.; et al. Ethyl acetate extract of Nepenthes adrianii x clipeata induces antiproliferation, apoptosis, and DNA damage against oral cancer cells through oxidative stress. Environ. Toxicol. 2019, 34, 891–901. [Google Scholar] [CrossRef]
- Wang, C.; Levis, G.B.S.; Lee, E.B. Platycodin D and D3 isolated from the root of Platycodon grandiflorum modulate the production of nitric oxide and secretion of TNF-α in activated RAW 264.7 cells. Int. Immunopharmacol. 2004, 4, 1039–1049. [Google Scholar] [CrossRef]
- Xu, Y.; Tang, G.; Zhang, C.; Wang, N.; Feng, Y. Gallic Acid and Diabetes Mellitus: Its Association with Oxidative Stress. Molecules 2021, 26, 7115. [Google Scholar] [CrossRef] [PubMed]
- Pesaro, A.; Bittencourt, M.S.; Franken, M.; Carvalho, J.A.M.; Silva, D.J.B.; Santos, R.D. The Finnish Diabetes Risk Score (FINDRISC) and incident diabetes and low-grade inflammation. Eur. Heart J. 2020, 41, ehaa946.2894. [Google Scholar] [CrossRef]
- Liguori, I.; Russo, G.; Curcio, F.; Bulli, G.; Aran, L.; Della-Morte, D.; Gargiulo, G.; Testa, G.; Cacciatore, F.; Bonaduce, D. Oxidative stress, aging, and diseases. Clin. Interv. Aging 2018, 13, 757–772. [Google Scholar] [CrossRef] [PubMed] [Green Version]
- IDF. IDF Diabetes Atlas Tenth Edition. 2017. Available online: www.diabetesatlas.org (accessed on 1 December 2022).
- Gholamhoseinian, A.; Fallah, H.; Far, F.S. Inhibitory effect of methanol extract of Rosa damascena Mill. flowers on α-glucosidase activity and postprandial hyperglycemia in normal and diabetic rats. Phytomedicine 2009, 16, 935–941. [Google Scholar] [CrossRef]
- Yang, D. Chemical Constituents and Biological Activities of Strawberry and Carambola Fruits. Uni Chin Acade Scie, Beijing, China 2015, S668.4:S601, 41. [Google Scholar]
- Han, Y.Y.; Ren, H.; Wang, D.D.; Wan, H.J.; Yue, J.P. Bio-molecules damage protective effect and free radical scavenging capacity of Coriandrum sativum L. J. Food Sci. Technol. 2020, 35, 64–69. [Google Scholar]
- Yang, S.Q.; Xie, Z.K.; Yu, S.Y.; He, M.; Liu, Q.; Xiao, H.F.; Song, Y.D. Inhibitory effect of crude walnut leaf polysaccharides on oxidative damage of proteins and proliferation of SGC-7901 cells. Am. Biotec. 2010, 16, 199–207. [Google Scholar] [CrossRef]
- Zhao, X.; Tao, J.; Zhang, T.; Jiang, S.; Wei, W.; Han, H.; Shao, Y.; Zhou, G.; Yue, H. Resveratroloside alleviates postprandial hyperglycemia in diabetic mice by competitively inhibiting α-glucosidase. Agric. Food Chem. 2019, 67, 2886–2893. [Google Scholar] [CrossRef]
- Hui, S.; Yun, F.Z.; Hui, X.H.; Hui, X.; Chao, C.W.; LIU, D.; Zhang, W.W.; Yun, F.Z.; Peng, F.T.; Jun, L. Study on chemical constituents of fruit shells of Agarwood Yunnanensis. Chin. Tradit. Herbal Drugs 2020, 51, 0253–2670. [Google Scholar] [CrossRef]
- Abduwaki, M.; Eshbakova, K.A.; Dong, J.C.; Aisa, H.A. Flavonoids from Flowers of Hyssopus cuspidatus. Chem. Nat. Compounds 2014, 50, 915–917. [Google Scholar] [CrossRef]
- Wang, X.G.; Wei, X.Y.; Huang, X.Y.; Shen, L.T.; Tian, Y.Q.; Xu, H.H. Insecticidal constructure and bioactivities of compounds from ficus sarmentosa var. henryi. Agric. Sci. China 2011, 10, 1402–1409. [Google Scholar] [CrossRef]
- Feng, W.S.; Hao, Z.Y.; Zheng, X.K.; Kuang, H.X. Studies on the chemical constituents of koran leaf. Acta Pharm. Sin. 2007, 06, 625–630. [Google Scholar] [CrossRef]
- Sathiamoorthy, B.; Gupta, P.; Kumar, M.; Chaturvedi, A.K.; Shukla, P.; Maurya, R. New antifungal flavonoid glycoside from Vitex negundo. Bioorg. Med. Chem. Lett. 2007, 17, 239–242. [Google Scholar] [CrossRef] [PubMed]
- Chen, F.Z.; Xiang, Q.X.; Li, S.H. Studies on the chemical constituents of the leaves of the relict plant Alsophila spinulosa. Acta Bot. Boreal Occident Sin. 2008, 1246–1249. [Google Scholar]
- Yu, P.C.; Lei, L.; Yu, H.Z.; Jing, W.; Yong, J.; Peng, F.T. Chemical constituents from Sappan Lignum. J. Chin. Pharma Sci. 2008, 82–86. [Google Scholar]
- Tao, L.; Huang, J.C.; Zhao, Y.P.; Li, C. Studies on chemical constituents of buddlejae herba. J. Tradit. Chin. Med. 2009, 34, 3043–3046. [Google Scholar]
- Huang, R.; Wang, T.; Xie, X.S. Secondary Metabolites from an Endophytic Fungus Nigrospora sp. Chem. Nat. Compd. 2016, 52, 697–699. [Google Scholar] [CrossRef]
- Wang, L.L.; Li, Y.B.; Lai, X.P.; Feng, F.; Zhou, Y.J. Study on anti-aging active components of Morinda officinalis (II). Cent. South Pharm. 2011, 9, 495–498. [Google Scholar]
- Yin, R.L.; Foo, Y.L. Flavonoid and phenolic glycosides from Salvia officinalis. Phytochemistry. 2000, 55, 263–267. [Google Scholar] [CrossRef]
- Jia, Z.B.; Chen, W.W.; Jiang, J.X.; Ding, X.L. Study on the chemical constituents of Anthraquinones in Cassia Seed. Chem. Indu. Fore. Prod. 2009, 29, 100–102. [Google Scholar]
- Hideji, I.; Yafang, Q.; Koichi, T. Anthraquinones, naphthoquinones and naphthohydroquinones from Rubia oncotricha. Phytochemistry 1991, 30, 637–640. [Google Scholar] [CrossRef]
- Zhao, F.; Wang, S.J.; Wu, X.L.; Yu, Y.; Yue, Z.G.; Liu, B.; Lin, S.; Zhu, C.G.; Yang, Y.C.; Shi, J.G. Chemical constituents of Anthraquinones in Euphorbia officinalis. J. Tradit. Chin. Med. 2011, 36, 2980–2986. [Google Scholar]
- Serrilli, A.M.; Ramunno, A.; Rullo, R.; Ballero, M.; Serafini, M.; Bianco, A. The occurrence of phenyl propanoid glycosides in endemicTeucriumspecies. Nat. Prod. Res. 2007, 21, 814–818. [Google Scholar] [CrossRef] [PubMed]
- Wang, R.-P.; Lin, H.-W.; Li, L.-Z.; Gao, P.-Y.; Xu, Y.; Song, S.-J. Monoindole alkaloids from a marine sponge Mycale fibrexilis. Biochem. Syst. Ecol. 2012, 43, 210–213. [Google Scholar] [CrossRef]
- Zhu, J.X.; Ren, J.; Qin, J.; Cheng, X.R.; Zeng, Q.; Zhang, F.; Yan, S.K.; Jin, H.Z.; Zhang, W.D. Phenylpropanoids and lignanoids from Euonymus acanthocarpus. Arch. Pharmacal. Res. 2012, 35, 1739–1747. [Google Scholar] [CrossRef] [PubMed]
- Wang, H.-Y.; Liu, K.; Wang, R.-X.; Qin, S.-H.; Wang, F.-L.; Sun, J.-Y. Two new triterpenoids fromNauclea officinalis. Nat. Prod. Res. 2014, 29, 644–649. [Google Scholar] [CrossRef]
- Seidel, V.; Bailleul, F.; Waterman, P.G. Novel Oligorhamnosides from the Stem Bark of Cleistopholis glauca. J. Nat. Prod. 1999, 63, 6–11. [Google Scholar] [CrossRef]
- Lourith, N.; Katayama, T.; Ishikawa, K.; Suzuki, T. Biosynthesis of a syringyl 8-O-4′ neolignan in Eucommia ulmoides: Formation of syringylglycerol-8-O-4′-(sinapyl alcohol) ether from sinapyl alcohol. J. Wood Sci. 2005, 51, 379–386. [Google Scholar] [CrossRef]
- Kikuzaki, H.; Kayano, S.-I.; Fukutsuka, N.; Aoki, A.; Kasamatsu, K.; Yamasaki, Y.; Mitani, T.; Nakatani, N. Abscisic Acid Related Compounds and Lignans in Prunes (Prunus domestica L.) and Their Oxygen Radical Absorbance Capacity (ORAC). J. Agric. Food Chem. 2003, 52, 344–349. [Google Scholar] [CrossRef]
- Xing, Q.; Yang, K.; Wang, Y.; Yang, R.Y.; Wang, C.Y. Shao Changlun.1 marine-derived fungus Nigrospora sp. Anthraquinone compounds and their biological activities. Chin Mar. Drugs 2014, 33, 8–14. [Google Scholar] [CrossRef]
- Zhang, Y.; DeWitt, D.L.; Murugesan, S.; Nair, M.G. Novel Lipid-Peroxidation- and Cyclooxygenase-Inhibitory Tannins fromPicrorhiza kurroa Seeds. Chem. Biodivers. 2004, 1, 426–441. [Google Scholar] [CrossRef]
- BAI, S.J.; Tian, Y.X.; Wang, Y.; Chen, X.X.; Zhao, Y.C.; Jiang, R.; Xing, D.; Ye, G.M. Bei Qinglongyi chloroform part of the chemical composition of the separation and identification. J. Med. Chem. 2017, 27, 52–56. [Google Scholar] [CrossRef]
- Ramdani, E.D.; Marlupi, U.D.; Sinambela, J.; Tjandrawinata, R.R. Isolation and identification of compounds from Phaleria macrocarpa (Scheff.) Boerl fruit extract. Asian Pac. J. Trop. Biomed. 2017, 7, 300–305. [Google Scholar] [CrossRef]
- Aydin, T.; Cakir, A.; Kazaz, C.; Bayrak, N.; Bayir, Y.; Taşkesenligil, Y. Insecticidal Metabolites from the Rhizomes of Veratrum albumagainst Adults of Colorado Potato Beetle, Leptinotarsa decemlineata. Chem. Biodivers. 2014, 11, 1192–1204. [Google Scholar] [CrossRef]
- Balakrishnan, B.; Paramasivam, S.; Arulkumar, A. Evaluation of the lemongrass plant (Cymbopogon citratus) extracted in different solvents for antioxidant and antibacterial activity against human pathogens. Asian Pac. J. Trop. Dis. 2014, 4, S134–S139. [Google Scholar] [CrossRef]
- Wen, L.; Jiang, Y.; Yang, J.; Zhao, Y.; Tian, M.; Yang, B. Structure, bioactivity, and synthesis of methylated flavonoids. Ann. N. Y. Acad. Sci. 2017, 1398, 120–129. [Google Scholar] [CrossRef] [PubMed]
- Klarić, D.; Klarić, I.; Mornar, A.; Velić, N.; Velić, D. Assessment of Bioactive Phenolic Compounds and Antioxidant Activity of Blackberry Wines. Foods 2020, 9, 1623. [Google Scholar] [CrossRef] [PubMed]
- Hossain, M.A.; Rahman, S.M. Total phenolics, flavonoids and antioxidant activity of tropical fruit pineapple. Food Res. Int. 2011, 44, 672–676. [Google Scholar] [CrossRef]
- Chen, C.-W.; Chang, C.-Y.; Chiang, S.-H. The Inhibition Effect of Cell DNA Oxidative Damage and LDL Oxidation by Bovine Colostrums. Molecules 2016, 21, 1378. [Google Scholar] [CrossRef] [PubMed] [Green Version]
- Sahu, B.D.; Kuncha, M.; Sindhura, G.J.; Sistla, R. Hesperidin attenuates cisplatin-induced acute renal injury by decreasing oxidative stress, inflammation and DNA damage. Phytomedicine 2013, 20, 453–460. [Google Scholar] [CrossRef] [PubMed]
- Lyras, L.; Cairns, N.J.; Jenner, A.; Jenner, P.; Halliwell, B. An Assessment of Oxidative Damage to Proteins, Lipids, and DNA in Brain from Patients with Alzheimer’s Disease. J. Neurochem. 2002, 68, 2061–2069. [Google Scholar] [CrossRef] [PubMed]
- Sharma, P.; Jha, A.B.; Dubey, R.S.; Pessarakli, M. Reactive Oxygen Species, Oxidative Damage, and Antioxidative Defense Mechanism in Plants under Stressful Conditions. J. Bot. 2012, 2012, 217037. [Google Scholar] [CrossRef] [Green Version]
- Dion, M.Z.; Wang, Y.J.; Bregante, D.; Chan, W.; Andersen, N.; Hilderbrand, A.; Leiske, D.; Salisbury, C.M. The Use of a 2,2’-Azobis (2-Amidinopropane) Dihydrochloride Stress Model as an Indicator of Oxidation Susceptibility for Monoclonal Antibodies. J. Pharm. Sci. 2018, 107, 550–558. [Google Scholar] [CrossRef] [PubMed]
- Aryal, B.P.; Jeong, J.; Rao, V.A. Abstract 1825: Carbonylation and degradation of cardiac myosin binding protein C serves as an indicator of doxorubicin-induced cardiotoxicity. Cancer Res 2015, 75, 1825. [Google Scholar] [CrossRef]
- Murali, K.M.; Konda, K.; Shivakrishna, K.; Kankanala, S.; Raju, S.Y.; Naval, C.; Maddury, J.; Sujatha, P.; Vijay, K.K. Assessment of oxidative stress markers and carotid artery intima-media thickness in elderly patients without and with coronary artery disease. Indian J. Clin. Biochem. 2016, 31, 278–285. [Google Scholar] [CrossRef] [Green Version]
- Ulusoy, S.; Boşgelmez-Tınaz, G.; Seçilmiş-Canbay, H. Tocopherol, Carotene, Phenolic Contents and Antibacterial Properties of Rose Essential Oil, Hydrosol and Absolute. Curr. Microbiol. 2009, 59, 554–558. [Google Scholar] [CrossRef]
- Kalb, D.; Vo, H.D.; Adikari, S.; Hong-Geller, E.; Munsky, B.; Werner, J. Visualization and modeling of inhibition of IL-1β and TNF-α mRNA transcription at the single-cell level. Sci. Rep. 2021, 11, 13692. [Google Scholar] [CrossRef]
- Maleki, S.J.; Crespo, J.F.; Cabanillas, B. Anti-inflammatory effects of flavonoids. Food Chem. 2019, 299, 125124. [Google Scholar] [CrossRef]
- Chen, W.; Xiao, J.; Song, C.; Wu, M.; Du, X.; Wei, D.; Qiao, Y.; Zhang, X.; Qin, J. Bioactivity analysis of pentacyclic triterpenoids isolated from Metrosideros polymorpha. J. Mol. Struct. 2022, 1265, 133395. [Google Scholar] [CrossRef]
- Kroes, B.H.; Berg, A.J.J.V.D.; van Ufford, H.C.Q.; van Dijk, H.; Labadie, R.P. Anti-Inflammatory Activity of Gallic Acid. Planta Medica 1992, 58, 499–504. [Google Scholar] [CrossRef]
- Lim, J.; Ferruzzi, M.G.; Hamaker, B.R. Structural requirements of flavonoids for the selective inhibition of α-amylase versus α-glucosidase. Food Chem. 2021, 370, 130981. [Google Scholar] [CrossRef]
- Yang, Y.; Lei, Z.; Zhao, M.; Wu, C.; Wang, L.; Xu, Y. Microwave-assisted extraction of an acidic polysaccharide from Ribes nigrum L.: Structural characteristics and biological activities. Ind. Crop. Prod. 2020, 147, 112249. [Google Scholar] [CrossRef]
- Amamou, S.; Lazreg, H.; Hafsa, J.; Majdoub, H.; Rihouey, C.; Cerf, D.L. Effect of extraction condition on the antioxidant, antiglycation and α-amylase inhibitory activities of Opuntia macrorhiza fruit peels polysaccharides. LWT 2020, 127, 109411. [Google Scholar] [CrossRef]


| Samples | DPPH Assay A | ABTS Assay B | FRAP Assay C |
|---|---|---|---|
| SC50 (µg/mL) | mmol Trolox/L | mmol Trolox/L | |
| ME | 26.98 ± 2.73 d | 0.83 ± 0.02 b | 0.58 ± 0.00 c |
| PEE | 86.63 ± 4.06 b | 0.91 ± 0.00 a | 1.45 ± 0.04 b |
| EAE | 64.56 ± 1.92 c | 0.98 ± 0.00 a | 2.25 ± 0.04 a |
| NBE | 32.27 ± 2.91 d | 0.95 ± 0.01 a | 2.70 ± 0.02 a |
| WE | 153.7 ± 2.15 a | 0.75 ± 0.01 c | 0.48 ± 0.02 c |
| Ascorbic acid A | 3.39 ± 0.98 e | 0.99 ± 0.00 a | 1.35 ± 0.02 b |
| Compounds | DPPH Assay A | ABTS Assay B | FRAP Assay C |
|---|---|---|---|
| SC50 (µmol/L) | mmol Trolox/L | mmol Trolox/L | |
| 1 | 8.09 ± 1.05 c | 0.08 ± 0.01 d | n.d. |
| 2 | 17.38 ± 1.08 b | 0.92 ± 0.01 a | 0.03 ± 0.01 c |
| 3 | 5.22 ± 0.19 cd | 0.05 ± 0.00 d | 0.01 ± 0.01 c |
| 4 | 31.52 ± 1.75 a | 0.21 ± 0.01 b | 0.02 ± 0.00 c |
| 5 | 9.92 ± 0.36 c | 0.92 ± 0.00 a | 1.02 ± 0.01 a |
| 6 | 22.12 ± 1.24 a | 0.99 ± 0.07 a | 0.37 ± 0.05 b |
| 7 | 16.94 ± 0.67 b | 0.92 ± 0.07 a | 0.33 ± 0.04 b |
| 8 | n.d | 1.05 ± 0.01 a | 0.01 ± 0.00 c |
| 9 | n.d | n.d | n.d |
| 10 | n.d | 0.13± 0.00 c | 0.01 ± 0.01 c |
| 11 | n.d | 0.65 ± 0.00 b | 0.01 ± 0.00 c |
| 12 | n.d | 0.03 ± 0.00 d | n.d |
| 13 | 3.56 ± 0.53 d | 0.04 ± 0.00 d | 0.01± 0.01 c |
| 14 | 25.77 ± 0.57 a | 0.09 ± 0.06 d | 0.03 ± 0.00 c |
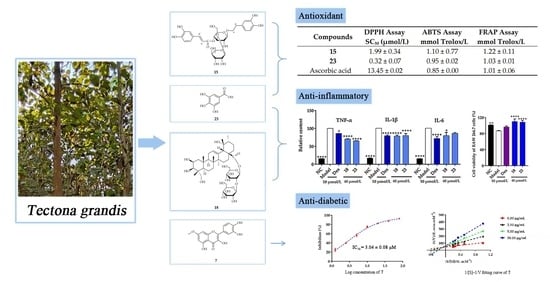
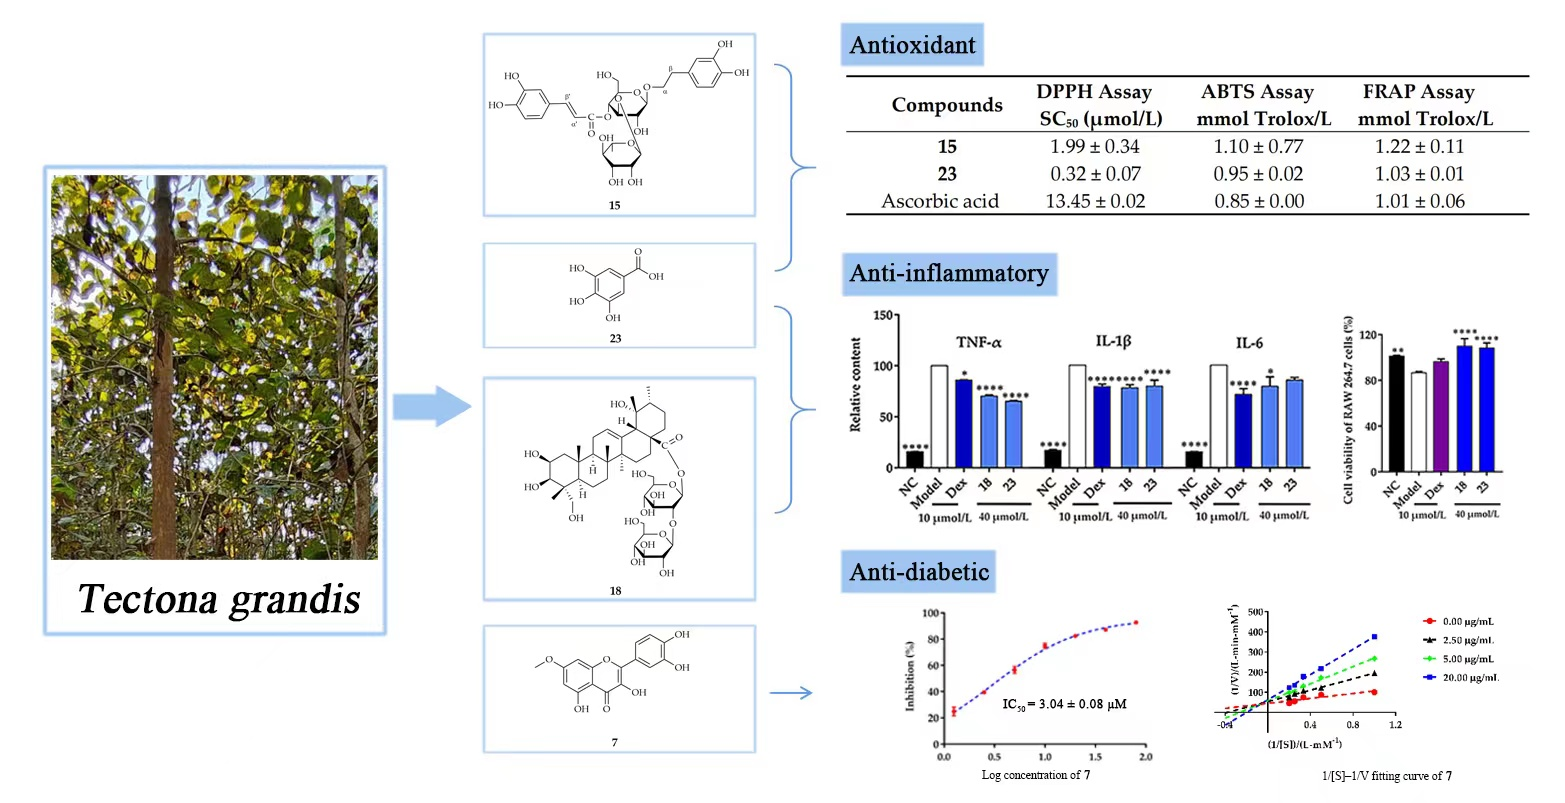
| 15 | 1.99 ± 0.34 d | 1.10 ± 0.77 a | 1.22 ± 0.11 a |
| 16 | 12.31 ± 0.53 b | 0.78 ± 0.01 a | 0.28 ± 0.01 b |
| 17 | n.d | 0.80 ± 0.01 a | n.d |
| 18 | 8.45 ± 0.57 c | n.d | 0.39 ± 0.00 b |
| 19 | 6.17 ± 0.06 c | 0.85 ± 0.03 a | 0.25 ± 0.01 b |
| 20 | 8.66 ± 0.43 c | 0.67 ± 0.01 b | 0.29 ± 0.00 b |
| 21 | 2.61 ± 0.26 d | 0.13 ± 0.01 c | 0.02 ± 0.00 c |
| 22 | n.d | 0.32 ± 0.01 bc | n.d |
| 23 | 0.32 ± 0.07 e | 0.95 ± 0.02 a | 1.03 ± 0.01 a |
| Ascorbic acid A | 13.45 ± 0.02 b | 0.85 ± 0.00 a | 1.01 ± 0.06 a |
| Compounds | Inhibitory Rate (%) A | IC50 (µmol/L) |
|---|---|---|
| 1 | 10.62 ± 1.39 d | >50.00 |
| 2 | 31.35 ± 6.46 c | >50.00 |
| 3 | 29.06 ± 1.86 cd | >50.00 |
| 4 | 68.54 ± 2.90 b | 14.15 a |
| 5 | 69.67 ± 2.20 b | 19.29 a |
| 6 | 12.96 ± 2.08 d | >50.00 |
| 7 | 85.13 ± 0.81 ab | 3.04 b |
| 8 | 1.27 ± 0.25 e | >50.00 |
| 9 | 3.13 ± 4.06 e | >50.00 |
| 10 | 1.77 ± 4.08 e | >50.00 |
| 11 | 4.57 ± 4.37 e | >50.00 |
| 12 | 53.04 ± 0.36 bc | >50.00 |
| 13 | 13.84 ± 0.93 d | >50.00 |
| 14 | 20.03 ± 2.44 c | >50.00 |
| 15 | 18.30 ± 2.22 cd | >50.00 |
| 16 | 12.53 ± 0.76 d | >50.00 |
| 17 | 8.69 ± 1.94 de | >50.00 |
| 18 | 22.91 ± 1.10 c | >50.00 |
| 19 | 57.40 ± 1.32 bc | >50.00 |
| 20 | 40.30 ± 0.76 c | >50.00 |
| 21 | 21.41 ± 4.01 c | >50.00 |
| 22 | 20.58 ± 1.30 c | >50.00 |
| 23 | 21.89 ± 3.03 c | >50.00 |
| Acarbose | 99.53 ± 0.01 a | 0.062 c |
Disclaimer/Publisher’s Note: The statements, opinions and data contained in all publications are solely those of the individual author(s) and contributor(s) and not of MDPI and/or the editor(s). MDPI and/or the editor(s) disclaim responsibility for any injury to people or property resulting from any ideas, methods, instructions or products referred to in the content. |
© 2023 by the authors. Licensee MDPI, Basel, Switzerland. This article is an open access article distributed under the terms and conditions of the Creative Commons Attribution (CC BY) license (https://creativecommons.org/licenses/by/4.0/).
Share and Cite
Han, M.; Yang, F.; Zhang, K.; Ni, J.; Zhao, X.; Chen, X.; Zhang, Z.; Wang, H.; Lu, J.; Zhang, Y. Antioxidant, Anti-Inflammatory and Anti-Diabetic Activities of Tectona grandis Methanolic Extracts, Fractions, and Isolated Compounds. Antioxidants 2023, 12, 664. https://doi.org/10.3390/antiox12030664
Han M, Yang F, Zhang K, Ni J, Zhao X, Chen X, Zhang Z, Wang H, Lu J, Zhang Y. Antioxidant, Anti-Inflammatory and Anti-Diabetic Activities of Tectona grandis Methanolic Extracts, Fractions, and Isolated Compounds. Antioxidants. 2023; 12(3):664. https://doi.org/10.3390/antiox12030664
Chicago/Turabian StyleHan, Mei, Fengxian Yang, Kun Zhang, Jiyan Ni, Xia Zhao, Xuelin Chen, Zhennan Zhang, Hanlei Wang, Jing Lu, and Yumei Zhang. 2023. "Antioxidant, Anti-Inflammatory and Anti-Diabetic Activities of Tectona grandis Methanolic Extracts, Fractions, and Isolated Compounds" Antioxidants 12, no. 3: 664. https://doi.org/10.3390/antiox12030664