


Characterization of Maternal Circulating MicroRNAs in Obese Pregnancies and Gestational Diabetes Mellitus
 , , , , , , and
Abstract
:
1. Introduction
2. Materials and Methods
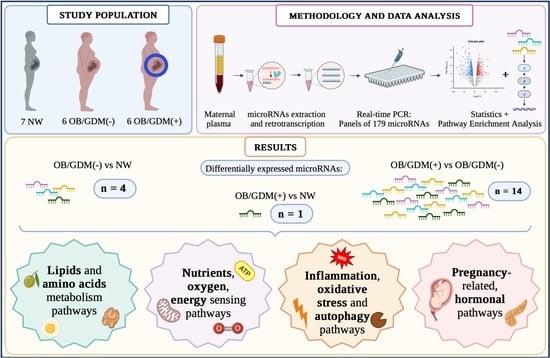
2.1. Population
- -
- Normal Weight (NW): 18 kg/m2 ≤ BMI < 25 kg/m2, n = 7;
- -
- Obese without comorbidities (OB/GDM(−)): BMI ≥ 30 kg/m2, n = 6;
- -
- Obese with GDM (OB/GDM(+)): BMI ≥ 30 kg/m2, n = 6.
- -
- NW: 11.5 ≤ GWG ≤ 16 Kg;
- -
- OB: 5 ≤ GWG ≤ 9 Kg.
2.2. Maternal Plasma Collection
2.3. MicroRNA Profiling
2.4. Data Analysis and Statistics
3. Results
3.1. Clinical Characteristics of the Study Population
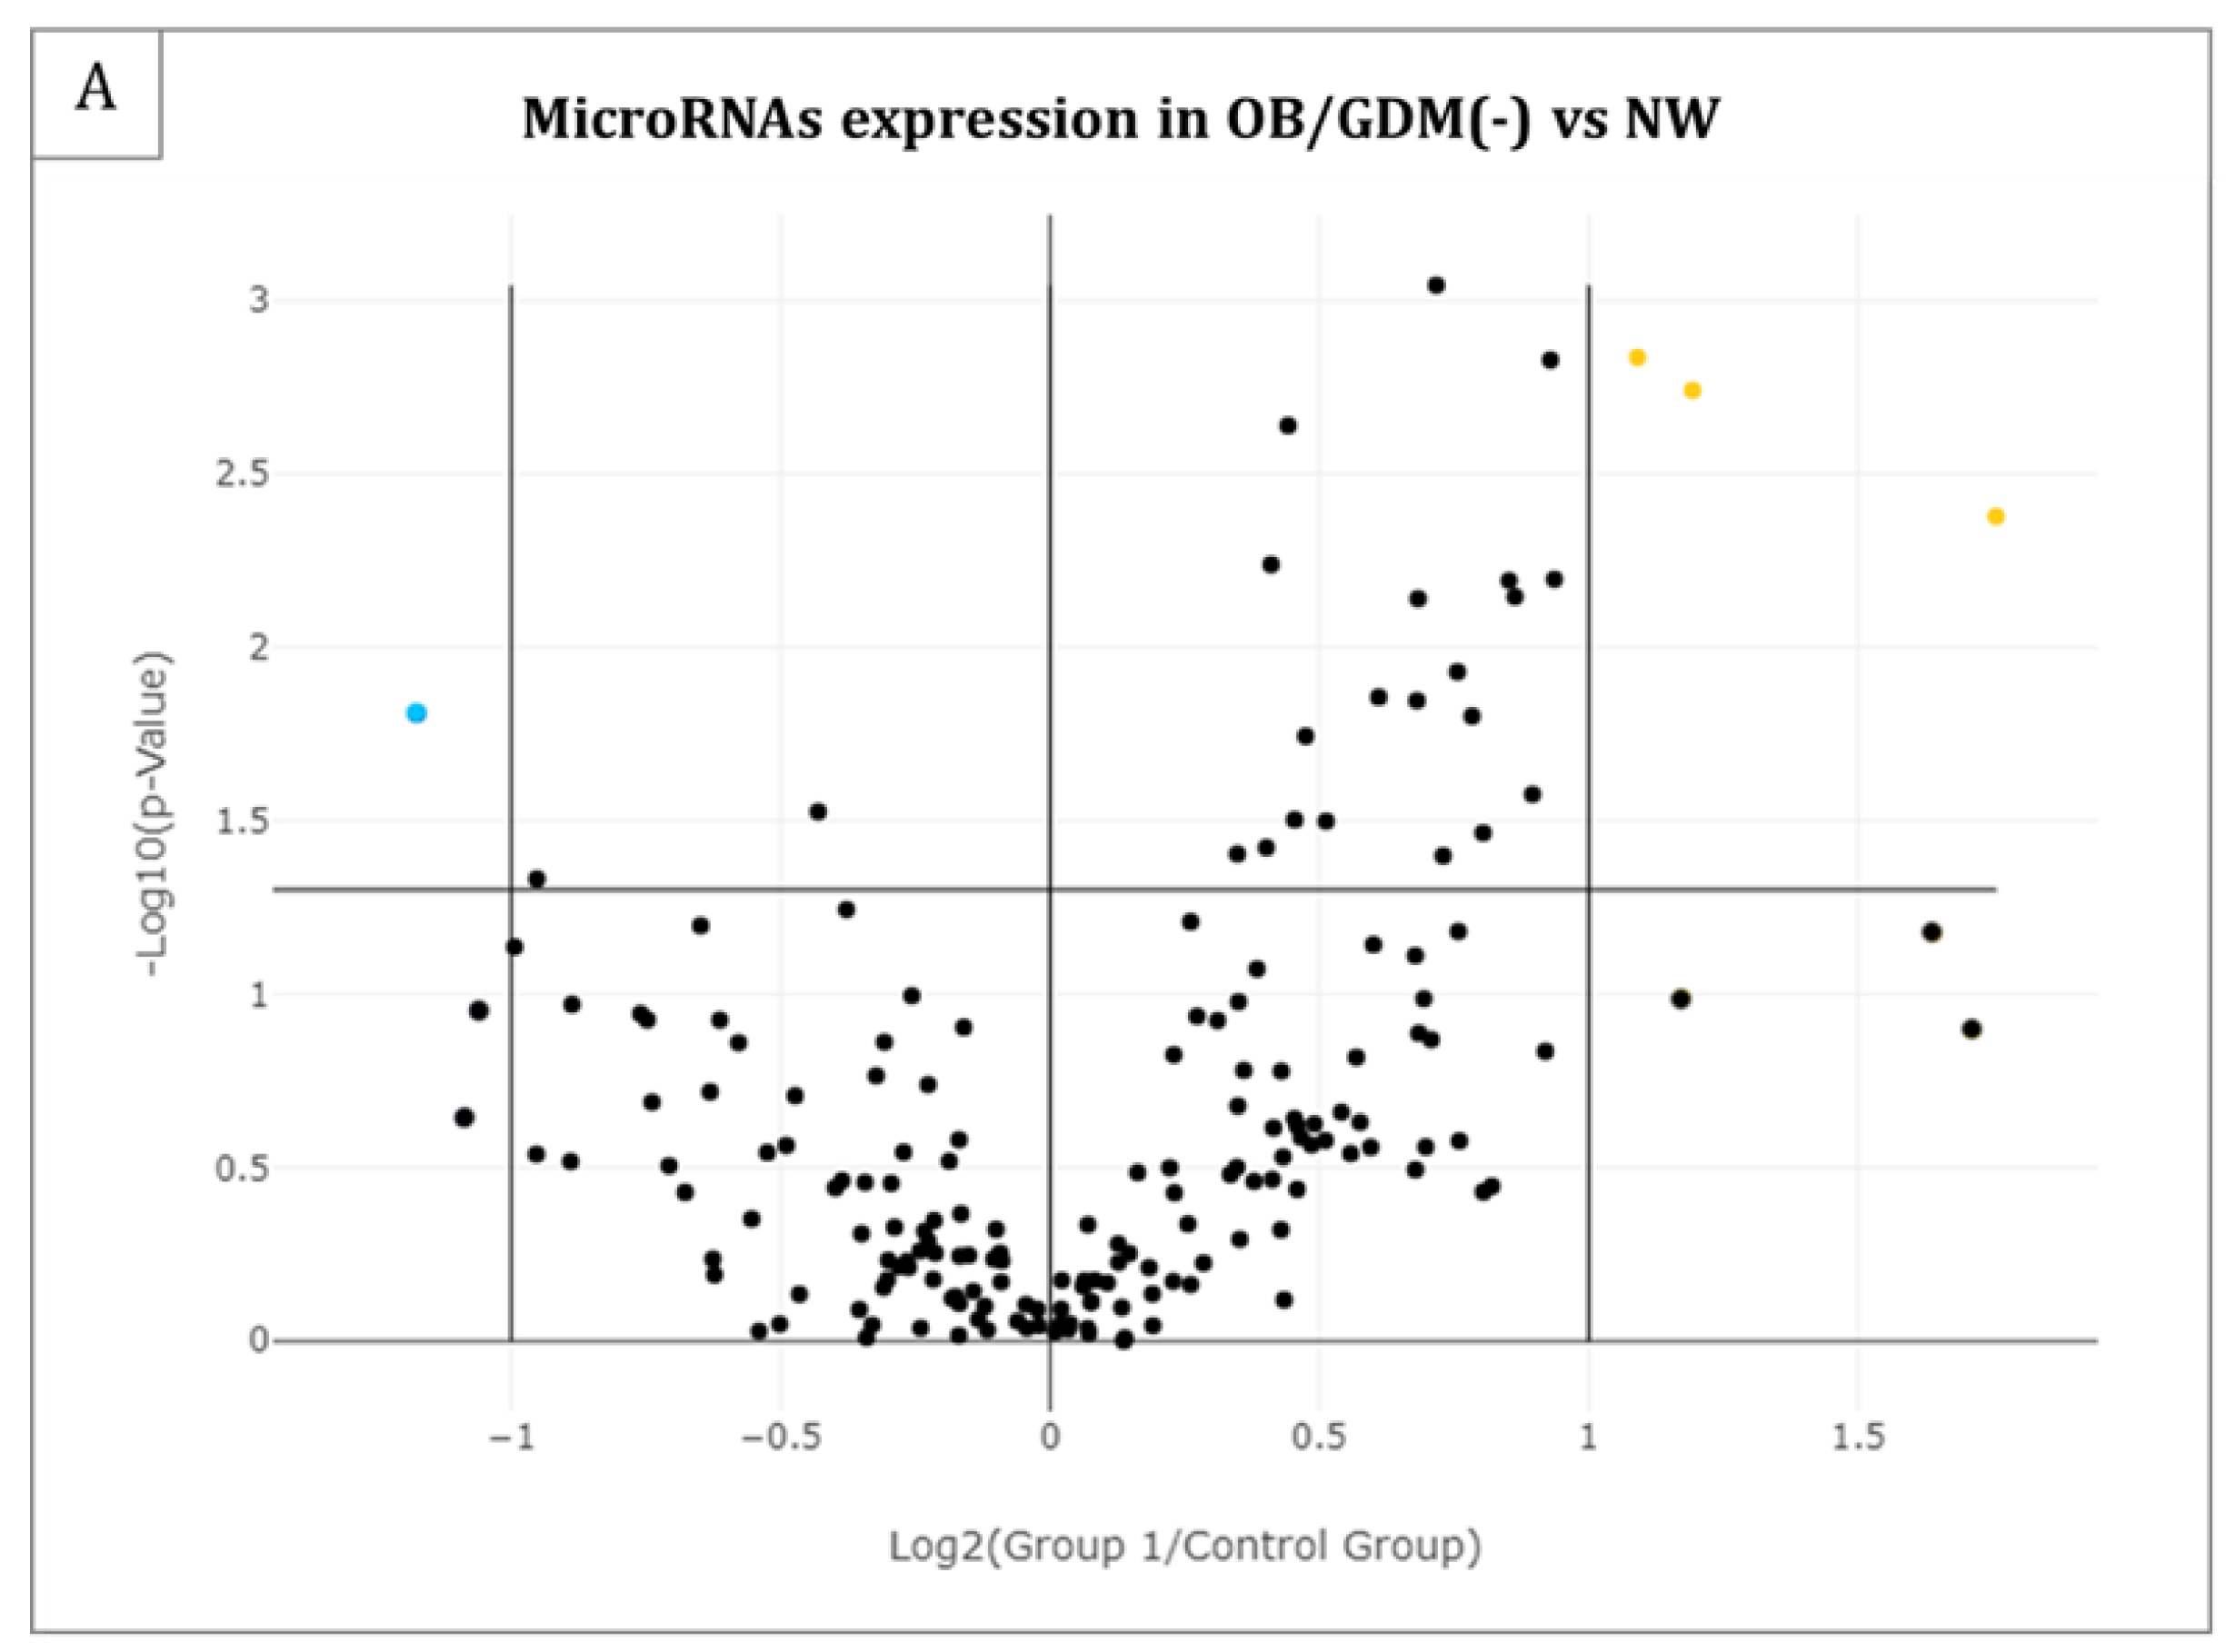
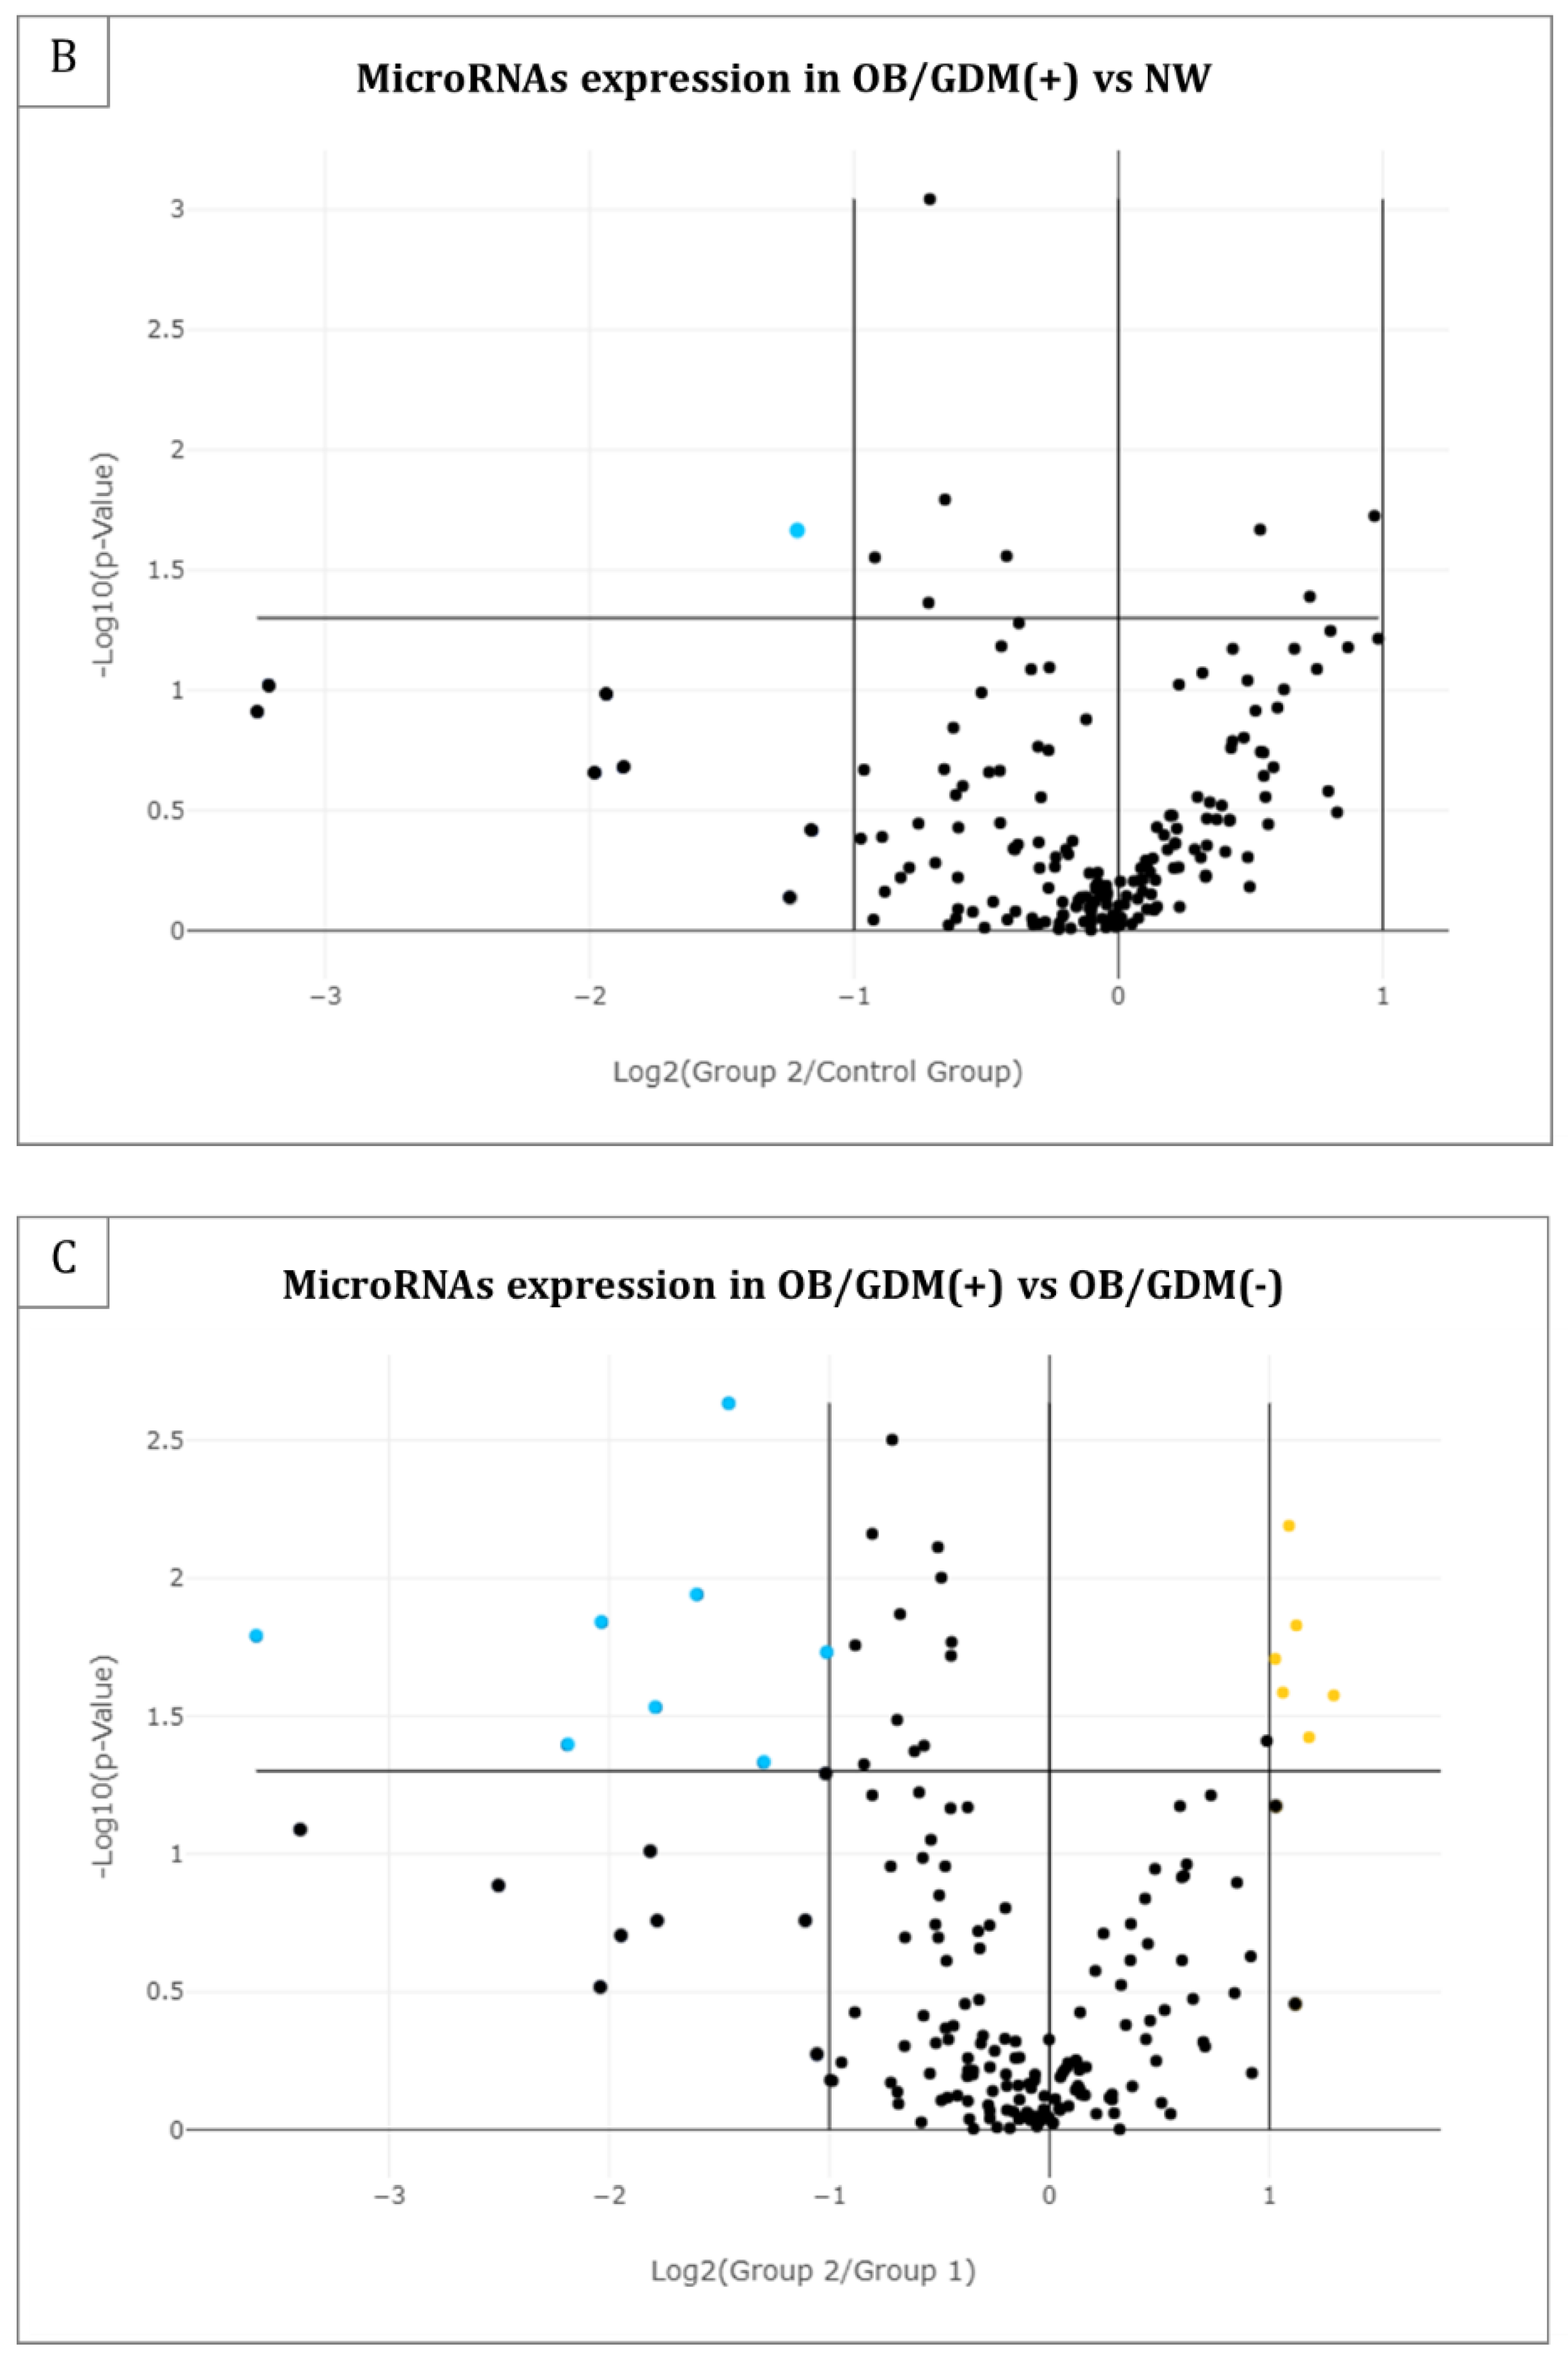
3.2. MicroRNA Profiling in Maternal Plasma
- -
- SREBF (Sterol Regulatory Element-Binding transcription Factor) and miR33 in cholesterol and lipid homeostasis (p = 0.017981);
- -
- Insulin signalling (p = 0.042847).
- -
- TGF-beta (Transforming Growth Factor-beta) signalling pathway (p = 0.005859);
- -
- mTOR (mammalian Target Of Rapamycin) signalling pathway (p = 0.044364),
- -
- Insulin signalling (p = 0.013768).
4. Discussion
4.1. Lipids, Fatty Acids, and Lysine Metabolism Pathways
4.2. Valine, Leucine, and Isoleucine Metabolism Pathways
4.3. Vitamin B6 Signalling Pathway
4.4. mTOR Signalling Pathway
4.5. AMPK Signalling Pathway
4.6. TGF-Beta Signalling Pathway
4.7. FoxO Signalling Pathway
4.8. HIF-1 Signalling Pathway
4.9. Insulin Signalling Pathway
4.10. Germinal Cells, Gametes, and Pluripotency-Related Pathways
4.11. Strengths and Limitations
5. Conclusions
Supplementary Materials
Author Contributions
Funding
Institutional Review Board Statement
Informed Consent Statement
Data Availability Statement
Acknowledgments
Conflicts of Interest
References
- Barker, D.J.P.; Thornburg, K.L.; Osmond, C.; Kajantie, E.; Eriksson, J.G. Beyond birthweight: The maternal and placental origins of chronic disease. J. Dev. Orig. Health Dis. 2010, 1, 360–364. [Google Scholar] [CrossRef] [PubMed]
- Parrettini, S.; Caroli, A.; Torlone, E. Nutrition and Metabolic Adaptations in Physiological and Complicated Pregnancy: Focus on Obesity and Gestational Diabetes. Front. Endocrinol. (Lausanne) 2020, 11, 611929. [Google Scholar] [CrossRef] [PubMed]
- Parisi, F.; Milazzo, R.; Savasi, V.M.; Cetin, I. Maternal Low-Grade Chronic Inflammation and Intrauterine Programming of Health and Disease. Int. J. Mol. Sci. 2021, 22, 1732. [Google Scholar] [CrossRef] [PubMed]
- Vena, F.; D’Ambrosio, V.; Paladini, V.; Saluzzi, E.; Di Mascio, D.; Boccherini, C.; Spiniello, L.; Mondo, A.; Pizzuti, A.; Giancotti, A. Risk of neural tube defects according to maternal body mass index: A systematic review and meta-analysis. J. Matern. Fetal. Neonatal. Med. 2022, 35, 7296–7305. [Google Scholar] [CrossRef]
- Chen, C.; Xu, X.; Yan, Y. Estimated global overweight and obesity burden in pregnant women based on panel data model. PLoS ONE 2018, 13, e0202183. [Google Scholar] [CrossRef] [Green Version]
- Myatt, L.; Maloyan, A. Obesity and Placental Function. Semin. Reprod. Med. 2016, 34, 42–49. [Google Scholar] [CrossRef] [Green Version]
- Howell, K.R.; Powell, T.L. Effects of maternal obesity on placental function and fetal development. Reproduction 2017, 153, R97–R108. [Google Scholar] [CrossRef] [Green Version]
- Franzago, M.; Fraticelli, F.; Stuppia, L.; Vitacolonna, E. Nutrigenetics, epigenetics and gestational diabetes: Consequences in mother and child. Epigenetics 2019, 14, 215–235. [Google Scholar] [CrossRef] [Green Version]
- Vaiman, D. Genes, epigenetics and miRNA regulation in the placenta. Placenta 2017, 52, 127–133. [Google Scholar] [CrossRef] [Green Version]
- Morales-Prieto, D.M.; Ospina-Prieto, S.; Chaiwangyen, W.; Schoenleben, M.; Markert, U.R. Pregnancy-associated miRNA-clusters. J. Reprod. Immunol. 2013, 97, 51–61. [Google Scholar] [CrossRef]
- Addo, K.A.; Palakodety, N.; Hartwell, H.J.; Tingare, A.; Fry, R.C. Placental microRNAs: Responders to environmental chemicals and mediators of pathophysiology of the human placenta. Toxicol. Rep. 2020, 7, 1046–1056. [Google Scholar] [CrossRef] [PubMed]
- Poirier, C.; Desgagné, V.; Guérin, R.; Bouchard, L. MicroRNAs in Pregnancy and Gestational Diabetes Mellitus: Emerging Role in Maternal Metabolic Regulation. Curr. Diab. Rep. 2017, 17, 35. [Google Scholar] [CrossRef] [PubMed]
- Guarino, E.; Delli Poggi, C.; Grieco, G.E.; Cenci, V.; Ceccarelli, E.; Crisci, I.; Sebastiani, G.; Dotta, F. Circulating MicroRNAs as Biomarkers of Gestational Diabetes Mellitus: Updates and Perspectives. Int. J. Endocrinol. 2018, 2018, 6380463. [Google Scholar] [CrossRef] [PubMed] [Green Version]
- Moen, G.H.; Sommer, C.; Prasad, R.B.; Sletner, L.; Groop, L.; Qvigstad, E.; Birkeland, K.I. Mechanisms in Endocrinology: Epigenetic modifications and gestational diabetes: A systematic review of published literature. Eur. J. Endocrinol. 2017, 176, R247–R267. [Google Scholar] [CrossRef] [Green Version]
- Parker, V.L.; Gavriil, E.; Marshall, B.; Pacey, A.; Heath, P.R. Profiling microRNAs in uncomplicated pregnancies: Serum vs. plasma. Biomed. Rep. 2021, 14, 24. [Google Scholar] [CrossRef]
- Légaré, C.; Clément, A.A.; Desgagné, V.; Thibeault, K.; White, F.; Guay, S.P.; Arsenault, B.J.; Scott, M.S.; Jacques, P.É.; Perron, P.; et al. Human plasma pregnancy-associated miRNAs and their temporal variation within the first trimester of pregnancy. Reprod. Biol. Endocrinol. 2022, 20, 14. [Google Scholar] [CrossRef]
- Smith, M.D.; Pillman, K.; Jankovic-Karasoulos, T.; McAninch, D.; Wan, Q.; Bogias, K.J.; McCullough, D.; Bianco-Miotto, T.; Breen, J.; Roberts, C.T. Large-scale transcriptome-wide profiling of microRNAs in human placenta and maternal plasma at early to mid gestation. RNA Biol. 2021, 18 (Suppl. 1), 507–520. [Google Scholar] [CrossRef]
- Thibeault, K.; Légaré, C.; Desgagné, V.; White, F.; Clément, A.A.; Scott, M.S.; Jacques, P.É.; Guérin, R.; Perron, P.; Hivert, M.F.; et al. Maternal Body Mass Index Is Associated with Profile Variation in Circulating MicroRNAs at First Trimester of Pregnancy. Biomedicines 2022, 10, 1726. [Google Scholar] [CrossRef]
- Yoffe, L.; Polsky, A.; Gilam, A.; Raff, C.; Mecacci, F.; Ognibene, A.; Crispi, F.; Gratacós, E.; Kanety, H.; Mazaki-Tovi, S.; et al. Early diagnosis of gestational diabetes mellitus using circulating microRNAs. Eur. J. Endocrinol. 2019, 181, 565–577. [Google Scholar] [CrossRef]
- Sørensen, A.E.; van Poppel, M.; Desoye, G.; Simmons, D.; Damm, P.; Jensen, D.M.; Dalgaard, L.T.; The Dali Core Investigator Group. The Temporal Profile of Circulating miRNAs during Gestation in Overweight and Obese Women with or without Gestational Diabetes Mellitus. Biomedicines 2022, 10, 482. [Google Scholar] [CrossRef]
- Institute of Medicine (US); National Research Council (US) Committee to Reexamine IOM Pregnancy Weight Guidelines. Weight Gain during Pregnancy: Reexamining the Guidelines; Rasmussen, K.M., Yaktine, A.L., Eds.; National Academies Press (US): Washington, DC, USA, 2009. [Google Scholar] [CrossRef]
- Metzger, B.E.; Gabbe, S.G.; Persson, B.; Buchanan, T.A.; Catalano, P.A.; Damm, P.; Dyer, A.R.; Leiva, A.D.; Hod, M.; Kitzmiler, J.L.; et al. International Association of Diabetes and Pregnancy Study Groups Consensus Panel. International association of diabetes and pregnancy study groups recommendations on the diagnosis and classification of hyperglycemia in pregnancy. Diabetes. Care 2010, 33, 676–682. [Google Scholar] [CrossRef] [Green Version]
- Hod, M.; Kapur, A.; Sacks, D.A.; Hadar, E.; Agarwal, M.; Di Renzo, G.C.; Cabero Roura, L.; McIntyre, H.D.; Morris, J.L.; Divakar, H. The International Federation of Gynecology and Obstetrics (FIGO) Initiative on gestational diabetes mellitus: A pragmatic guide for diagnosis, management, and care. Int. J. Gyn. Obstet. 2015, 131 (Suppl. 3), S173–S211. [Google Scholar] [CrossRef] [PubMed] [Green Version]
- Andersen, C.L.; Jensen, J.L.; Ørntoft, T.F. Normalization of real-time quantitative reverse transcription-PCR data: A model-based variance estimation approach to identify genes suited for normalization, applied to bladder and colon cancer data sets. Cancer Res. 2004, 64, 5245–5250. [Google Scholar] [CrossRef] [PubMed] [Green Version]
- Mandò, C.; Abati, S.; Anelli, G.M.; Favero, C.; Serati, A.; Dioni, L.; Zambon, M.; Albetti, B.; Bollati, V.; Cetin, I. Epigenetic Profiling in the Saliva of Obese Pregnant Women. Nutrients 2022, 14, 2122. [Google Scholar] [CrossRef] [PubMed]
- Fattuoni, C.; Mandò, C.; Palmas, F.; Anelli, G.M.; Novielli, C.; Parejo Laudicina, E.; Savasi, V.M.; Barberini, L.; Dessì, A.; Pintus, R.; et al. Preliminary metabolomics analysis of placenta in maternal obesity. Placenta 2018, 61, 89–95. [Google Scholar] [CrossRef] [PubMed]
- Rayner, K.J.; Suárez, Y.; Dávalos, A.; Parathath, S.; Fitzgerald, M.L.; Tamehiro, N.; Fisher, E.A.; Moore, K.J.; Fernández-Hernando, C. MiR-33 contributes to the regulation of cholesterol homeostasis. Science 2010, 328, 1570–1573. [Google Scholar] [CrossRef] [Green Version]
- Holeček, M. Branched-chain amino acids in health and disease: Metabolism, alterations in blood plasma, and as supplements. Nutr. Metab. (Lond.) 2018, 15, 33. [Google Scholar] [CrossRef] [PubMed] [Green Version]
- Zhao, L.; Wang, M.; Li, J.; Bi, Y.; Li, M.; Yang, J. Association of Circulating Branched-Chain Amino Acids with Gestational Diabetes Mellitus: A Meta-Analysis. Int. J. Endocrinol. Metab. 2019, 17, e85413. [Google Scholar] [CrossRef] [PubMed] [Green Version]
- Bloomgarden, Z. Diabetes and branched-chain amino acids: What is the link? J. Diabetes 2018, 10, 350–352. [Google Scholar] [CrossRef] [Green Version]
- Allman, B.R.; Spray, B.J.; Mercer, K.E.; Andres, A.; Børsheim, E. Markers of branched-chain amino acid catabolism are not affected by exercise training in pregnant women with obesity. J. Appl. Physiol. (1985) 2021, 130, 651–659. [Google Scholar] [CrossRef]
- Thomas-Valdés, S.; Tostes, M.; Anunciação, P.C.; da Silva, B.P.; Sant’Ana, H. Association between vitamin deficiency and metabolic disorders related to obesity. Crit. Rev. Food Sci. Nutr. 2017, 57, 3332–3343. [Google Scholar] [CrossRef] [PubMed]
- Friso, S.; Udali, S.; De Santis, D.; Choi, S.W. One-carbon metabolism and epigenetics. Mol. Aspects. Med. 2017, 54, 28–36. [Google Scholar] [CrossRef] [PubMed]
- Sakakeeny, L.; Roubenoff, R.; Obin, M.; Fontes, J.D.; Benjamin, E.J.; Bujanover, Y.; Jacques, P.F.; Selhub, J. Plasma pyridoxal-5-phosphate is inversely associated with systemic markers of inflammation in a population of U.S. adults. J. Nutr. 2012, 142, 1280–1285. [Google Scholar] [CrossRef] [Green Version]
- Aasheim, E.T.; Hofsø, D.; Hjelmesaeth, J.; Birkeland, K.I.; Bøhmer, T. Vitamin status in morbidly obese patients: A cross-sectional study. Am. J. Clin. Nutr. 2008, 87, 362–369. [Google Scholar] [CrossRef] [PubMed] [Green Version]
- Nachtigal, M.C.; Patterson, R.E.; Stratton, K.L.; Adams, L.A.; Shattuck, A.L.; White, E. Dietary supplements and weight control in a middle-age population. J. Altern. Complement. Med. 2005, 11, 909–915. [Google Scholar] [CrossRef]
- Salam, R.A.; Zuberi, N.F.; Bhutta, Z.A. Pyridoxine (vitamin B6) supplementation during pregnancy or labour for maternal and neonatal outcomes. Cochrane Database Syst. Rev. 2015, 6, CD000179. [Google Scholar] [CrossRef]
- Zhang, Q.X.; Na, Q.; Song, W. Altered expression of mTOR and autophagy in term normal human placentas. Rom. J. Morphol. Embryol. 2017, 58, 517–526. [Google Scholar]
- Ji, L.; Chen, Z.; Xu, Y.; Xiong, G.; Liu, R.; Wu, C.; Hu, H.; Wang, L. Systematic Characterization of Autophagy in Gestational Diabetes Mellitus. Endocrinology 2017, 158, 2522–2532. [Google Scholar] [CrossRef]
- Serati, A. Placental autophagy in maternal obesity and gestational diabetes mellitus. Biochim. Clin. 2022, 46, S122–S128. [Google Scholar] [CrossRef]
- Kelly, A.C.; Powell, T.L.; Jansson, T. Placental function in maternal obesity. Clin. Sci. (Lond.) 2020, 134, 961–984. [Google Scholar] [CrossRef] [Green Version]
- Tsai, K.; Tullis, B.; Jensen, T.; Graff, T.; Reynolds, P.; Arroyo, J. Differential expression of mTOR related molecules in the placenta from gestational diabetes mellitus (GDM), intrauterine growth restriction (IUGR) and preeclampsia patients. Reprod. Biol. 2021, 21, 100503. [Google Scholar] [CrossRef]
- Chen, C.; Liu, Y.; Liu, Y.; Zheng, P. The axis of mTOR-mitochondria-ROS and stemness of the hematopoietic stem cells. Cell Cycle 2009, 8, 1158–1160. [Google Scholar] [CrossRef] [Green Version]
- Wullschleger, S.; Loewith, R.; Hall, M.N. TOR signaling in growth and metabolism. Cell 2006, 124, 471–484. [Google Scholar] [CrossRef] [Green Version]
- Kumagai, A.; Itakura, A.; Koya, D.; Kanasaki, K. AMP-Activated Protein (AMPK) in Pathophysiology of Pregnancy Complications. Int. J. Mol. Sci. 2018, 19, 3076. [Google Scholar] [CrossRef] [PubMed] [Green Version]
- Gowans, G.J.; Hardie, D.G. AMPK: A cellular energy sensor primarily regulated by AMP. Biochem. Soc. Trans. 2014, 42, 71–75. [Google Scholar] [CrossRef] [PubMed] [Green Version]
- Gongol, B.; Sari, I.; Bryant, T.; Rosete, G.; Marin, T. AMPK: An Epigenetic Landscape Modulator. Int. J. Mol. Sci. 2018, 19, 3238. [Google Scholar] [CrossRef] [PubMed] [Green Version]
- Nguyen-Ngo, C.; Jayabalan, N.; Salomon, C.; Lappas, M. Molecular pathways disrupted by gestational diabetes mellitus. J. Mol. Endocrinol. 2019, 63, R51–R72. [Google Scholar] [CrossRef] [PubMed] [Green Version]
- Simino, L.A.P.; Panzarin, C.; Fontana, M.F.; de Fante, T.; Geraldo, M.V.; Ignácio-Souza, L.M.; Milanski, M.; Torsoni, M.A.; Ross, M.G.; Desai, M.; et al. MicroRNA Let-7 targets AMPK and impairs hepatic lipid metabolism in offspring of maternal obese pregnancies. Sci. Rep. 2021, 11, 8980. [Google Scholar] [CrossRef] [PubMed]
- Yadav, H.; Devalaraja, S.; Chung, S.T.; Rane, S.G. TGF-β1/Smad3 Pathway Targets PP2A-AMPK-FoxO1 Signaling to Regulate Hepatic Gluconeogenesis. J. Biol. Chem. 2017, 292, 3420–3432. [Google Scholar] [CrossRef] [PubMed] [Green Version]
- Zhu, Y.; Tian, F.; Li, H.; Zhou, Y.; Lu, J.; Ge, Q. Profiling maternal plasma microRNA expression in early pregnancy to predict gestational diabetes mellitus. Int. J. Gynaecol. Obstet. 2015, 130, 49–53. [Google Scholar] [CrossRef]
- Martins, R.; Lithgow, G.J.; Link, W. Long live FOXO: Unraveling the role of FOXO proteins in aging and longevity. Aging Cell 2016, 15, 196–207. [Google Scholar] [CrossRef] [PubMed]
- Saben, J.; Lindsey, F.; Zhong, Y.; Thakali, K.; Badger, T.M.; Andres, A.; Gomez-Acevedo, H.; Shankar, K. Maternal obesity is associated with a lipotoxic placental environment. Placenta 2014, 35, 171–177. [Google Scholar] [CrossRef] [PubMed] [Green Version]
- Vallerie, S.N.; Hotamisligil, G.S. The role of JNK proteins in metabolism. Sci. Transl. Med. 2010, 2, 60rv5. [Google Scholar] [CrossRef] [PubMed]
- Macklin, P.S.; McAuliffe, J.; Pugh, C.W.; Yamamoto, A. Hypoxia and HIF pathway in cancer and the placenta. Placenta 2017, 56, 8–13. [Google Scholar] [CrossRef]
- Nakashima, A.; Tsuda, S.; Kusabiraki, T.; Aoki, A.; Ushijima, A.; Shima, T.; Cheng, S.B.; Sharma, S.; Saito, S. Current Understanding of Autophagy in Pregnancy. Int. J. Mol. Sci. 2019, 20, 2342. [Google Scholar] [CrossRef] [Green Version]
- Catrina, S.B.; Okamoto, K.; Pereira, T.; Brismar, K.; Poellinger, L. Hyperglycemia regulates hypoxia-inducible factor-1alpha protein stability and function. Diabete 2004, 53, 3226–3232. [Google Scholar] [CrossRef] [Green Version]
- Baryla, I.; Pluciennik, E.; Kośla, K.; Wojcik, M.; Zieleniak, A.; Zurawska-Klis, M.; Cypryk, K.; Wozniak, L.A.; Bednarek, A.K. Identification of a novel association for the WWOX/HIF1A axis with gestational diabetes mellitus (GDM). PeerJ 2021, 9, e10604. [Google Scholar] [CrossRef]
- Li, T.; Mao, C.; Wang, X.; Shi, Y.; Tao, Y. Epigenetic crosstalk between hypoxia and tumor driven by HIF regulation. J. Exp. Clin. Cancer Res. 2020, 39, 224. [Google Scholar] [CrossRef]
- Anton, L.; DeVine, A.; Polyak, E.; Olarerin-George, A.; Brown, A.G.; Falk, M.J.; Elovitz, M.A. HIF-1α Stabilization Increases miR-210 Eliciting First Trimester Extravillous Trophoblast Mitochondrial Dysfunction. Front. Physiol. 2019, 10, 699. [Google Scholar] [CrossRef] [Green Version]
- Colomiere, M.; Permezel, M.; Lappas, M. Diabetes and obesity during pregnancy alter insulin signalling and glucose transporter expression in maternal skeletal muscle and subcutaneous adipose tissue. J. Mol. Endocrinol. 2010, 44, 213–223. [Google Scholar] [CrossRef]
- Colomiere, M.; Permezel, M.; Riley, C.; Desoye, G.; Lappas, M. Defective insulin signaling in placenta from pregnancies complicated by gestational diabetes mellitus. Eur. J. Endocrinol. 2009, 160, 567–578. [Google Scholar] [CrossRef] [PubMed] [Green Version]
- Salilew-Wondim, D.; Gebremedhn, S.; Hoelker, M.; Tholen, E.; Hailay, T.; Tesfaye, D. The Role of MicroRNAs in Mammalian Fertility: From Gametogenesis to Embryo Implantation. Int. J. Mol. Sci. 2020, 21, 585. [Google Scholar] [CrossRef] [PubMed] [Green Version]
- Czukiewska, S.M.; Chuva de Sousa Lopes, S.M. Fetal germ cell development in humans, a link with infertility. Semin. Cell Dev. Biol. 2022, 131, 58–65. [Google Scholar] [CrossRef]
- Skinner, M.K. Endocrine disruptors in 2015: Epigenetic transgenerational inheritance. Nat. Rev. Endocrinol. 2016, 12, 68–70. [Google Scholar] [CrossRef] [PubMed] [Green Version]
- Kim, S.Y.; England, L.; Wilson, H.G.; Bish, C.; Satten, G.A.; Dietz, P. Percentage of gestational diabetes mellitus attributable to overweight and obesity. Am. J. Public. Health 2010, 100, 1047–1052. [Google Scholar] [CrossRef]


| NW (n = 7) | OB/GDM(−) (n = 6) | OB/GDM(+) (n = 6) | |
|---|---|---|---|
| Age 1 [years] | 32.29 ± 3.64 | 33.33 ± 6.83 | 33.33 ± 5.01 |
| Pre-pregnancy BMI 2 [Kg/m2] | 21.57 ± 2.37 | 32.55 ± 2.23 * | 34.63 ± 2.87 ** |
| OGTT time 0 1 [mg/dL] | 83.25 ± 1.26 | 84.60 ± 6.23 | 86.20 ± 15.32 |
| OGTT time 60min 1 [mg/dL] | 128.00 ± 31.86 | 125.40 ± 36.31 | 158.60 ± 33.45 |
| OGTT time 120min 1 [mg/dL] | 127.74 ± 51.50 | 109.40 ± 30.18 | 162.60 ± 30.74 |
| GWG 1 [Kg] | 10.86 ± 2.48 | 8.08 ± 3.96 | 5.60 ± 7.30 |
| Gestational age 2 [weeks] | 39.20 ± 0.24 | 39.00 ± 0.42 | 39.08 ± 0.17 |
| Foetal weight 1 [g] | 3345.71 ± 135.54 | 3415.00 ± 386.51 | 3475.83 ± 358.70 |
| Foetal weight centile 1 | 51.00 ± 17.59 | 53.17 ± 28.97 | 61.17 ± 24.72 |
| Foetal sex [%] | F: 43; M: 57 | F: 17; M: 83 | F: 50; M: 50 |
| (A) OB/GDM(−) vs. NW | ||
|---|---|---|
| miRNA ID | Fold Regulation | p-Value |
| hsa-miR-27a-3p | 2.13 | 0.0016 |
| hsa-miR-324-5p | 2.29 | 0.0018 |
| hsa-miR-33a-5p | 3.38 | 0.0042 |
| hsa-miR-186-5p | −2.26 | 0.0155 |
| (B) OB/GDM(+) vs. NW | ||
| miRNA ID | Fold Regulation | p-value |
| hsa-miR-454-3p | −2.32 | 0.0216 |
| (C) OB/GDM(+) vs. OB/GDM(−) | ||
| miRNA ID | Fold Regulation | p-value |
| hsa-miR-186-5p | 2.13 | 0.0065 |
| hsa-miR-320d | 2.18 | 0.0148 |
| hsa-miR-2110 | 2.04 | 0.0196 |
| hsa-let-7b-5p | 2.09 | 0.0260 |
| hsa-miR-574-3p | 2.45 | 0.0266 |
| hsa-miR-320c | 2.26 | 0.0377 |
| hsa-miR-324-5p | −2.75 | 0.0023 |
| hsa-miR-142-3p | −3.03 | 0.0115 |
| hsa-miR-33a-5p | −4.09 | 0.0144 |
| hsa-miR-21-5p | −12.16 | 0.0162 |
| hsa-miR-27a-3p | −2.02 | 0.0186 |
| hsa-let-7f-5p | −3.45 | 0.0294 |
| hsa-miR-30e-3p | −4.57 | 0.0403 |
| hsa-miR-339-5p | −2.46 | 0.0467 |
| (A) OB/GDM(−) vs. NW | |||
|---|---|---|---|
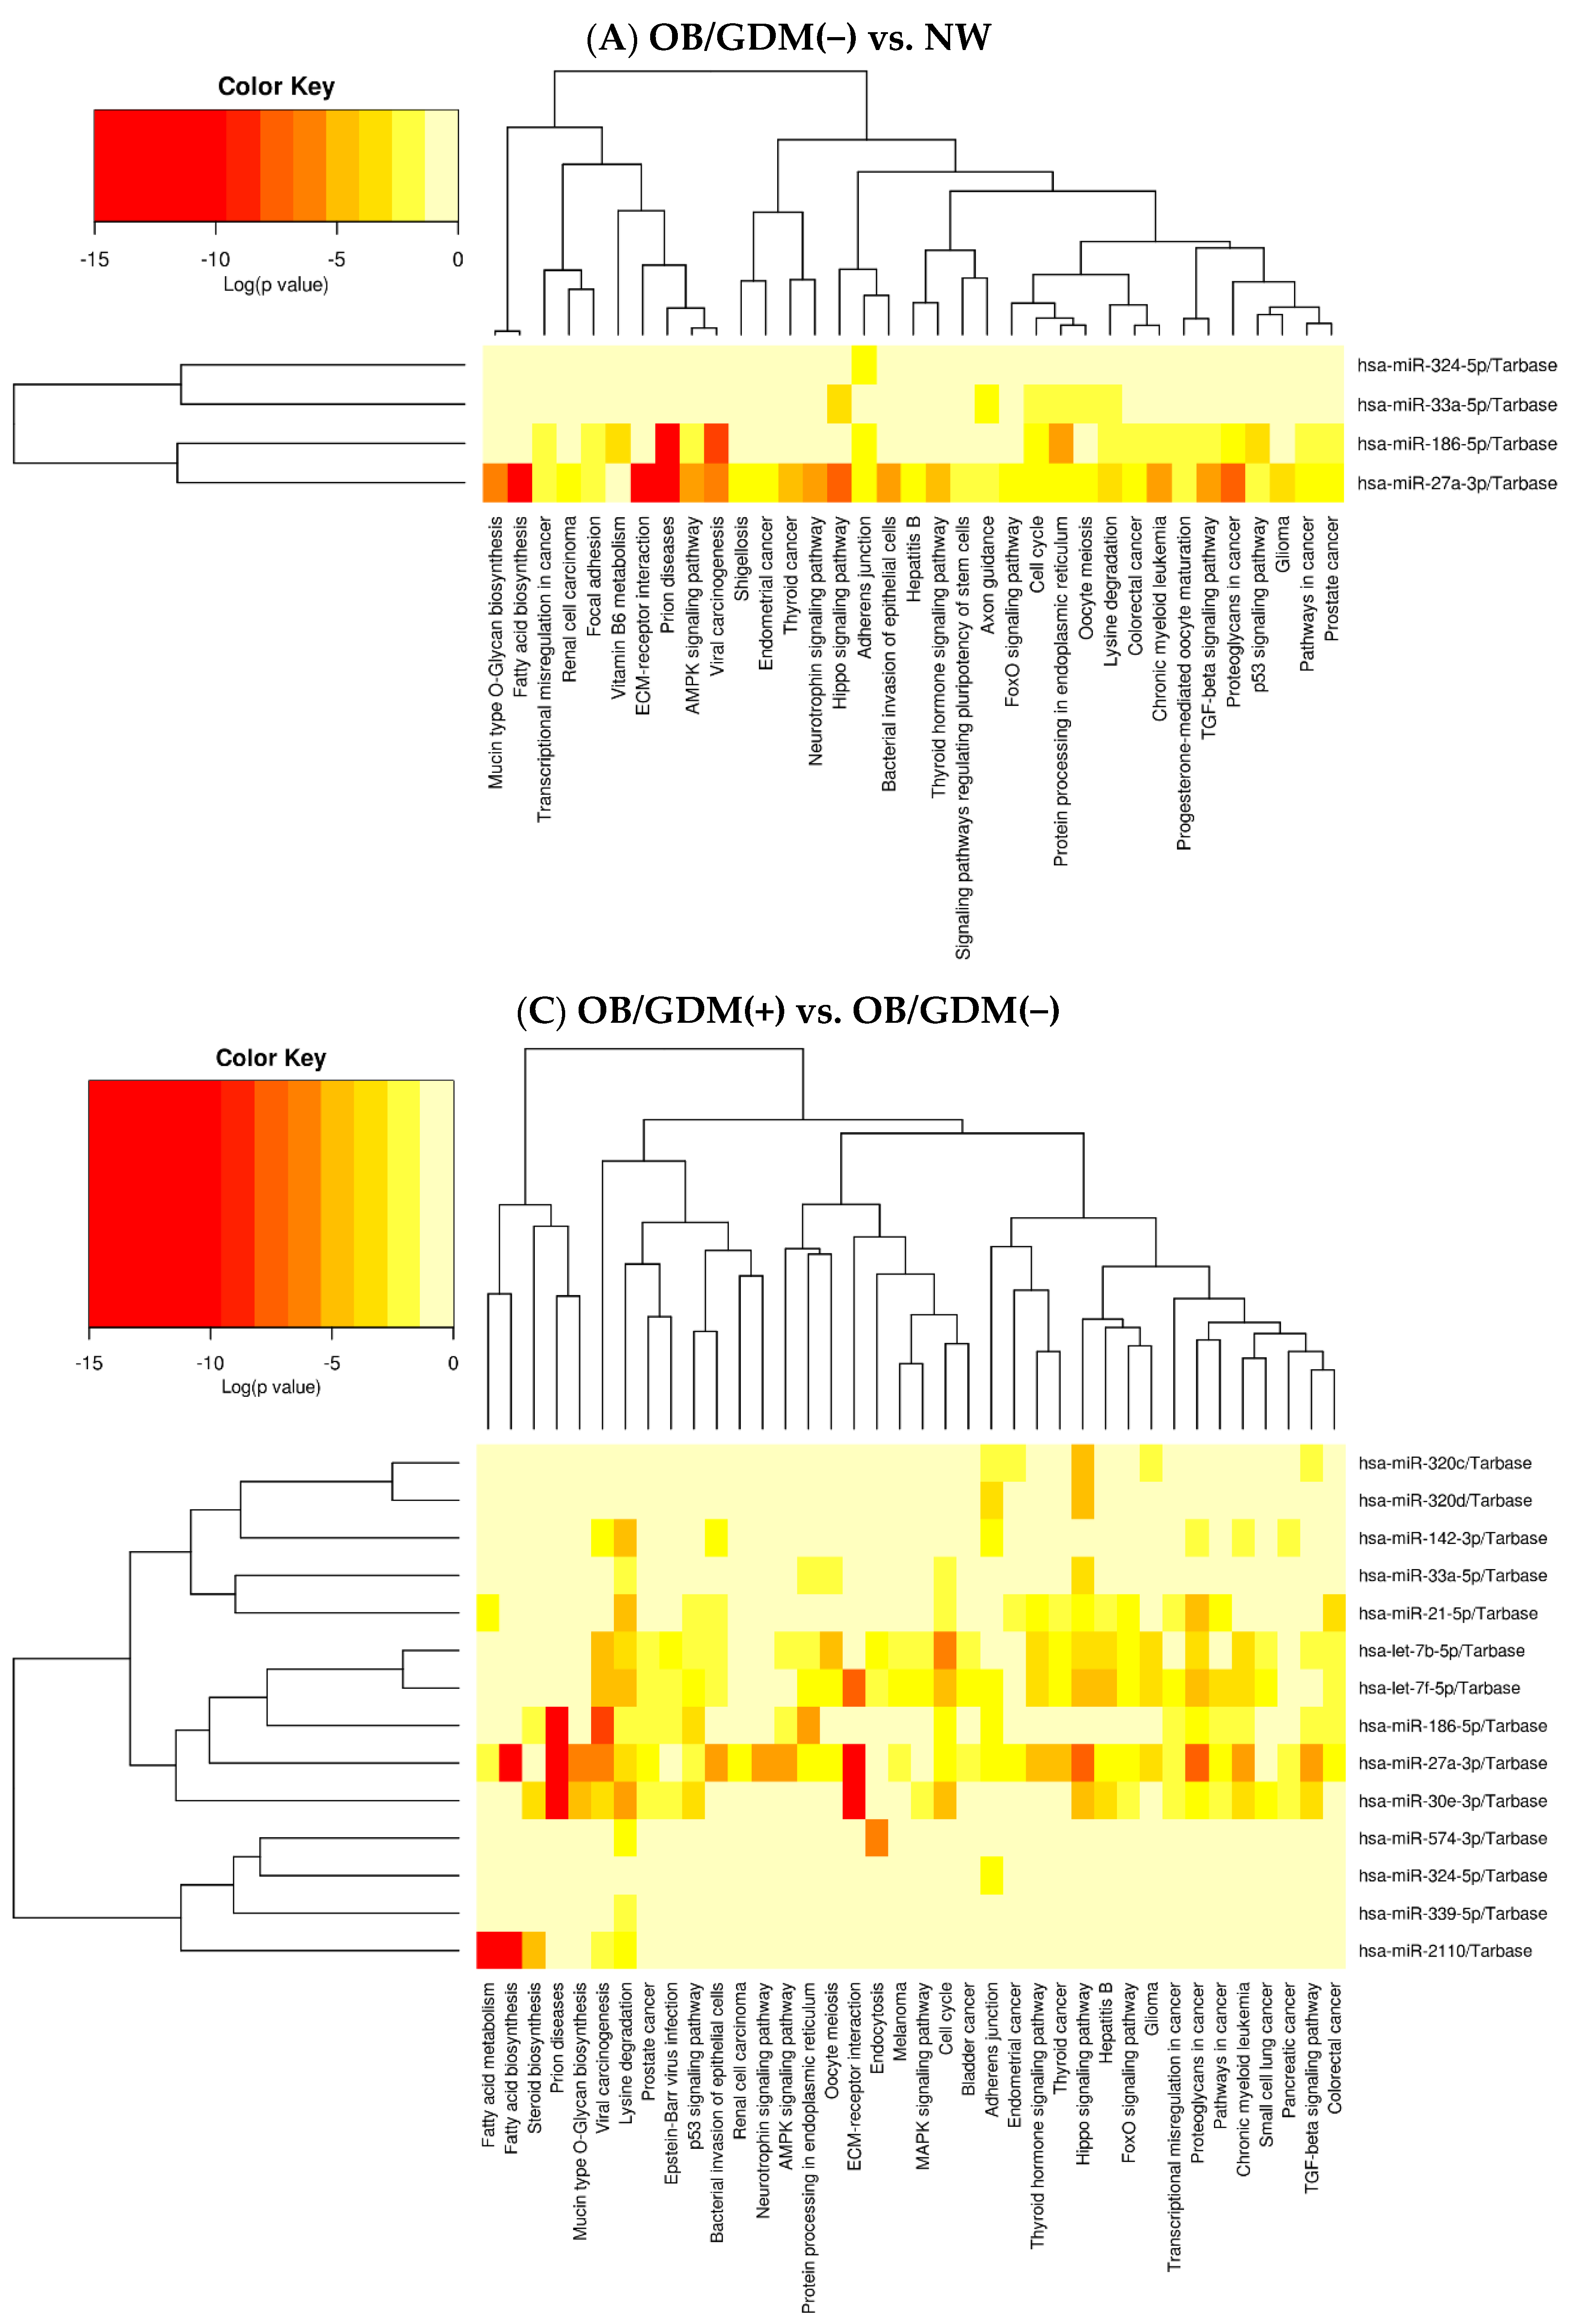
| Pathway Name | Pathway Information | p-Value | miRNAs |
| Fatty acid biosynthesis | Creation of fatty acids from acetyl-CoA and NADPH through fatty acid synthases. | 3.2455 × e−12 | hsa-miR-27a-3p |
| ECM (ExtraCellular Matrix)-receptor interaction | Complex mixture of structural and functional macromolecules with important roles in cell, tissue and organ morphogenesis, structure, and function. | 1.6770 × e−8 | hsa-miR-27a-3p |
| AMPK (AMP-activated Protein Kinase) signalling pathway | Sensor of cellular energy status. | 3.5242 × e−5 | hsa-miR-27a-3p hsa-miR-186-5p |
| TGF-beta (Transforming Growth Factor-beta) signalling pathway | Regulation of cellular functions such as proliferation, apoptosis, differentiation, and migration | 3.7782 × e−5 | hsa-miR-27a-3p hsa-miR-186-5p |
| Lysine degradation | Amino acid breakdown mainly taking place in hepatocytes’ mitochondria. | 6.9088 × e−5 | hsa-miR-27a-3p hsa-miR-33a-5p hsa-miR-186-5p |
| Oocyte meiosis | Maturation of female gametes. | 0.000417 | hsa-miR-27a-3p hsa-miR-33a-5p |
| Thyroid hormone signalling pathway | Thyroid hormones triiodothyronine (T3) and thyroxine (T4) are important regulators of growth, development, and metabolism. | 0.0016 | hsa-miR-27a-3p |
| FoxO (Forkhead box O) signalling pathway | Transcription factors regulating apoptosis, cell-cycle control, glucose metabolism, oxidative stress resistance, and longevity. | 0.003443 | hsa-miR-27a-3p |
| Signalling pathways regulating pluripotency of stem cells | Pluripotent stem cells (PSCs) are self-renewal cells with the potential to generate all cell types of the three germinal layers. | 0.030599 | hsa-miR-27a-3p |
| Progesterone-mediated oocyte maturation | Insulin/IGF-1 or progesterone exposure induces maturation of the oocyte into a mature, fertilizable egg. | 0.037975 | hsa-miR-27a-3p hsa-miR-186-5p |
| Vitamin B6 metabolism | Coenzyme in amino acid, glucose, and lipid metabolism. | 0.040007 | hsa-miR-186-5p |
| (B) OB/GDM(+) vs. NW | |||
| Pathway name | Pathway information | p-value | miRNAs |
| Fatty acid elongation | Part of the anabolic processes generating and modifying fatty acids. | 1.3166 × e−11 | hsa-miR-454-3p |
| Fatty acid degradation | Fatty acids breakdown into their metabolites, and finally acetyl-CoA. | 1.3726 × e−7 | hsa-miR-454-3p |
| Lysine degradation | Amino acid breakdown mainly taking place in hepatocytes’ mitochondria. | 8.4918 × e−5 | hsa-miR-454-3p |
| Fatty acid metabolism | Catabolic and anabolic processes involving fatty acids. | 8.4918 × e−5 | hsa-miR-454-3p |
| Signalling pathways regulating pluripotency of stem cells | Pluripotent stem cells (PSCs) are self-renewal cells with the potential to generate all cell types of the three germinal layers. | 0.009942 | hsa-miR-454-3p |
| TGF-beta (Transforming Growth Factor-beta) signalling pathway | Regulation of cellular functions such as proliferation, apoptosis, differentiation, and migration | 0.010679 | hsa-miR-454-3p |
| FoxO (Forkhead box O) signalling pathway | Transcription factors regulating apoptosis, cell-cycle control, glucose metabolism, oxidative stress resistance, and longevity. | 0.037202 | hsa-miR-454-3p |
| Valine, leucine and isoleucine (BCAA) degradation | Breakdown of the branched-chain amino acids (BCAA). | 0.038549 | hsa-miR-454-3p |
| HIF-1 (Hypoxia-inducible factor 1) signalling pathway | Transcription factor, master regulator of oxygen homeostasis. Involvement in autophagy, inflammation, and oxidative stress. | 0.043120 | hsa-miR-454-3p |
| Valine, leucine and isoleucine biosynthesis | Enzymatic process generating branched-chain amino acids (BCAA). | 0.049787 | hsa-miR-454-3p |
| (C) OB/GDM(+) vs. OB/GDM(−) | |||
| Pathway name | Pathway information | p-value | miRNAs |
| Fatty acid biosynthesis | Creation of fatty acids from acetyl-CoA and NADPH through fatty acid synthases. | <1 × e−325 | hsa-miR-2110 hsa-miR-27a-3p |
| ECM (ExtraCellular Matrix)-receptor interaction | Complex mixture of structural and functional macromolecules with important roles in cell, tissue, and organ morphogenesis, structure, and function. | <1 × e−325 | hsa-miR-27a-3p hsa-let-7f-5p hsa-miR-30e-3p |
| Lysine degradation | Amino acid breakdown mainly taking place in hepatocytes’ mitochondria. | <1 × e−325 | hsa-miR-186-5p hsa-miR-2110 hsa-let-7b-5p hsa-miR-574-3p hsa-miR-142-3p hsa-miR-33a-5p hsa-miR-21-5p hsa-miR-27a-3p hsa-let-7f-5p hsa-miR-30e-3p hsa-miR-339-5p |
| TGF-beta (Transforming Growth Factor-beta) signalling pathway | Regulation of cellular functions such as proliferation, apoptosis, differentiation, and migration. | 9.0845 × e−8 | hsa-miR-186-5p hsa-let-7b-5p hsa-miR-320c hsa-miR-27a-3p hsa-miR-30e-3p |
| FoxO (Forkhead box O) signalling pathway | Transcription factors regulating apoptosis, cell-cycle control, glucose metabolism, oxidative stress resistance, and longevity. | 3.6540 × e−6 | hsa-let-7b-5p hsa-miR-21-5p hsa-miR-27a-3p hsa-let-7f-5p hsa-miR-30e-3p |
| Thyroid hormone signalling pathway | Thyroid hormones triiodothyronine (T3) and thyroxine (T4) are important regulators of growth, development, and metabolism. | 3.9364 × e−6 | hsa-let-7b-5p hsa-miR-21-5p hsa-miR-27a-3p hsa-let-7f-5p |
| Fatty acid metabolism | Catabolic and anabolic processes involving fatty acids. | 1.9484 × e−5 | hsa-miR-2110 hsa-miR-21-5p hsa-miR-27a-3p |
| Oocyte meiosis | Maturation of female gametes. | 7.3982 × e−5 | hsa-let-7b-5p hsa-miR-33a-5p hsa-miR-27a-3p hsa-let-7f-5p |
| AMPK (AMP-activated Protein Kinase) signalling pathway | Sensor of cellular energy status. | 0.004058 | hsa-miR-186-5p hsa-let-7b-5p hsa-miR-27a-3p |
Disclaimer/Publisher’s Note: The statements, opinions and data contained in all publications are solely those of the individual author(s) and contributor(s) and not of MDPI and/or the editor(s). MDPI and/or the editor(s) disclaim responsibility for any injury to people or property resulting from any ideas, methods, instructions or products referred to in the content. |
© 2023 by the authors. Licensee MDPI, Basel, Switzerland. This article is an open access article distributed under the terms and conditions of the Creative Commons Attribution (CC BY) license (https://creativecommons.org/licenses/by/4.0/).
Share and Cite
Serati, A.; Novielli, C.; Anelli, G.M.; Mandalari, M.; Parisi, F.; Cetin, I.; Paleari, R.; Mandò, C. Characterization of Maternal Circulating MicroRNAs in Obese Pregnancies and Gestational Diabetes Mellitus. Antioxidants 2023, 12, 515. https://doi.org/10.3390/antiox12020515
Serati A, Novielli C, Anelli GM, Mandalari M, Parisi F, Cetin I, Paleari R, Mandò C. Characterization of Maternal Circulating MicroRNAs in Obese Pregnancies and Gestational Diabetes Mellitus. Antioxidants. 2023; 12(2):515. https://doi.org/10.3390/antiox12020515
Chicago/Turabian StyleSerati, Anaïs, Chiara Novielli, Gaia Maria Anelli, Maria Mandalari, Francesca Parisi, Irene Cetin, Renata Paleari, and Chiara Mandò. 2023. "Characterization of Maternal Circulating MicroRNAs in Obese Pregnancies and Gestational Diabetes Mellitus" Antioxidants 12, no. 2: 515. https://doi.org/10.3390/antiox12020515